Abstract
The anterior-posterior (AP) axis in chordates is regulated by a conserved set of genes and signaling pathways, including Hox genes and retinoic acid (RA), which play well-characterized roles in the organization of the chordate body plan. The intermediate mesoderm (IM), which gives rise to all vertebrate kidneys, is an example of a tissue that differentiates sequentially along this axis. Yet, the conservation of the spatiotemporal regulation of the IM across vertebrates remains poorly understood. In this study, we used a comparative developmental approach focusing on non-conventional model organisms, a chondrichthyan (catshark), a cyclostome (lamprey), and a cephalochordate (amphioxus), to assess the involvement of RA in the regulation of chordate and vertebrate pronephros formation. We report that the anterior expression boundary of early pronephric markers (Pax2 and Lim1), positioned at the level of somite 6 in amniotes, is conserved in the catshark and the lamprey. Furthermore, RA, driving the expression of Hox4 genes like in amniotes, regulates the anterior pronephros boundary in the catshark. We find no evidence for the involvement of this regulatory hierarchy in the AP positioning of the lamprey pronephros and the amphioxus pronephros homolog, Hatschek’s nephridium. This suggests that despite the conservation of Pax2 and Lim1 expressions in chordate pronephros homologs, the responsiveness of the IM, and hence of pronephric genes, to RA- and Hox-dependent regulation is a gnathostome novelty.
Keywords:
evolution of development; pronephros; kidney; amphioxus; lamprey; catshark; retinoic acid; Hox genes 1. Introduction
Deciphering the evolution of developmental gene regulatory networks is a powerful approach to understand the origin of body plans across metazoans. Early patterning of the chordate anterior-posterior (AP) body axis is orchestrated by the spatio-temporal regulation of a common set of genes and signaling pathways in early development, although extreme variation in adult morphology can be observed. Several gene families and morphogens are involved in this AP patterning process, including Hox genes and retinoic acid (RA), respectively [1,2,3]. However, the conservation of the tissue-specific deployments of Hox genes and RA during organogenesis remain elusive.
The development of the vertebrate kidney provides an excellent model system to address this issue due to its unique mode of development. In vertebrates, the kidney derives from the intermediate mesoderm (IM), a longitudinal stripe of tissue, which morphologically differentiates between the somites and the lateral plate mesoderm at a specific AP location [4]. As development proceeds, the IM successively differentiates from anterior to posterior into several types of kidney tissue, with the pronephros developing first and being essential for the subsequent formation of the mesonephros and the metanephros [5,6]. In chick embryos, the prospective IM is committed to kidney fate while still in the primitive streak (PS), but it requires extrinsic signals to become specified [7]. By stage HH8 [8], IM cells are located in their final position and start to express both Pax2 and Lim1. The expression territory of these two genes is restricted to the IM, with a sharp anterior boundary at the level of mid-somite 6 [9,10,11,12]. This position is consistent with the localization, along the AP axis, of tissues that give rise to the pronephric duct primordium [13] as well as with the expression of Hox genes of orthologous group 4 [14].
Knowledge regarding the signals controlling IM specification is still incomplete. Several studies have demonstrated the role of neighboring tissues in IM specification, mainly with respect to the mediolateral axis [7,12,15,16,17,18]. Considerable evidence from studies in zebrafish, frogs, mice, and avian embryos has shown a role for BMP, Activin, and RA signaling in the early events of mesoderm and pronephros induction [16,18,19,20,21,22,23,24,25,26,27,28,29]. It has thus been shown that the specification of the chick IM along the entire AP axis depends on the competence of cells to respond to kidney inductive signals emanating from midline tissues [7]. A model was developed according to which Activin secreted from the dorsal neural tube and BMP4 secreted from lateral plate mesoderm [18,20] function as the inductive source of early kidney genes, with the competence of IM cells to respond to these signals being driven by RA and mediated by Hoxb4 [28].
The conservation of the Hox4-mediated role of RA across vertebrates is currently unknown as well as its origin in chordates. To address this problem, we have used a comparative approach aimed at reconstructing major events in the evolution of early kidney development in vertebrates and have focused on three species occupying key phylogenetic positions in chordates: the catshark Scyliorhinus canicula, the lamprey Lampetra fluviatilis, and the amphioxus Branchiostoma lanceolatum. In the catshark, a chondrichthyan, the initiation and patterning of the IM and the formation of the pronephros are largely unknown. However, due to the phylogenetic position of chondrichthyans as the sister group to all other gnathostomes (or jawed vertebrates), understanding the molecular mechanisms that govern the formation of the IM and the pronephros in this taxon is of particular importance. Studying the catshark thus holds the promise of obtaining valuable information regarding the evolution of nephric system development in jawed vertebrates. The lamprey represents the cyclostomes (or jawless fish), a group exhibiting unique features among vertebrates, as they lack jaws and paired appendages. As the sister group to all other vertebrates, they are a crucial taxon for reconstructing the evolutionary events leading to the elaboration of the nephric system in vertebrates [30]. The mechanisms controlling the early specification and patterning of the IM remain unknown in these species. The amphioxus is a member of the cephalochordates, a group of non-vertebrate chordates that exhibits basal chordate traits [31]. Amphioxus, thus, provides an outgroup essential to gain insights into the evolutionary origin of the vertebrate kidney. Previous examinations of the development of the nephric system in amphioxus have revealed that homologs of the vertebrate pronephric markers Pax2 and Lim1 are expressed in Hatschek’s nephridium [32,33], an excretory, kidney-like structure derived from the 1st left somite [34]. This position along the AP axis contrasts with that of the amniote pronephros, which develops posterior to the level of mid-somite 6.
Our comparative approach reveals an unexpected evolutionary transition in the molecular control of the early specification of the nephric system. While IM specification takes place at strictly the same level along the AP axis of all vertebrates studied, the role of RA in this process appears conserved in the catshark, but not in the lamprey. These data suggest that the role of RA in IM specification is a gnathostome innovation.
2. Materials and Methods
2.1. Embryos
Catsharks (Scyliorhinus canicula) were collected off the coast of Banyuls-sur-Mer (France) and kept at the marine station of Banyuls-sur-Mer (France) at 17 °C in oxygenated seawater. Embryos were staged according to Ballard et al. (1993) [35]. Lamprey (Lampetra fluviatilis) embryos were obtained and reared at the marine station of Banyuls-sur-Mer (France) as described by Sauka-Spengler et al. (2002) [36] and staged according to tables established for another closely related lamprey species, L. reissneri, in Tahara (1988) [37]. The spawning of ripe amphioxus (Branchiostoma lanceolatum) adults, collected in Argelès-sur-Mer (France), was induced following the protocols described in Fuentes et al. (2004) [38]. Amphioxus embryos were kept as described by Holland et al. (2004) [39] at the marine station of Villefranche-sur-Mer (France) at 19 °C and staged according to Carvalho et al. (2021) [40].
2.2. Pharmacological Treatments
Retinoic acid (RA) (Sigma Aldrich, Saint Quentin, France) and BMS493 (Sigma Aldrich, Saint Quentin, France), an inverse agonist of retinoic acid receptors (RARs), were dissolved in dimethyl sulfoxide (DMSO) (Sigma Aldrich, Saint Quentin, France) to obtain 10 mM stock solutions, which were further diluted in 1× PBS to a final concentration of 25 µM (the optimal concentration was based on experimental test series using different treatment concentrations). Then, 100 µL of this solution containing either RA or BMS493 was injected into S. canicula egg cases at stages 14–15. A solution of 100 µL of 1:1000 DMSO/PBS was injected as a control. Embryos were kept in oxygenated seawater at 17 °C for six days until they reached stage 19. Embryos of L. fluviatilis were treated at stages 17–18 in culture dishes containing a final concentration of 0.2 µM RA or BMS493 (the optimal concentration based on experimental test series using different treatment concentrations). Control treatments were carried out with a 1:1000 dilution of DMSO/PBS. After three days, the treatments were renewed with fresh solutions of the respective treatment. Embryos were maintained at 18 °C until reaching stage 24. B. lanceolatum embryos were treated at the G3 stage as described in Zieger et al. (2018) [41] and fixed at different stages thereafter. Embryos of B. lanceolatum were fixed in 4% paraformaldehyde/MOPS (4 °C, overnight), rinsed, and subsequently transferred to 100% ethanol [42]. Embryos of L. fluviatilis and S. canicula were fixed in 4% paraformaldehyde/PBS (4 °C, overnight), rinsed in 1× PBS, and transferred to 100% methanol.
2.3. Whole Mount In Situ Hybridization
Coding sequences were cloned and digoxigenin-labelled antisense RNA probes were synthesized as described in Sauka-Spengler et al. (2002) [36]. The GenBank accession numbers of the genes used are as follows: S. canicula Pax2, EF185884 [43], S. canicula Lim1, AY217780 [44], S. canicula HoxA4, FQ032658 [45], S. canicula HoxB4, FQ032659 [45], S. canicula HoxD4, FQ032660 [45], P. marinus Pax2, XM032949697 [46], L. fluviatilis Lim1, DQ002012 [47], B. lanceolatum Pax2/5/8, MF536418 [48], B. flodridae Lim1/5 DQ399521 [33], and P. marinus Podocin, XM032962419. Whole mount in situ hybridization (WMISH) of S. canicula, L. fluviatilis, and B. lanceolatum embryos were conducted using the standard protocols with modifications from Sauka-Spengler et al. (2002) [36], Takio et al. (2007) [49], and Yu and Holland (2009) [42], respectively. S. canicula and L. fluviatilis embryos were photographed with a Leica MZFL3 stereo microscope equipped with an Olympus DP72 camera. Imaging of B. lanceolatum embryos was carried out on a Zeiss Axiophot microscope using an Axiocam ERc5s camera.
2.4. Histology
Following WMISH and whole-mount imaging, embryos of S. canicula and L. fluviatilis were washed in 5% sucrose in PBS and 20% sucrose in PBS (one hour at room temperature each) and subsequently incubated in 15% sucrose/7% gelatin (Sigma Aldrich, Jerusalem, Israel) in PBS, overnight in a 38 °C water bath. The following day, the embryos were embedded in the same solution on ice, oriented by trimming, and frozen in dry ice-cooled 2-methylbutane (Sigma Aldrich, Jerusalem, Israel). The frozen gelatin blocks were mounted on holders using the OCT compound (VWR) and sectioned with a Leica CM1950 cryostat. Sections were placed on microscope slides and covered with cover glasses using Hydromount (VWR). B. lanceolatum embryos were counterstained in Ponceau S (Sigma Aldrich, Saint Quentin, France) before being embedded in resin, using the Spurr low viscosity embedding kit (Sigma Aldrich, Saint Quentin, France). Sectioning was carried out with a Reichert OmU3 ultramicrotome. For S. canicula, L. fluviatilis, and B. lanceolatum sections, photos were taken on a Nikon Ti2-E fluorescent microscope using a Nikon DS-Fi3 color camera, operated by the NIS-Elements software AR 5.21.03.
3. Results
3.1. Expression of Nephric Markers in Catsharks
To determine the territory and timing of IM specification in the catshark, we first analyzed the expression patterns of the two main early nephric transcription factors, Pax2 and Lim1 (also called Lhx1), in relation to the expression patterns of three Hox genes of orthologous group 4, whose expression has previously been shown to be associated with pronephric development in chick embryos [14]. Weak expression of both genes was first detectable at late stage 17/early stage 18, and, as shown in Figure 1, at stages 20 and 19, Pax2 (Figure 1A–C) and Lim1 (Figure 1D–F), respectively, showed longitudinal expression territories along the AP axis, with an anterior limit at the level of mid-somite 6 (dashed line) that was aligned with the pectoral girdle. The expression of Pax2 and Lim1 in mid-somite 6 created a sharp anterior boundary, which resembled the one previously observed in chick embryos [7,12].
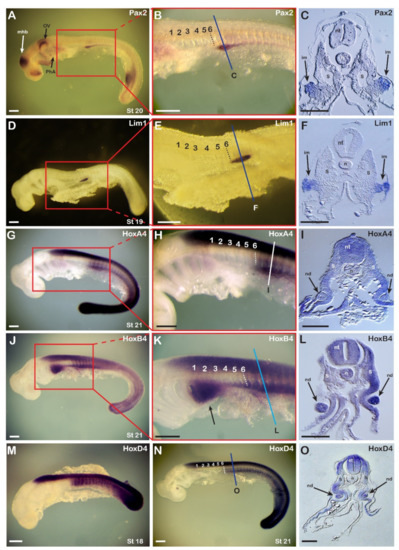
Figure 1.
Expression of catshark nephric genes in relation to expression of catshark Hox4 genes. (A–C) The expression pattern of catshark Pax2. n = 25. (A) Stage 20 embryo. (B) Enlargement of the boxed area shown in (A). (C) Cross section at the region marked with a line in (B) showing expression of the Pax2 gene in the intermediate mesoderm (arrows). (D–F) Expression pattern of catshark Lim1. n = 20. (D) Stage 19 embryo. (E) Enlargement of the boxed area shown in (D). (F) Cross section at the region marked with a line in (E) showing expression of the Lim1 gene in the intermediate mesoderm (arrows). (G–I) Expression pattern of catshark HoxA4. n = 10. (G,H) In a stage 21 embryo, the anterior expression boundary in the neural tube is at the level of the third branchial arch and in the mesoderm at the level of mid-somite 6 (dashed line). (I) Cross section at the region marked with a line in (H) showing expression of the HoxA4 gene in the nephric duct (arrows). (J–L) Expression pattern of catshark HoxB4. n = 10. (J) Stage 21 embryo. (K) Enlargement of the boxed area shown in (J). Arrow highlights HoxB4 expression in the pharyngeal arches. (L) Cross section at the region marked with a line in (K) showing expression of HoxB4 in the two nephric ducts. (M–O) Expression pattern of catshark HoxD4. (M) Stage 18 embryo. n = 8. (N,O) Stage 21 embryo. n = 15. (O) Cross section at the region marked with a line in (N). Numbers in panels (B,E,H,K,N) mark the somites from anterior to posterior. im, intermediate mesoderm; mhb, midbrain-hindbrain boundary; n, notochord; nd, nephric duct; nt, neural tube; ov, otic vesicle; PhA, pharyngeal arches; S, somite; st, stage. Scale bars in (A,B,D,E,G,H,J,K,M,N) are 500 µm and scale bars in (C,F,I,L,O) are 100 µm.
Based on published observations in chick embryos [14], we next analyzed the expression of three catshark Hox4 paralogues, HoxA4, HoxB4, and HoxD4, to assess the conservation of the involvement of Hox4 genes in pronephros development. HoxA4 and HoxD4 were expressed in the central nervous system (CNS) and the paraxial mesoderm, where they shared a sharp anterior boundary at the level of mid-somite 6 (Figure 1G,H,N), similar to that observed for Pax2 and Lim1. Mesodermal expression of HoxA4 and HoxD4 was detectable in the entire somite and lateral mesoderm, while that of the pronephric markers Pax2 and Lim1 were limited to a specific domain, ventrolateral to the somites (Figure 1C,F). This Hox4 expression, with an anterior limit at the level of mid-somite 6, was already established at stage 18 (Figure 1M) and was thus correlated with the onset of the expression of the nephric genes Pax2 and Lim1. HoxB4 had a slightly different expression pattern (Figure 1J–L). The boundary of expression in the paraxial mesodermal was not as sharp as those of HoxA4 and HoxD4, and a ventrolateral anterior extension of the signal was observable, covering the posterior region of the pharyngeal arches (Figure 1K, arrow).
Cross sections through the region of somites 7-8 revealed the organization of the catshark pronephros (Figure 1C,F,I,L,O). At stages 19-20, the two pronephric markers Pax2 and Lim1 were expressed exclusively in territories located ventrolateral to the somites, in tissues resembling those of the IM of amniotes (Figure 1C,F). Cross-sections through somite 8 following WMISH with probes for the three Hox genes (Figure 1I,L,O) revealed expression in the neural tube (for HoxA4, HoxB4, and HoxD4), ectoderm (for HoxA4), and most mesodermal tissues excluding the notochord (for HoxA4 and HoxD4). The IM-like tissue subsequently developed into an epithelial sphere that ultimately differentiated into the nephric duct, which was clearly distinguishable from somitic tissues (Figure 1I,L,O). The correlation of the expression of the pronephric markers Pax2 and Lim1 with that of the Hox4 paralogs suggests that Hox4 genes are involved in the regulation of pronephros development in the catshark, as has previously been demonstrated for Hoxb4 in chick embryos [28].
3.2. Expression of Nephric Markers in Lampreys
We next examined the expression patterns of the two early pronephric markers Pax2 (Figure 2A–C,G,H) and Lim1 (Figure 2D–F,I) and of the glomerular differentiation marker Podocin (also called NPHS2) [50,51] (Figure 2J–L) by WMISH in lamprey embryos. Pax2 was first detectable in the IM at stage 21 [46] and Lim1 at stage 24 (Figure 2I). All three genes were expressed in the IM with an anterior limit at the level of somite 6, as also observed in the catshark and the chick. However, while IM expression in the latter was continuous, the patterns observed in the lamprey appeared segmented (Figure 2B,E,K). At stages 23 and 24, respectively, the Pax2 and Lim1 expression segments were thus connected dorsally by an inconspicuous gene expression signal, marking short tubules of a systemic duct, the nephric duct (Figure 2A,B,D,E, arrowheads). Cross sections confirmed the expression of all three genes in a specific domain ventral to the somites as well as the formation of the tubules and the nephric duct dorsomedially between the expression segments (Figure 2C,F,L). While Pax2 and Lim1 were initially expressed at stages 23 and 24, respectively, in a domain destined to give rise to the tubules and nephric duct (Figure 2G–I), the signal in these tissues was subsequently downregulated at stages 24 and 25, respectively (Figure 2C,F). In contrast, Pax2 and Lim1 remained expressed in the nephric mesenchyme, which differentiates into the glomerulus later in development (Figure 2C,F). At stage 24, a clear tubule was already observed, and, as expected from its known function in amniotes [50,51], the glomerular differentiation marker Podocin was exclusively expressed in the nephric mesenchyme (Figure 2L), suggesting early-stage differentiation of glomerular tissue.
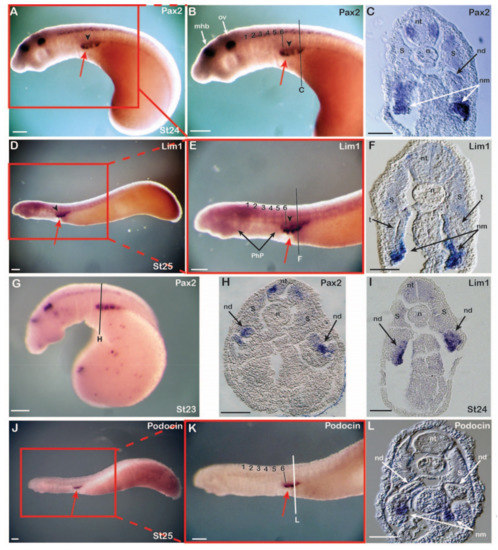
Figure 2.
Expression of lamprey nephric genes. Expression of Pax2 (n = 32) at stage 24 (A–C) and stage 23 (G,H), of Lim1 (n = 35) at stage 25 (D–F) and stage 24 (I), and of Podocin (n = 10) at stage 25 (J–L). Numbers mark the somites from anterior to posterior. Red arrows highlight pronephric glomeruli and arrowheads the pronephric duct. Note the position of somites 1-6 relative to the pharyngeal pouches. Cross sections of embryos showing Pax2 (C,H), Lim1 (F,I), and Podocin (L) expression. The nephric mesenchyme and epithelial structures of the nephric duct are labelled. mhb, midbrain-hindbrain boundary; n, notochord; nd, nephric duct; nm, nephric mesenchyme; nt, neural tube; ov, otic vesicle; PhP, pharyngeal pouches; t, tubule; S, somite; st, stage. Scale bars in (A,B,D,E,G,J,K) are 200 µm and scale bars in (C,F,H,I,L) are 50 µm.
3.3. Retinoic Acid and the Regulation of Nephric Genes in Catshark, Lamprey, and Amphioxus
To directly address the plausible conservation of the role of RA during vertebrate (and possibly chordate) early kidney development, we carried out pharmacological treatments in developing catshark, lamprey, and amphioxus.
3.3.1. Catshark
RA and BMS493 (an inverse RAR agonist) were injected into egg cases of stage 14/15 embryos (prior to the onset of nephric gene expression). Following injections, embryos were allowed to develop for six days (Figure 3). RA injection resulted in severe developmental defects, including a loss of anterior head structures. However, the trunk mesoderm appeared normal, and some alterations in the expression of nephric and Hox genes were observed. The anterior limits of Lim1, Pax2, and HoxD4 expression were shifted posteriorly by about one to two somite lengths when compared to control animals, which were characterized by normal morphology and unaltered expression of nephric genes (compare Figure 3B,E,H to Figure 3A,D,G). Apart from the posterior shifts, cross sections through the pronephros region revealed normal gene expression in the IM of RA-treated embryos (Figure 3B’,E’,H’) compared to control embryos (Figure 3A’,D’,G’). Exposure to BMS493 also affected the development of catshark embryos, with both head and trunk regions being significantly enlarged (Figure 3C,F,I). At the trunk level, while somite size and segmentation appeared normal, the expression of nephric genes was completely absent. BMS493 treatment also affected the expression of HoxD4, eliminating its expression from all anterior tissues, including the nervous system and mesoderm. Cross sections of BMS493-treated embryos confirmed this phenotype, revealing an unaffected somitic region and a complete absence of IM-derived, pronephric structures (Figure 3C’,F’,I’).
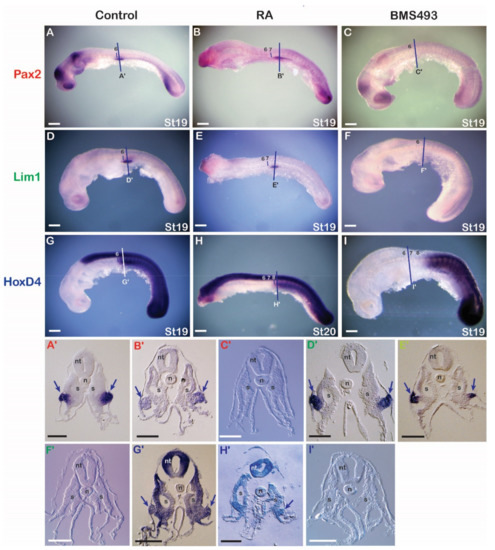
Figure 3.
Retinoic acid signaling and the regulation of nephric genes in the catshark. (A,D,G) Control embryos assayed for expression of Pax2 (n = 15/15) (A), Lim1 (n = 15/15) (D), and HoxD4 (n = 10/10) (G). (B,E,H) Embryos treated with retinoic acid (RA) and assayed for expression of Pax2 (n = 9/10) (B), Lim1 (n = 10/10) (E), and HoxD4 (n = 10/10) (H). (C,F,I) Embryos treated with BMS493, an inverse agonist of retinoic acid receptors, and assayed for expression of Pax2 (n = 15/15) (C), Lim1 (n = 10/12) (F), and HoxD4 (n = 9/10) (I). Somites are marked by numbers. Cross sections are at the level of the lines in the whole mounts. Arrows indicate the formation of the pronephros. n, notochord; nt, neural tube; S, somite; st, stage. Scale bars in (A–I) are 500 µm and scale bars in (A’–I’) are 100 µm.
3.3.2. Lamprey
Since the anterior limit of the expression of the nephric genes Pax2 and Lim1 in lamprey embryos was aligned with the sixth somite and resembled the expression of their catshark and amniote homologs, we hypothesized that these expression domains are also sensitive to changing RA signaling levels. To test the involvement of RA in IM specification in the lamprey, embryos at stages 17–18 were exposed to either RA or BMS493 and subsequently fixed at stage 24. The treatments induced clear morphological phenotypes. For example, RA-treated embryos were characterized by significantly reduced head structures (Figure 4C,D), while BMS493-treated embryos had enlarged heads (Figure 4E,F) when compared to control embryos (Figure 4A,B). Moreover, RA treatments significantly reduced the expression of Pax2 in the otic vesicle and the midbrain-hindbrain boundary (Figure 4C). These phenotypes were consistent with previous work on the effects of exogenous RA on lamprey development [52], hence validating our treatment protocols. However, no effects of the RA and BMS493 treatments were observed on the mesodermal, pronephros-associated expression domains of Pax2 and Lim1 (Figure 4A–F). Cross sections demonstrated that the expression of Pax2 and Lim1 in the ventral nephric mesenchyme and the nephric duct were indeed unaffected by the treatments (Figure 4C’–F’) when compared to control embryos (Figure 4A’,B’).
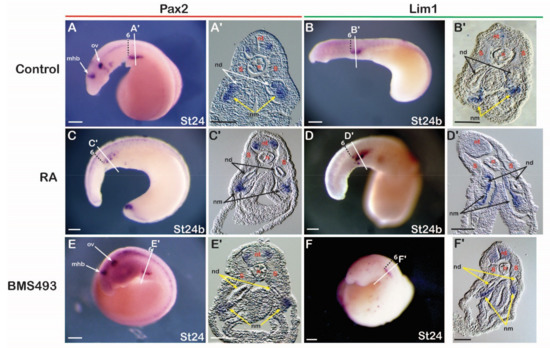
Figure 4.
Retinoic acid signaling and the regulation of nephric genes in the lamprey. (A,B) Pax2 (n = 20) (A) and Lim1 (n = 20) (B) expression in control embryos. (C,D) Pax2 (n = 15/15) (C) and Lim1 (n = 13/15) (D) expression in embryos treated with retinoic acid (RA). (E,F) Pax2 (n = 18/20) (E) and Lim1 (n = 16/18) (F) expression in embryos treated with BMS493, an inverse agonist of retinoic acid receptors. Somites are marked by numbers. Cross sections are at the level of the lines in the whole mounts. mhb, midbrain-hindbrain boundary; n, notochord; nd, nephric duct; nm, nephric mesenchyme; nt, neural tube; ov, otic vesicle; S, somite; st, stage. Scale bars in (A–F) are 200 µm and scale bars in (A’–F’) are 50 µm.
3.3.3. Amphioxus
To assess the role of RA signaling during amphioxus pronephric development, embryos were treated at the G3 stage [40] with RA or BMS493. Following the treatments, embryos and larvae exhibited significant malformations, particularly in the pharyngeal region (Figure 5A–F), confirming the activity of the pharmacological compounds [53,54]. WMISH for Pax2/5/8 and Lim1/5 during normal development revealed that, at the L0 stage, both genes were conspicuously expressed in Hatschek’s nephridium (Figure 5A,B) [32,33], located in the anterior mesoderm on the left side of the body in a dorsomedial position close to the mouth (Figure 5A’,B’) [34]. When comparing the signals of Pax2/5/8 and Lim1/5 between control and treated specimens, we found that exogenous RA led to a complete loss of expression of both genes in Hatschek’s nephridium and other anterior mesodermal tissues (Figure 5C,D), while treatments with BMS493 had no significant effect on their expression in this organ (Figure 5E,F). Cross sections supported these findings in that expression of both Pax2/5/8 and Lim1/5 in Hatschek’s nephridium was undetectable in RA-treated larvae compared to control embryos (Figure 5A’–D’) and was unaffected following treatments with BMS493 (Figure 5E’,F’). These results suggest that the formation of Hatschek’s nephridium does not require RA signaling activity and that the loss of nephric gene expression following RA exposure is not a tissue-specific effect but likely due to a general RA-induced mispatterning of the amphioxus embryo [2].
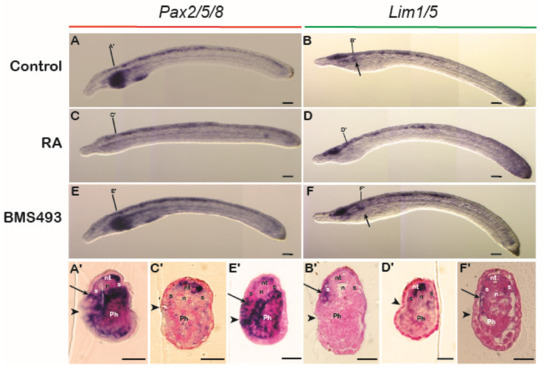
Figure 5.
Retinoic acid signaling and the regulation of gene expression in Hatschek’s nephridium in amphioxus. Expression of Pax2/5/8 and Lim1/5 in control embryos at L0 (A,B) and in L0 embryos treated with retinoic acid (RA) (n = 27/30 and n = 26/39, respectively) (C,D) or with BMS493, an inverse agonist of retinoic acid receptors (n = 28/30 and n = 28/30, respectively) (E,F). Arrows in (B,F) indicate expression of Lim1/5 in Hatschek’s nephridium. Cross sections are at the level of the lines in the whole mounts. Arrows in (A’–F’) indicate expression in Hatschek’s nephridium. Arrowheads in cross sections highlight the mouth region. n, notochord, nt, neural tube, Ph, pharynx, S, somite. Scale bars in whole mounts are 50 µm and scale bars in cross sections are 15 µm.
4. Discussion
This study aimed to characterize the site and timing of pronephros specification in three different non-conventional models, a chondrichthyan, a cyclostome, and a cephalochordate, and to assess the conservation of RA involvement in this process. Our results highlight a remarkable conservation of the positioning of the pronephros across vertebrates, with a strict anterior limit at the level of the sixth somite, but suggest an unexpected mechanistic divergence between cyclostomes and gnathostomes concerning the role of RA signaling in pronephros specification, which represents a gnathostome novelty.
4.1. Defining the Anterior Boundary of Pronephros Formation
In amniotes, the level of mid-somite 6 along the AP axis serves as the border between the atlas and axis vertebrae. Somite 6 contributes to the caudal part of the atlas and the cranial part of the axis and thus marks the anatomical boundary of the cervical region [55,56]. Therefore, somite 6 in chick embryos is the first somite along the AP axis that does not contribute to cranial structures. In amniotes, this boundary of mid-somite 6 is also the anterior limit of expression of the two early pronephros genes Pax2 and Lim1 in the IM, as well as of several Hox genes of orthologous group 4 in the IM and the paraxial mesoderm [12,14,17,28]. In contrast, studies in zebrafish and frogs have demonstrated an expression of pronephros markers, including Pax2 and Lim1, in the IM at the level of the third somite [57,58,59]. Here, we report a distinct anterior expression boundary of the pronephric genes Pax2 and Lim1 at the level of mid-somite 6 in a developing chondrichthyan (the catshark S. canicula), which closely resembles the expression reported in amniote embryos. Moreover, by examining the expression of the three catshark Hox4 paralogs (HoxA4, HoxB4, and HoxD4), we found that two of the genes, HoxA4 and HoxD4, are also characterized by a sharp anterior expression boundary at the level of mid-somite 6 in both the IM and the paraxial mesoderm. A more elusive anterior border in both mesodermal tissues characterizes the expression of the HoxB4 gene.
Examination of pronephric gene expression in a cyclostome (the lamprey L. fluviatilis) further revealed that Pax2 and Lim1 are also expressed in the IM, with an anterior limit at the level of the sixth somite. This pattern is consistent with a previous report of the development of the excretory system of the hagfish Eptatretus stouti (Bdellostoma stouti Lockington 1878), a member of the other group of extant cyclostomes. In this study, the hagfish excretory system was described as being segmented at its earliest stages and extending posteriorly from the level of the sixth spinal ganglion [5]. With an anterior limit at the level of the sixth somite, the pronephros of L. fluviatilis is located just posterior to the last pharyngeal pouch, which is consistent with other reports [37,60]. The first five somites of the developing lamprey are thus aligned with the pharyngeal pouches. In the catshark, in contrast, the first six somites are located posterior to the pharyngeal pouches, and the level of the sixth somite thus corresponds to the position of the pectoral fin bud [35]. Together, these findings suggest a conserved molecular mechanism for defining the AP positional information to establish the vertebrate pronephros, with an anterior limit at the level of somite 6 representing the ancestral state. However, this mechanism seems to be independent of the regulatory circuitry defining the position of other anatomical structures in the vicinity of the pronephros, such as the pharyngeal pouches, the pectoral fins or the cranium-trunk boundary.
In the cephalochordate amphioxus, it has previously been reported that Hatschek’s nephridium forms from the first somite on the left side of the body [34,61,62]. Due to the position of this organ and its particular histological development, its homology with the vertebrate pronephros has been the subject of a long-lasting debate [34,63,64]. The expression of Pax2/5/8 and Lim1/5 [32,33] in Hatschek’s nephridium provides further evidence for this homology. However, the manifestation of Pax2/5/8 and Lim1/5 in the most anterior somite of amphioxus, on only one side of the body, raises the question of whether the excretory system of the last common ancestor of amphioxus and vertebrates was like that of extant amphioxus.
4.2. The Role of RA in the Regulation of Pronephros Formation
There is solid evidence, in the scientific literature, for the role of RA signaling in the formation of the pronephros in amniotes [20,21,23]. In chick embryos, for example, it was shown that RA signaling is required for the transcription of Hoxb4 in the IM. Hoxb4, in turn, creates the competence, in IM cells, to respond to the signaling molecules Activin and BMP4 and thus to form the pronephros morphogenetic field [12,18,28]. In this study, we analyzed the role of RA signaling during the development of the pronephros in catsharks and lampreys and of Hatschek’s nephridium in amphioxus. The results we obtained in catsharks demonstrated that the perturbation of endogenous RA signaling levels results in malformations of the head region as well as in alterations of expression of both HoxD4 and of the pronephric gene markers Pax2 and Lim1. Thus, treatments of catshark embryos with the inverse RAR agonist BMS493 shifted the expression of HoxD4 posteriorly in the IM and the paraxial mesoderm and resulted in a complete loss of Pax2 and Lim1 expression in the IM. These results are consistent with the notion that, as in amniotes, amphibians, and bony fish, RA signaling regulates the expression of Hox4 and pronephric genes in the catshark IM [6,20,21,23,28,58,65]. The Hox4-mediated role of RA in the induction of the pronephros morphogenetic field thus very likely represents an ancient gene regulatory module already present in the last common ancestor of all jawed vertebrates.
Surprisingly, exogenous RA also resulted in a posterior shift of HoxD4 expression in the catshark IM and paraxial mesoderm. Similarly, the expression of Pax2 and Lim1 in the IM was shifted posteriorly by one to two somites. Conversely, in chick embryos, the local addition of RA, anterior to the level of somite 6, results in an anterior shift of both Hoxb4 and nephric gene marker expression [28]. These differences might be attributed to the experimental setup, with a systemic administration of RA in the catshark and a local addition of RA in the chick. Indeed, it has previously been shown that systemic excess or deficiency of RA results in similar malformations of the mouse kidney [66]. This counterintuitive result is due to the fact that systemic RA exposure in the mouse leads to severe downregulation of endogenous RA synthesis and a stark upregulation of endogenous RA degradation, resulting in a significant reduction of RA levels in the whole embryo and the kidney rudiment [66].
In contrast to the results obtained in the catshark, we failed to collect clear evidence for the involvement of RA signaling in pronephros development of lampreys. Thus, while the treatments with RA and BMS493 resulted in head malformations reminiscent of those obtained in catsharks, no discernible effects were observed on the expression of Pax2 and Lim1 in the pronephros, which is similar to previous observations in another lamprey species, L. japonica [52]. Furthermore, while we found that alterations of endogenous RA signaling levels in lampreys induced severe phenotypes in the developing head, the trunk myotomes seemed unaffected by the treatments. In agreement with this, RA treatment of L. japonica embryos at the gastrulation stage resulted in severe malformations of the head and the pharyngeal arches, but the myotomes, including the anterior ones located dorsal to the pharyngeal arches, were unaffected [52]. However, since our experiments of systemic administration of RA or BMS493 were carried out at stage 17-18, preceding the onset of pronephros progenitors (the first detection of Pax2 expression is at stage 21), we cannot exclude the possibility that treatments during earlier time windows, especially during gastrulation, might indirectly affect the appearance of pronephros progenitors. These results indicate that RA signaling might not contribute to the regulation of kidney development in lamprey. Similarly, our analyses of amphioxus embryos treated with RA and BMS493 indicate that RA signaling is not involved in regulating Pax2/5/8 and Lim1/5 expression in Hatschek’s nephridium, suggesting that patterning and formation of this mesodermal structure are independent of RA signaling. In agreement with this notion, and in contrast to the situation in the main vertebrate models, RA signaling does also not contribute to the regulation of somitogenesis in amphioxus [67]. However, we did identify a loss of nephric marker expression and an absence of Hatschek’s nephridium following RA treatment. Based on results from previous studies on RA signaling in amphioxus, we concluded that this loss was very likely an indirect effect of the severe posteriorization phenotype induced by exogenous RA [52,53,68].
In sum, our results raise the intriguing possibility that the positional information defining pronephros formation along the AP axis of ancestral vertebrates, and particularly concerning its anterior boundary in association with the sixth somite, might be independent of RA signaling (Figure 6). However, the remarkable association of the anterior boundary of the pronephros with the sixth somite appears conserved between lampreys, chondrichthyans, and birds and has thus evolved early in the vertebrate lineage. We hypothesize that, during early gnathostome diversification, the RA-dependent regulation of Hox4 genes and the Hox4-dependent control of pronephros development, as exemplified in extant amniotes, were incorporated concomitantly into the nephric gene regulatory network, plausibly by changes in the regulatory responsiveness of downstream effectors in the IM (Figure 6). We further hypothesize that kidney development in gnathostomes is impossible without the coordinated actions of both components, RA signaling and Hox4 genes. In this study, we did not establish a functional link between RA signaling and the expression of Hox4 paralogs in the lamprey trunk mesoderm and particularly in the pronephros. We, therefore, cannot exclude the possibility that Hox4 paralogs may control pronephros formation in lampreys independently of RA. Considering the likely timing of whole-genome duplications in the vertebrate lineage [69], the expression, in the catshark, of three Hox4 paralogs at the anterior border of the pronephros at the level of the sixth somite, suggests that this expression domain might have evolved in the last common ancestor of all vertebrates, prior to the duplication of the single, ancestral Hox4 gene. In this scenario, the absence of an effect following RA treatment in lampreys might indicate that a role for RA in the Hox4-dependent regulation of pronephros formation might have evolved later, after the split between gnathostomes and cyclostomes. We, therefore, propose that the RA signaling- and Hox gene-dependent (RA/Hox) regulation of nephric development is a gnathostome novelty. Understanding the differences between the gene regulatory networks controlling the patterning and formation of a functional kidney in gnathostomes and cyclostomes, therefore, holds the key to a comprehensive understanding of the evolution of vertebrate nephric development.
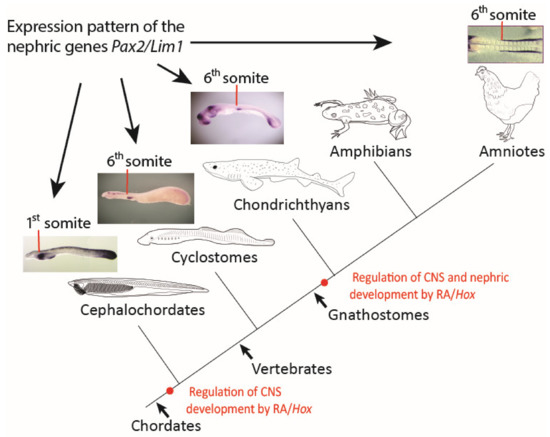
Figure 6.
Scenario for the evolution of pronephric patterning in chordates. A scheme describing the main events in the regulation of the nephric system in chordates. Red lines mark the anterior limit of early nephric gene expression. Red dots mark the evolutionary origin of retinoic acid (RA) signaling- and Hox gene-dependent (RA/Hox) regulation of different embryonic tissues. CNS, central nervous system.
Author Contributions
Conceptualization, P.S., M.S., S.M. and R.R.; data curation, P.S. and R.R.; formal analysis, P.S. and R.R.; funding acquisition, M.S., S.M. and R.R.; investigation, P.S., E.L. and R.L.; methodology, P.S., E.L. and R.L.; Project administration, E.L and R.L.; resources, E.L., R.L. and M.S.; supervision, M.S., S.M. and R.R.; validation, P.S., E.L. and R.R.; visualization, P.S. and R.R.; writing—original draft, P.S. and R.R.; writing—review and editing, M.S., S.M. and R.R.; All authors have read and agreed to the published version of the manuscript.
Funding
This research received partial funding from the European Union’s Horizon 2020 research and innovation program ASSEMBLE Plus, grant number 9764 BA0320 (R.R.), EMBRC-France, a FP7 Construction of New Research Infrastructure Project, host contract 990-BA/2017-08 (R.R), and the Agence Nationale de la Recherche contract ANR-16-CE13-0013-02 (S.M.). This study was further supported by the CNRS (M.S. and S.M.). The above-mentioned services of the Institut de la Mer de Villefranche (France) and the Observatoire Océanologique de Banyuls-sur-Mer (France) received financial support from EMBRC-France (ANR-10-INBS-02). This study was generously supported by internal funding to R.R from the Research Authority of the University of Haifa, Israel.
Institutional Review Board Statement
Vertebrate eggs were produced in the Aquariology Service of the Observatoire Océanologique, Banyuls sur Mer, France, from catshark and lamprey breeders purchased from professional fishermen, transported to and maintained in the observatory in conditions respecting animal welfare regulations (authorization n° 66082 for transport and n°A6601602 for maintenance).
Informed Consent Statement
Not applicable.
Data Availability Statement
The data presented in this study are available on request from the corresponding author.
Acknowledgments
The authors are indebted to Hector Escrivá (Observatoire Océanologique de Banyuls-sur-Mer, France) for providing Branchiostoma lanceolatum adults and to Hélène Mayeur (Observatoire Océanologique de Banyuls-sur-Mer, France) for retrieving sequences of the probes used in catshark and lamprey. We are also grateful for the support of the Service Moyen à la Mer, the Plateforme d’Imagerie par Microscopie, the Mediterranean Culture Collection of Villefranche, and the Service Aquariologie of the Centre de Ressources Biologiques, all of which are located at the Institut de la Mer de Villefranche (France), as well as for the support of the Services of Aquariology and Animal Collection of the Observatoire Océanologique de Banyuls-sur-Mer (France). The authors would further like to thank Boris Shklyar, head of the Bioimaging Unit (Faculty of Natural Sciences, University of Haifa, Israel), for his tremendous support.
Conflicts of Interest
The authors declare no conflict of interest.
References
- Mallo, M.; Vinagre, T.; Carapuço, M. The road to the vertebral formula. Int. J. Dev. Biol. 2009, 53, 1469–1481. [Google Scholar] [CrossRef] [PubMed]
- Koop, D.; Holland, N.D.; Sémon, M.; Alvarez, S.; de Lera, A.R.; Laudet, V.; Holland, L.Z.; Schubert, M. Retinoic acid signaling targets Hox genes during the amphioxus gastrula stage: Insights into early anterior-posterior patterning of the chordate body plan. Dev. Biol. 2010, 338, 98–106. [Google Scholar] [CrossRef] [PubMed]
- Nolte, C.; De Kumar, B.; Krumlauf, R. Hox genes: Downstream “effectors” of retinoic acid signaling in vertebrate embryogenesis. Genesis 2019, 57, e23306. [Google Scholar] [CrossRef] [PubMed]
- Saxen, L. Organogenesis of the Kidney; Cambridge University Press: Cambridge, UK, 1987. [Google Scholar] [CrossRef]
- Price, G.C. Development of the excretory organs of a myxinoid, Bdellostoma stouti, Lockington. Zool. Jahrb. Abt. Anat. Ontog. 1897, 10, 205–226. [Google Scholar]
- Davidson, A.J.; Lewis, P.; Przepiorski, A.; Sander, V. Turning mesoderm into kidney. Semin. Cell Dev. Biol. 2019, 91, 86–93. [Google Scholar] [CrossRef] [PubMed]
- Barak, H.; Rosenfelder, L.; Schultheiss, T.M.; Reshef, R. Cell fate specification along the anterior–posterior axis of the intermediate mesoderm. Dev. Dyn. 2005, 232, 901–914. [Google Scholar] [CrossRef]
- Hamburger, V.; Hamilton, H.L. A series of normal stages in the development of the chick embryo. J. Morphol. 1951, 88, 49–92. [Google Scholar] [CrossRef]
- Dressler, G.R.; Deutsch, U.; Chowdhury, K.; Nornes, H.O.; Gruss, P. Pax2, a new murine paired-box-containing gene and its expression in the developing excretory system. Development 1990, 109, 787–795. [Google Scholar] [CrossRef]
- Fujii, T.; Pichel, J.G.; Taira, M.; Toyama, R.; Dawid, I.B.; Westphal, H. Expression patterns of the murine LIM class homeobox gene lim1 in the developing brain and excretory system. Dev. Dyn. 1994, 199, 73–83. [Google Scholar] [CrossRef]
- Burrow, C.R. Regulatory molecules in kidney development. Pediatr. Nephrol. 2000, 14, 240–253. [Google Scholar] [CrossRef]
- James, R.G.; Schultheiss, T.M. Patterning of the avian intermediate mesoderm by lateral plate and axial tissues. Dev. Biol. 2003, 253, 109–124. [Google Scholar] [CrossRef] [PubMed]
- Hiruma, T.; Nakamura, H. Origin and development of the pronephros in the chick embryo. J. Anat. 2003, 203, 539. [Google Scholar] [CrossRef] [PubMed]
- Barak, H.; Preger-Ben Noon, E.; Reshef, R. Comparative spatiotemporal analysis of Hox gene expression in early stages of intermediate mesoderm formation. Dev. Dyn. 2012, 241, 1637–1649. [Google Scholar] [CrossRef] [PubMed]
- Seufert, D.W.; Brennan, H.C.; Deguire, J.; Jones, E.A.; Vize, P.D. Developmental basis of pronephric defects in Xenopus body plan phenotypes. Dev. Biol. 1999, 215, 233–242. [Google Scholar] [CrossRef]
- Obara-Ishihara, T.; Kuhlman, J.; Niswander, L.; Herzlinger, D. The surface ectoderm is essential for nephric duct formation in intermediate mesoderm. Development 1999, 126, 1103–1108. [Google Scholar] [CrossRef]
- Mauch, T.J.; Yang, G.; Wright, M.; Smith, D.; Schoenwolf, G.C. Signals from trunk paraxial mesoderm induce pronephros formation in chick intermediate mesoderm. Dev. Biol. 2000, 220, 62–75. [Google Scholar] [CrossRef]
- James, R.G.; Schultheiss, T.M. Bmp signaling promotes intermediate mesoderm gene expression in a dose-dependent, cell-autonomous and translation-dependent manner. Dev. Biol. 2005, 288, 113–125. [Google Scholar] [CrossRef]
- Taira, M.; Jamrich, M.; Good, P.J.; Dawid, I.B. The LIM domain-containing homeo box gene Xlim-1 is expressed specifically in the organizer region of Xenopus gastrula embryos. Genes Dev. 1992, 6, 356–366. [Google Scholar] [CrossRef]
- Moriya, N.; Uchiyama, H.; Asashima, M. Induction of pronephric tubules by activin and retinoic acid in presumptive ectoderm of Xenopus laevis. Dev. Growth Differ. 1993, 35, 123–128. [Google Scholar] [CrossRef]
- Taira, M.; Otani, H.; Jamrich, M.; Dawid, I.B. Expression of the LIM class homeobox gene Xlim-1 in pronephros and CNS cell lineages of Xenopus embryos is affected by retinoic acid and exogastrulation. Development 1994, 120, 1525–1536. [Google Scholar] [CrossRef]
- Rebbert, M.L.; Dawid, I.B. Transcriptional regulation of the Xlim-1 gene by activin is mediated by an element in intron I. Proc. Natl. Acad. Sci. USA 1997, 94, 9717–9722. [Google Scholar] [CrossRef] [PubMed]
- Osafune, K.; Nishinakamura, R.; Komazaki, S.; Asashima, M. In vitro induction of the pronephric duct in Xenopus explants. Dev. Growth Differ. 2002, 44, 161–167. [Google Scholar] [CrossRef] [PubMed]
- Watanabe, M.; Rebbert, M.L.; Andreazzoli, M.; Takahashi, N.; Toyama, R.; Zimmerman, S.; Whitman, M.; Dawid, I.B. Regulation of the Lim-1 gene is mediated through conserved FAST-1/FoxH1 sites in the first intron. Dev. Dyn. 2002, 225, 448–456. [Google Scholar] [CrossRef] [PubMed]
- Haldin, C.E.; Nijjar, S.; Masse, K.; Barnett, M.W.; Jones, E.A. Isolation and growth factor inducibility of the Xenopus laevis Lmx1b gene. Int. J. Dev. Biol. 2004, 47, 253–262. [Google Scholar] [CrossRef]
- Kim, D.; Dressler, G.R. Nephrogenic factors promote differentiation of mouse embryonic stem cells into renal epithelia. J. Am. Soc. Nephrol. 2005, 16, 3527–3534. [Google Scholar] [CrossRef]
- Cartry, J.; Nichane, M.; Ribes, V.; Colas, A.; Riou, J.F.; Pieler, T.; Dollé, P.; Bellefroid, E.J.; Umbhauer, M. Retinoic acid signaling is required for specification of pronephric cell fate. Dev. Biol. 2006, 299, 35–51. [Google Scholar] [CrossRef]
- Preger-Ben Noon, E.; Barak, H.; Guttmann-Raviv, N.; Reshef, R. Interplay between activin and Hox genes determines the formation of the kidney morphogenetic field. Development 2009, 136, 1995–2004. [Google Scholar] [CrossRef]
- Ghyselinck, N.B.; Duester, G. Retinoic acid signaling pathways. Development 2019, 146, dev167502. [Google Scholar] [CrossRef]
- Fraser, E.A. The development of the vertebrate excretory system. Biol. Rev. 1950, 25, 159–187. [Google Scholar] [CrossRef]
- Escrivá, H. My favorite animal, amphioxus: Unparalleled for studying early vertebrate evolution. BioEssays 2018, 40, e1800130. [Google Scholar] [CrossRef]
- Kozmik, Z.; Holland, N.D.; Kalousova, A.; Paces, J.; Schubert, M.; Holland, L.Z. Characterization of an amphioxus paired box gene, AmphiPax2/5/8: Developmental expression patterns in optic support cells, nephridium, thyroid-like structures and pharyngeal gill slits, but not in the midbrain-hindbrain boundary region. Development 1999, 126, 1295–1304. [Google Scholar] [CrossRef] [PubMed]
- Langeland, J.A.; Holland, L.Z.; Chastain, R.A.; Holland, N.D. An amphioxus LIM-homeobox gene, AmphiLim1/5, expressed early in the invaginating organizer region and later in differentiating cells of the kidney and central nervous system. Int. J. Biol. Sci. 2006, 2, 110. [Google Scholar] [CrossRef] [PubMed]
- Ruppert, E.E. Morphology of Hatschek’s nephridium in larval and juvenile stages of Branchiostoma virginiae (Cephalochordata). Isr. J. Zool. 1996, 42, S161–S182. [Google Scholar] [CrossRef]
- Ballard, W.W.; Mellinger, J.; Lechenault, H. A series of normal stages for development of Scyliorhinus canicula, the lesser spotted dogfish (Chondrichthyes: Scyliorhinidae). J. Exp. Zool. 1993, 267, 318–336. [Google Scholar] [CrossRef]
- Sauka-Spengler, T.; Le Mentec, C.; Lepage, M.; Mazan, S. Embryonic expression of Tbx1, a DiGeorge syndrome candidate gene, in the lamprey Lampetra fluviatilis. Gene Expr. Patterns 2002, 2, 99–103. [Google Scholar] [CrossRef]
- Tahara, Y. Normal stages of development in the lamprey, Lampetra reissneri (Dybowski). Zoolog. Sci. 1988, 5, 109–118. [Google Scholar]
- Fuentes, M.; Schubert, M.; Dalfo, D.; Candiani, S.; Benito, E.; Gardenyes, J.; Godoy, L.; Moret, F.; Illas, M.; Patten, I.; et al. Preliminary observations on the spawning conditions of the European amphioxus (Branchiostoma lanceolatum) in captivity. J. Exp. Zool. B 2004, 302, 384–391. [Google Scholar] [CrossRef]
- Holland, L.Z.; Yu, J.K. Cephalochordate (amphioxus) embryos: Procurement, culture, and basic methods. Methods Cell Biol. 2004, 74, 195–215. [Google Scholar] [CrossRef]
- Carvalho, J.E.; Lahaye, F.; Yong, L.W.; Croce, J.C.; Escrivá, H.; Yu, J.K.; Schubert, M. An updated staging system for cephalochordate development: One table suits them all. Front. Cell Dev. Biol. 2021, 9, 1–18. [Google Scholar] [CrossRef]
- Zieger, E.; Candiani, S.; Garbarino, G.; Croce, J.C.; Schubert, M. Roles of retinoic acid signaling in shaping the neuronal architecture of the developing amphioxus nervous system. Mol. Neurobiol. 2018, 55, 5210–5229. [Google Scholar] [CrossRef]
- Yu, J.K.; Holland, L.Z. Amphioxus whole-mount in situ hybridization. Cold Spring Harb. Protoc. 2009, 4, 1–7. [Google Scholar] [CrossRef] [PubMed]
- O’Neill, P.; McCole, R.B.; Baker, C.V.H. A molecular analysis of neurogenic placode and cranial sensory ganglion development in the shark, Scyliorhinus canicula. Dev. Biol. 2007, 304, 156–181. [Google Scholar] [CrossRef] [PubMed]
- Coolen, M.; Sauka-Spengler, T.; Nicolle, D.; Le-Mentec, C.; Lallemand, Y.; Da Silva, C.; Plouhinec, J.L.; Robert, B.; Wincker, P.; Shi, D.L.; et al. Evolution of axis specification mechanisms in jawed vertebrates: Insights from a chondrichthyan. PLoS ONE 2007, 2, e374. [Google Scholar] [CrossRef] [PubMed]
- Oulion, S.; Debiais-Thibaud, M.; D’Aubenton-Carafa, Y.; Thermes, C.; Da Silva, C.; Bernard-Samain, S.; Gavory, F.; Wincker, P.; Mazan, S.; Casane, D. Evolution of Hox gene clusters in gnathostomes: Insights from a survey of a shark (Scyliorhinus canicula) transcriptome. Mol. Biol. Evol. 2010, 27, 2829–2838. [Google Scholar] [CrossRef][Green Version]
- McCauley, D.W.; Bronner-Fraser, M. Conservation of Pax gene expression in ectodermal placodes of the lamprey. Gene 2002, 287, 129–139. [Google Scholar] [CrossRef]
- Osorio, J.; Mazan, S.; Rétaux, S. Organisation of the lamprey (Lampetra fluviatilis) embryonic brain: Insights from LIM-homeodomain, Pax and hedgehog genes. Dev. Biol. 2005, 288, 100–112. [Google Scholar] [CrossRef]
- Carvalho, J.E.; Lahaye, F.; Croce, J.C.; Schubert, M. CYP26 function is required for the tissue-specific modulation of retinoic acid signaling during amphioxus development. Int. J. Dev. Biol. 2017, 61, 733–747. [Google Scholar] [CrossRef]
- Takio, Y.; Kuraku, S.; Murakami, Y.; Pasqualetti, M.; Rijli, F.M.; Narita, Y.; Kuratani, S.; Kusakabe, R. Hox gene expression patterns in Lethenteron japonicum embryos—Insights into the evolution of the vertebrate Hox code. Dev. Biol. 2007, 308, 606–620. [Google Scholar] [CrossRef]
- Boute, N.; Gribouval, O.; Roselli, S.; Benessy, F.; Lee, H.; Fuchshuber, A.; Dahan, K.; Gubler, M.C.; Niaudet, P.; Antignac, C. NPHS2, encoding the glomerular protein podocin, is mutated in autosomal recessive steroid-resistant nephrotic syndrome. Nat. Genet. 2000, 24, 349–354. [Google Scholar] [CrossRef]
- Roselli, S.; Heidet, L.; Sich, M.; Henger, A.; Kretzler, M.; Gubler, M.C.; Antignac, C. Early glomerular filtration defect and severe renal disease in podocin-deficient mice. Mol. Cell. Biol. 2004, 24, 550–560. [Google Scholar] [CrossRef]
- Kuratani, S.; Ueki, T.; Hirano, S.; Aizawa, S. Rostral truncation of a cyclostome, Lampetra japonica, induced by all-trans retinoic acid defines the head/trunk interface of the vertebrate body. Dev. Dyn. 1998, 211, 35–51. [Google Scholar] [CrossRef]
- Escriva, H.; Holland, N.D.; Gronemeyer, H.; Laudet, V.; Holland, L.Z. The retinoic acid signaling pathway regulates anterior/posterior patterning in the nerve cord and pharynx of amphioxus, a chordate lacking neural crest. Development 2002, 129, 2905–2916. [Google Scholar] [CrossRef] [PubMed]
- Schubert, M.; Yu, J.-K.; Holland, N.D.; Escriva, H.; Laudet, V.; Holland, L.Z. Retinoic acid signaling acts via Hox1 to establish the posterior limit of the pharynx in the chordate amphioxus. Development 2005, 132, 61–73. [Google Scholar] [CrossRef] [PubMed]
- Huang, R.; Zhi, Q.; Patel, K.; Wilting, J.; Christ, B. Contribution of single somites to the skeleton and muscles of the occipital and cervical regions in avian embryos. Anat. Embryol. 2000, 202, 375–383. [Google Scholar] [CrossRef] [PubMed]
- Aoyama, H.; Asamoto, K. The developmental fate of the rostral/caudal half of a somite for vertebra and rib formation: Experimental confirmation of the resegmentation theory using chick-quail chimeras. Mech. Dev. 2000, 99, 71–82. [Google Scholar] [CrossRef]
- Drummond, I.A.; Majumdar, A.; Hentschel, H.; Elger, M.; Solnica-Krezel, L.; Schier, A.F.; Neuhauss, S.C.; Stemple, D.L.; Zwartkruis, F.; Rangini, Z.; et al. Early development of the zebrafish pronephros and analysis of mutations affecting pronephric function. Development 1998, 125, 4655–4667. [Google Scholar] [CrossRef]
- Wingert, R.A.; Selleck, R.; Yu, J.; Song, H.-D.; Chen, Z.; Song, A.; Zhou, Y.; Thisse, B.; Thisse, C.; McMahon, A.P.; et al. The cdx genes and retinoic acid control the positioning and segmentation of the zebrafish pronephros. PLoS Genet. 2007, 3, e189. [Google Scholar] [CrossRef] [PubMed]
- Vize, P.D.; Seufert, D.W.; Carroll, T.J.; Wallingford, J.B. Model systems for the study of kidney development: Use of the pronephros in the analysis of organ induction and patterning. Dev. Biol. 1997, 188, 189–204. [Google Scholar] [CrossRef]
- Richardson, M.K.; Admiraal, J.; Wright, G.M. Developmental anatomy of lampreys. Biol. Rev. 2010, 85, 1–33. [Google Scholar] [CrossRef]
- Kaji, T.; Reimer, J.D.; Morov, A.R.; Kuratani, S.; Yasui, K. Amphioxus mouth after dorso-ventral inversion. Zool. Lett. 2016, 2, 2. [Google Scholar] [CrossRef]
- Holland, N.D. Formation of the initial kidney and mouth opening in larval amphioxus studied with serial blockface scanning electron microscopy (SBSEM). EvoDevo 2018, 9, 16. [Google Scholar] [CrossRef] [PubMed]
- Ruppert, E.E. Evolutionary origin of the vertebrate nephron. Am. Zool. 1994, 34, 542–553. [Google Scholar] [CrossRef]
- Holland, N.D. The long and winding path to understanding kidney structure in amphioxus—A review. Int. J. Dev. Biol. 2017, 61, 683–688. [Google Scholar] [CrossRef]
- Nylor, R.W.; Qubisi, S.S.; Davidson, A.J. Zebrafish pronephros development. Results Probl. Cell Differ. 2017, 60, 27–53. [Google Scholar] [CrossRef]
- Lee, L.M.Y.; Leung, C.Y.; Tang, W.W.C.; Choi, H.L.; Leung, Y.C.; McCaffery, P.J.; Wang, C.C.; Woolf, A.S.; Shum, A.S.W. A paradoxical teratogenic mechanism for retinoic acid. Proc. Natl. Acad. Sci. USA 2012, 109, 13668–13673. [Google Scholar] [CrossRef] [PubMed]
- Bertrand, S.; Aldea, D.; Oulion, S.; Subirana, L.; de Lera, A.R.; Somorjai, I.; Escrivá, H. Evolution of the role of RA and FGF signals in the control of somitogenesis in chordates. PLoS ONE 2015, 10, e0136587. [Google Scholar] [CrossRef]
- Schubert, M.; Holland, N.D.; Laudet, V.; Holland, L.Z. A retinoic acid-Hox hierarchy controls both anterior/posterior patterning and neuronal specification in the developing central nervous system of the cephalochordate amphioxus. Dev. Biol. 2006, 296, 190–202. [Google Scholar] [CrossRef]
- Smith, J.J.; Timoshevskaya, N.; Ye, C.; Holt, C.; Keinath, M.C.; Parker, H.J.; Cook, M.E.; Hess, J.E.; Narum, S.R.; Lamanna, F.; et al. The sea lamprey germline genome provides insights into programmed genome rearrangement and vertebrate evolution. Nat. Genet. 2018, 50, 270–277. [Google Scholar] [CrossRef] [PubMed]
Publisher’s Note: MDPI stays neutral with regard to jurisdictional claims in published maps and institutional affiliations. |
© 2022 by the authors. Licensee MDPI, Basel, Switzerland. This article is an open access article distributed under the terms and conditions of the Creative Commons Attribution (CC BY) license (https://creativecommons.org/licenses/by/4.0/).