Article

Analysis of Homologous Regions of Small RNAs MIR397 and MIR408 Reveals the Conservation of Microsynteny among Rice Crop-Wild Relatives

1
ICAR-National Institute for Plant Biotechnology, Pusa Campus, New Delhi 110012, India
2
ICAR-National Rice Research Institute, Cuttack 753006, India
*
Authors to whom correspondence should be addressed.
These authors contributed equally to this work.
Cells 2022, 11(21), 3461; https://doi.org/10.3390/cells11213461
Submission received: 23 September 2022 / Revised: 18 October 2022 / Accepted: 22 October 2022 / Published: 2 November 2022
(This article belongs to the Special Issue Research on Plant Functional Genomics and Stress Response)

Abstract

:
MIRNAs are small non-coding RNAs that play important roles in a wide range of biological processes in plant growth and development. MIR397 (involved in drought, low temperature, and nitrogen and copper (Cu) starvation) and MIR408 (differentially expressed in response to environmental stresses such as copper, light, mechanical stress, dehydration, cold, reactive oxygen species, and drought) belong to conserved MIRNA families that either negatively or positively regulate their target genes. In the present study, we identified the homologs of MIR397 and MIR408 in Oryza sativa and its six wild progenitors, three non-Oryza species, and one dicot species. We analyzed the 100 kb segments harboring MIRNA homologs from 11 genomes to obtain a comprehensive view of their community evolution around these loci in the farthest (distant) relatives of rice. Our study showed that mature MIR397 and MIR408 were highly conserved among all Oryza species. Comparative genomics analyses also revealed that the microsynteny of the 100 kb region surrounding MIRNAs was only conserved in Oryza spp.; disrupted in Sorghum, maize, and wheat; and completely lost in Arabidopsis. There were deletions, rearrangements, and translocations within the 100 kb segments in Oryza spp., but the overall microsynteny of the region was maintained. The phylogenetic analyses of the precursor regions of all MIRNAs under study revealed a bimodal clade of common origin. This comparative analysis of miRNA involved in abiotic stress tolerance in plants provides a powerful tool for future Oryza research. Crop wild relatives (CWRs) offer multiple traits with potential to decrease the amount of yield loss owing to biotic and abiotic stresses. Using a comparative genomics approach, the exploration of CWRs as a source of tolerance to these stresses by understanding their evolution can be further used to leverage their yield potential.

1. Introduction

Cereals are the primary source of human nutrition in the form of edible seeds and fulfil more than 50% oftheir daily calorie/protein requirement [1]. Maize (Zea may), rice (O. sativa), wheat (Triticum aestivum), and Sorghum (Sorghum bicolor) are major cereals consumed as food. Amongst all cultivated cereals, rice is world’s most important staple food crop [2]. The genus Oryza consists of 24 species, amongst which O. sativa L. and Oryza glaberrima S. are cultivated and the remaining are wild relatives distributed around the globe [3]. Cultivated species of rice are mainly diploid but species of farther groups are diploids or tetraploids and contain other genome types [4]. While most grass species are proposed to have a polyploid origin [5], genome sequencing of rice has reconfirmed that a common tetra-ploidization or whole-genome duplication event in grasses occurred 100 million years ago [6].
Micro-RNAs are important regulatory molecules in the cellular system and control innumerable biological processes in living organisms [7,8]. Nevertheless, plant micro-RNAs (MIRNAs) are a large family of 22–24 nt endogenous small non-coding RNAs that play an important regulatory role at the post-transcriptional level in plants [9,10]. MIRNAs are transcribed from their gene into primary MIRNAs (pri-MIRNAs) and then processed to precursors; finally, mature MIRNAs are formed [11]. Processed from stem-loop structured precursors by a Dicer-like enzyme, mature MIRNAs are integrated into RNA-induced silencing complexes (RISCs) and function as gene repressors by directing the cleavage of complementary mRNA transcripts [12,13],
MIR397, containing several conserved members, was initially reported as a novel abiotic-stress-regulated MIRNA (MIR397A and MIR397B) involved in drought, low temperature, nitrogen starvation, low copper (Cu) availability, and other regulatory mechanisms of tolerance to different stresses and was identified as differentially expressed MIRNAs in plant post embryonic development [14]. In most plants, MIR397 is 21 nt in length, but a 22 nt MIR397 with a shift of 3 nt and an extension of 1 nt in comparison to other MIR397s (uugagugcagcguugaugaacc in rice) was identified [15]. Altogether, sixty-eight members of the MIR397 family and their mature sequences are recorded in 33 species in the miRBase database (http://www.mirbase.org, ver. 22.1, accessed on 25 August 2022) [16]. It mainly targets the LACCASE (LAC) genes and negatively regulates their functioning in lignin synthesis [17]. It is involved in the regulation of flowering, and flower, seed and fruit development [14], and it targets LAC2, LAC4, LAC17 [15,18,19], and CKB3 [20]. A transcription factor, ICE1, in wheat was also identified as a target of MIR397 and functions in cold adaption [21]. The RRA1, RRA2, DPA, CLPP3, GNS1/SUR4, and 14-3-3 family protein genes are also probable targets and are cleaved by MIR397 [14]. MIR397 was also reported to play a role in the improvement in agronomic traits such as yield. The over-expression of OsMIR397 improves yield in rice by promoting panicle branching and increasing grain size [18]. In addition, the over-expression of Musa-MIR397 is known to enhance plant biomass in banana [22].
Similarly, MIR408 belongs to one of the most conserved MIRNA families [23,24]. It was identified in more than 30 plant species [25] and is differentially expressed in response to various environmental stresses, including copper, light, mechanical stress, dehydration, cold, reactive oxygen species, and drought [26]. Its role in abiotic and biotic stress response in wheat was also reported [27]. It is also known to play a role in agronomic trait improvement [28]. Studies suggested that the constitutive expression of MIR408 improves biomass and seed yield in Arabidopsis [26]. Tae-MIR408 is known to be involved in regulating “Heading-time” in wheat [29]. A few transcription factors involved in the direct regulation of MIR408 in response to varying light and copper conditions are LONG HYPOCOTYL 5 (HY5) and SQUAMOSA PROMOTER-BINDING PROTEIN-LIKE 7 (SPL7) [30,31,32]. MIR408 targets several genes for copper-binding proteins that belong to the two distinct families of PHYTOCYANIN (PETE1 and PETE2) and LACCASE (LAC3, LAC4, LAC 12, and LAC13) [26]. MIR408 is known to positively regulate its targeted genes.
The green revolution has played a pivotal role by increasing agricultural productivity worldwide [33], but limited resources still pose a serious challenge for future global food security. Cultivated plants are known to have a relatively lower levels of tolerance to stress than crop wild relatives [34]. Wild species of Oryza are considered rich sources of unexplored genes for these traits [3,4,35]. Previously, many studies targeting the evolution and conservation of protein-coding genes in poaceae were performed, but studies focusing on the evolution and structure of MIRNA genes are lacking. In addition, microsynteny analyses of the 100 kb genomic segment of the MIR397 and MIR408 genes were not performed in poaceae and its wild progenitors. Structural [36,37,38,39] and functional [40,41,42,43,44,45] genomics were extensively used for crop improvement, and in our endeavor, we employed a comparative genomics approach to identify the homologs of two prominent MIRNAs, viz., MIR397 and MIR408, which, contrastingly, either negatively or positively regulate gene expression in rice. Furthermore, we analyzed the gain/loss of synteny in O. sativa and its six wild species, Z. may, S. bicolor, Triticum aestivum, and Arabidopsis, to understand the effect of polyploidization on the region containing MIR397 and MIR 408. Our study aimed towards understanding the evolutionary course of various cultivated and wild grasses so as to leverage crop wild relatives for crop improvement.

2. Materials and Methods

2.1. Sequence Retrieval of MIR397 and MIR408 Homologs

Mature and precursor sequences of MIR397 and MIR408 from O. sativa, S. bicolor, Z. may, T. aestivum, and A. thaliana were retrieved from miRBase 22.1 (Website: http://www.mirbase.org/, accessed on 20 July 2022) [46]. MIRNA precursor sequences of Oryza sativa were used as query to perform BLASTN (Local BLAST) against the genomic sequence of O. glaberrima (V1), O. rufipogon (OR-W1943), O. glumaepetula (v1.5), O. barthii (v1.0), O. punctata (v1.2), and O. brachyantha (V1.4b) available in the Gramene database (Website: http://www.gramene.org, accessed on 20 July 2022) with default parameters to retrieve their respective precursor sequences. The MIRNA precursor sequences of S. bicolor, Z. may, T. aestivum, and A. thaliana were used as query to perform BLASTN (Local BLAST) against their respective genomic sequences available in the Gramene database. High-scoring pairs (HSPs) for MIR397 and MIR408 were obtained on the basis of score, e-value, and percentage identity. These HSPs were then selected for comparative genomics analysis to understand the microsynteny, organization, and evolutionary trend of MIR397 and MIR408 in Oryza and related species.

2.2. MIRNA Precursor Sequence Analysis

Precursor and mature sequences (nucleotide sequences) of MIR397 and MIR408 from seven Oryza spp., S. bicolor, Z. may, T. aestivum, and A. thaliana were subjected to multiple sequence alignment using the MAFFT program (version 7.271) [47] with L-INS-I strategy. The output was generated in Phylip format. A similarity score for each nucleotide of the aligned sequences was calculated using ESPRIPT 3.0 [48] (Website: https://espript.ibcp.fr/ESPript/ESPript/, accessed on 22 July 2022) with default parameters.

2.3. Test of Neutrality

The neutrality of MIRNA sequence polymorphisms among poaceae was assessed by means of neutrality tests such as Tajima’s D [49] and Fu and Li’s F [50] on 3 different MIRNA, viz., MIR397A, MIR397B and MIR408, loci using DnaSP v5.10 [51].

2.4. Microsynteny Analysis

For the synteny analysis, the genomic sequences of the 100 kb region comprising 50 kb upstream and 50 kb downstream of MIR397 and MIR408 precursor sequences from Oryza sativa, O. glaberrima, O. rufipogon, O. glumaepetula, O. barthii, O. punctata, O. brachyantha S. bicolor, Z. may, T. aestivum, and A. thaliana were retrieved from the Gramene database (Supplementary Table S1). Genes were predicted in a batch-wise manner with the most accurate ab initio gene prediction program using the FGENESH tool from Molquest II (Website: http://www.molquest.com/molquest.phtml?group=index&topic=gfind, accessed on 25 July 2022) [52] with default parameters. For all rice species, Oryza sativa was taken as the default template, and for wheat, maize, and Sorghum, their respective genomes were used as the template. Genes predicted using FGENESH in the 100 kb region were subjected to functional annotation and genomics analyses with Blast2GO software (Website: https://www.blast2go.com/, accessed on 25 July 2022) [53] for functional annotation. Functionally annotated genes generated via the BLAST2GO analysis of the 100 Kb region of each of the three MIRNAs were enlisted in a species-wise manner and used for microsynteny analyses (Supplementary Data File S2.xls).
For microsynteny analyses, the database and blastp for the calculation of the synteny block input were built using the ncbi-blast-2.8.1+ package (makeblastdb and blastp). The query for the makeblastdb script was three set of proteins (one set each for MIR397A, MIR397B, and MIR408) predicted in the previous step in the 100 kb genomic fragments of the 11 genomes under study. The parameters for blastp were blastp -outfmt 8 -evalue 1ex10-10 -max_target_seqs 5. The output obtained from the blast process and the GFF annotations of the 11 species (seven Oryza/three non-Oryza/one dicot) for each MIRNA was used as the input for synteny block calculation. The interspecies syntenic blocks were calculated using the MCScanX tool [54] with the following parameters: match-score, final score = match score + num_gaps × gap_penalty (default: 50); gap-penalty, gap penalty (default: −1); match-size, the number of genes required to call a collinear block (default: 5); E-value, alignment significance, 1e-5; max-gaps, maximum gaps allowed (default: 25); overlap-window, maximum distance of 10,000 (number of nucleotides among genes) to collapse blast matches (default: 5); and the patterns of collinear blocks, 1 inter-species. The approach identified that two or more species shared a pairwise synteny block that had at least five genes shared with an E-value < 1e-10 in a maximum range of 10,000 nucleotides. For the figures, the MCScanX package circle_plotter was employed. After the set of synteny blocks was identified, in-house scripts were developed to subset the MCScanX collinearity output file. Publication-grade circular plots were generated using Circos (Website: http://circos.ca/, accessed on 5 August 2022) [55].

2.5. Plant Material and Sequencing of Precursor MIR397 and MIR408 Sequences

Before studying the expression pattern of MIR397 and MIR408 in rice and other poaceae members, we explored the precursor/mature MIRNA sequences for expression analyses. Therefore, the MIR397 and MIR408 homologs were amplified and sequenced before expression studies from O. sativa, O. glaberrima, O. rufipogon, O. glumaepatula, O. barthii, O. punctata, O. brachyantha, S. bicolor, Z. mays, T. aestivum, and A. thaliana. Genomic DNA was isolated from seven Oryza spp., sorghum, maize, wheat, and Arabidopsis and used as template for the amplification of precursor sequences of MIR397A, MIR397B, and MIR408 using specific primers (Supplementary Table S2) with Phusion taq polymerase. The parameters for the PCR reaction were: 30 sec at 98 °C, 30 cycles of 10 s at 98 °C, 15 s at varying annealing temperatures, and 10 s at 72 °C, with a final extension of 5 min at 72 °C. The amplified PCR products were sequenced and aligned with pre-existing sequences for confirmation.

2.6. Expression Analysis of Mature MIR397 and MIR408 via qRT-PCR

Total miRNA was isolated from various tissues, such as seedling, stem, root, leaf, flag leaf, and panicle tissues, of seven Oryza spp., S. bicolor, Z. mays, T. aestivum, and A. thaliana using PureLink™ miRNA Isolation Kit (Invitrogen, Waltham, MA, USA) as per the manufacturer’s protocol. First-strand cDNA was synthesized from the isolated miRNA using a Mir-X™ miRNA First-Strand Synthesis kit (Clontech Laboratories, Inc., Mountain View, CA, USA). The expression of mature MIR397 and MIR408 was analyzed using real-time PCR (qRT-PCR) using Mir-X miRNA qRT-PCR SYBR Kit (Clontech Laboratories, Inc.). mRQ 3′ universal reverse primer and species-specific mature MIR397 and MIR408 forward primers were used (Supplementary Table S3). qRT-PCR reactions were performed using the cycles of initial denaturation for 5 min at 95 °C, 45 cycles of 15 s at 95 °C, 30 s at 60 °C, and 30 s at 72 °C in 96-well optical reaction plates. The miRNA expression level was normalized using U6 as an endogenous control. The data were reported as the means of three biological replicates with three technical replicates for each biological repeat.

2.7. Phylogenetic Analysis of Precursor Sequences

For the estimation of the phylogenetic relationship between the precursor sequences of various homologs of MIR397 and MIR408, 500 bp nucleotide sequences upstream of the respective precursor sequences were retrieved from the Gramene database (Table S1). The multiple sequence alignment of respective MIRNAs was performed using Clustal Omega [56], and an un-rooted tree was constructed in MEGA10 [57] using the maximum likelihood (ML) method. Tree topology was searched using the Nearest Neighbor Interchange (NNI) algorithm [58]. The substitution model Tamura 3-parameter using a discrete Gamma distribution (+G) with 5 rate categories by assuming that a certain fraction of sites were evolutionarily invariable (+I) was employed for MIR397, while Tamura 3-parameter substitution model using a discrete Gamma distribution (+G) with 5 rate categories was employed for MIR408. The gamma shape parameter was estimated directly from the data, and analyses were performed using 1000 bootstrap replicates. The proportion of invariable sites was fixed. The tree was obtained in Newick format. The graphical representation of the phylogenetic tree was performed with i-TOL (website: http://itol.embl.de/, accessed on 10 August 2022).

3. Results

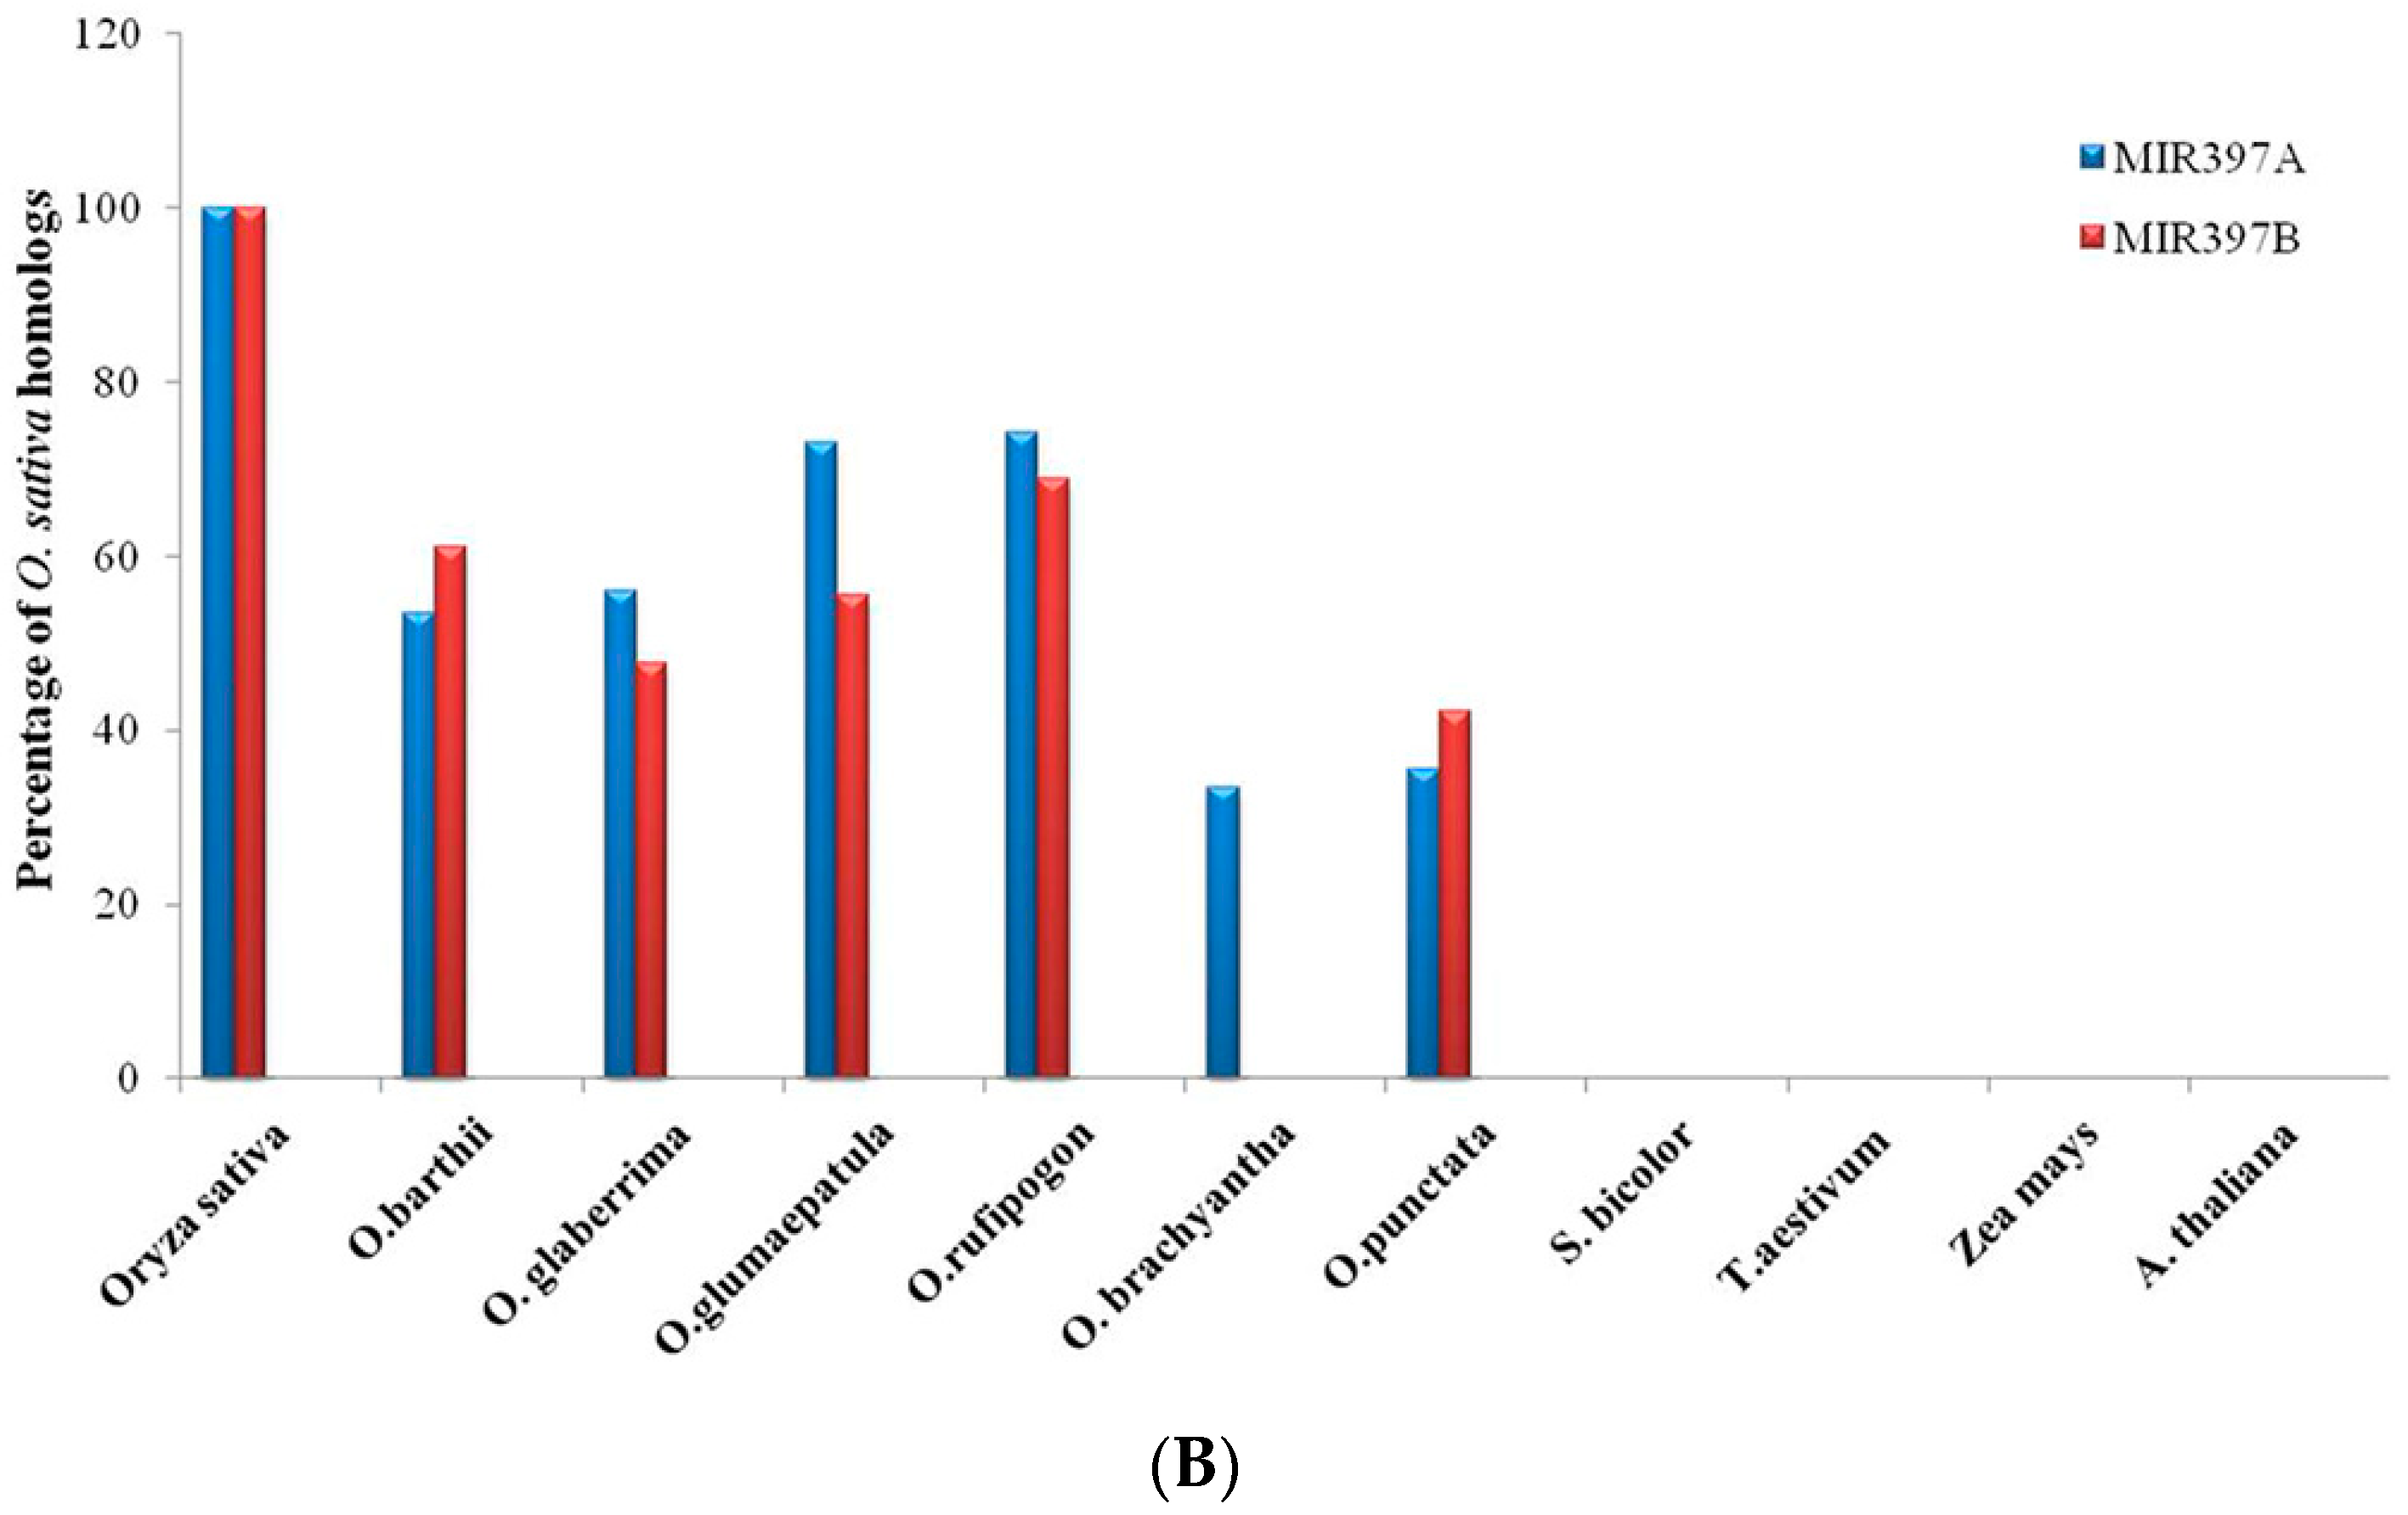
3.1. Identification of MIR397 and MIR408 Homologs in Oryza, Other Monocots and One Eudicot

The homologs of MIR397 and MIR408 were identified in all the investigated Oryza spp. and other genera from the MIBASE database. In O. sativa subspecies indica, two homologs of MIR397, i.e., MIR397A and MIR397B, were identified. Additionally, using Oryza sativa MIR397 as reference, two homologs of MIR397, i.e., MIR397A and MIR397B, were also identified in all the wild relatives of rice, viz., O. barthii, O. brachyantha, O. glaberrima, O. glumaepetula, O. rufipogon, and O. punctata. In addition, two homologs of MIR397 (MIR397A and MIR397B) were identified in Z. mays and Arabidopsis. However, in S. bicolor and T. aestivum, a single homolog of MIR397 was identified (Figure 1A,B).
On the contrary, the exploration of MIR408 revealed the presence of a single homolog in Oryza sativa including all its wild relatives, Sorghum, and Arabidopsis, while in Z. mays, two homologs of MIR408, viz., MIR408A and MIR408B, were identified (Figure 1C). Precise chromosomal locations and coordinates were deduced for each homolog from the database and are provided in Table 1, and the numbers of homologs identified are mentioned in Table 2.

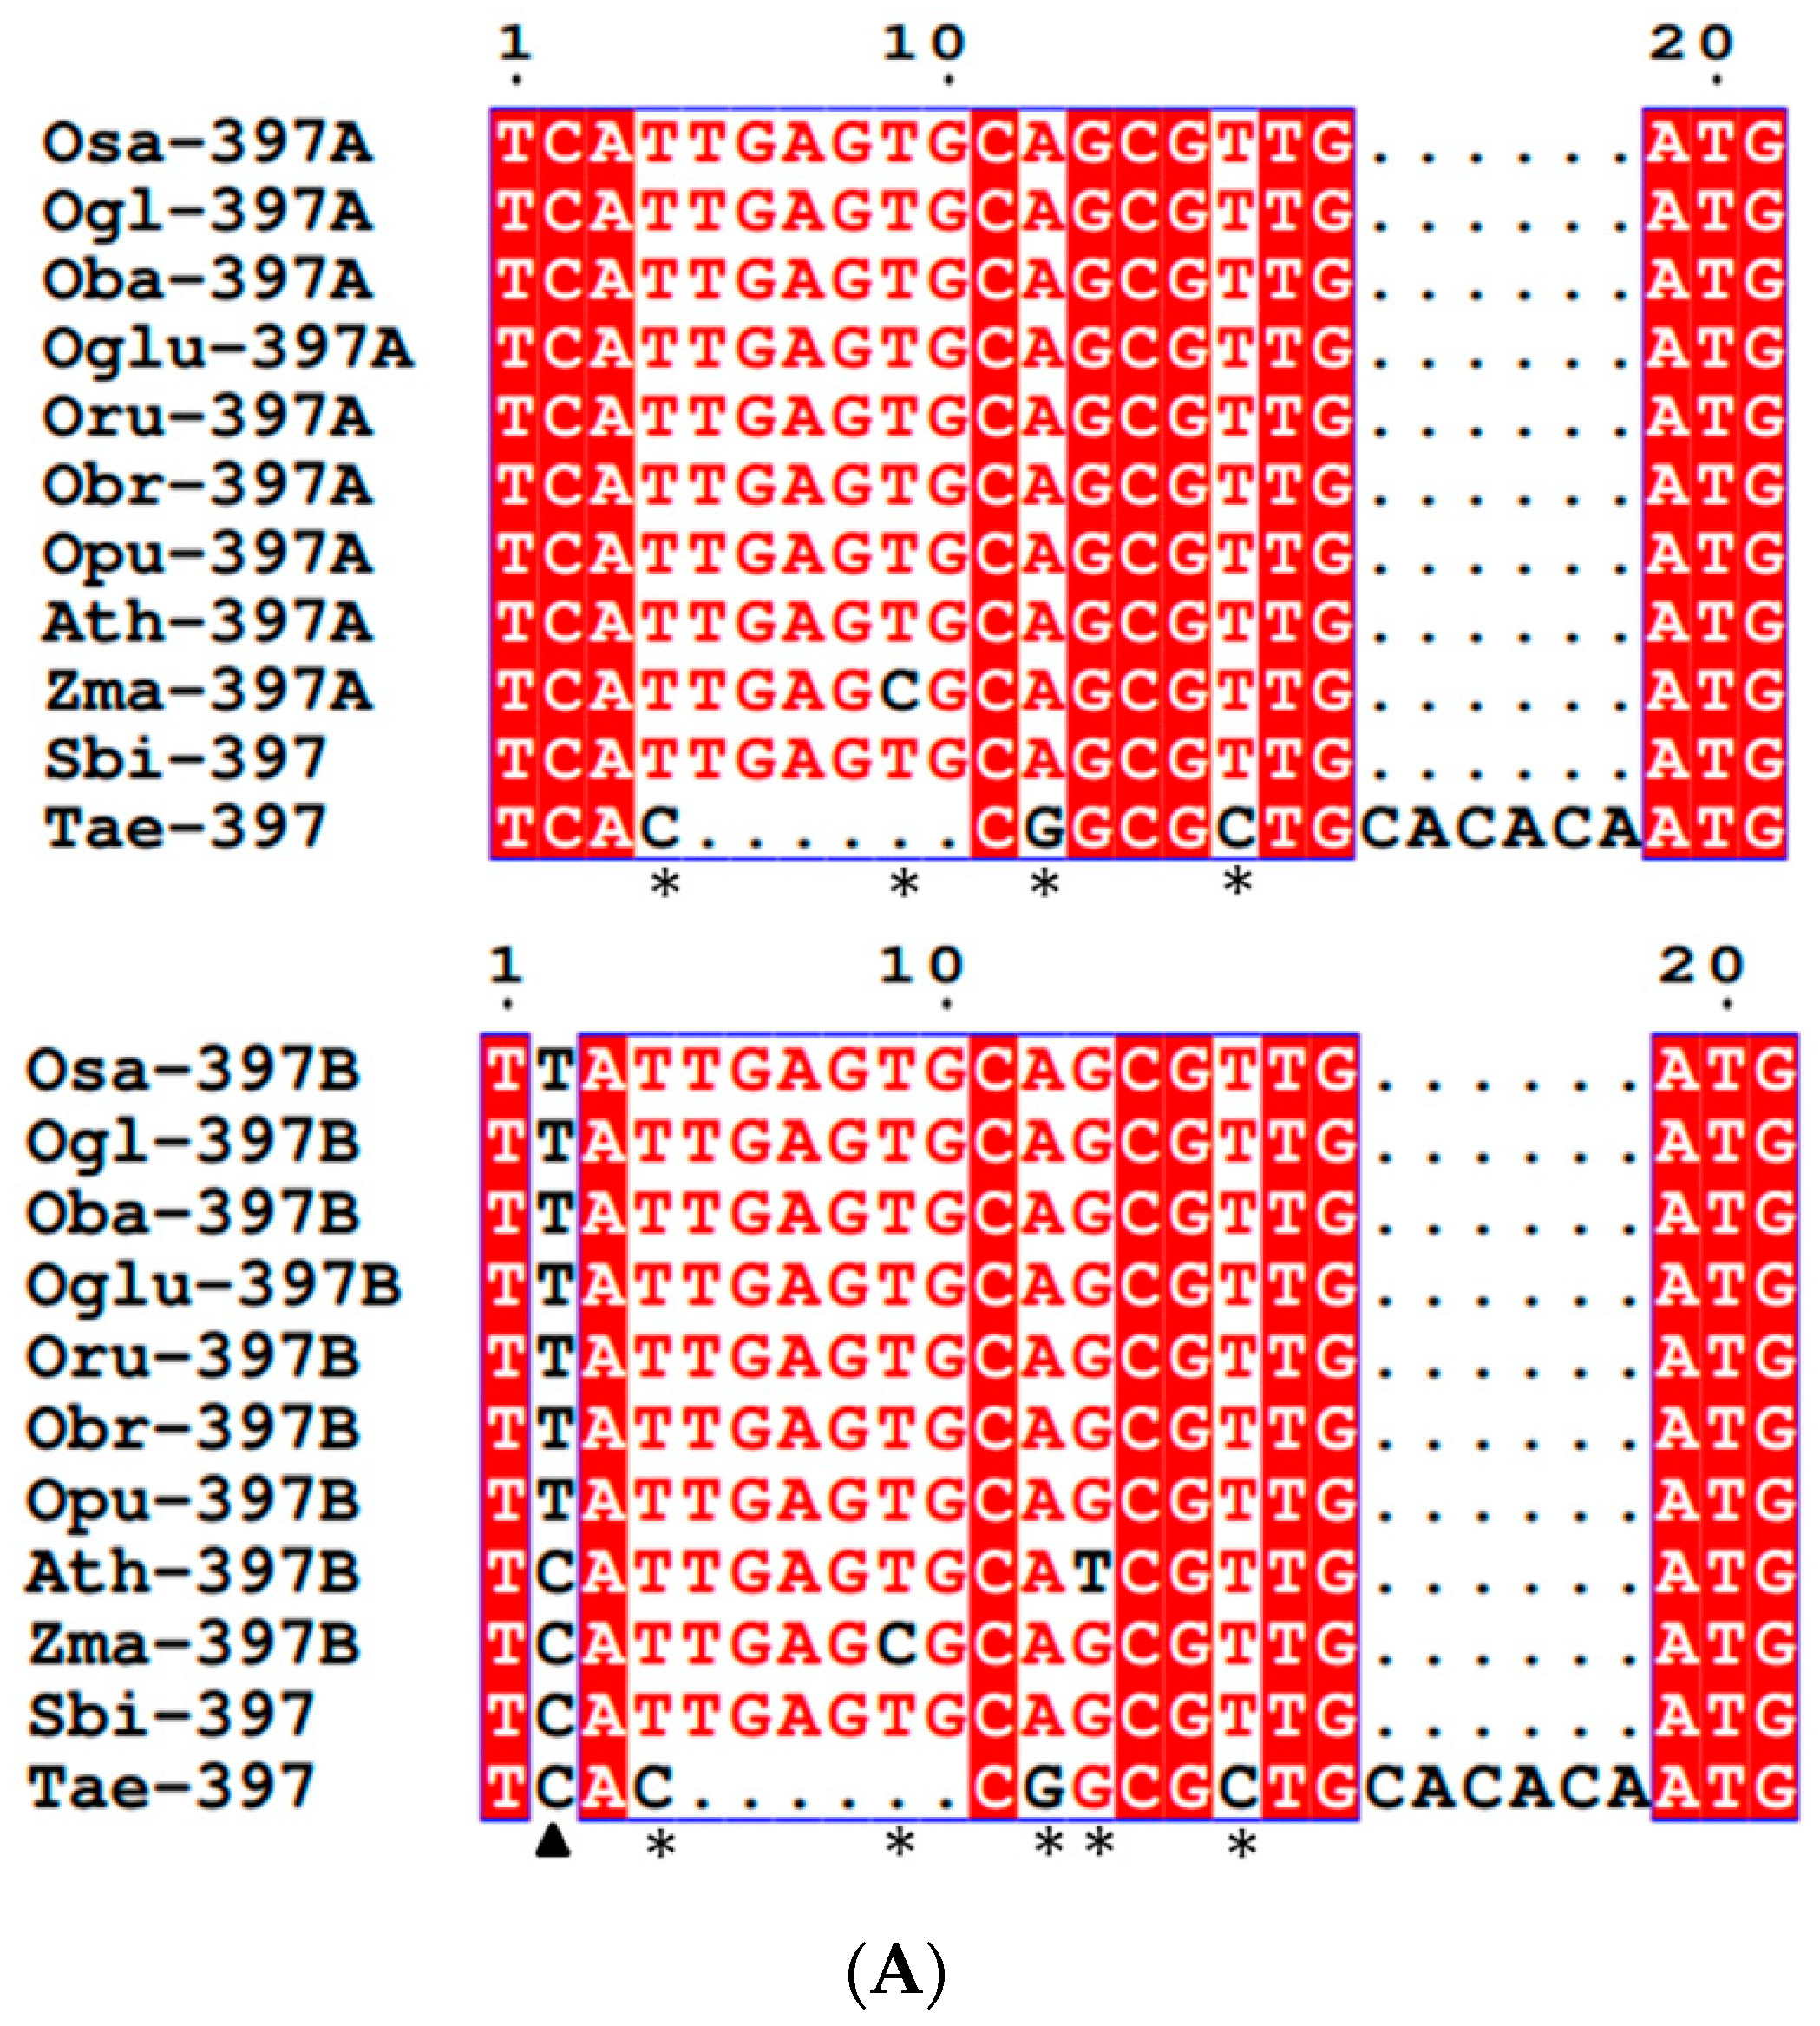
3.2. Conservation and Divergence in Mature and Precursor MIR397 and MIR408

To understand the extent of conservation/diversification between MIRNA homologs of different plants, the analysis of precursor and mature MIR397 and MIR408 sequences across different species of poaceae was performed. The multiple sequence alignment of mature sequences revealed that mature MIRNA of O. sativa and its six wild relatives under study was highly conserved. Mature MIR397A alignments showed that the mature RNA of all poaceae members and Arabidopsis was highly conserved, except for Z. mays and T. aestivum. In Zma-MIR397A, a Single-Nucleotide Polymorphism (SNP) occurred where T was replaced with C at the 9th position. In the case of wheat, multiple substitutions at the 4th (T→C), 12th (A→G), and 16th (T→C) positions along with deletions (5th to 10th position) and insertions (between the 16th and 17th positions) were observed (Figure 2A). Mature MIR397B alignments showed that the mature RNA of all Oryza spp. was highly conserved. Nevertheless, in all the non-Oryza spp., viz., Sorghum, maize, and wheat, and in non-poaceae member Arabidopsis, a base substitution at the 2nd position (T→C) was observed. Additionally, in Arabidopsis and maize, a second base substitution at the 13th (G→T) and 9th (T→C) positions, respectively, were also observed. In the case of wheat, multiple substitutions at the 4th (T→C), 12th (A→G), and 16th (T→C) positions along with deletions and insertions were observed (Figure 2A). Contrastingly, mature MIR408 in all the poaceae members under study was found to be highly conserved. However, a genome-specific SNP where C was replaced with T was observed at the 1st position in Arabidopsis (Figure 2B).
The results of multiple sequence alignments for the conservation/divergence of MIRNA genes revealed that unlike mature MIRNA sequences, there were multiple instances of genome-specific deletions and substitutions in the case of precursor MIRNA sequences. In the precursor sequence of MIR397A, a species-specific single-nucleotide substitution was observed in O. glumaepetula and O. rufipogon at 57th position, where T was replaced with G, and in the 60th position, where G was replaced with C, in all rice species. In Sorghum, nucleotide polymorphism was also observed at the 33rd (A→G), 35th (A→C), 37th (C→G), and 38th (G→C) positions. In Z. mays, a genome-specific substitution at the 19th (T→C) position was observed along with six consecutive polymorphic sites at the 33rd (A→T), 34th (C→G), 35th (A→C), 36th (A→G), 37th (C→G), and 38th (G→A) positions. In T. aestivum, a genome-specific substitution was observed at the 11th position, where T was replaced with C. Other nucleotide polymorphic sites were also identified at the 35th (A→C), 36th (A→G), 37th (C→T), and 38th (G→C) positions. In the case of Arabidopsis, a genome-specific substitution was found at the 32nd position, where A was replaced with T. Five other polymorphic sites at the 34th (C→A), 35th (A→T), 36th (A→T), 37th (C→T), and 38th (G→ C) positions were also observed. Many deletions were also observed in all the species under study (Figure S1A).
In the precursor sequence of MIR397B, there was a specific single-nucleotide substitution at the 12th position, where “T” was present in all rice species, while in Sorghum, maize, wheat, and Arabidopsis, “C” was present. A single-nucleotide substitution was also observed at the 19th (T→C), 33rd (A→G), 36th (T→C), and 41st (G→C) positions in Z. mays. Similarly, a single-nucleotide substitution was also observed at the 33rd (A→G), 36th (T→C), and 39th (C→T) positions in Sorghum. A specific substitution in wheat at the 11th position where “T” was replaced with “C” was observed along with two consecutive substitutions at the 36th (T→G), 37th (G→T), 40th (G→T), and 41st (G→A) positions. In Arabidopsis, an SNP was observed at the 23rd (G→T) and 32nd (A→T) positions, with six consecutive polymorphic sites at the 36th (T→A), 37th (G→T), 38th (C→T), 39th (C→T), 40th (G→T), and 41st (G→A) positions. Many other specific substitutions were also observed in MIR397B across the genera and species (Figure S1B).
In MIR408 precursor sequences, a specific SNP was observed in Sorghum at the 146th position where “C” was replaced with “T”. Multiple instances of single-base substitutions were observed in Arabidopsis MIR408 precursor sequence at the 144th (C→T), 145th (T→C), 146th (C→T), 148th (C→T), 149th (T→A), and 153rd (C→A) positions (Figure S2).

3.3. Selection Pattern of Sequence Variation

The test of neutrality of sequence polymorphisms for the MIRNA genes of poaceae was performed on three different MIRNA loci using Tajima’s D [49] and Fu and Li’s F [50] tests. The values of Tajima’s D as well as Fu and Li’s F were calculated for each of the three MIRNA loci (pre-miRNAs), and all three loci showed non-significant negative values for both the tests. Among the three pre-MIRNAs examined across 10 poaceae species, MIR397B showed the least negative but non-significant Tajima’s D value (−0.93693), followed by MIR397A (−1.47438). MIR408 showed the most negative but non-significant Tajima’s D value (−1.63248). Consistent with Tajima’s D value, Fu and Li’s F values were also non-significantly negative. The least negative Fu and Li’s F value was observed for MIR397B (−0.68979), followed by MIR397A (−1.41459), with the value for MIR408 being the most negative (−1.91854). The nucleotide diversity among the studied poaceae species varied from 0.03444 at pre-MIR408 locus to 0.12208 at pre-MIR397A locus and 0.12545 at pre-MIR397B locus. The non-significant values of calculations and data presented for the test of neutrality are provided with details in Supplementary Figures S3–S8 These results indicated that the variations in selection pressure experienced by cultivated varieties during improvement and WGD events experienced by non-Oryza species might be responsible for sequence polymorphism at different MIRNA loci.

3.4. Gene Content and Gene Density Analysis

Gene content and gene density analyses of the 100 kb regions harboring MIR397 and MIR408 genes were predicted using ab initio methods of gene prediction, FGENESH, using O. sativa subspecies indica whole genome as reference for Oryza spp., and the respective whole genomes were used as reference for Z. mays, S. bicolor, T. aestivum, and Arabidopsis. The predicted genes were annotated with Blast2go (B2G) for functional annotation and revealed the presence of 32 genes in the 100 kb region harboring MIR397A in O. sativa indica (Table 3.). Gene content and gene density analyses of 100 kb segments of eleven different genomes revealed that the highest percentage of O. sativa homologs were conserved in O. rufipogon (74.19%), and the lowest conservation of genes was observed in S. bicolor, Z. mays, and T. aestivum (0%, i.e., complete loss of conservation) (Figure 3A).
Similarly, zero-percent conservation of O. sativa homologs was also observed in Arabidopsis. Additionally, the gene density analysis revealed the maximum gene density in T. aestivum 6A (1 gene/2.941 kilobases), while the minimum density of genes was observed in S. bicolor (1 gene/5.88 kilobases) (Figure 3B).
The gene content analysis of MIR397B identified the presence of 18 genes in the 100 kb region harboring MIR397B in O. sativa subsp. indica (Table 3). The highest percentage of O. sativa homologs was found to be conserved in O. rufipogon (68.75%), while the lowest percentage of conservation was found in O. brachyantha (33.3%), S. bicolor (0%), and Z. mays (0%), followed by T. aestivum (0%, i.e., complete loss of conservation) (Figure 3A). A zero percent (0 %) conservation of O. sativa homologs was also noted in Arabidopsis. The gene density analysis revealed the maximum gene density in T. aestivum 6A (1 gene/ 2.941 kilobases), while the minimum density of genes was observed in O. punctata (1 gene/7.14 kilobases) (Figure 3B).
Similarly, gene content and density analyses were carried out for MIR408 in all the plants. Out of 21 genes identified in the 100 kb region harboring MIR408 in O. sativa subsp. indica (Table 3), the highest percentage of O. sativa homologs was found to be conserved in O. rufipogon (44.44%), while the lowest conservation was observed in O. brachyantha (0%), O. punctata (0%), S. bicolor (0%), and Z. mays (0%), followed by T. aestivum (0%, i.e., complete loss of conservation) (Figure 4A). A zero percent (0%) conservation of O. sativa homologs was also noted in Arabidopsis. Similarly, the maximum gene density was found in T. aestivum (1 gene/3.22 kilobases), while the minimum density of genes was observed in Z. mays (1 gene/7.69 kilobases) (Figure 4B).

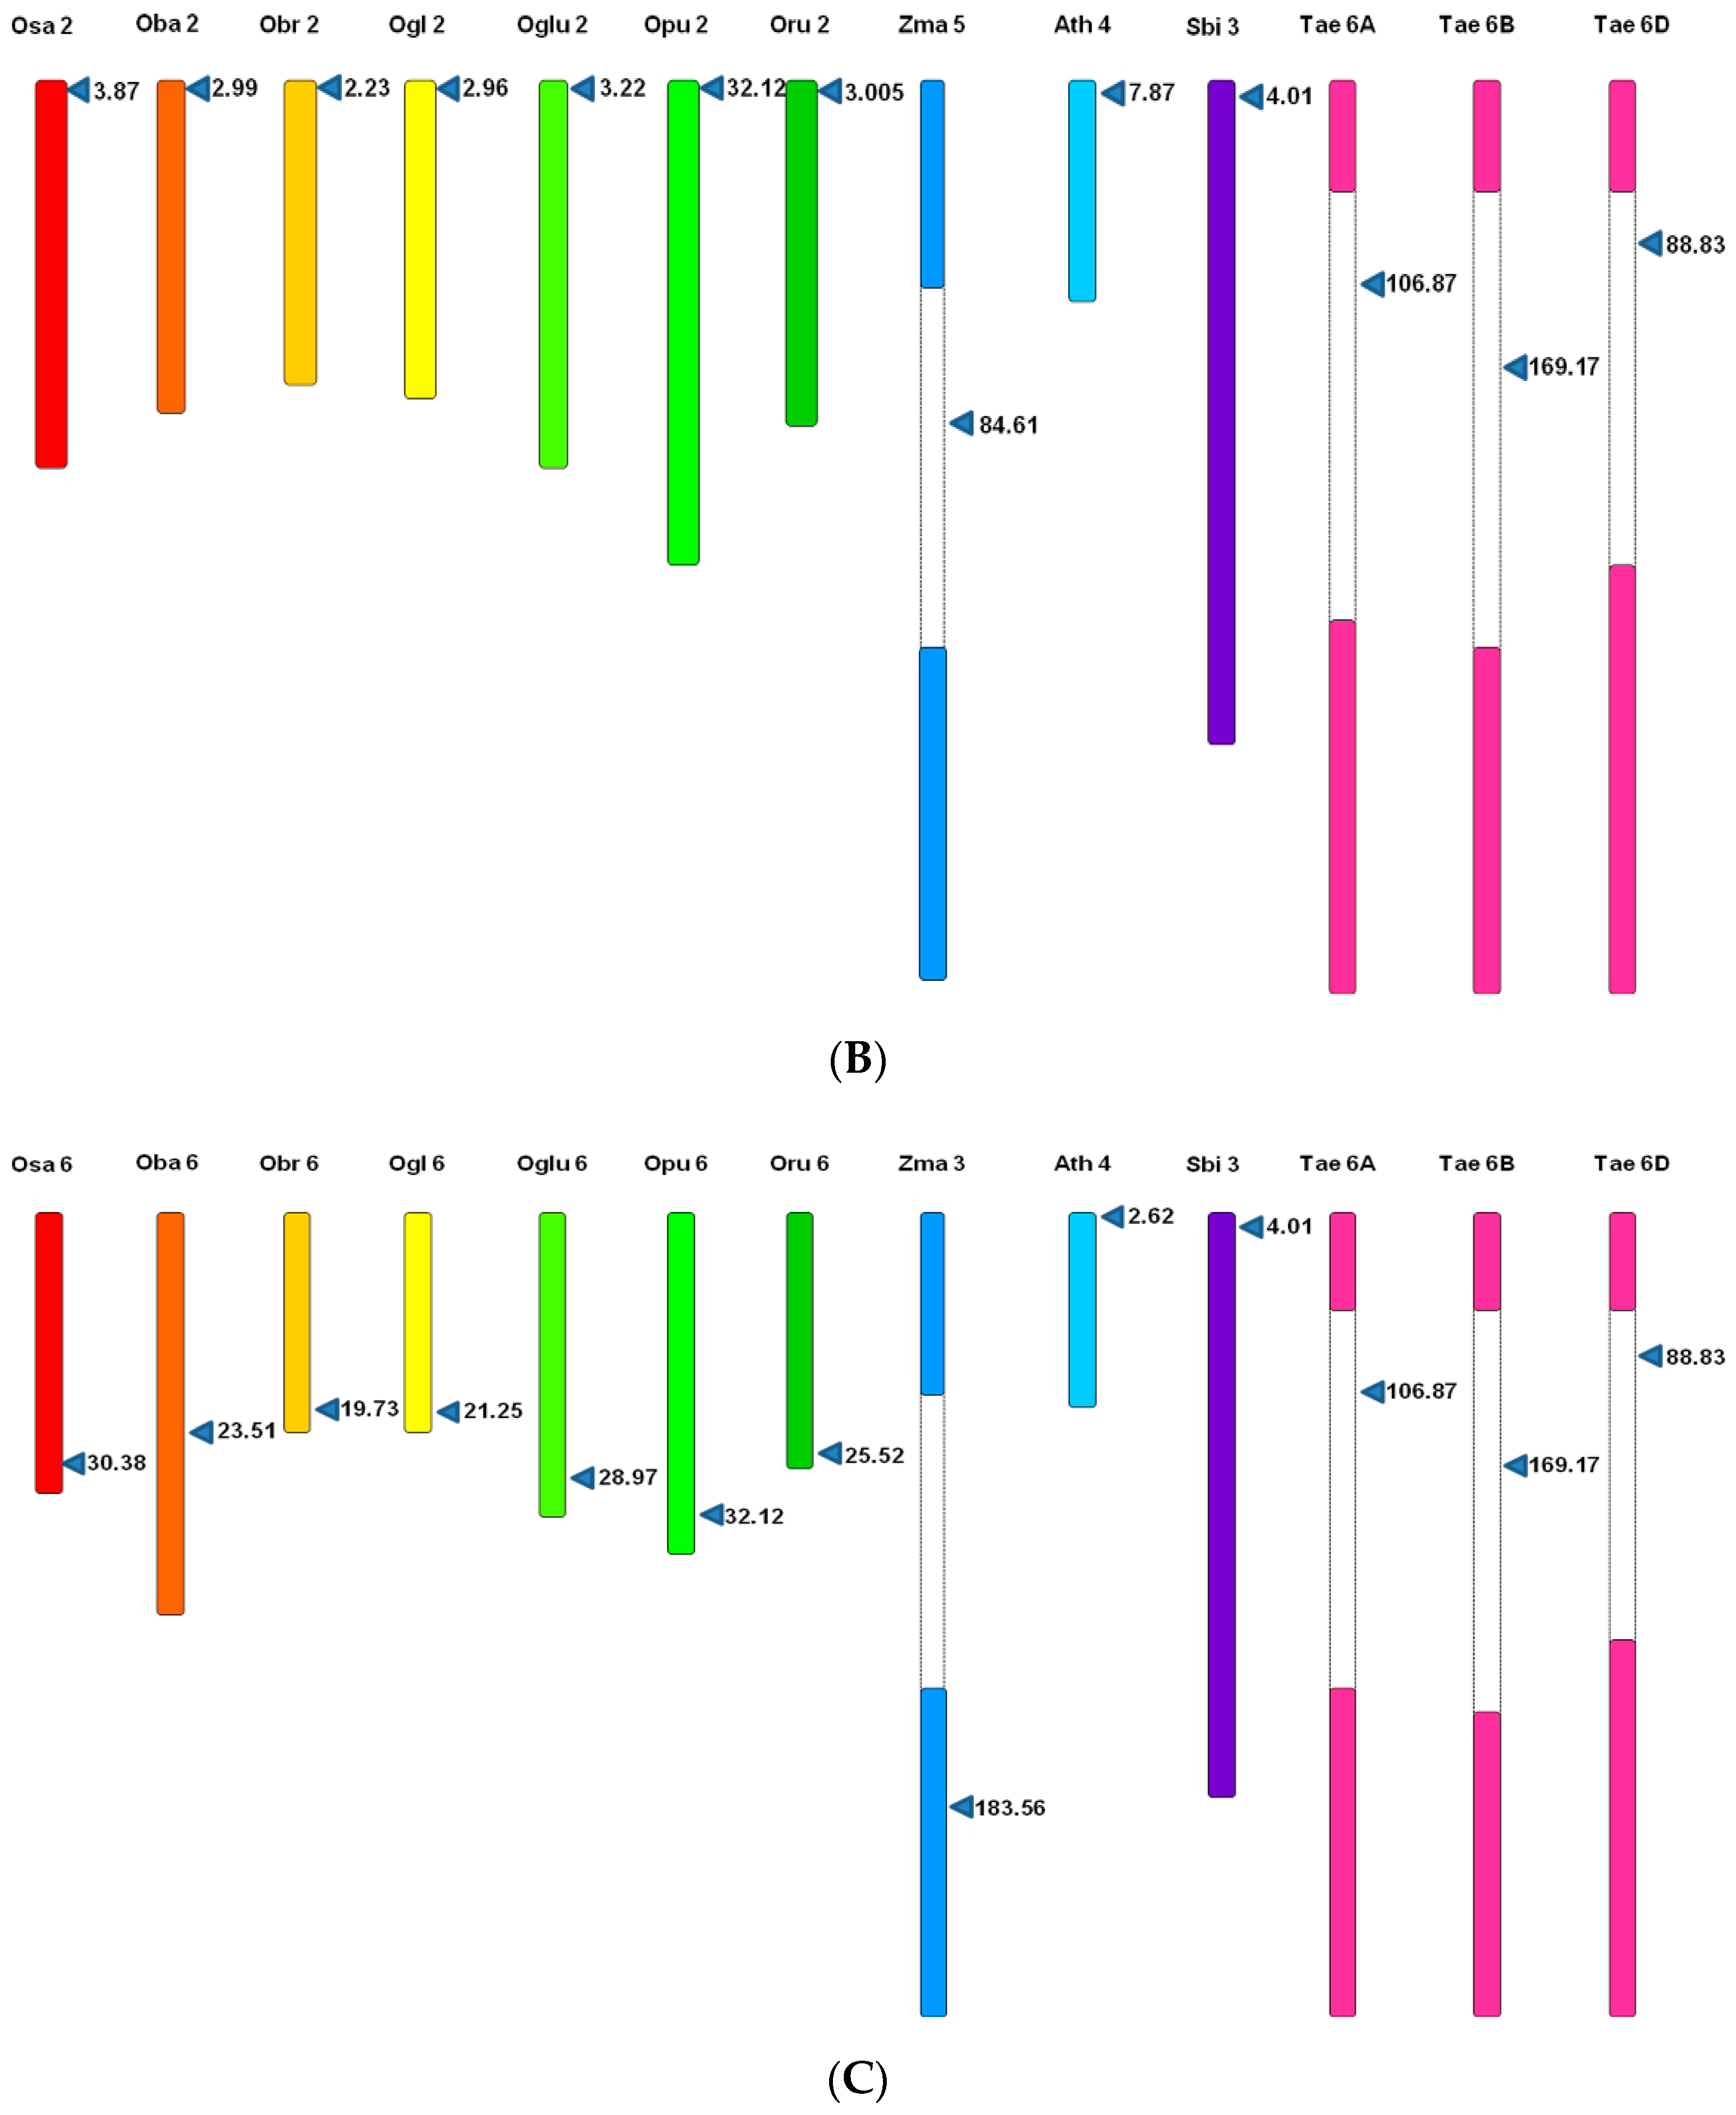
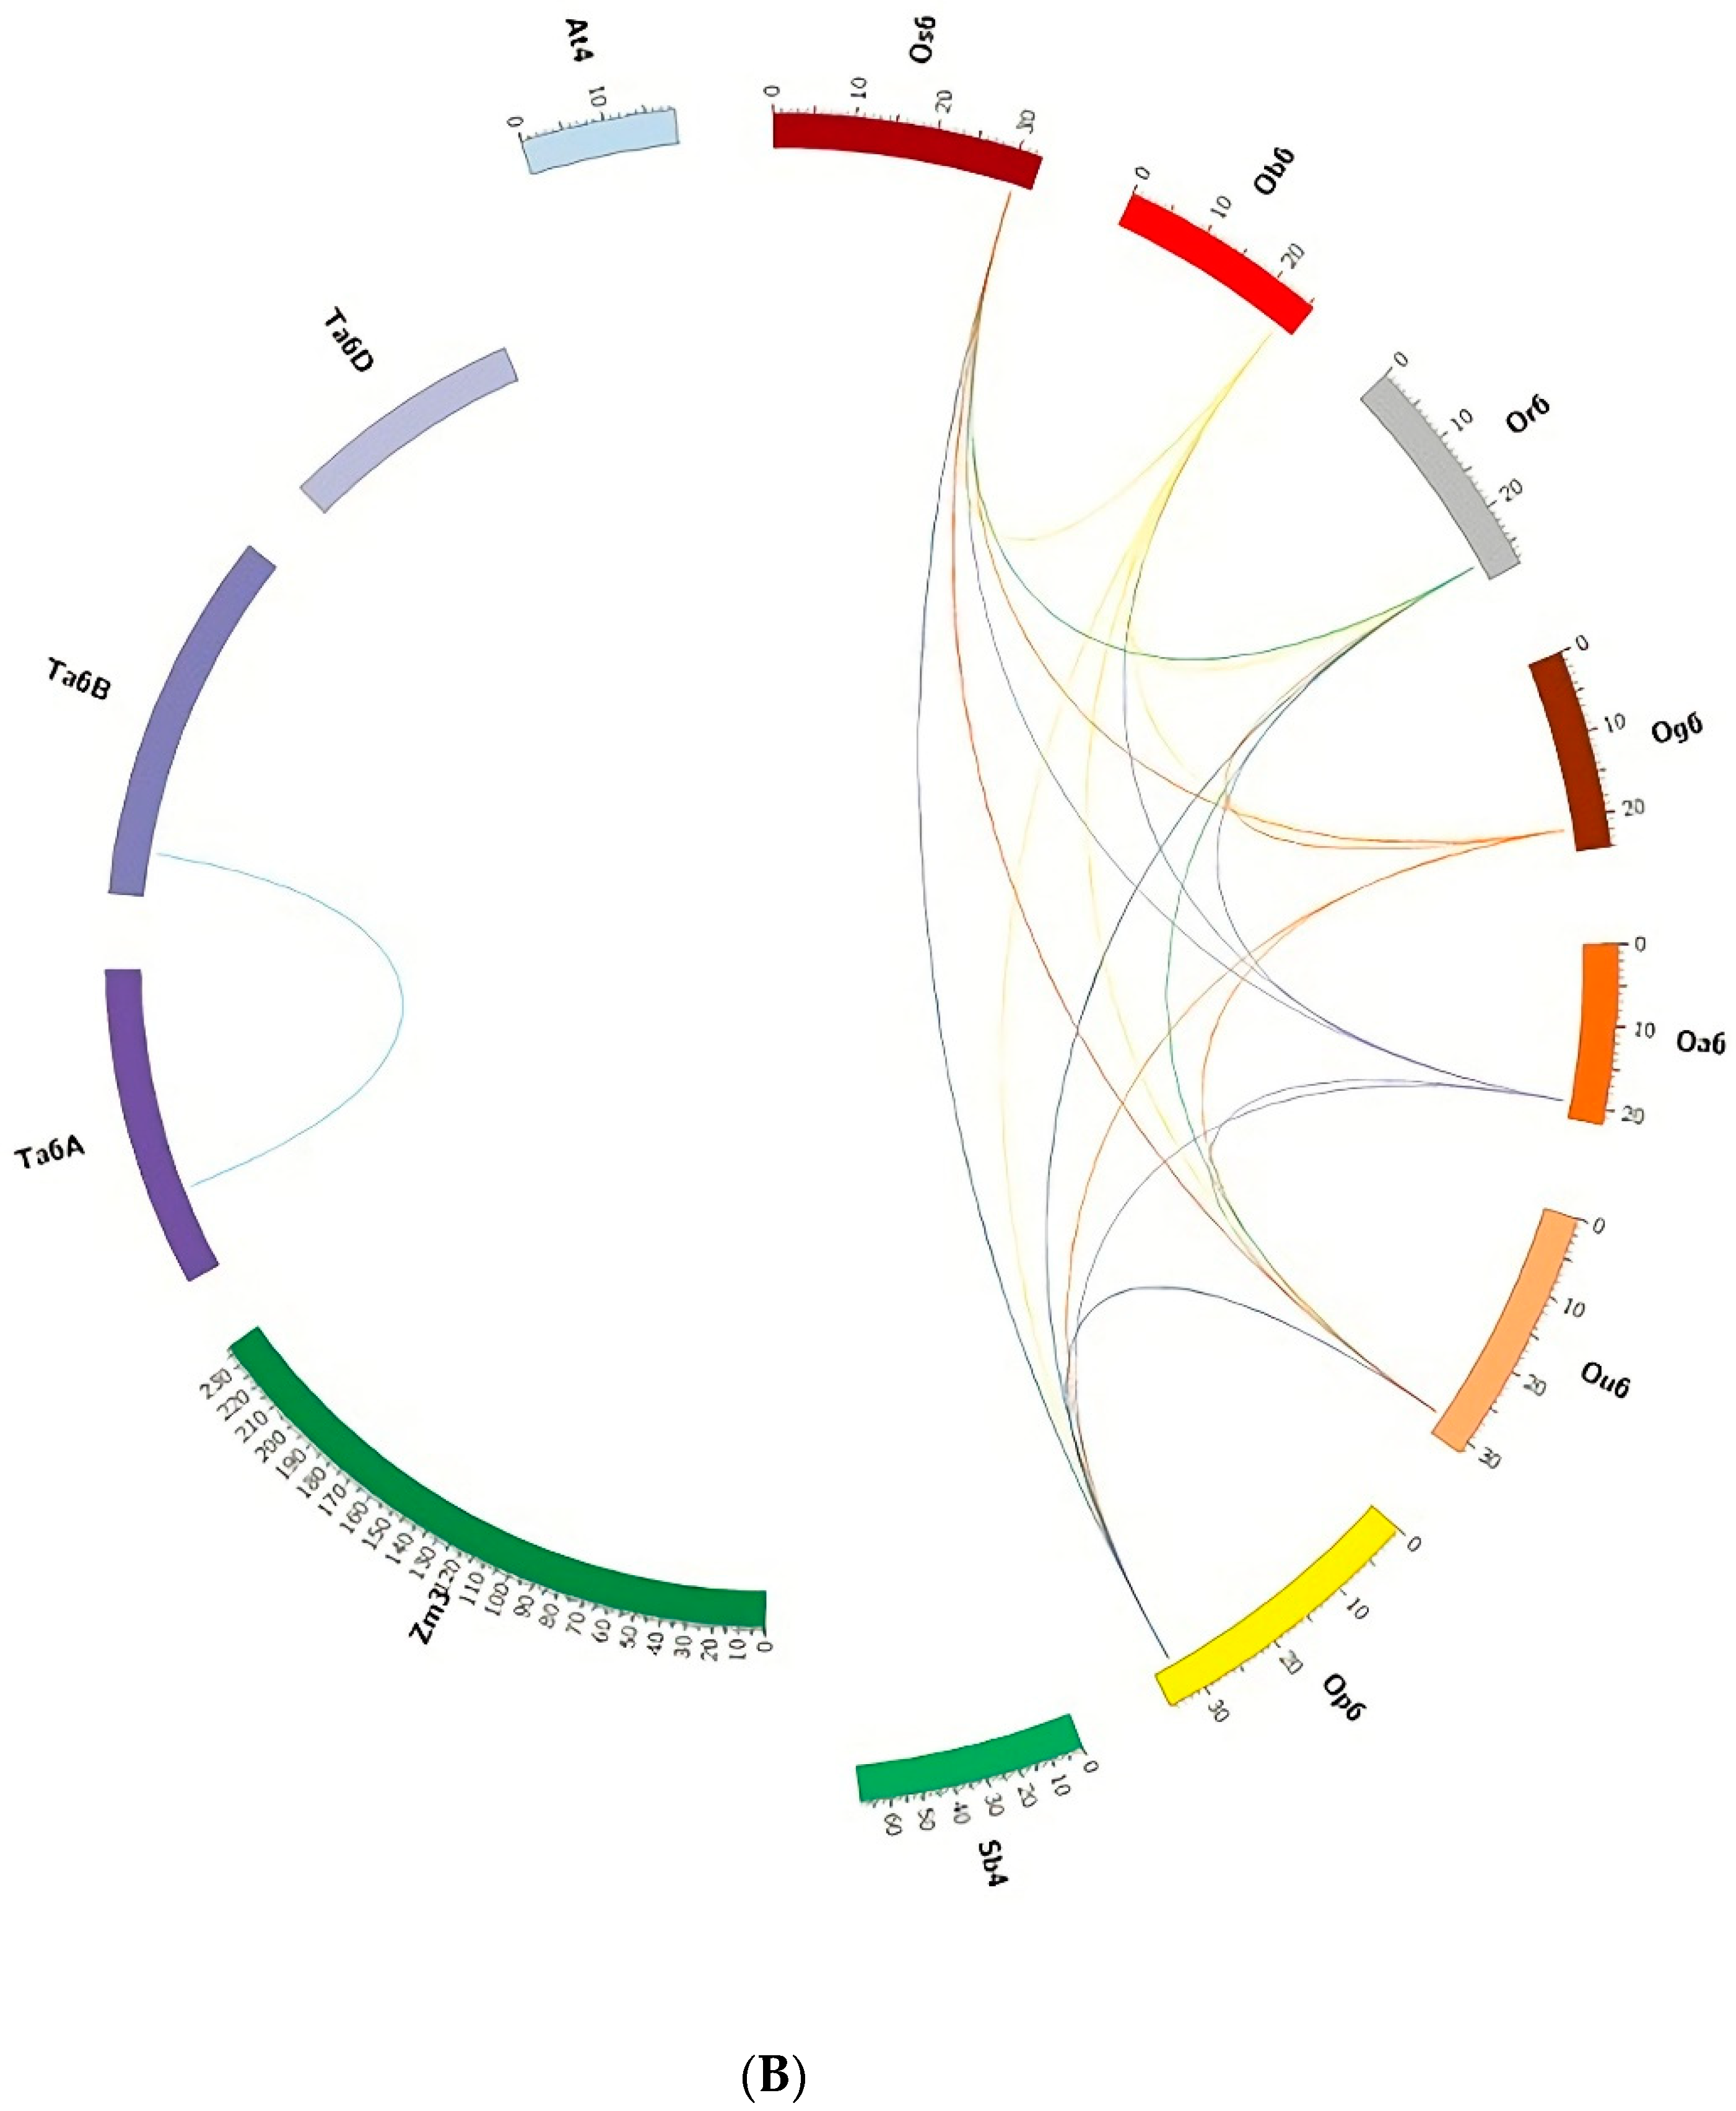
3.5. Microsynteny Analysis

The understanding of gene evolution has been simplified in the recent years with the advances in techniques/algorithm/software for collinear ortholog detection. The frequency of chromosome rearrangement (or inversely the order of gene conservation) can be revealed by comparing collinear orthologs amongst all orthologs. For synteny or collinearity detection, the effective identification of collinear gene pairs through the construction of collinear blocks is essential. Collinear blocks contain anchor genes (located at collinear positions) and non-anchor genes (which have experienced gene gains, losses, or transposition). For the inter-species synteny block analyses of MIRNA, a total of 339 genes for MIR397A, 270 for MIR397B, and 239 for MIR408 were analyzed through McscanX, taking O. sativa as the reference genome. Out of 339 genes predicted in the 100 Kb segment surrounding MIR397A, 163 genes were found to be collinear. Similarly, out of 270 genes predicted in the 100 Kb segment surrounding MIR397B, 135 genes were found to be collinear, while out of 239 genes predicted in the 100 Kb segment surrounding MIR408, 84 genes were found to be collinear. The alignment among non-anchor genes was discarded in the output and was denoted by “||” in the multi-alignment of gene orders. The microsynteny analyses were based on synteny blocks or collinearity blocks constructed using O. sativa as the reference genome. Since other genomes can alternatively be used as the reference genome to develop saturated synteny blocks depending on the choice of species for evolution research, we explored the collinearity blocks with other genomes as reference for each MIRNA (Figures S9–S38).

3.5.1. (I) MIR397A

Out of 32 genes identified in the 100 kb region surrounding MIR397A in O. sativa, G-type lectin S-receptor-like serine/threonine-protein kinase At2g19130 was found to be conserved in all six rice species. Other O. sativa orthologs, viz., 50S ribosomal protein L-24 chloroplastic, Putative anthocyanidin reductase isoform X, and Beta-glucosidase 25 isoform X1, were found to be conserved in O. punctata, O. glumaepetula, O. rufipogon, O. barthii, and O. brachyantha. Wound responsive family protein was present in all Oryza spp., except for O. brachyantha. In O. sativa, orthologs such as Calcium binding protein PBP1-like and Armadillo/beta-catenin repeat protein like were conserved in O. punctata, O. glumaepetula, O. rufipogon, and O. barthii. Another gene, Serine/arginine repetitive matrix protein 1-like, was present in all Oryza spp., except for O. brachyantha and O. punctata; External alternative NAD (P) H-ubiquinone oxidoreductase B1, mitochondrial, was present in all Oryza spp., except for O. brachyantha and O. barthii; and Hypothetical protein OsI_24220 was present in all Oryza spp., except for O. brachyantha and O. glumaepetula. In O. sativa, orthologs (viz., Retro-transposon protein, putative, uncharacterized; DDIA protein like and Retro-transposon protein, putative; and Ty1-copia subclass) were conserved in O. rufipogon, O. barthii, and O. glaberrima. Similarly, O. sativa ortholog, Hypothetical protein DA122_O6g257503, was conserved in O. glumaepetula, O. rufipogon, and O. barthii while, Hepta-helical trans-membrane protein ADIPOR2-like was conserved in O. glumaepetula, O. rufipogon, and O. glaberrima. Hypothetical protein OsI_24221 was conserved in O. rufipogon and O. glaberrima; HGWP repeat containing like protein was only conserved in O. glaberrima, and Hypothetical protein OsI_24222 was only conserved in O. glumaepetula. So, from O. sativa to its wild relatives, to distantly related poaceae species, and further to non-poaceae dicot species, the overall microsynteny of the 100 kb regions was gradually lost. The conservation was completely lost in S. bicolor, Z. mays, and T. aestivum 6D, with no O. sativa homologs present in the 100 kb regions (Figure 5A,B).

3.5.2. (II) MIR397B

The conservation of microsynteny in the 100 kb region surrounding MIR397B was explored amongst only six Oryza species, including O. sativa, O. punctata, O. glumaepetula, O. rufipogon, O. barthii, and O. glaberrima, as a complete loss of microsynteny was observed in O. brachyantha, along with non-Oryza species Sorghum, Z. mays, and Triticum, and non-poaceae species Arabidopsis. A total of 18 genes were detected in the 100 kb region harboring MIR397B in O. sativa, out of which CBL-interacting protein kinase 26, Protein suppressor of K+ transport growth defect1, Armadillo/beta-catenin repeat protein like, and uncharacterized protein LOC_9267626 genes were found to be conserved in all six Oryza species, except for O. brachyantha. Another gene, Myosin-1-isoform XI, was conserved in all Oryza spp., except for O. brachyantha and O. glumaepetula. Similarly, F-box protein At2g39490, Sugar transport protein like, and Hypothetical protein EE612-009014 genes were conserved in all Oryza spp., except for O. brachyantha and O. rufipogon. No O. sativa homologs were found to be conserved in S. bicolor, Z. mays, T. aestivum, and Arabidopsis, indicating a complete loss of microsynteny (Figure 6, Figure S39).

3.5.3. (III) MIR408

The exploration of the microsynteny in the 100 kb region surrounding MIR408, revealed that the conservation was only conducted amongst five Oryza species, including O. sativa, O. glumaepetula, O. rufipogon, O. barthii, and O. glaberrima, as a complete loss of microsynteny was observed in O. brachyantha and O. punctata. A total of 21 genes were detected in O. sativa, out of which Suppressor of mec-8, uncharacterized-57 protein homolog 1, Probable receptor-like protein kinase At5g18500, and Hypothetical proteins OsI_01640 and OsI_01531 were conserved in four Oryza spp., namely, O. glumaepetula, O. rufipogon, O. barthii, and O. glaberrima. Another gene, Hypothetical protein OsI_01641, was conserved in O. rufipogon, O. barthii, and O. glaberrima. No O. sativa homologs were found to be conserved in S. bicolor, Z. mays, T. aestivum, and Arabidopsis, indicating a complete disruption of microsynteny (Figure 7, Figure S40).

3.6. Phylogenetic Analysis

To study the diversity of MIR397 and MIR408 within poaceae, the ML phylogenetic tree with a 1000 bootstrap value was constructed for the 22 MIR397 and 12 MIR408 precursor and promoter (500 bp) sequences in O. sativa and its six wild relatives, S. bicolor, Z. mays, and T. aestivum. The Arabidopsis MIRNA sequence was also included in the study as an outlier. Based on ML (maximum likelihood) tree, MIR397 sequences clustered into two clades, Clade-I MIR397A and Clade-II MIR397B, with a bootstrap value ranging from 0.277 to 1.00. All seven Oryza species MIR397A together formed Clade-I (Figure 7). Similarly, Clade-II, representing MIR397B, formed (i) Sub-clade-II (A) in Oryza species, while in Z. mays (Zma-MIR397B) and S. bicolor, it formed (ii) Sub-clade-II (B), and in T. aestivum, along with Zea mays, MIR397A formed (iii) Sub-clade-II (C) (Figure 8A). This suggested that MIR397A and MIR397B were formed in poaceae as a result of a duplication event.
MIR408 sequences clustered into two distinct clades, Clade-I and Clade-II, with a bootstrap value ranging from 0.155 to 0.968, while MIR408 in all seven Oryza species, Sorghum, and Triticum together formed Clade-I, and both homologs of MIR408, i.e., MIR408A and MIR408B, in Z. mays, together with Arabidopsis MIR408, formed Clade-II (Figure 8B). This indicated that MIR408 in poaceae share a common evolutionary descent, with Z. mays as an exception.

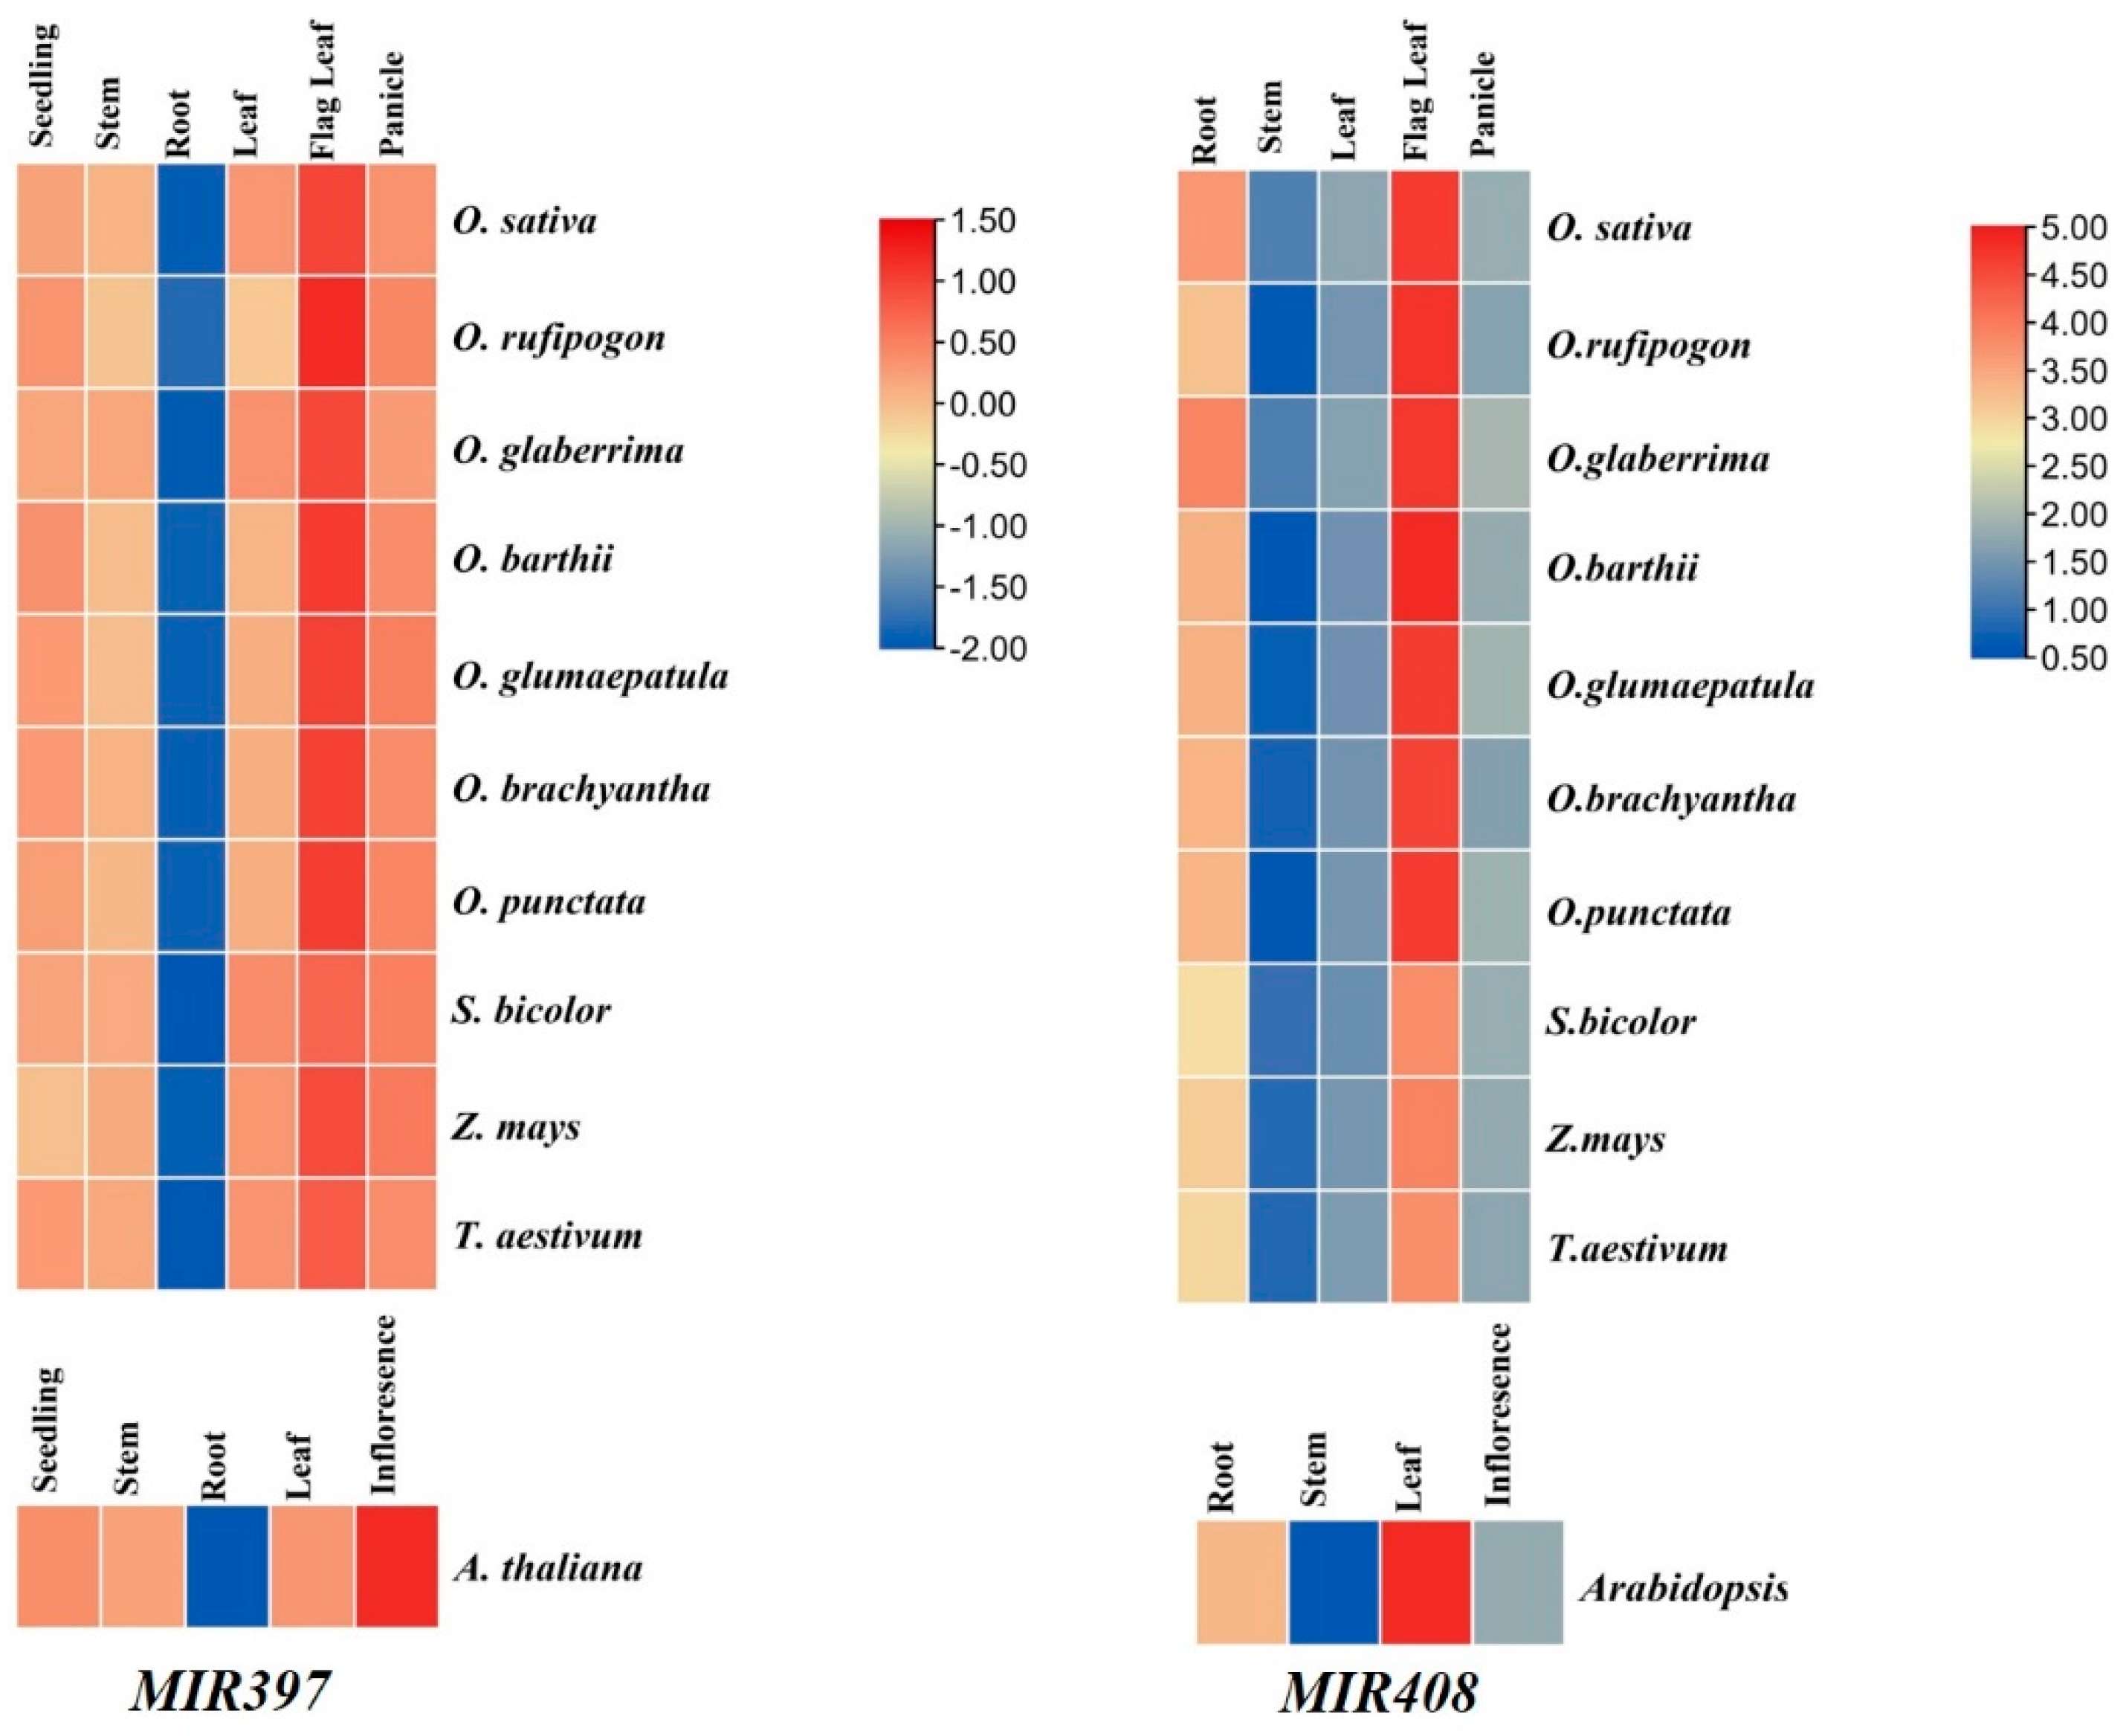
3.7. Expression Analysis of MIR397 and MIR408 in Tissue-Specific Manner

To know the variation in the responsiveness of MIR397 (cumulative expression of MIR397A and MIR397B) and MIR408 in ten different poaceae species, the expression profiles of MIR397 and MIR408 were generated in a tissue-specific manner. Seedling, stem, root, leaf, flag leaf, and panicle tissues were used for generating the expression profiles. The highest abundance of MIR397 and MIR408 was observed in the flag leaf (indicating the transition from crop growth to grain production) (25.97-fold for MIR397 and 26.37-fold for MIR408), and the lowest expression was observed in vegetative tissues such as root tissue in the case of MIR397 (0.517-fold) and stem tissue in the case of MIR408 (0.531-fold). The unusual high expression of MIR397 was restricted to wild species of rice and was not observed among cultivated rice lines and other poaceae members (Figure 9).

4. Discussion

Information on synteny and collinearity is important in unravelling the evolutionary history of genomes and gene families for the identification of functionally linked genes. Syntenic blocks, also referred to as collinearity blocks, reflect conserved gene orders/patterns across the genomes [59]. They are identified through the homology analysis of the genomes at the micro- or macrosynteny levels. Synteny comparisons between closely related eukaryotic species revealed that homologous genes were retained on the corresponding chromosomes [60]. In a collinear block, anchor genes are more likely to be homologous [61] and tend to be the subject of a stronger purifying selection than non-anchor genes [62]. One aspect of genome-wide comparative genomics through synteny analyses is the identification of the pattern of the genomic segments of orthologs among different species. This is helpful in understanding the evolutionary processes that lead to diversification of chromosomes and structural lineages among different species [63,64].
Studies related to genome evolution patterns, structural analyses of genomes, and their comparison with different species have gained impetus due to recent advances in comparative genomics [65]. The availability of whole-genome data for poaceae members such as Oryza spp., Z. mays, S. bicolor, T. aestivum, and other grasses has contributed to understand the underlying evolutionary pattern in these plants [66]. In this study, we compared the 100 Kb genomic segment surrounding MIR397 and MIR408 homologs to study the pattern of genome evolution around this locus. Taking O. sativa (2n = 24) as a reference genome, six wild relatives of rice, namely, Oryza glaberrima (2n = 24, AA), O. rufipogon (2n = 24, AA), O. punctata (2n = 24, BB), O. glumaepetula (2n = 24, AA), O. barthii (2n = 24, AA), and O. brachyantha (2n = 24, FF), along with three non-Oryza but poaceae members—(i) Z. mays (2n = 20), (ii) S. bicolor (2n = 20), and (iii) T. aestivum (2n = 42)—and one non-poaceae genus, Arabidopsis, were included to study the contrasting patterns of evolution of two important MIRNA controlling abiotic stress response. The genus Oryza consists of 22 wild and 2 domesticated species that represent six diploid (A, B, C, D, F, G) and four allopolyploid genomes (BC, CD, HJ, and HK) [67,68]. The gamut of genome diversification in rice offers a unique system for studying the evolution and structural rearrangements of important regulatory genes/MIRNAs during evolution from a common ancestor [69]. The microsynteny analyses of MIR397 and MIR408 across the genomes of these ten poaceae and one dicot provided insights into the structural organization of both MIRNAs, gene density, gene organization, the dynamics of gene evolution through substitution or through lineage-specific gene deletions, and de novo gene formation [70].

4.1. Conservation in Mature MIRNAs

MIRNAs are known to play important roles in development, metabolism, cell cycle, differentiation, and stress response in plants by regulating the target gene expression via post-transcriptional gene silencing, via the repression or cleavage of mRNAs by small RNAs [71]. The multiple sequence alignment of mature MIR397 and MIR408 sequences revealed that the mature MIRNA of all the seven Oryza species were highly conserved amongst themselves and reconfirmed the report that MIR397 and MIR408 belong to families of highly conserved MIRNAs [14,23]. However, in the mature region of Tae-MIR397, substitutions at 4th (T→C), 12th (A→G), and 16th (T→C) positions, along with deletions and insertions, were observed. Similarly, single-nucleotide substitutions were also observed in Zma-MIR397A, Zma-MIR397B, and Ath-MIR397B (Figure 2A). Similarly, the mature region of MIR408 was also highly conserved, except for an SNP, in Arabidopsis (Figure 2B). MIRNA transcripts have certain structural and characteristic features that are necessary for the expression of correct mature MIRNA sequences. So, a variation in the sequence influences the expression and functionality of MIRNAs and consequently results in the differential regulation of the target genes [72]. Previous studies revealed that MIRNA genes have lower SNP density than the flanking region. Moreover, within the MIRNA gene, the mature sequence has less SNPs than the precursor region [73,74]. Our results of multiple sequence alignment revealed the same, as we observed fewer SNPs in mature MIRNA sequences in comparison to precursor sequences. SNPs have different impacts on the functionality of MIRNAs; like, variations in miRNA promoter regions and other regulatory regions may result in an altered transcription rate, whereas variations in the splice sites of the host gene (for intronic miRNAs) or of the poly-cistron (clustered miRNAs) can result in aberrant expression patterns. Further, variations within the MIRNA transcript can have an effect on MIRNA maturation, and altered processing accuracy or to a changed frequency of alternative cleavage sites of biogenesis enzymes. They can also lead to altered strand loading bias in RISCs [72]. Owing to the potential impact of these genetic variations on the functionality of MIRNAs, these SNPs need to be studied in further detail to identify their potential role.

4.2. Evolution of MIR307 and MIR408

Our study revealed the presence of single-nucleotide substitutions in Arabidopsis in almost all MIRNA precursor sequences under investigation (Figure S1), and this could be ascribed to up to three WGD events that eudicots such as Arabidopsis underwent in due course of evolution,, while monocots such as rice, maize, and sorghum only went through one shared ancestral WGD during their evolution, except for maize, which underwent a recent extra WGD [75]; this explains the highly conserved nature of MIRNAs in rice and sorghum and the single-nucleotide substitution in maize. After the WGD event (30 million years ago), the common ancestor of sorghum, maize, and millet was separated from the common ancestor of wheat, rice, and barley [76]. Interestingly, wheat experienced both the grass genome triplication and hybridization that occurred among wheat genomes. In fact, the wheat genome represents three sub-genomes, i.e., the sequential hybridizations of wheat genome A with wheat genome B, followed by hybridization with genome D [77], which might be accountable for single-nucleotide substitutions at multiple places and insertions or deletions in Tae-MIR397 and Tae-MIR408 (Figure S1). These factors are also accountable for the disruption of microsynteny among distantly related Oryza spp., Sorghum, Z. mays, T. aestivum, and Arabidopsis. In addition, plant MIRNAs have an ancestral origin, and the identification of non-conserved or even species-specific MIRNAs suggests that MIRNA generation is a constant phenomenon during evolution [78]. WGD is the major mechanism for the generation of MIRNA genes that are differentially conserved or lost during the diploidization process [78,79]. In addition, species-specific or non-conserved MIRNAs evolve continuously, probably in response to adaptation to changing environments [80].

4.3. Selection Pattern of Sequence Polymorphism

Tajima’s D [49] and Fu and Li’s F [50] tests are used to estimate the neutrality of sequence polymorphism for MIRNA genes. These tests can detect both positive and balancing selections [81]. Tajima’s D value for sequence variants are expected to be zero under neutral selection, whereas negative Tajima’s D values indicate positive selection [82], and negative values indicate purifying selection. The values of Tajima’s D and Fu and Li’s F were calculated for three pre-MIRNAs from 10 poaceae species and one dicot species. All the MIRNAs were found to be non-neutral sequence variants. Tajima’s D and Fu and Li’s F values were found to be most negative at the MIR408 locus, whereas both test values were the least negative at the MIR397B locus. Previously, negative values of one or both tests were also reported in rice and Arabidopsis [83]. Nucleotide diversity was also found to vary at different MIRNA loci. Selection pressure during the domestication of cultivated varieties could be responsible for the variation in nucleotide diversity at corresponding MIRNA loci. Thus, MIRNAs are the effective targets of the differential accumulation of variations in populations under selection pressure.
In the comparative analysis of MIR397 and MIR408, all the ten poaceae species showed a relative expression of both MIR397 and MIR408. The higher abundance of both MIRNAs in flag leaf and further differential expression in the other tissues under study indicated a tissue-specific expression of these MIRNAs. Furthermore, amongst different tissues, this higher abundance was only found in wild varieties of rice and was not observed in domesticated species of rice and other poaceae members. MIR397 targets the laccase gene family. It could be because wild species of rice originated in a semi-aquatic ecosystem and may not require strong mechanical strength, while in the case of cultivated/domesticated varieties, MIR397-mediated regulation might have been a result of co-evolution, which was altered during the artificial selection of rice. In addition, it is possible that laccases that cannot be targeted by MIR397 evolved in some plants where mechanical strength was a prerequisite for the changing environment. This would justify the lower abundance of MIR397 in Z. mays, S. bicolor, and T. aestivum. MIR408 shows the same expression pattern as MIR397.

4.4. Microsynteny Analysis across Poaceae

Our study revealed the loss of synteny in S. bicolor, Z. mays, and T. aestivum. In a similar kind of study involving the comparative genomics of the Ghd7 gene in ten Oryza species, Brachypodium distachyon, Sorghum, and Z. mays, it was observed that high gene collinearity existed among Oryza species, while collinearity was lost in non-Oryza spp. [84]. The Heading date 1 (Hd1) orthologous region, when compared between different Oryza spp. And Sorghum, exhibited the conservation of microsynteny in rice but disruptions in Sorghum [85]. Three ancient WGDs shaped the ancestral lineage of grasses [86]; however, O. sativa and S. bicolor experienced no subsequent polyploidization [87]. Although the ancestral karyotype of rice appears to be conserved among the common grass ancestors, with no major changes in the genome structure, most other species experienced additional genomic re-patterning processes; for example, maize represents an older tetra-ploidization event, during which it lost its homologous chromosome by reassembling homologous segments on newly formed chromosomes. Thus, WGD has differentially impacted the evolution and structure of grass genomes, suggesting that poly-ploidization, subsequent gene loss, and chromosome rearrangement played an important role in the diversification of grass genomes [88]. Such gene loss/gain and chromosome rearrangement account for the loss of microsynteny in distantly related non-Oryza spp. Even comparative analyses performed by different workers showed the extensive conservation of gene order, but the loss or gain of genes or genomic segments is only easily detected in closely related species and is important for genome organization and evolution [84].

4.5. Conservation of Gene Organization around MIRNA Locus

Our investigation of microsynteny in the 100 kb region surrounding MIR397 and MIR408 showed a differential type of conservation pattern based on the number of conserved genes. For instance, the 100 kb region surrounding MIR397A was more conserved than MIR397B (Figure 5, Figure 6, Figure 7, Figure 8 and Figure 9). This indicates that the region surrounding each homolog of a particular MIRNA in different plant species experiences a different selection pressure during the course of evolution, so that some genes are retained as duplicated copies (diploidization resistant), and others are progressively deleted back to a single copy [89]. Genes that were retained in MIR397 and MIR408 homologous regions primarily included transporters, transcription factors (TFs), transcription regulators (TRs), and those involved in signal transduction pathways. An earlier report involving SPL genes showed that each lineage of SPL genes has different evolutionary rates and that duplication events resulted in divergent evolutionary patterns in six closely related Oryza species [90].
Similarly, the microsynteny analyses of the 100 Kb regions harboring MIR397B and MIR408 of seven Oryza spp., Z. mays, S. bicolor T. aestivum, and Arabidopsis revealed high gene collinearity within the genus Oryza with the loss of synteny in O. brachyantha (FF). The synteny of MIR408 in O. brachyantha (FF) and O. punctata (BB) was also observed to be lost. Oryza spp. that experienced the loss of microsynteny belong to three different sub-genome types. O. brachyantha has the smallest genome among Oryza spp. due to the recalcitrant nature for genome expansion or suggestinggenome downsizing that could have led to the structural variation in the genome of this species. In O. punctata, both genome expansion and contraction might have played a role [91]. In addition, unequal homologous and non-homologous recombination rates point at a variation of more than two-fold within a 15 MYA time frame and play an important role in the creation of abundant and species-specific structural variations [92]. Oryza genomes, despite a well-conserved gene structure, content, order, and orientation, underwent rapid and lineage-specific changes. A large number of them are recent, and at least some are frequent and show regional biases leading to varying degrees of genomic structural instability [91]. The loss of microsynteny of MIR397B in O. brachyantha (FF) and MIR408 in O. brachyantha (FF) and O. punctata (BB) can be speculated to be due to these factors.

4.6. Phylogenetic Analysis of Conserved and Non-Conserved MIRNAs across Poaceae

The phylogenetic analysis of MIR397 separated the precursor sequences into two different clades having a common ancestor (Figure 8A). This suggested that MIR397A and MIR397B were formed in poaceae as a result of a duplication event. Sorghum, Z. mays, and Triticum MIR397 was grouped with Oryza MIR397B as it might be evolutionarily more related/closer to MIR397B than MIR397A. Arabidopsis MIR397A and MIR397B formed a group separate from monocots, which could be ascribed to up to three WGD events during the course of evolution. MIR408 homologs of all members grouped together, except for Z. mays, which grouped with Arabidopsis, which can be ascribed to recent extra WGD in maize, similar to triple WGD in eudicots (Figure 8B).

5. Conclusions

The increasing demand for food supply, unexpected climate change, and diverse abiotic and abiotic stresses pose an unprecedented threat to the global food supply. Modern structural and functional genomics led to superior cultivars to improve food production, but stringent selection created a bottle neck in the genetic variability in domesticated crops, while crop wild relatives managed to maintain a higher level of genetic variability in their natural environment. Leveraging the untapped genetic resources available in CWRs for crop improvement is an attractive option. In the present study, the comparative genomics approach revealed that the overall microsynteny in 100 Kb regions harboring MIR397 and MIR408 was conserved among seven Oryza species under study and that from Oryza to Sorghum, Z. mays, and T. aestivum, the microsynteny was highly disrupted, with complete loss in Arabidopsis. This could have been due to gene gain/loss or chromosomal repatterning during the course of evolution, which might have led to structural variations, but the overall gene content and order were maintained. Our study provides a deep insight into the view of the genome evolution of the wild relatives of rice vis-à-vis cultivated crops and can help to harness the genetic diversity of crop wild relatives for agronomic trait improvement in rice.

Supplementary Materials

The following supporting information can be downloaded at: https://www.mdpi.com/article/10.3390/cells11213461/s1, (1) Dash et al. supplementary file S1.pdf, Table S1. Coordinates for 100 kb region harboring miRNAs for microsynteny analysis and coordinates for promoter and precursors for phylogenetic analysis; Table S2. Forward primer sequence for Rt-qPCR used for generating the expression profile of MIR397 and MIR408; Table S3. Forward primer sequence for Rt-qPCR used for generating the expression profile of MIR397 and MIR408; Figure S1. Multiple sequence alignment of MIR397 and MIR408 homologs precursor region to detect the region of conservation and divergence; Figure S2. Multiple sequence alignment of precursor sequence of MIR408 across poaceae to detect the region of conservation and divergence; Figure S3. Screenshot of Fu and Li’s test conducted on MIR397A sequences from Oryza spp, other poaceae members and Arabidopsis; Figure S4. Screenshot of Tajima’s test conducted on MIR397A sequences from Oryza spp, other poaceae members and Arabidopsis; Figure S5. Screenshot of Fu and Li’s test conducted on MIR397B sequences from Oryza spp, other poaceae members and Arabidopsis; Figure S6. Screenshot of Tajima’s test conducted on MIR397B sequences from Oryza spp, other poaceae members and Arabidopsis; Figure S7. Screenshot of Fu and Li’s test conducted on MIR408 sequences from Oryza spp, other poaceae members and Arabidopsis; Figure S8. Screenshot of Tajima’s test conducted on MIR408 sequences from Oryza spp, other poaceae members and Arabidopsis; Figure S9. Synteny block diagram for MIR397A keeping Oryza barthii as reference; Figure S10. Synteny block diagram for MIR397A keeping Oryza glaberima as reference; Figure S11. Synteny block diagram for MIR397A keeping Oryza glumaepetula as reference; Figure S12. Synteny block diagram for MIR397A keeping Oryza rufipogon as reference; Figure S13. Synteny block diagram for MIR397A keeping Oryza brachyantha as reference; Figure S14. Synteny block diagram for MIR397A keeping Oryza punctata as reference; Figure S15. Synteny block diagram for MIR397A keeping Zea mays as reference; Figure S16. Synteny block diagram for MIR397A keeping Arabidopsis thaliana as reference; Figure S17. Synteny block diagram for MIR397B keeping Oryza barthii as reference; Figure S18. Synteny block diagram for MIR397B keeping Oryza glaberima as reference; Figure S19. Synteny block diagram for MIR397B keeping Oryza glumaepetula as reference; Figure S20. Synteny block diagram for MIR397B keeping Oryza rufipogon as reference; Figure S21. Synteny block diagram for MIR397B keeping Oryza brachyantha as reference; Figure S22. Synteny block diagram for MIR397B keeping Oryza punctata as reference; Figure S23. Synteny block diagram for MIR397B keeping Zea mays as reference; Figure S24. Synteny block diagram for MIR397B keeping Arabidopsis thaliana as reference; Figure S25. Synteny block diagram for MIR397 keeping Sorghum bicolor as reference; Figure S26. Synteny block diagram for MIR397 keeping Triticum aestivum (6A) as reference; Figure S27. Synteny block diagram for MIR397 keeping Triticum aestivum (6B) as reference; Figure S28. Synteny block diagram for MIR397 keeping Triticum aestivum (6D) as reference; Figure S29. Synteny block diagram for MIR408 keeping Oryza barthii as reference; Figure S30. Synteny block diagram for MIR408 keeping Oryza glaberima as reference; Figure S31. Synteny block diagram for MIR408 keeping Oryza glumaepetula as reference; Figure S32. Synteny block diagram for MIR408 keeping Oryza rufipogon as reference; Figure S33. Synteny block diagram for MIR408 keeping Oryza brachyantha as reference; Figure S34. Synteny block diagram for MIR408 keeping Oryza punctata as reference; Figure S35. Synteny block diagram for MIR408A keeping Zea mays as reference; Figure S36. Synteny block diagram for MIR408B keeping Zea mays as reference; Figure S37. Synteny block diagram for MIR408 keeping Sorghum bicolor as reference; Figure S38. Synteny block diagram for MIR408 keeping Triticum aestivum as reference; Figure S39. Diagrammatic representation of microsynteny analysis of 100kb genomic segments flanking MIR397B across different poaceae members; Figure S40. Diagrammatic representation of microsynteny analysis of 100kb genomic segments flanking MIR408 across different poaceae members. (2) Dash et al. supplementary file S2.xls.

Author Contributions

A.K.S., P.K.D., and R.R. conceived the idea and designed the experiments; P.K.D. and P.G. carried out the experiments; P.K.D., P.G., R.R., S.K.P., and A.K.S. analyzed the data; P.G. prepared the manuscript, with contributions from P.K.D., R.R., S.K.P., and A.K.S.; all authors have read the manuscript and approved its submission. Furthermore, the authors declare that the research study was conducted in the absence of any commercial or financial relationships that could be construed as a potential conflict of interest. All authors have read and agreed to the published version of the manuscript.

Funding

This research was carried out in-house (RPP: genome analysis in crop plants) and received no external funding.

Institutional Review Board Statement

This is an NIPB publication (number NIPB/2021/PUB/2).

Informed Consent Statement

Not applicable.

Acknowledgments

The work was carried out under ICAR-NPFGGM and ICAR-NASF projects (P.K.D. and R.R.). The research scholarship to P.G. from ICAR-NASF is duly acknowledged.

Conflicts of Interest

The authors declare no conflict of interest.

References

  1. Kellogg, E.A. Evolutionary History of the Grasses. Plant Physiol. 2001, 125, 1198–1205. [Google Scholar] [CrossRef] [Green Version]
  2. Mammadov, J.; Buyyarapu, R.; Guttikonda, S.K.; Parliament, K.; Abdurakhmonov, I.Y.; Kumpatla, S.P. Wild Relatives of Maize, Rice, Cotton, and Soybean: Treasure Troves for Tolerance to Biotic and Abiotic Stresses. Front. Plant Sci. 2018, 9. [Google Scholar] [CrossRef]
  3. Shanchez, P.; Wing, R.A.; Brar, D. Genetics and Genomics of Rice; Zhang, Q., Wing, R., Eds.; Springer Science+Business Media, LLC: Berlin, Germany, 2013. [Google Scholar]
  4. Shakiba, E.; Eizenga, G. Rice-Germplasm, Genetics and Improvement; Bao, J., Ed.; IntechOpen: London, UK, 2014. [Google Scholar]
  5. Levy, A.A.; Feldman, M. The Impact of Polyploidy on Grass Genome Evolution. Plant Physiol. 2002, 130, 1587–1593. [Google Scholar] [CrossRef] [PubMed] [Green Version]
  6. Paterson, A.H.; Bowers, J.E.; Chapman, B.A. Ancient Polyploidization Predating Divergence of the Cereals, and Its Consequences for Comparative Genomics. Proc. Natl. Acad. Sci. USA 2004, 101, 9903–9908. [Google Scholar] [CrossRef] [PubMed] [Green Version]
  7. Dhaka, N.; Sharma, R. MicroRNA-Mediated Regulation of Agronomically Important Seed Traits: A Treasure Trove with Shades of Grey! Crit. Rev. Biotechnol. 2021, 41, 594–608. [Google Scholar] [CrossRef] [PubMed]
  8. Joshi, G.; Chauhan, C.; Das, S. Microsynteny Analysis to Understand Evolution and Impact of Polyploidization on MIR319 Family within Brassicaceae. Dev. Genes Evol. 2018, 228, 227–242. [Google Scholar] [CrossRef] [PubMed]
  9. Bartel, D.P. MicroRNAs: Genomics, Biogenesis, Mechanism, and Function. Cell 2004, 116, 281–297. [Google Scholar] [CrossRef] [Green Version]
  10. Dhaka, N.; Sharma, S.; Vashisht, I.; Kandpal, M.; Sharma, M.K.; Sharma, R. Small RNA Profiling from Meiotic and Post-Meiotic Anthers Reveals Prospective MiRNA-Target Modules for Engineering Male Fertility in Sorghum. Genomics 2020, 112, 1598–1610. [Google Scholar] [CrossRef]
  11. Reinhart, B.J.; Weinstein, E.; Rhoades, M.; Bartel, B.; Bartel, D. MicroRNAs in Plants. Genes Dev. 2002, 16, 1616–1626. [Google Scholar] [CrossRef] [Green Version]
  12. Voinnet, O. Origin, Biogenesis, and Activity of Plant MicroRNAs. Cell 2009, 136, 669–687. [Google Scholar] [CrossRef]
  13. Rogers, K.; Chen, X. Biogenesis, Turnover, and Mode of Action of Plant MicroRNAs. Plant Cell 2013, 25, 2383–2399. [Google Scholar] [CrossRef] [PubMed] [Green Version]
  14. Huang, S.; Zhou, J.; Gao, L.; Tang, Y. Plant MiR397 and Its Functions. Funct Plant Biol. 2021, 48, 361. [Google Scholar] [CrossRef] [PubMed]
  15. Swetha, C.; Basu, D.; Pachamuthu, K.; Tirumalai, V.; Nair, A.; Prasad, M.; Shivaprasad, P.V. Major Domestication-Related Phenotypes in Indica Rice Are Due to Loss of MiRNA-Mediated Laccase Silencing. Plant Cell 2018, 30, 2649–2662. [Google Scholar] [CrossRef] [PubMed] [Green Version]
  16. Kozomara, A.; Griffiths-Jones, S. MiRBase: Annotating High Confidence MicroRNAs Using Deep Sequencing Data. Nucleic Acids Res. 2014, 42, D68–D73. [Google Scholar] [CrossRef] [PubMed] [Green Version]
  17. Zaman, F.; Zhang, M.; Liu, Y.; Wang, Z.; Xu, L.; Guo, D.; Luo, Z.; Zhang, Q. DkmiR397 Regulates Proanthocyanidin Biosynthesis via Negative Modulating DkLAC2 in Chinese PCNA Persimmon. Int. J. Mol. Sci. 2022, 23, 3200. [Google Scholar] [CrossRef]
  18. Zhang, Y.C.; Yu, Y.; Wang, C.Y.; Li, Z.Y.; Liu, Q.; Xu, J.; Liao, J.Y.; Wang, X.J.; Qu, L.H.; Chen, F.; et al. Overexpression of MicroRNA OsmiR397 Improves Rice Yield by Increasing Grain Size and Promoting Panicle Branching. Nat. Biotechnol. 2013, 31, 848–852. [Google Scholar] [CrossRef]
  19. Wang, C.Y.; Zhang, S.; Yu, Y.; Luo, Y.C.; Liu, Q.; Ju, C.; Zhang, Y.C.; Qu, L.H.; Lucas, W.J.; Wang, X.; et al. MiR397b Regulates Both Lignin Content and Seed Number in Arabidopsis via Modulating a Laccase Involved in Lignin Biosynthesis. Plant Biotechnol. J. 2014, 12, 1132–1142. [Google Scholar] [CrossRef]
  20. Feng, Y.-Z.; Yu, Y.; Zhou, Y.-F.; Yang, Y.-W.; Lei, M.-Q.; Lian, J.-P.; He, H.; Zhang, Y.-C.; Huang, W.; Chen, Y.-Q. A Natural Variant of MiR397 Mediates a Feedback Loop in Circadian Rhythm. Plant Physiol. 2020, 182, 204–214. [Google Scholar] [CrossRef] [Green Version]
  21. Gupta, O.P.; Meena, N.L.; Sharma, I.; Sharma, P. Differential Regulation of MicroRNAs in Response to Osmotic, Salt and Cold Stresses in Wheat. Mol. Biol. Rep. 2014, 41, 4623–4629. [Google Scholar] [CrossRef]
  22. Patel, P.; Yadav, K.; Srivastava, A.K.; Suprasanna, P.; Ganapathi, T.R. Overexpression of Native Musa-MiR397 Enhances Plant Biomass without Compromising Abiotic Stress Tolerance in Banana. Sci. Rep. 2019, 9, 1–15. [Google Scholar] [CrossRef]
  23. Axtell, M.J.; Bowman, J.L. Evolution of Plant MicroRNAs and Their Targets. Trends Plant Sci. 2008, 13, 343–349. [Google Scholar] [CrossRef] [PubMed]
  24. Hao, C.; Yang, Y.; Du, J.; Deng, X.W.; Li, L. The PCY-SAG14 Phytocyanin Module Regulated by PIFs and MiR408 Promotes Dark-Induced Leaf Senescence in Arabidopsis. Proc. Natl. Acad. Sci. USA 2022, 119. [Google Scholar] [CrossRef] [PubMed]
  25. Kozomara, A.; Griffiths-Jones, S. MiRBase: Integrating MicroRNA Annotation and Deep-Sequencing Data. Nucleic. Acids Res. 2011, 39, D152–D157. [Google Scholar] [CrossRef] [PubMed] [Green Version]
  26. Song, Z.; Zhang, L.; Wang, Y.; Li, H.; Li, S.; Zhao, H.; Zhang, H. Constitutive Expression of Mir408 Improves Biomass and Seed Yield in Arabidopsis. Front. Plant Sci. 2018, 8, 2114. [Google Scholar] [CrossRef] [Green Version]
  27. Feng, H.; Zhang, Q.; Wang, Q.; Wang, X.; Liu, J.; Li, M.; Huang, L.; Kang, Z. Target of Tae-MiR408, a Chemocyanin-like Protein Gene (TaCLP1), Plays Positive Roles in Wheat Response to High-Salinity, Heavy Cupric Stress and Stripe Rust. Plant Mol. Biol. 2013, 83, 433–443. [Google Scholar] [CrossRef] [PubMed]
  28. Gao, Y.; Feng, B.; Gao, C.; Zhang, H.; Wen, F.; Tao, L.; Fu, G.; Xiong, J. The Evolution and Functional Roles of MiR408 and Its Targets in Plants. Int. J. Mol. Sci. 2022, 23, 530. [Google Scholar] [CrossRef]
  29. Zhao, X.Y.; Hong, P.; Wu, J.Y.; Chen, X.B.; Ye, X.G.; Pan, Y.Y.; Wang, J.; Zhang, X.S. The Tae-MiR408-Mediated Control of TaTOC1 Genes Transcription Is Required for the Regulation of Heading Time in Wheat. Plant Physiol. 2016, 170, 1578–1594. [Google Scholar] [CrossRef] [Green Version]
  30. Yamasaki, H.; Hayashi, M.; Fukazawa, M.; Kobayashi, Y.; Shikanai, T. SQUAMOSA Promoter Binding Protein-Like7 Is a Central Regulator for Copper Homeostasis in Arabidopsis. Plant Cell 2009, 21, 347–361. [Google Scholar] [CrossRef] [Green Version]
  31. Zhang, H.; Li, L. SQUAMOSA Promoter Binding Protein-Like7 Regulated MicroRNA408 Is Required for Vegetative Development in Arabidopsis. Plant J. 2013, 74, 98–109. [Google Scholar] [CrossRef]
  32. Zhang, H.; Zhao, X.; Li, J.; Cai, H.; Deng, X.W.; Li, L. MicroRNA408 Is Critical for the HY5-SPl7 Gene Network That Mediates the Coordinated Response to Light and Copper. Plant Cell 2014, 26, 4933–4953. [Google Scholar] [CrossRef]
  33. Dash Prasanta, K.; Rai, R. Green Revolution to Grain Revolution: Florigen in the Frontiers. J. Biotechnol. 2021, 343, 38–46. [Google Scholar] [CrossRef] [PubMed]
  34. Burgarella, C.; Berger, A.; Glémin, S.; David, J.; Terrier, N.; Deu, M.; Pot, D. The Road to Sorghum Domestication: Evidence from Nucleotide Diversity and Gene Expression Patterns. Front. Plant Sci. 2021, 12, 66075. [Google Scholar] [CrossRef] [PubMed]
  35. Jena, K.K. The Species of the Genus Oryza and Transfer of Useful Genes from Wild Species into Cultivated Rice, O. Sativa. Breed. Sci. 2010, 60, 518–523. [Google Scholar] [CrossRef] [Green Version]
  36. Dash, P.K.; Cao, Y.; Jailani, A.K.; Gupta, P.; Venglat, P.; Xiang, D.; Rai, R.; Sharma, R.; Thirunavukkarasu, N.; Abdin, M.Z.; et al. Genome-Wide Analysis of Drought Induced Gene Expression Changes in Flax (Linum usitatissimum). GM Crops Food 2014, 5, 106–119. [Google Scholar] [CrossRef] [PubMed] [Green Version]
  37. Wang, Z.; Hobson, N.; Galindo, L.; Zhu, S.; Shi, D.; McDill, J.; Yang, L.; Hawkins, S.; Neutelings, G.; Datla, R.; et al. The Genome of Flax (Linum usitatissimum) Assembled de Novo from Short Shotgun Sequence Reads. Plant J. 2012, 72, 461–473. [Google Scholar] [CrossRef] [PubMed] [Green Version]
  38. Shivaraj, S.M.; Deshmukh, R.K.; Rai, R.; Bélanger, R.; Agrawal, P.K.; Dash, P.K. Genome-Wide Identification, Characterization, and Expression Profile of Aquaporin Gene Family in Flax (Linum usitatissimum). Sci. Rep. 2017, 7, srep46137. [Google Scholar] [CrossRef] [Green Version]
  39. Dash, P.K.; Rai, R.; Mahato, A.K.; Gaikwad, K.; Singh, N.K. Transcriptome Landscape at Different Developmental Stages of a Drought Tolerant Cultivar of Flax (Linum usitatissimum). Front. Chem. 2017, 5, 82. [Google Scholar] [CrossRef] [Green Version]
  40. Dash, P.K.; Gupta, P.; Rai, R. Hydroponic Method of Halophobic Response Elicitation in Flax (Linum usitatissimum) for Precise down- Stream Gene Expression Studies. Int. J. Trop. Agric. 2015, 33, 1079–1085. [Google Scholar]
  41. Gupta, P.; Dash, P.K. Molecular Details of Secretory Phospholipase A2 from Flax (Linum usitatissimum L.) Provide Insight into Its Structure and Function. Sci. Rep. 2017, 7, 11080. [Google Scholar] [CrossRef]
  42. Gupta, P.; Dash, P.K. Precise Method of in Situ Drought Stress Induction in Flax (Linum usitatissimum) for RNA Isolation towards down-Stream Analysis. Anals Agric. Res. 2015, 36, 10–17. [Google Scholar]
  43. Dash, P.K.; Gupta, P.; Jailani, A.K.; Rai, R. Hydropenia Induces Expression of Drought Responsive Genes (DRGs) erd1, hat, pld-δ, and zfa in Linum usitatissimum L. Ind. J. Exp. Biol. 2018, 56, 743–749. [Google Scholar]
  44. Gupta, P.; Rai, R.; Vasudev, S.; Yadava, D.; Dash, P.K. Ex-Foliar Application of Glycine Betaine and Its Impact on Protein, Carbohydrates and Induction of ROS Scavenging System during Drought Stress in Flax (Linum usitatissimum). J. Biotechnol. 2021, 337, 80–89. [Google Scholar] [CrossRef] [PubMed]
  45. Gupta, P.; Duong, H.; Repalli, S.; Sreevathsa, R.; Yadava, D.; Dash, P. Cloning and Structural Elucidation of a Brassinosteroids Biosynthetic Gene (Atdwarf4) and Genetic Transformation of Indian Mustard (Brassica juncea L.). Indian J. Biochem. Biophys. 2022, 59, 320–330. [Google Scholar]
  46. Griffiths-Jones, S.; Grocock, R.J.; van Dongen, S.; Bateman, A.; Enright, A.J. MiRBase: MicroRNA Sequences, Targets and Gene Nomenclature. Nucleic Acids Res. 2006, 34, D140–D144. [Google Scholar] [CrossRef]
  47. Katoh, K.; Standley, D.M. MAFFT Multiple Sequence Alignment Software Version 7: Improvements in Performance and Usability. Mol. Biol. Evol. 2013, 30, 772–780. [Google Scholar] [CrossRef] [PubMed] [Green Version]
  48. Robert, X.; Gouet, P. Deciphering Key Features in Protein Structures with the New ENDscript Server. Nucleic Acids Res. 2014, 42, 320–324. [Google Scholar] [CrossRef] [Green Version]
  49. Tajima, F. Statistical Method for Testing the Neutral Mutation Hypothesis by DNA Polymorphism. Genetics 1989, 123, 585–595. [Google Scholar] [CrossRef] [PubMed]
  50. Fu, Y.X.; Li, W.H. Statistical Tests of Neutrality of Mutations. Genetics 1993, 133, 693–709. [Google Scholar] [CrossRef]
  51. Librado, P.; Rozas, J. DnaSP v5: A Software for Comprehensive Analysis of DNA Polymorphism Data. Bioinformatics 2009, 25, 1451–1452. [Google Scholar] [CrossRef] [Green Version]
  52. Solovyev, V.; Fokin, O.; Seledtsov, I.; Salamov, A.; Molodtsov, V.; Okhalin, N.; Bachinskii, A.; Kosarev, P.; Bakulina, N.; Genaev, M.; et al. MolQuest-Bioinformatics Toolbox for Analysis of Biomedical Data. 2021. Available online: https://molquest.com/molquest.phtml?topic=downloads (accessed on 22 September 2022).
  53. Götz, S.; Arnold, R.; Sebastián-León, P.; Martín-Rodríguez, S.; Tischler, P.; Jehl, M.A.; Dopazo, J.; Rattei, T.; Conesa, A. B2G-FAR, a Species-Centered GO Annotation Repository. Bioinformatics 2011, 27, 919–924. [Google Scholar] [CrossRef] [Green Version]
  54. Wang, Y.; Tang, H.; Debarry, J.D.; Tan, X.; Li, J.; Wang, X.; Lee, T.H.; Jin, H.; Marler, B.; Guo, H.; et al. MCScanX: A Toolkit for Detection and Evolutionary Analysis of Gene Synteny and Collinearity. Nucleic Acids Res. 2012, 40, e49. [Google Scholar] [CrossRef] [PubMed] [Green Version]
  55. Krzywinski, M.; Schein, J.; Birol, I.; Connors, J.; Gascoyne, R.; Horsman, D.; Jones, S.J.; Marra, M.A. Circos: An Information Aesthetic for Comparative Genomics. Genome Res. 2009, 19, 1639–1645. [Google Scholar] [CrossRef] [PubMed] [Green Version]
  56. Sievers, F.; Wilm, A.; Dineen, D.; Gibson, T.J.; Karplus, K.; Li, W.; Lopez, R.; McWilliam, H.; Remmert, M.; Söding, J.; et al. Fast, Scalable Generation of High-Quality Protein Multiple Sequence Alignments Using Clustal Omega. Mol. Syst. Biol. 2011, 7, 539. [Google Scholar] [CrossRef] [PubMed]
  57. Kumar, S.; Stecher, G.; Li, M.; Knyaz, C.; Tamura, K. MEGA X: Molecular Evolutionary Genetics Analysis across Computing Platforms. Mol. Biol. Evol. 2018, 35, 1547–1549. [Google Scholar] [CrossRef] [PubMed]
  58. Guindon, S.; Dufayard, J.F.; Lefort, V.; Anisimova, M.; Hordijk, W.; Gascuel, O. New Algorithms and Methods to Estimate Maximum-Likelihood Phylogenies: Assessing the Performance of PhyML 3.0. Syst. Biol. 2010, 59, 307–321. [Google Scholar] [CrossRef] [PubMed] [Green Version]
  59. Ghiurcuta, C.G.; Moret, B.M.E. Evaluating Synteny for Improved Comparative Studies. Bioinformatics 2014, 30, i9–i18. [Google Scholar] [CrossRef] [Green Version]
  60. Tang, H.; Bowers, J.E.; Wang, X.; Ming, R.; Alam, M.; Paterson, A.H. Synteny and Collinearity in Plant Genomes. Science 2008, 320, 486–488. [Google Scholar] [CrossRef] [Green Version]
  61. Lallemand, T.; Leduc, M.; Landès, C.; Rizzon, C.; Lerat, E. An Overview of Duplicated Gene Detection Methods: Why the Duplication Mechanism Has to Be Accounted for in Their Choice. Genes 2020, 11, 1046. [Google Scholar] [CrossRef]
  62. Casneuf, T.; De Bodt, S.; Raes, J.; Maere, S.; Van de Peer, Y. Nonrandom Divergence of Gene Expression Following Gene and Genome Duplications in the Flowering Plant Arabidopsis Thaliana. Genome Biol. 2006, 7, R13. [Google Scholar] [CrossRef] [Green Version]
  63. Restrepo-Montoya, D.; McClean, P.E.; Osorno, J.M. Orthology and Synteny Analysis of Receptor-like Kinases “RLK” and Receptor-like Proteins “RLP” in Legumes. BMC Genom. 2021, 22, 1–17. [Google Scholar] [CrossRef]
  64. Jain, A.; Das, S. Synteny and Comparative Analysis of MiRNA Retention, Conservation, and Structure across Brassicaceae Reveals Lineage- and Sub-Genome-Specific Changes. Funct. Integr. Genom. 2016, 16, 253–268. [Google Scholar] [CrossRef] [PubMed]
  65. Allaby, R.G. Domestication Syndrome in Plants. In Encyclopedia of Global Archaeology; Springer: New York, NY, USA, 2014. [Google Scholar]
  66. Allaby, R.G.; Ware, R.L.; Kistler, L. A Re-evaluation of the Domestication Bottleneck from Archaeogenomic Evidence. Evol. Appl. 2019, 12, 29–37. [Google Scholar] [CrossRef] [PubMed] [Green Version]
  67. Ge, S.; Sang, T.; Lu, B.R.; Hong, D.Y. Phylogeny of Rice Genomes with Emphasis on Origins of Allotetraploid Species. Proc. Natl. Acad. Sci. USA 1999, 96, 14400–14405. [Google Scholar] [CrossRef] [PubMed] [Green Version]
  68. Zou, X.H.; Zhang, F.M.; Zhang, J.G.; Zang, L.L.; Tang, L.; Wang, J.; Sang, T.; Ge, S. Analysis of 142 Genes Resolves the Rapid Diversification of the Rice Genus. Genome Biol. 2008, 9, R49. [Google Scholar] [CrossRef]
  69. Zhang, Q.-J.; Zhu, T.; Xia, E.-H.; Shi, C.; Liu, Y.-L.; Zhang, Y.; Liu, Y.; Jiang, W.-K.; Zhao, Y.-J.; Mao, S.-Y.; et al. Rapid Diversification of Five Oryza AA Genomes Associated with Rice Adaptation. Proc. Natl. Acad. Sci. USA 2014, 111, E4954–E4962. [Google Scholar] [CrossRef] [Green Version]
  70. Ammiraju, J.S.S.; Fan, C.; Yu, Y.; Song, X.; Cranston, K.A.; Pontaroli, A.C.; Lu, F.; Sanyal, A.; Jiang, N.; Rambo, T.; et al. Spatio-Temporal Patterns of Genome Evolution in Allotetraploid Species of the Genus Oryza. Plant J. 2010, 63, 430–442. [Google Scholar] [CrossRef]
  71. Axtell, M.J.; Bartel, D.P. Antiquity of MicroRNAs and Their Targets in Land Plants. Plant Cell 2005, 17, 1658–1673. [Google Scholar] [CrossRef] [Green Version]
  72. Cammaerts, S.; Strazisar, M.; de Rijk, P.; del Favero, J. Genetic Variants in MicroRNA Genes: Impact on MicroRNA Expression, Function, and Disease. Front. Genet. 2015, 6, 186. [Google Scholar] [CrossRef] [Green Version]
  73. Han, M.; Zheng, Y. Comprehensive Analysis of Single Nucleotide Polymorphisms in Human MicroRNAs. PLoS ONE 2013, 8, e78028. [Google Scholar] [CrossRef] [Green Version]
  74. Gong, J.; Tong, Y.; Zhang, H.M.; Wang, K.; Hu, T.; Shan, G.; Sun, J.; Guo, A.Y. Genome-Wide Identification of SNPs in MicroRNA Genes and the SNP Effects on MicroRNA Target Binding and Biogenesis. Hum. Mutat. 2012, 33, 254–263. [Google Scholar] [CrossRef]
  75. Salse, J. In Silico Archeogenomics Unveils Modern Plant Genome Organisation, Regulation and Evolution. Curr. Opin. Plant Biol. 2012, 15, 122–130. [Google Scholar] [CrossRef] [PubMed]
  76. Hilu, K.W. Phylogenetics and Chromosomal Evolution in the Poaceae (Grasses). Aust. J. Bot. 2004, 52, 13–22. [Google Scholar] [CrossRef] [Green Version]
  77. Sun, S.; Wang, J.; Yu, J.; Meng, F.; Xia, R.; Wang, L.; Wang, Z.; Ge, W.; Liu, X.; Li, Y.; et al. Alignment of Common Wheat and Other Grass Genomes Establishes a Comparative Genomics Research Platform. Front. Plant Sci. 2017, 8, 1480. [Google Scholar] [CrossRef] [PubMed] [Green Version]
  78. Zhang, R.; Murat, F.; Li, A.; Pont, C.; Mao, L.; Salsea, J. Grass MicroRNA Gene Paleohistory Unveils New Insights into Gene Dosage Balance in Subgenome Partitioning after Whole-Genome Duplication. Plant Cell 2012, 24, 1776–1792. [Google Scholar] [CrossRef]
  79. Rathore, P.; Geeta, R.; Das, S. Microsynteny and Phylogenetic Analysis of Tandemly Organised MiRNA Families across Five Members of Brassicaceae Reveals Complex Retention and Loss History. Plant Sci. 2016, 247, 35–48. [Google Scholar] [CrossRef]
  80. Cuperus, J.T.; Fahlgren, N.; Carrington, J.C. Evolution and Functional Diversification of MIRNA Genes. Plant Cell 2011, 23, 431–442. [Google Scholar] [CrossRef] [Green Version]
  81. Ehrenreich, I.M.; Purugganan, M.D. Sequence Variation of MicroRNAs and Their Binding Sites in Arabidopsis. Plant Physiol. 2008, 146, 1974–1982. [Google Scholar] [CrossRef] [Green Version]
  82. Wang, Y.; Shen, D.; Bo, S.; Chen, H.; Zheng, J.; Zhu, Q.-H.; Cai, D.; Helliwell, C.; Fan, L. Sequence Variation and Selection of Small RNAs in Domesticated Rice. BMC Evol. Biol. 2010, 10, 119. [Google Scholar] [CrossRef] [Green Version]
  83. Ganie, S.A.; Debnath, A.B.; Gumi, A.M.; Mondal, T.K. Comprehensive Survey and Evolutionary Analysis of Genome-Wide MiRNA Genes from Ten Diploid Oryza Species. BMC Genom. 2017, 18, 711. [Google Scholar] [CrossRef] [Green Version]
  84. Yang, L.; Liu, T.; Li, B.; Sui, Y.; Chen, J.; Shi, J.; Wing, R.A.; Chen, M. Comparative Sequence Analysis of the Ghd7 Orthologous Regions Revealed Movement of Ghd7 in the Grass Genomes. PLoS ONE 2012, 7, e50236. [Google Scholar] [CrossRef]
  85. Sanyal, A.; Ammiraju, J.S.S.; Lu, F.; Yu, Y.; Rambo, T.; Currie, J.; Kollura, K.; Kim, H.R.; Chen, J.; Ma, J.; et al. Orthologous Comparisons of the Hd1 Region across Genera Reveal Hd1 Gene Lability within Diploid Oryza Species and Disruptions to Microsynteny in Sorghum. Mol. Biol. Evol. 2010, 27, 2487–2506. [Google Scholar] [CrossRef] [Green Version]
  86. Jiao, Y.; Li, J.; Tang, H.; Paterson, A.H. Integrated Syntenic and Phylogenomic Analyses Reveal an Ancient Genome Duplication in Monocots. Plant Cell 2014, 26, 2792–2802. [Google Scholar] [CrossRef] [PubMed] [Green Version]
  87. Guo, H.; Jiao, Y.; Tan, X.; Wang, X.; Huang, X.; Jin, H.; Paterson, A.H. Gene Duplication and Genetic Innovation in Cereal Genomes. Genome Res. 2019, 29, 261–269. [Google Scholar] [CrossRef] [PubMed] [Green Version]
  88. Tian, C.G.; Xiong, Y.Q.; Liu, T.Y.; Sun, S.H.; Chen, L.B.; Chen, M.S. Evidence for an Ancient Whole-Genome Duplication Event in Rice and Other Cereals. Acta Genet. Sin. 2005, 32, 519–527. [Google Scholar] [PubMed]
  89. Pont, C.; Murat, F.; Confolent, C.; Balzergue, S.; Salse, J. RNA-Seq in Grain Unveils Fate of Neo- and Paleopolyploidization Events in Bread Wheat (Triticum Aestivum L.). Genome Biol. 2011, 12, R119. [Google Scholar] [CrossRef] [Green Version]
  90. Zhong, H.; Kong, W.; Gong, Z.; Fang, X.; Deng, X.; Liu, C.; Li, Y. Evolutionary Analyses Reveal Diverged Patterns of Squamosa Promoter Binding Protein-like (Spl) Gene Family in Oryza Genus. Front. Plant Sci. 2019, 10, 565. [Google Scholar] [CrossRef] [Green Version]
  91. Goicoechea, J.L.; Ammiraju, J.S.S.; Marri, P.R.; Chen, M.; Jackson, S.; Yu, Y.; Rounsley, S.; Wing, R.A. The Future of Rice Genomics: Sequencing the Collective Oryza Genome. Rice 2010, 3, 89–97. [Google Scholar] [CrossRef] [Green Version]
  92. Ammiraju, J.S.S.; Lu, F.; Sanyal, A.; Yu, Y.; Song, X.; Jiang, N.; Pontaroli, A.C.; Rambo, T.; Currie, J.; Collura, K.; et al. Dynamic Evolution of Oryza Genomes Is Revealed by Comparative Genomic Analysis of a Genus-Wide Vertical Data Set. Plant Cell 2008, 20, 3191–3209. [Google Scholar] [CrossRef]
Figure 1. Genomic location of MIRNA homologs present on chromosomes of different poaceae members. Genomic location of (A) MIR397A, (B) MIR397B, and (C) MIR408 homologs present on chromosomes of different poaceae members. Pointed triangles mark the positions of respective MIRNAs on genus-specific chromosomes.
Cells 11 03461 g001aCells 11 03461 g001b
Figure 2. Multiple sequence alignment of mature MIR397 and MIR408 to detect the region of conservation and divergence. (A) Multiple sequence alignment of mature MIR397A showed that mature RNA of all poaceae members and Arabidopsis was highly conserved, except for Z. mays and T. aestivum. Similarly, multiple sequence alignment of mature MIR397A showed that mature RNA of all Oryza spp. was highly conserved. (B) Multiple sequence alignment of mature MIR408 showed that a genome-specific SNP was observed in Arabidopsis at the 1st position, where C was replaced with T. * denotes position of SNP. Osa—O. sativa; Oba—O. barthii; Ogl—O. glaberrima; Oglu—O. glumaepatula; Oru—O. rufipogon; Obr—O. brachyantha; Op1—O. punctata; Sbi—S. bicolor; Zma—Z. mays; Tae—T. aestivum; Ath—A. thaliana.
Cells 11 03461 g002aCells 11 03461 g002b
Figure 3. Graphical representation of (A) percentage of O. sativa homologs in 100 kb genomic segments harboring MIR397A/B conserved among O. sativa, other poaceae members, and Arabidopsis; (B) density of genes present in 100 kb genomic segments harboring MIR397A/B across different poaceae members and Arabidopsis.
Cells 11 03461 g003aCells 11 03461 g003b
Figure 4. Graphical representation of (A) percentage of O. sativa homologs in 100 kb genomic segments harboring MIR408 conserved among O. sativa, other poaceae members, and Arabidopsis; (B) density of genes present in 100 kb genomic segments harboring MIR408 across different poaceae members and Arabidopsis.
Cells 11 03461 g004
Figure 5. Diagrammatic representation of microsynteny analysis of 100 kb genomic segments flanking MIR397A across different poaceae members. (A) Synteny block diagram for MIR397A with O. sativa as reference. The first column shows duplication depth at each gene locus; the second column shows the genes in reference chromosomes, and the following one show aligned collinear blocks where only match genes are displayed. The alignment among non-anchor genes was discarded in the output and was simply denoted with “||” in the multi-alignment of gene orders. (B) Circular plot showing patterns of synteny and collinearity. Os6—O. sativa chr 6; Ob6—O. barthii chr 6; Og6—O. glaberrima chr 6; Ou6—O. glumaepatula chr 6; Or6—O. rufipogon chr 6; Oa6—O. brachyantha chr 6; Op6—O. punctata chr 6; Sb4—S. bicolor chr 4; Zm3—Z. mays chr 3; Ta6A—T. aestivum chr 6A; Ta6B—T. aestivum chr 6B; Ta6D—T. aestivum chr 6D; At4—A. thaliana chr 4.
Cells 11 03461 g005aCells 11 03461 g005b
Figure 6. Diagrammatic representation of microsynteny analysis of 100 kb genomic segments flanking MIR397B across different poaceae members. Synteny block diagram for MIR397B with Oryza sativa as reference. The first column shows duplication depth at each gene locus; the second column shows the genes in reference chromosomes, and the following ones show aligned collinear blocks where only match genes are displayed. The alignment among non-anchor genes was discarded in the output and was simply denoted with “||” in the multi-alignment of gene orders.
Cells 11 03461 g006
Figure 7. Diagrammatic representation of microsynteny analysis of 100 kb genomic segments flanking MIR408 across different poaceae members. Synteny block diagram for MIR408 with O. sativa as reference. The first column shows duplication depth at each gene locus; the second column shows the genes in reference chromosomes, and the following ones show aligned collinear blocks where only match genes are displayed. The alignment among non-anchor genes was discarded in the output and was simply denoted with “||” in the multi-alignment of gene orders.
Cells 11 03461 g007
Figure 8. Phylogenetic relationship of MIR397 and MIR408 within poaceae members and Arabidopsis. (A) ML phylogenetic tree was constructed for the 22 MIR397 precursor and promoter (500 bp) sequences in O. sativa and its six wild relatives, S. bicolor, Z. mays, and T. aestivum. Arabidopsis was also included in the study as an outlier. Triangles denote the bootstrap values. Circles denote the bootstrap values ranging from 0.277 to 1.000. (B) ML phylogenetic tree was constructed for the 12 MIR408 precursor and promoter (500 bp) sequences in O. sativa and its six wild relatives, S. bicolor, Z. may, and T. aestivum. Arabidopsis was also included in the study as an outlier. Circles denote the bootstrap values ranging from 0.155 to 0.968. Osa—O. sativa; Oba—O. barthii; Ogl—O. glaberrima; ++++maepatula; Oru—O. rufipogon; Obr—O. brachyantha; Opu—O. punctata; Sbi—S. bicolor; Zma—Z. mays; Tae—T. aestivum; Ath—A. thaliana.
Cells 11 03461 g008
Figure 9. Differentially expressed MIR397 and MIR408 across different Oryza and poaceae species in tissue-specific manner. Expression pattern was obtained via qRT-PCR. Each block shows log2-fold expression in stem, leaf, root, and inflorescence.
Cells 11 03461 g009
Table 1. Chromosomal locations and coordinates of each miRNA homolog in grass species.
SpeciesmiRNAChromosome LocationPrecursor Coordinates
Start Position End Position
Oryza sativamiR397AChr63038103630381149
miR397BChr238728463872974
miR408Chr11339697113397183
Oryza barthiimiR397AChr62351190723512020
miR397BChr229927002992817
miR408Chr11068965210689860
Oryza glaberrimamiR397AChr62125736121257474
miR397BChr229626202962737
miR408Chr189880988988197
Oryza glumaepetulamiR397AChr62897960728979671
miR397BChr232290813229198
miR408Chr11377820413778256
Oryza punctatamiR397AChr63212339032123437
miR397BChr227283962728465
miR408Chr11250436512504434
Oryza rufipogonmiR397AChr62554844925548513
miR397BChr230059583006075
miR408Chr11138679711387005
Oryza brachyanthamiR397AChr61973836819738441
miR397BChr223223692322422
miR408Chr196057969605842
Zea maysmiR397AChr3183569171183569313
miR397BChr58461059184610674
miR408AChr35812789058128080
miR408BChr83958393839584084
Triticum aestivummiR397Chr6A106878788106878880
Chr6B169172592169172643
Chr6D8883233588832406
miR408Chr7B632998409632998595
Sorghum bicolormiR397Chr440037214003811
miR408Chr31590845315908657
Arabidopsis thalianamiR397AChr426259502626056
miR397BChr478786527878760
miR408Chr21931981419320031
Table 2. Identification and number of homologs for each MIRNA in respective plant species.
MIRNAPlant Species
O. sativaO. barthiiO. glaberrimaO. glumaepatulaO. rufipogonO. brachyanthaO. punctataS. bicolorT. aestivumZ. maysA. thaliana
MIR397 13
MIR397A1111111 11
MIR397B1111111 11
MIR408 111111111 1
MIR408A 1
MIR408B 1
The background color is for differentiating between various MIRNAs.
Table 3. Genes predicted in 100 kb regions harboring MIRNAs in different members of poaceae.
MIRNAPlant Species
O. sativaO. barthiiO. glaberrimaO. glumaepatulaO. rufipogonO. brachyanthaO. punctataS. bicolorT. aestivumZ. maysA. thaliana
MIR397 176A-34
6B-24
6D-25
MIR397A32302526311831 1828
MIR397B18182118161419 2125
MIR408 211718171819221731 30
MIR408A 16
MIR408B 13
Table color has been given to differenmtiate between various MIRNAs.
Publisher’s Note: MDPI stays neutral with regard to jurisdictional claims in published maps and institutional affiliations.

