
Metabolomics in Diabetes and Diabetic Complications: Insights from Epidemiological Studies


Abstract
:1. Introduction
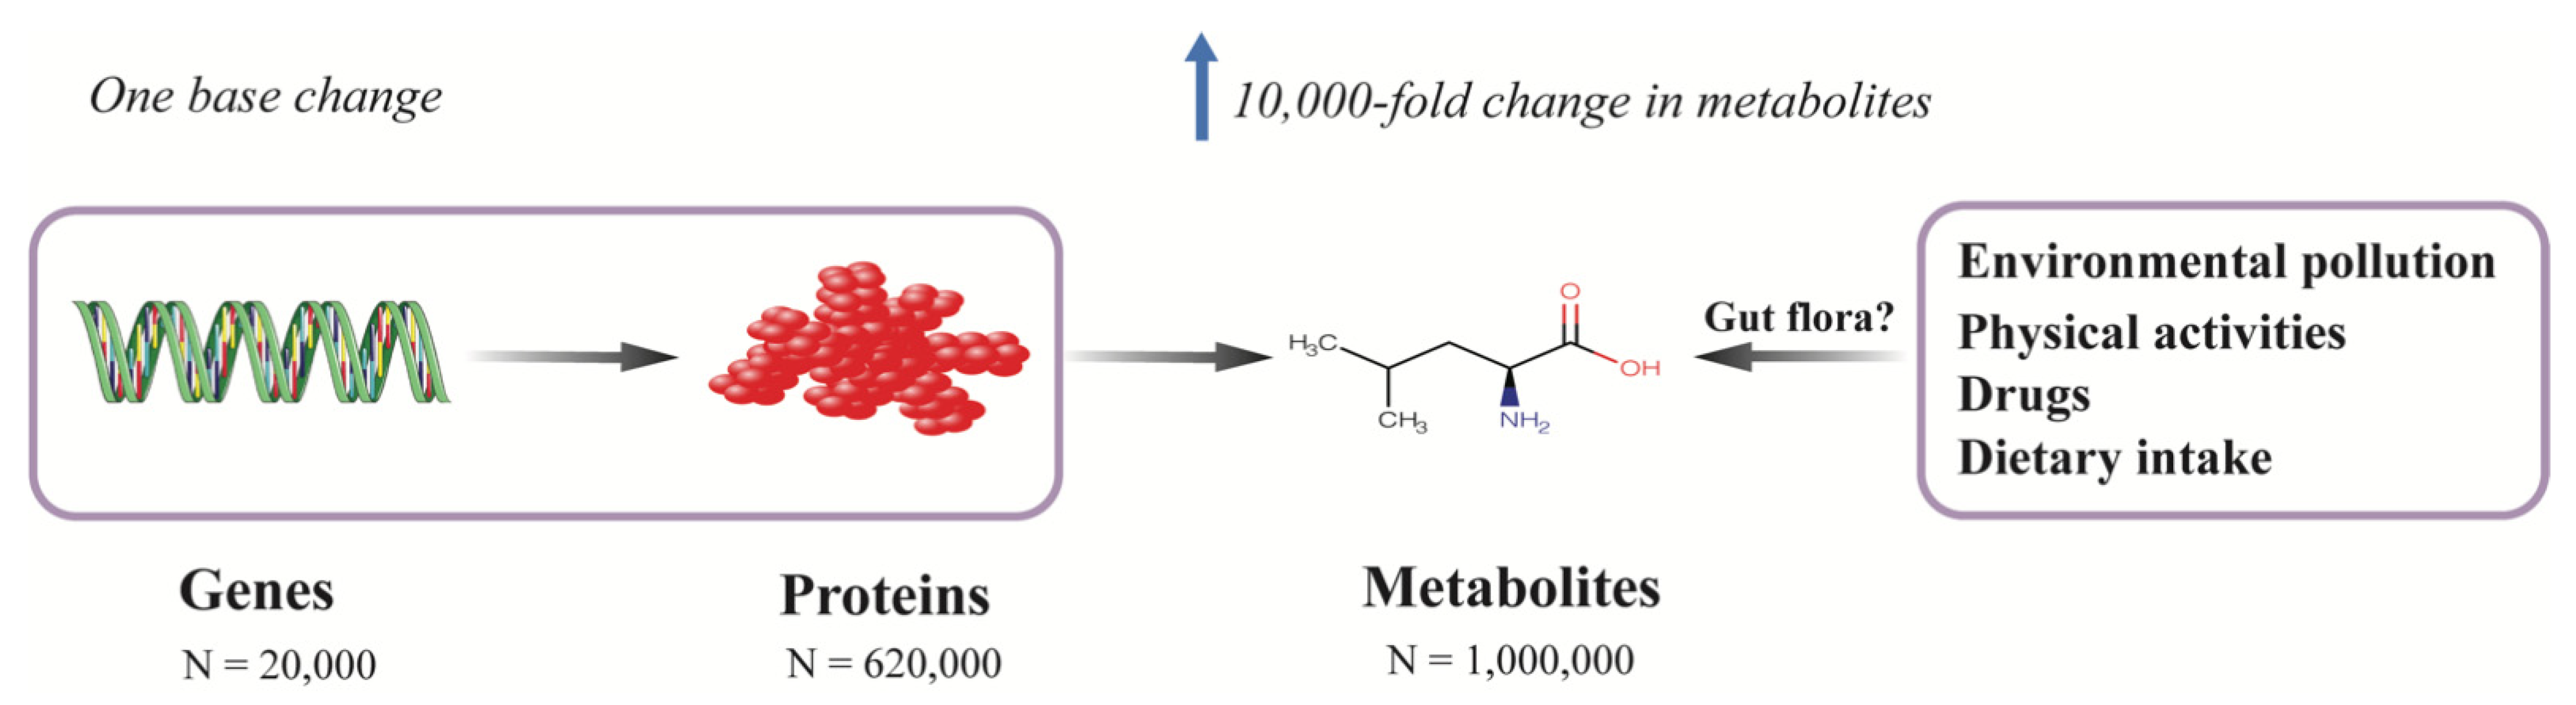
2. Metabolomics and Metabolites
3. Analytical Methods
3.1. Untargeted and Targeted Metabolomics
3.2. Nuclear Magnetic Resonance (NMR) Spectroscopy
3.3. Mass Spectrometry
4. Metabolomics in Diabetes
4.1. Amino Acids
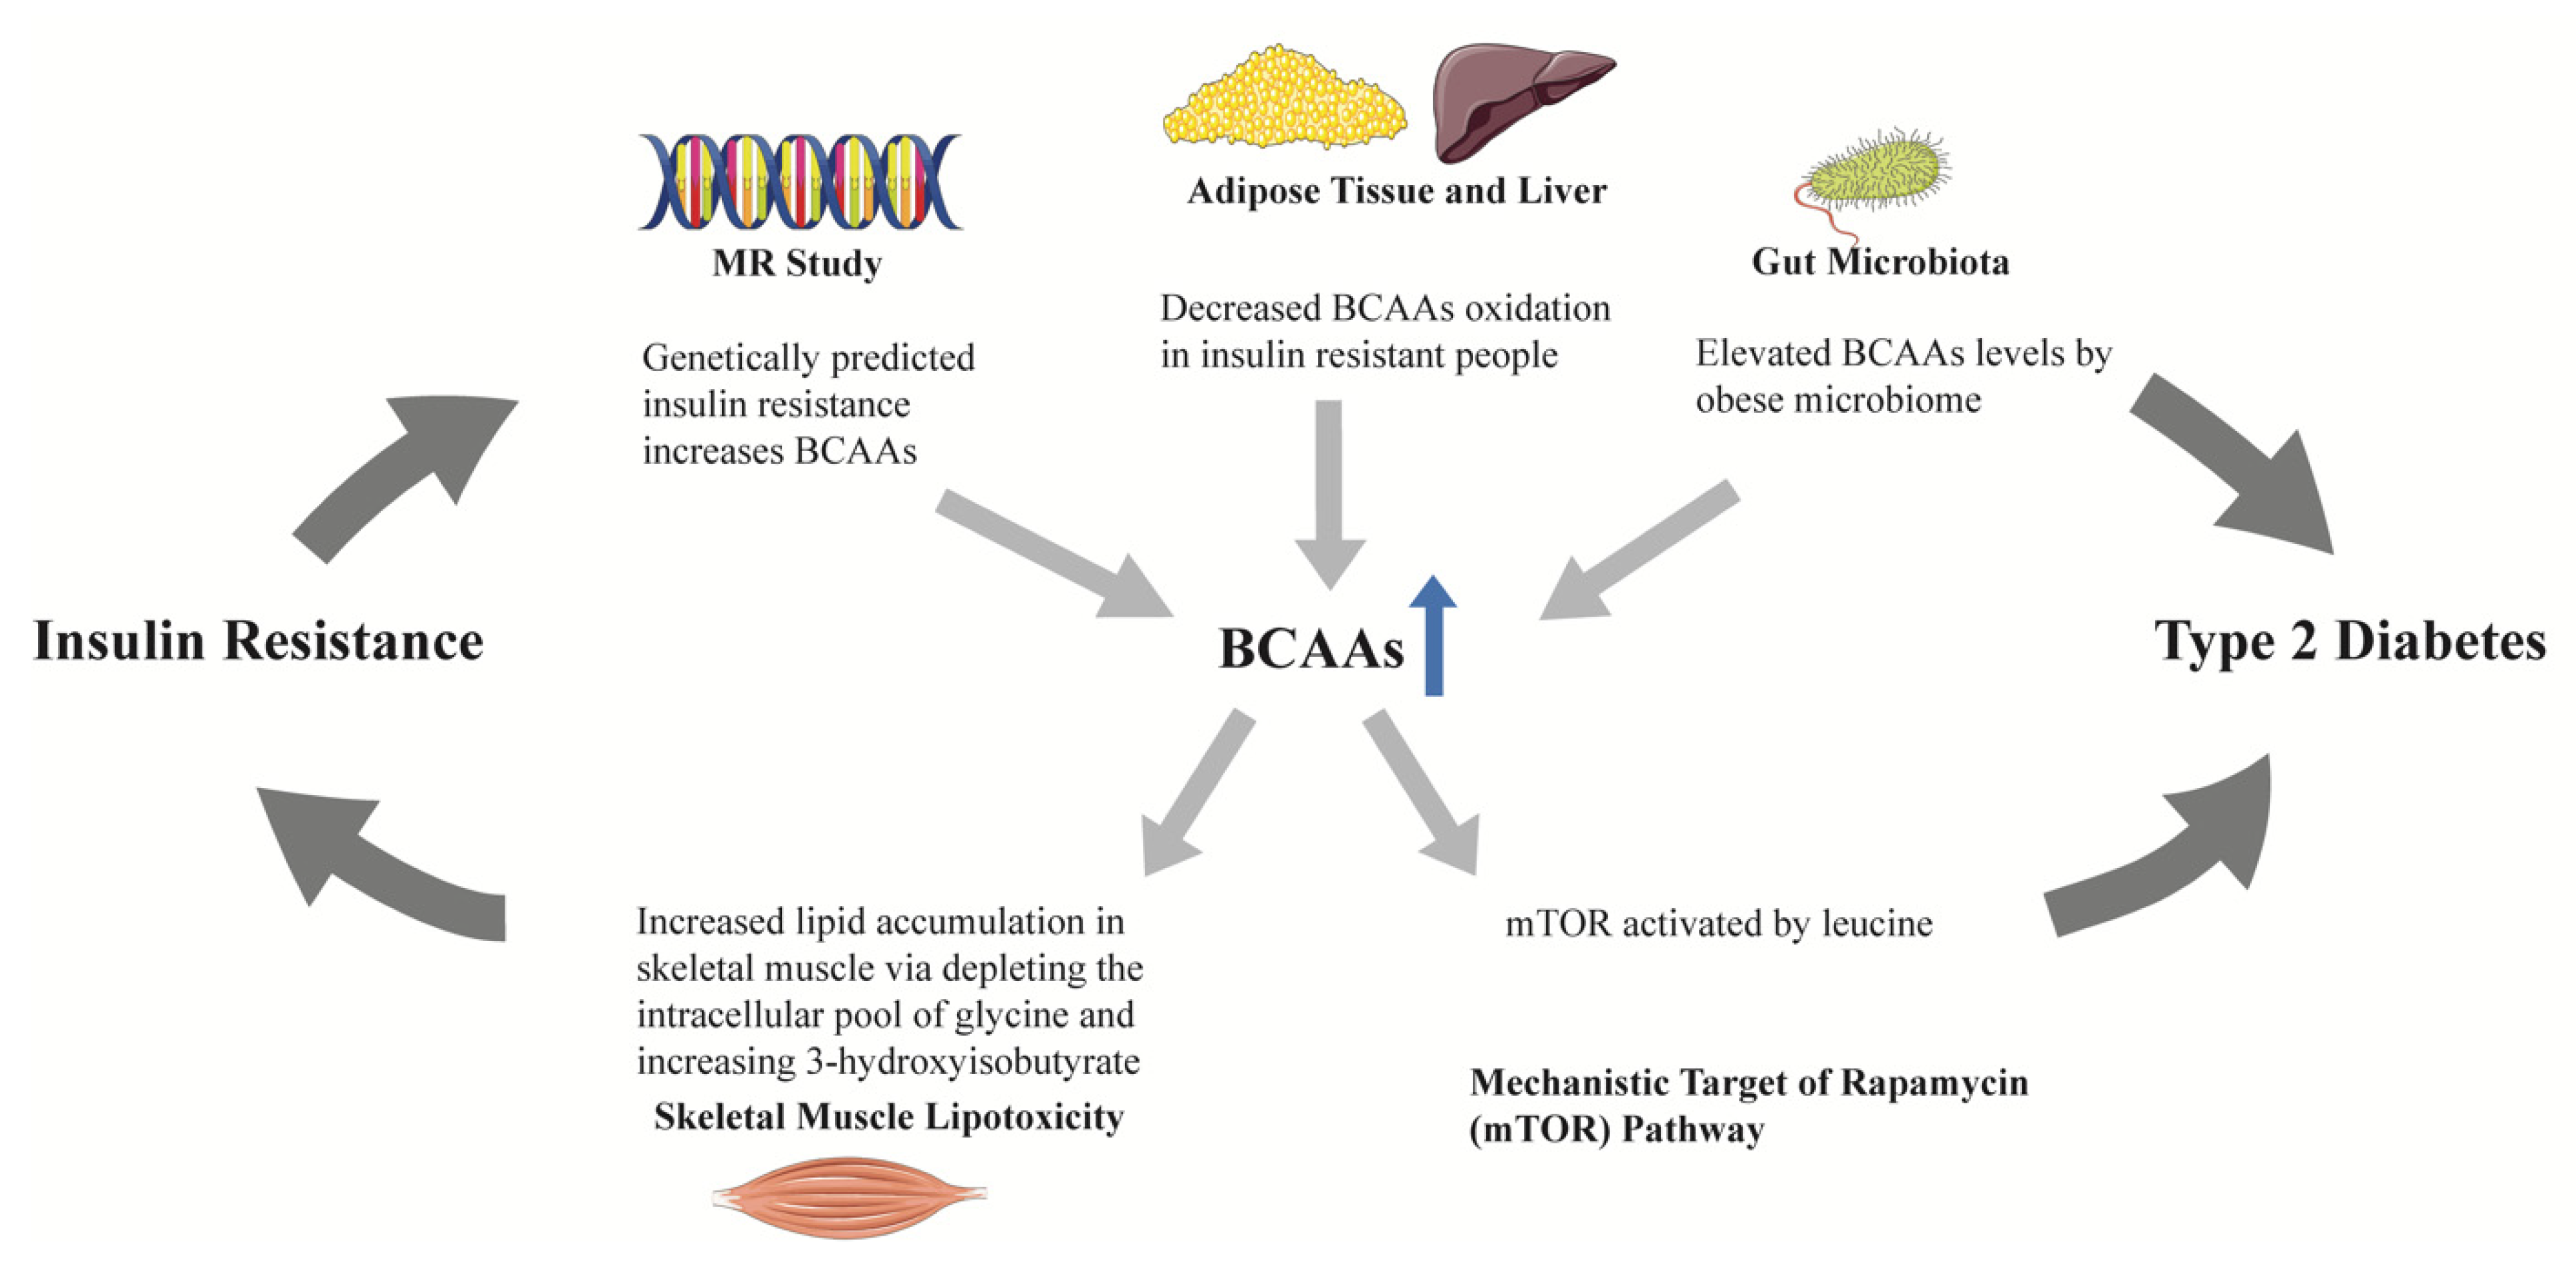
4.1.1. Branched-Chain Amino Acids (BCAAs)
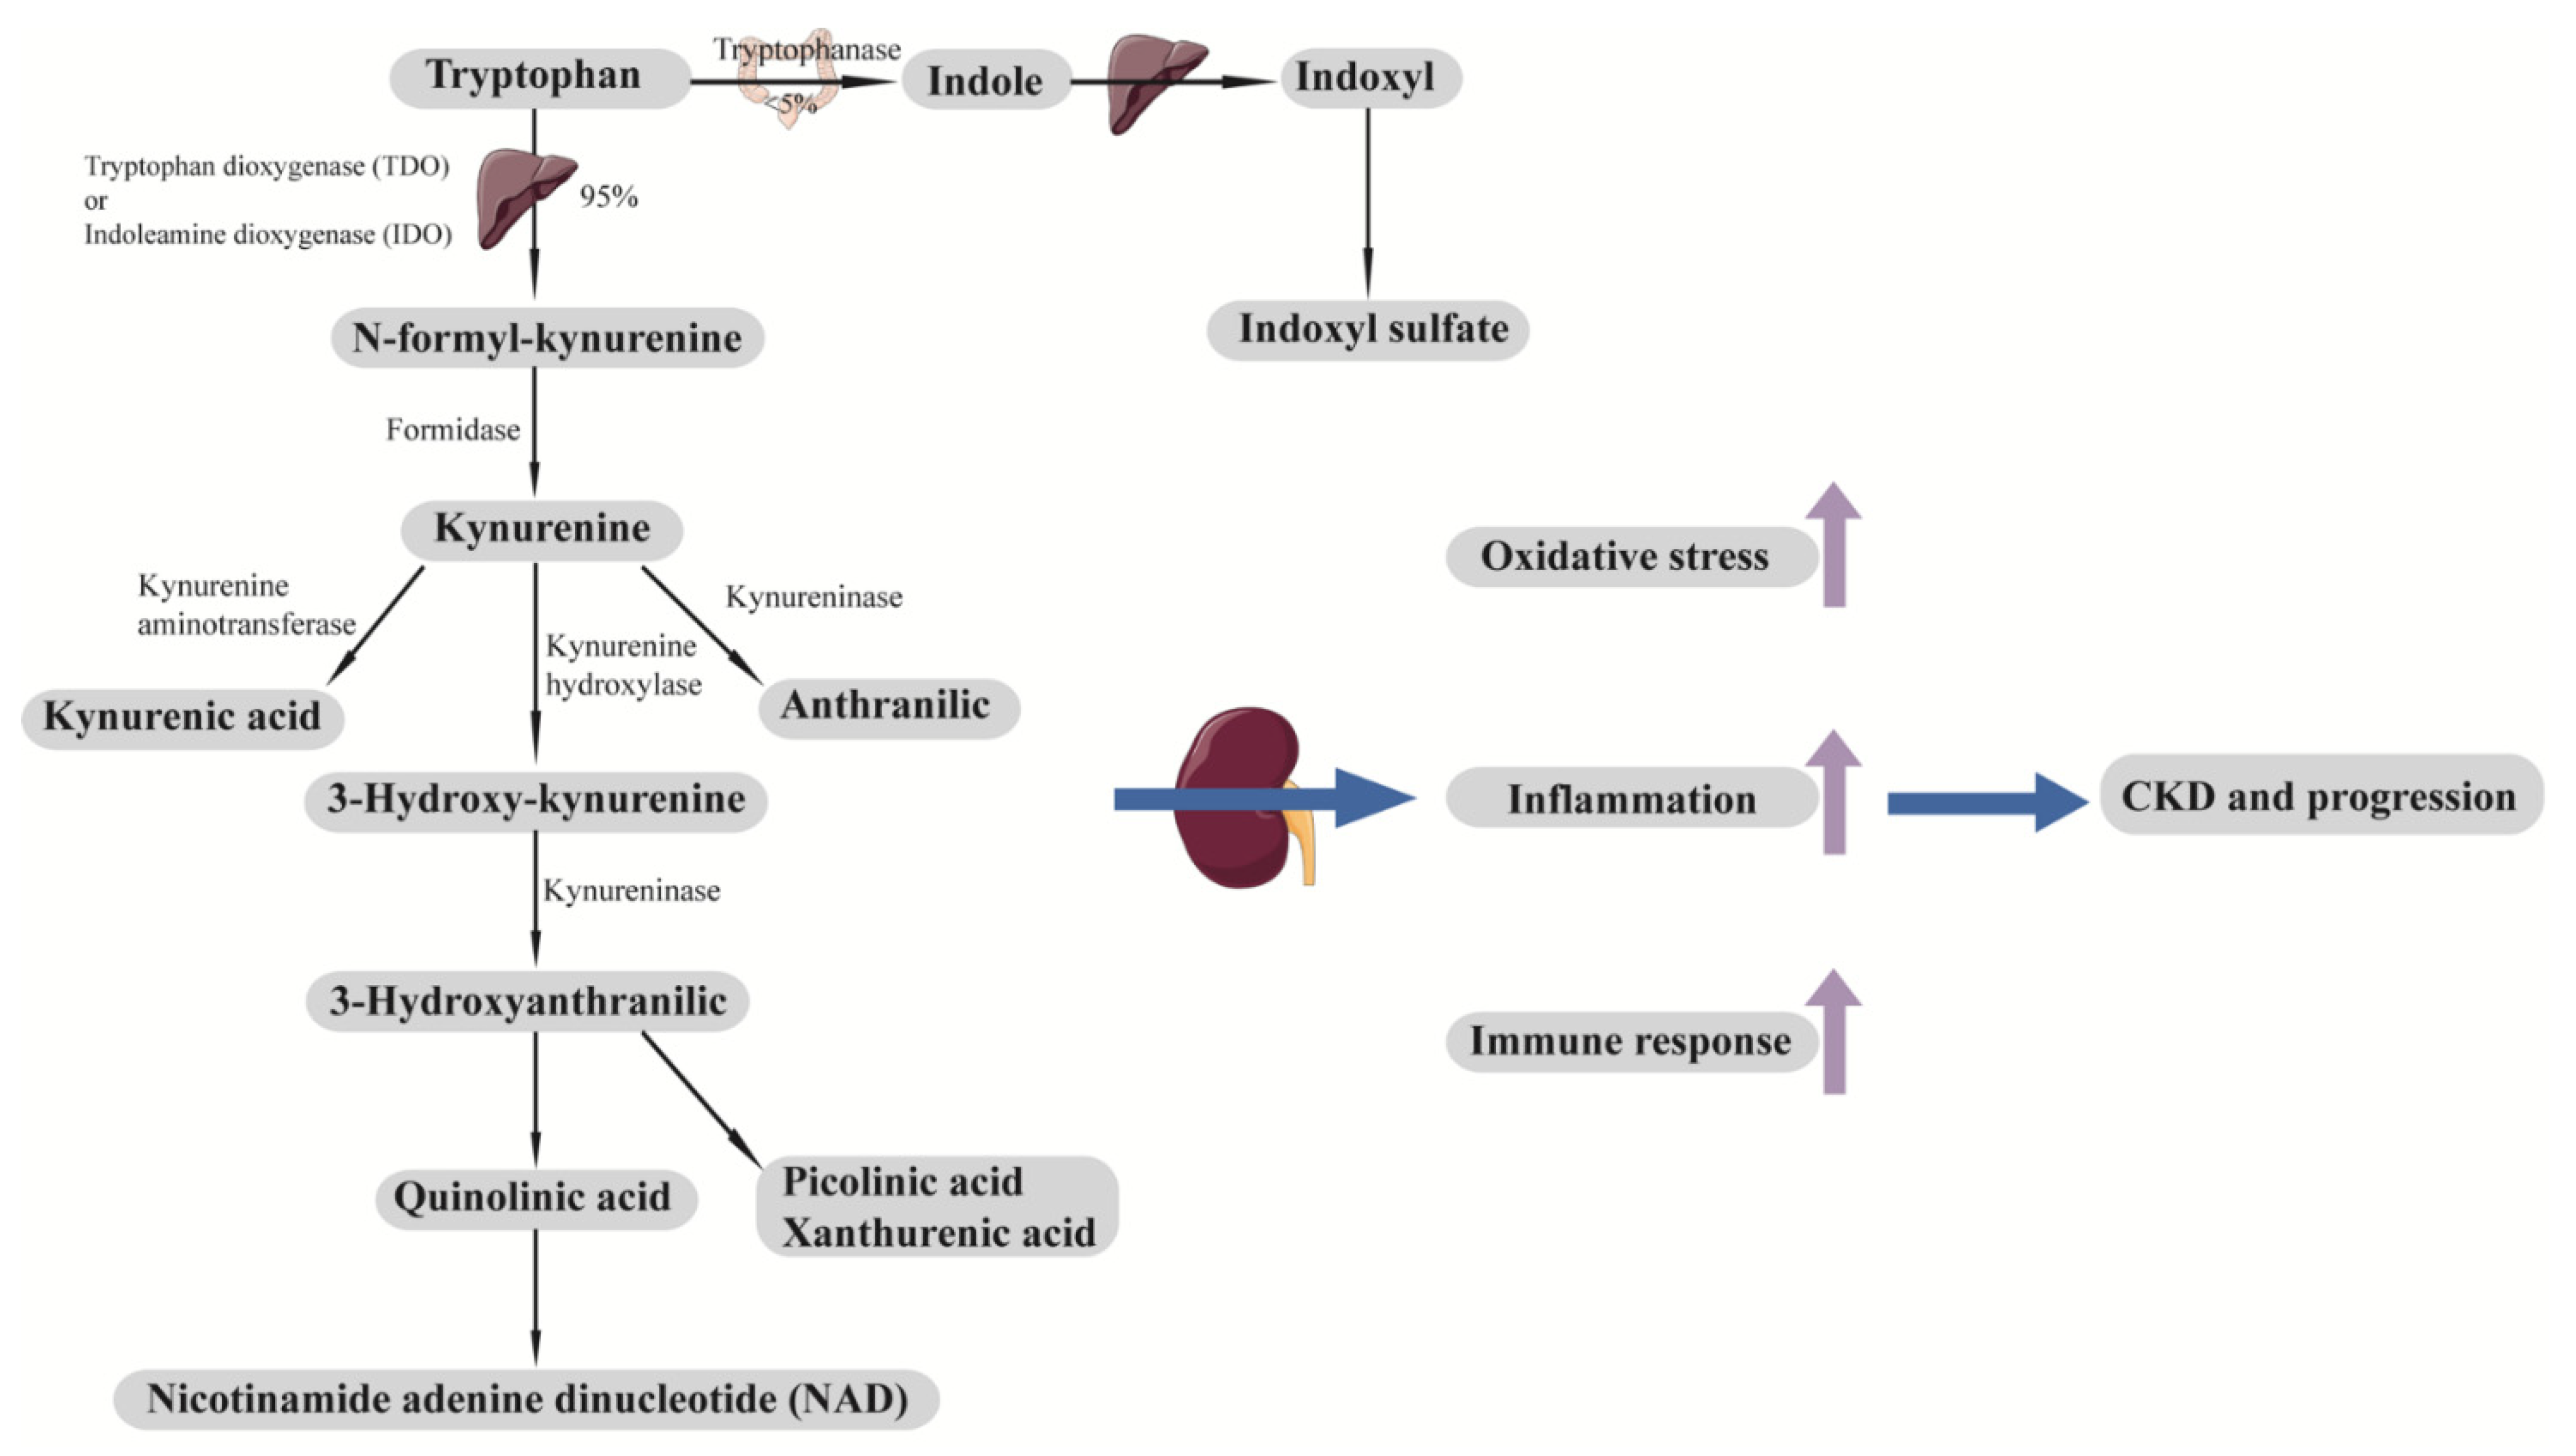
4.1.2. Aromatic Amino Acids
4.1.3. Other Amino Acids
4.2. Organic Acids
4.3. Lipids
4.3.1. Lipoproteins
4.3.2. Fatty Acids
5. Metabolomics in Diabetic Kidney Disease
5.1. Amino Acids
5.1.1. Asymmetric Dimethylarginine (ADMA) and Symmetric Dimethylarginine (SDMA)
5.1.2. Aromatic Amino Acids
5.1.3. Other Amino Acids
5.1.4. Organic Acids Involved in Energy Metabolism
5.2. Lipids
5.2.1. Lipoproteins
5.2.2. Phospholipids
5.2.3. Fatty Acids and Acylcarnitines
5.3. Sodium–Glucose Cotransporter-2 Inhibitors (SGLT2i)
5.4. Current Challenges in Metabolomics Studies in DKD
6. Metabolomics in Cardiovascular Disease
6.1. Amino Acids
6.1.1. ADMA
6.1.2. Other Amino Acids
6.2. Lipids
6.2.1. HDL
6.2.2. Fatty Acids and Phospholipids
7. Intercorrelation of Metabolomic Biomarkers: Limited Predictive Value
8. Systems Biology: Integrating Multidimensional Data
9. Exogenous Metabolites, Gut Microbiota, and Diabetes and Its Progression
10. Conclusions and Perspectives
Author Contributions
Funding
Institutional Review Board Statement
Informed Consent Statement
Data Availability Statement
Acknowledgments
Conflicts of Interest
References
- Saeedi, P.; Petersohn, I.; Salpea, P.; Malanda, B.; Karuranga, S.; Unwin, N.; Colagiuri, S.; Guariguata, L.; Motala, A.A.; Ogurtsova, K.; et al. Global and regional diabetes prevalence estimates for 2019 and projections for 2030 and 2045: Results from the International Diabetes Federation Diabetes Atlas, 9th edition. Diabetes Res. Clin. Pract 2019, 157, 107843. [Google Scholar] [CrossRef] [Green Version]
- Reutens, A.T. Epidemiology of diabetic kidney disease. Med. Clin. N. Am. 2013, 97, 1–18. [Google Scholar] [CrossRef]
- Gregg, E.W.; Li, Y.; Wang, J.; Burrows, N.R.; Ali, M.K.; Rolka, D.; Williams, D.E.; Geiss, L. Changes in diabetes-related complications in the United States, 1990–2010. N. Engl. J. Med. 2014, 370, 1514–1523. [Google Scholar] [CrossRef] [PubMed] [Green Version]
- Wei, M.; Gaskill, S.P.; Haffner, S.M.; Stern, M.P. Effects of diabetes and level of glycemia on all-cause and cardiovascular mortality. The San Antonio Heart Study. Diabetes Care 1998, 21, 1167–1172. [Google Scholar] [CrossRef]
- Litwak, L.; Goh, S.Y.; Hussein, Z.; Malek, R.; Prusty, V.; Khamseh, M.E. Prevalence of diabetes complications in people with type 2 diabetes mellitus and its association with baseline characteristics in the multinational A1chieve study. Diabetol. Metab. Syndr. 2013, 5, 57. [Google Scholar] [CrossRef] [PubMed] [Green Version]
- Ninomiya, T.; Perkovic, V.; de Galan, B.E.; Zoungas, S.; Pillai, A.; Jardine, M.; Patel, A.; Cass, A.; Neal, B.; Poulter, N.; et al. Albuminuria and kidney function independently predict cardiovascular and renal outcomes in diabetes. J. Am. Soc. Nephrol. 2009, 20, 1813–1821. [Google Scholar] [CrossRef]
- Toyama, T.; Furuichi, K.; Ninomiya, T.; Shimizu, M.; Hara, A.; Iwata, Y.; Kaneko, S.; Wada, T. The impacts of albuminuria and low eGFR on the risk of cardiovascular death, all-cause mortality, and renal events in diabetic patients: Meta-analysis. PLoS ONE 2013, 8, e71810. [Google Scholar] [CrossRef] [PubMed] [Green Version]
- Low Wang, C.C.; Hess, C.N.; Hiatt, W.R.; Goldfine, A.B. Clinical Update: Cardiovascular Disease in Diabetes Mellitus: Atherosclerotic Cardiovascular Disease and Heart Failure in Type 2 Diabetes Mellitus—Mechanisms, Management, and Clinical Considerations. Circulation 2016, 133, 2459–2502. [Google Scholar] [CrossRef]
- Global, regional, and national incidence, prevalence, and years lived with disability for 354 diseases and injuries for 195 countries and territories, 1990–2017: A systematic analysis for the Global Burden of Disease Study 2017. Lancet 2018, 392, 1789–1858. [CrossRef] [Green Version]
- Zhang, P.; Zhang, X.; Brown, J.; Vistisen, D.; Sicree, R.; Shaw, J.; Nichols, G. Global healthcare expenditure on diabetes for 2010 and 2030. Diabetes Res. Clin. Pract. 2010, 87, 293–301. [Google Scholar] [CrossRef]
- Nowlin, S.Y.; Hammer, M.J.; D’Eramo Melkus, G. Diet, inflammation, and glycemic control in type 2 diabetes: An integrative review of the literature. J. Nutr. Metab. 2012, 2012, 542698. [Google Scholar] [CrossRef] [Green Version]
- Ma, R.C.; Lin, X.; Jia, W. Causes of type 2 diabetes in China. Lancet Diabetes Endocrinol. 2014, 2, 980–991. [Google Scholar] [CrossRef]
- Lindström, J.; Ilanne-Parikka, P.; Peltonen, M.; Aunola, S.; Eriksson, J.G.; Hemiö, K.; Hämäläinen, H.; Härkönen, P.; Keinänen-Kiukaanniemi, S.; Laakso, M.; et al. Sustained reduction in the incidence of type 2 diabetes by lifestyle intervention: Follow-up of the Finnish Diabetes Prevention Study. Lancet 2006, 368, 1673–1679. [Google Scholar] [CrossRef]
- Knowler, W.C.; Barrett-Connor, E.; Fowler, S.E.; Hamman, R.F.; Lachin, J.M.; Walker, E.A.; Nathan, D.M. Reduction in the incidence of type 2 diabetes with lifestyle intervention or metformin. N. Engl. J. Med. 2002, 346, 393–403. [Google Scholar] [CrossRef]
- Neal, B.; Perkovic, V.; Matthews, D.R. Canagliflozin and Cardiovascular and Renal Events in Type 2 Diabetes. N. Engl. J. Med. 2017, 377, 2099. [Google Scholar] [CrossRef]
- Wiviott, S.D.; Raz, I.; Bonaca, M.P.; Mosenzon, O.; Kato, E.T.; Cahn, A.; Silverman, M.G.; Zelniker, T.A.; Kuder, J.F.; Murphy, S.A.; et al. Dapagliflozin and Cardiovascular Outcomes in Type 2 Diabetes. N. Engl. J. Med. 2019, 380, 347–357. [Google Scholar] [CrossRef] [PubMed]
- Zinman, B.; Wanner, C.; Lachin, J.M.; Fitchett, D.; Bluhmki, E.; Hantel, S.; Mattheus, M.; Devins, T.; Johansen, O.E.; Woerle, H.J.; et al. Empagliflozin, Cardiovascular Outcomes, and Mortality in Type 2 Diabetes. N. Engl. J. Med. 2015, 373, 2117–2128. [Google Scholar] [CrossRef] [PubMed]
- Pauling, L.; Robinson, A.B.; Teranishi, R.; Cary, P. Quantitative analysis of urine vapor and breath by gas-liquid partition chromatography. Proc. Natl. Acad. Sci. USA 1971, 68, 2374–2376. [Google Scholar] [CrossRef] [PubMed] [Green Version]
- Mahajan, A.; Taliun, D.; Thurner, M.; Robertson, N.R.; Torres, J.M.; Rayner, N.W.; Payne, A.J.; Steinthorsdottir, V.; Scott, R.A.; Grarup, N.; et al. Fine-mapping type 2 diabetes loci to single-variant resolution using high-density imputation and islet-specific epigenome maps. Nat. Genet. 2018, 50, 1505–1513. [Google Scholar] [CrossRef] [PubMed] [Green Version]
- Bory, C.; Boulieu, R.; Chantin, C.; Mathieu, M. Diagnosis of alcaptonuria: Rapid analysis of homogentisic acid by HPLC. Clin. Chim. Acta 1990, 189, 7–11. [Google Scholar] [CrossRef]
- Wishart, D.S.; Feunang, Y.D.; Marcu, A.; Guo, A.C.; Liang, K.; Vázquez-Fresno, R.; Sajed, T.; Johnson, D.; Li, C.; Karu, N.; et al. HMDB 4.0: The human metabolome database for 2018. Nucleic Acids Res. 2018, 46, D608–D617. [Google Scholar] [CrossRef]
- Wishart, D.S. Metabolomics for Investigating Physiological and Pathophysiological Processes. Physiol. Rev. 2019, 99, 1819–1875. [Google Scholar] [CrossRef]
- Jeong, S.; Eskandari, R.; Park, S.M.; Alvarez, J.; Tee, S.S.; Weissleder, R.; Kharas, M.G.; Lee, H.; Keshari, K.R. Real-time quantitative analysis of metabolic flux in live cells using a hyperpolarized micromagnetic resonance spectrometer. Sci. Adv. 2017, 3, e1700341. [Google Scholar] [CrossRef] [PubMed] [Green Version]
- Motta, A.; Paris, D.; Melck, D. Monitoring real-time metabolism of living cells by fast two-dimensional NMR spectroscopy. Anal. Chem. 2010, 82, 2405–2411. [Google Scholar] [CrossRef] [PubMed]
- Soininen, P.; Kangas, A.J.; Würtz, P.; Suna, T.; Ala-Korpela, M. Quantitative serum nuclear magnetic resonance metabolomics in cardiovascular epidemiology and genetics. Circ. Cardiovasc. Genet. 2015, 8, 192–206. [Google Scholar] [CrossRef] [PubMed] [Green Version]
- Würtz, P.; Kangas, A.J.; Soininen, P.; Lawlor, D.A.; Davey Smith, G.; Ala-Korpela, M. Quantitative Serum Nuclear Magnetic Resonance Metabolomics in Large-Scale Epidemiology: A Primer on −Omic Technologies. Am. J. Epidemiol. 2017, 186, 1084–1096. [Google Scholar] [CrossRef] [Green Version]
- Letertre, M.P.M.; Dervilly, G.; Giraudeau, P. Combined Nuclear Magnetic Resonance Spectroscopy and Mass Spectrometry Approaches for Metabolomics. Anal. Chem. 2021, 93, 500–518. [Google Scholar] [CrossRef]
- Trivedi, D.K.; Iles, R.K. Do not just do it, do it right: Urinary metabolomics—Establishing clinically relevant baselines. Biomed. Chromatogr. 2014, 28, 1491–1501. [Google Scholar] [CrossRef]
- Darshi, M.; Van Espen, B.; Sharma, K. Metabolomics in Diabetic Kidney Disease: Unraveling the Biochemistry of a Silent Killer. Am. J. Nephrol 2016, 44, 92–103. [Google Scholar] [CrossRef]
- Lopes, A.S.; Cruz, E.C.; Sussulini, A.; Klassen, A. Metabolomic Strategies Involving Mass Spectrometry Combined with Liquid and Gas Chromatography. Adv. Exp. Med. Biol. 2017, 965, 77–98. [Google Scholar] [CrossRef]
- Iadarola, P.; Fumagalli, M.; Bardoni, A.M.; Salvini, R.; Viglio, S. Recent applications of CE- and HPLC-MS in the analysis of human fluids. Electrophoresis 2016, 37, 212–230. [Google Scholar] [CrossRef] [PubMed]
- Mil’man, B.; Zhurkovich, I. Mass spectrometric analysis of medical samples and aspects of clinical diagnostics. J. Anal. Chem. 2015, 70, 1179–1191. [Google Scholar] [CrossRef]
- Dunn, W.B. Current trends and future requirements for the mass spectrometric investigation of microbial, mammalian and plant metabolomes. Phys. Biol. 2008, 5, 011001. [Google Scholar] [CrossRef]
- Shulaev, V. Metabolomics technology and bioinformatics. Brief. Bioinform. 2006, 7, 128–139. [Google Scholar] [CrossRef]
- Guasch-Ferré, M.; Hruby, A.; Toledo, E.; Clish, C.B.; Martínez-González, M.A.; Salas-Salvadó, J.; Hu, F.B. Metabolomics in Prediabetes and Diabetes: A Systematic Review and Meta-analysis. Diabetes Care 2016, 39, 833–846. [Google Scholar] [CrossRef] [Green Version]
- Festa, A.; Williams, K.; Hanley, A.J.; Otvos, J.D.; Goff, D.C.; Wagenknecht, L.E.; Haffner, S.M. Nuclear magnetic resonance lipoprotein abnormalities in prediabetic subjects in the Insulin Resistance Atherosclerosis Study. Circulation 2005, 111, 3465–3472. [Google Scholar] [CrossRef] [Green Version]
- Mora, S.; Otvos, J.D.; Rosenson, R.S.; Pradhan, A.; Buring, J.E.; Ridker, P.M. Lipoprotein particle size and concentration by nuclear magnetic resonance and incident type 2 diabetes in women. Diabetes 2010, 59, 1153–1160. [Google Scholar] [CrossRef] [Green Version]
- Wang, T.J.; Larson, M.G.; Vasan, R.S.; Cheng, S.; Rhee, E.P.; McCabe, E.; Lewis, G.D.; Fox, C.S.; Jacques, P.F.; Fernandez, C.; et al. Metabolite profiles and the risk of developing diabetes. Nat. Med. 2011, 17, 448–453. [Google Scholar] [CrossRef]
- Stancáková, A.; Civelek, M.; Saleem, N.K.; Soininen, P.; Kangas, A.J.; Cederberg, H.; Paananen, J.; Pihlajamäki, J.; Bonnycastle, L.L.; Morken, M.A.; et al. Hyperglycemia and a common variant of GCKR are associated with the levels of eight amino acids in 9,369 Finnish men. Diabetes 2012, 61, 1895–1902. [Google Scholar] [CrossRef] [PubMed] [Green Version]
- Wang-Sattler, R.; Yu, Z.; Herder, C.; Messias, A.C.; Floegel, A.; He, Y.; Heim, K.; Campillos, M.; Holzapfel, C.; Thorand, B.; et al. Novel biomarkers for pre-diabetes identified by metabolomics. Mol. Syst. Biol. 2012, 8, 615. [Google Scholar] [CrossRef]
- Ferrannini, E.; Natali, A.; Camastra, S.; Nannipieri, M.; Mari, A.; Adam, K.P.; Milburn, M.V.; Kastenmüller, G.; Adamski, J.; Tuomi, T.; et al. Early metabolic markers of the development of dysglycemia and type 2 diabetes and their physiological significance. Diabetes 2013, 62, 1730–1737. [Google Scholar] [CrossRef] [Green Version]
- Floegel, A.; Stefan, N.; Yu, Z.; Mühlenbruch, K.; Drogan, D.; Joost, H.G.; Fritsche, A.; Häring, H.U.; Hrabě de Angelis, M.; Peters, A.; et al. Identification of serum metabolites associated with risk of type 2 diabetes using a targeted metabolomic approach. Diabetes 2013, 62, 639–648. [Google Scholar] [CrossRef] [PubMed] [Green Version]
- Mahendran, Y.; Vangipurapu, J.; Cederberg, H.; Stancáková, A.; Pihlajamäki, J.; Soininen, P.; Kangas, A.J.; Paananen, J.; Civelek, M.; Saleem, N.K.; et al. Association of ketone body levels with hyperglycemia and type 2 diabetes in 9,398 Finnish men. Diabetes 2013, 62, 3618–3626. [Google Scholar] [CrossRef] [PubMed] [Green Version]
- Mahendran, Y.; Cederberg, H.; Vangipurapu, J.; Kangas, A.J.; Soininen, P.; Kuusisto, J.; Uusitupa, M.; Ala-Korpela, M.; Laakso, M. Glycerol and fatty acids in serum predict the development of hyperglycemia and type 2 diabetes in Finnish men. Diabetes Care 2013, 36, 3732–3738. [Google Scholar] [CrossRef] [PubMed] [Green Version]
- Tillin, T.; Hughes, A.D.; Wang, Q.; Würtz, P.; Ala-Korpela, M.; Sattar, N.; Forouhi, N.G.; Godsland, I.F.; Eastwood, S.V.; McKeigue, P.M.; et al. Diabetes risk and amino acid profiles: Cross-sectional and prospective analyses of ethnicity, amino acids and diabetes in a South Asian and European cohort from the SABRE (Southall And Brent REvisited) Study. Diabetologia 2015, 58, 968–979. [Google Scholar] [CrossRef] [PubMed] [Green Version]
- Fizelova, M.; Miilunpohja, M.; Kangas, A.J.; Soininen, P.; Kuusisto, J.; Ala-Korpela, M.; Laakso, M.; Stančáková, A. Associations of multiple lipoprotein and apolipoprotein measures with worsening of glycemia and incident type 2 diabetes in 6607 non-diabetic Finnish men. Atherosclerosis 2015, 240, 272–277. [Google Scholar] [CrossRef]
- Palmer, N.D.; Stevens, R.D.; Antinozzi, P.A.; Anderson, A.; Bergman, R.N.; Wagenknecht, L.E.; Newgard, C.B.; Bowden, D.W. Metabolomic profile associated with insulin resistance and conversion to diabetes in the Insulin Resistance Atherosclerosis Study. J. Clin. Endocrinol. Metab. 2015, 100, E463–E468. [Google Scholar] [CrossRef]
- Fall, T.; Salihovic, S.; Brandmaier, S.; Nowak, C.; Ganna, A.; Gustafsson, S.; Broeckling, C.D.; Prenni, J.E.; Kastenmüller, G.; Peters, A.; et al. Non-targeted metabolomics combined with genetic analyses identifies bile acid synthesis and phospholipid metabolism as being associated with incident type 2 diabetes. Diabetologia 2016, 59, 2114–2124. [Google Scholar] [CrossRef] [Green Version]
- Qiu, G.; Zheng, Y.; Wang, H.; Sun, J.; Ma, H.; Xiao, Y.; Li, Y.; Yuan, Y.; Yang, H.; Li, X.; et al. Plasma metabolomics identified novel metabolites associated with risk of type 2 diabetes in two prospective cohorts of Chinese adults. Int. J. Epidemiol. 2016, 45, 1507–1516. [Google Scholar] [CrossRef] [Green Version]
- Cobb, J.; Eckhart, A.; Motsinger-Reif, A.; Carr, B.; Groop, L.; Ferrannini, E. α-Hydroxybutyric Acid Is a Selective Metabolite Biomarker of Impaired Glucose Tolerance. Diabetes Care 2016, 39, 988–995. [Google Scholar] [CrossRef] [Green Version]
- Lu, Y.; Wang, Y.; Ong, C.N.; Subramaniam, T.; Choi, H.W.; Yuan, J.M.; Koh, W.P.; Pan, A. Metabolic signatures and risk of type 2 diabetes in a Chinese population: An untargeted metabolomics study using both LC-MS and GC-MS. Diabetologia 2016, 59, 2349–2359. [Google Scholar] [CrossRef] [Green Version]
- Peddinti, G.; Cobb, J.; Yengo, L.; Froguel, P.; Kravić, J.; Balkau, B.; Tuomi, T.; Aittokallio, T.; Groop, L. Early metabolic markers identify potential targets for the prevention of type 2 diabetes. Diabetologia 2017, 60, 1740–1750. [Google Scholar] [CrossRef] [PubMed] [Green Version]
- Liu, J.; Semiz, S.; van der Lee, S.J.; van der Spek, A.; Verhoeven, A.; van Klinken, J.B.; Sijbrands, E.; Harms, A.C.; Hankemeier, T.; van Dijk, K.W.; et al. Metabolomics based markers predict type 2 diabetes in a 14-year follow-up study. Metabolomics 2017, 13, 104. [Google Scholar] [CrossRef] [PubMed] [Green Version]
- Shi, L.; Brunius, C.; Lehtonen, M.; Auriola, S.; Bergdahl, I.A.; Rolandsson, O.; Hanhineva, K.; Landberg, R. Plasma metabolites associated with type 2 diabetes in a Swedish population: A case-control study nested in a prospective cohort. Diabetologia 2018, 61, 849–861. [Google Scholar] [CrossRef] [Green Version]
- Lu, Y.; Wang, Y.; Zou, L.; Liang, X.; Ong, C.N.; Tavintharan, S.; Yuan, J.M.; Koh, W.P.; Pan, A. Serum Lipids in Association With Type 2 Diabetes Risk and Prevalence in a Chinese Population. J. Clin. Endocrinol. Metab. 2018, 103, 671–680. [Google Scholar] [CrossRef] [PubMed]
- Yang, S.J.; Kwak, S.Y.; Jo, G.; Song, T.J.; Shin, M.J. Serum metabolite profile associated with incident type 2 diabetes in Koreans: Findings from the Korean Genome and Epidemiology Study. Sci. Rep. 2018, 8, 8207. [Google Scholar] [CrossRef] [Green Version]
- Rebholz, C.M.; Yu, B.; Zheng, Z.; Chang, P.; Tin, A.; Köttgen, A.; Wagenknecht, L.E.; Coresh, J.; Boerwinkle, E.; Selvin, E. Serum metabolomic profile of incident diabetes. Diabetologia 2018, 61, 1046–1054. [Google Scholar] [CrossRef] [Green Version]
- Merino, J.; Leong, A.; Liu, C.T.; Porneala, B.; Walford, G.A.; von Grotthuss, M.; Wang, T.J.; Flannick, J.; Dupuis, J.; Levy, D.; et al. Metabolomics insights into early type 2 diabetes pathogenesis and detection in individuals with normal fasting glucose. Diabetologia 2018, 61, 1315–1324. [Google Scholar] [CrossRef] [PubMed] [Green Version]
- Ahola-Olli, A.V.; Mustelin, L.; Kalimeri, M.; Kettunen, J.; Jokelainen, J.; Auvinen, J.; Puukka, K.; Havulinna, A.S.; Lehtimäki, T.; Kähönen, M.; et al. Circulating metabolites and the risk of type 2 diabetes: A prospective study of 11,896 young adults from four Finnish cohorts. Diabetologia 2019, 62, 2298–2309. [Google Scholar] [CrossRef] [Green Version]
- Vangipurapu, J.; Stancáková, A.; Smith, U.; Kuusisto, J.; Laakso, M. Nine Amino Acids Are Associated With Decreased Insulin Secretion and Elevated Glucose Levels in a 7.4-Year Follow-up Study of 5,181 Finnish Men. Diabetes 2019, 68, 1353–1358. [Google Scholar] [CrossRef]
- Ottosson, F.; Smith, E.; Gallo, W.; Fernandez, C.; Melander, O. Purine Metabolites and Carnitine Biosynthesis Intermediates Are Biomarkers for Incident Type 2 Diabetes. J. Clin. Endocrinol. Metab. 2019, 104, 4921–4930. [Google Scholar] [CrossRef] [Green Version]
- Razquin, C.; Ruiz-Canela, M.; Clish, C.B.; Li, J.; Toledo, E.; Dennis, C.; Liang, L.; Salas-Huetos, A.; Pierce, K.A.; Guasch-Ferré, M.; et al. Lysine pathway metabolites and the risk of type 2 diabetes and cardiovascular disease in the PREDIMED study: Results from two case-cohort studies. Cardiovasc. Diabetol. 2019, 18, 151. [Google Scholar] [CrossRef] [PubMed] [Green Version]
- Vangipurapu, J.; Fernandes Silva, L.; Kuulasmaa, T.; Smith, U.; Laakso, M. Microbiota-Related Metabolites and the Risk of Type 2 Diabetes. Diabetes Care 2020, 43, 1319–1325. [Google Scholar] [CrossRef]
- Ouyang, Y.; Qiu, G.; Zhao, X.; Su, B.; Feng, D.; Lv, W.; Xuan, Q.; Wang, L.; Yu, D.; Wang, Q.; et al. Metabolome-Genome-Wide Association Study (mGWAS) Reveals Novel Metabolites Associated with Future Type 2 Diabetes Risk and Susceptibility Loci in a Case-Control Study in a Chinese Prospective Cohort. Glob. Chall. 2021, 5, 2000088. [Google Scholar] [CrossRef]
- Qi, Q.; Li, J.; Yu, B.; Moon, J.Y.; Chai, J.C.; Merino, J.; Hu, J.; Ruiz-Canela, M.; Rebholz, C.; Wang, Z.; et al. Host and gut microbial tryptophan metabolism and type 2 diabetes: An integrative analysis of host genetics, diet, gut microbiome and circulating metabolites in cohort studies. Gut 2021. [Google Scholar] [CrossRef]
- Sokooti, S.; Flores-Guerrero, J.L.; Kieneker, L.M.; Heerspink, H.J.L.; Connelly, M.A.; Bakker, S.J.L.; Dullaart, R.P.F. HDL Particle Subspecies and Their Association with Incident Type 2 Diabetes: The PREVEND Study. J. Clin. Endocrinol. Metab. 2021, 106, 1761–1772. [Google Scholar] [CrossRef] [PubMed]
- Newgard, C.B.; An, J.; Bain, J.R.; Muehlbauer, M.J.; Stevens, R.D.; Lien, L.F.; Haqq, A.M.; Shah, S.H.; Arlotto, M.; Slentz, C.A.; et al. A branched-chain amino acid-related metabolic signature that differentiates obese and lean humans and contributes to insulin resistance. Cell Metab. 2009, 9, 311–326. [Google Scholar] [CrossRef] [Green Version]
- Lynch, C.J.; Adams, S.H. Branched-chain amino acids in metabolic signalling and insulin resistance. Nat. Rev. Endocrinol. 2014, 10, 723–736. [Google Scholar] [CrossRef] [PubMed] [Green Version]
- Mahendran, Y.; Jonsson, A.; Have, C.T.; Allin, K.H.; Witte, D.R.; Jørgensen, M.E.; Grarup, N.; Pedersen, O.; Kilpeläinen, T.O.; Hansen, T. Genetic evidence of a causal effect of insulin resistance on branched-chain amino acid levels. Diabetologia 2017, 60, 873–878. [Google Scholar] [CrossRef] [PubMed] [Green Version]
- Wang, Q.; Holmes, M.V.; Davey Smith, G.; Ala-Korpela, M. Genetic Support for a Causal Role of Insulin Resistance on Circulating Branched-Chain Amino Acids and Inflammation. Diabetes Care 2017, 40, 1779–1786. [Google Scholar] [CrossRef] [Green Version]
- Neinast, M.; Murashige, D.; Arany, Z. Branched Chain Amino Acids. Annu. Rev. Physiol. 2019, 81, 139–164. [Google Scholar] [CrossRef]
- Wang, W.; Wu, Z.; Dai, Z.; Yang, Y.; Wang, J.; Wu, G. Glycine metabolism in animals and humans: Implications for nutrition and health. Amino Acids 2013, 45, 463–477. [Google Scholar] [CrossRef]
- Wittemans, L.B.L.; Lotta, L.A.; Oliver-Williams, C.; Stewart, I.D.; Surendran, P.; Karthikeyan, S.; Day, F.R.; Koulman, A.; Imamura, F.; Zeng, L.; et al. Assessing the causal association of glycine with risk of cardio-metabolic diseases. Nat. Commun. 2019, 10, 1060. [Google Scholar] [CrossRef]
- Reaven, G.M. Banting lecture 1988. Role of insulin resistance in human disease. Diabetes 1988, 37, 1595–1607. [Google Scholar] [CrossRef]
- Otvos, J.D. Measurement of lipoprotein subclass profiles by nuclear magnetic resonance spectroscopy. Clin. Lab. 2002, 48, 171–180. [Google Scholar] [PubMed]
- Ramírez, M.; Amate, L.; Gil, A. Absorption and distribution of dietary fatty acids from different sources. Early Hum. Dev. 2001, 65, S95–S101. [Google Scholar] [CrossRef]
- Yuan, S.; Larsson, S.C. Association of genetic variants related to plasma fatty acids with type 2 diabetes mellitus and glycaemic traits: A Mendelian randomisation study. Diabetologia 2020, 63, 116–123. [Google Scholar] [CrossRef] [PubMed] [Green Version]
- Zhao, J.V.; Schooling, C.M. Effect of linoleic acid on ischemic heart disease and its risk factors: A Mendelian randomization study. BMC Med. 2019, 17, 61. [Google Scholar] [CrossRef] [Green Version]
- Lehtovirta, M.; Pahkala, K.; Niinikoski, H.; Kangas, A.J.; Soininen, P.; Lagström, H.; Viikari, J.S.A.; Rönnemaa, T.; Jula, A.; Ala-Korpela, M.; et al. Effect of Dietary Counseling on a Comprehensive Metabolic Profile from Childhood to Adulthood. J. Pediatr. 2018, 195, 190–198.e193. [Google Scholar] [CrossRef] [Green Version]
- Levey, A.S.; Perrone, R.D.; Madias, N.E. Serum creatinine and renal function. Annu. Rev. Med. 1988, 39, 465–490. [Google Scholar] [CrossRef] [PubMed]
- Xia, J.F.; Liang, Q.L.; Hu, P.; Wang, Y.M.; Li, P.; Luo, G.A. Correlations of six related purine metabolites and diabetic nephropathy in Chinese type 2 diabetic patients. Clin. Biochem. 2009, 42, 215–220. [Google Scholar] [CrossRef] [PubMed]
- Hirayama, A.; Nakashima, E.; Sugimoto, M.; Akiyama, S.; Sato, W.; Maruyama, S.; Matsuo, S.; Tomita, M.; Yuzawa, Y.; Soga, T. Metabolic profiling reveals new serum biomarkers for differentiating diabetic nephropathy. Anal. Bioanal. Chem. 2012, 404, 3101–3109. [Google Scholar] [CrossRef]
- van der Kloet, F.M.; Tempels, F.W.; Ismail, N.; van der Heijden, R.; Kasper, P.T.; Rojas-Cherto, M.; van Doorn, R.; Spijksma, G.; Koek, M.; van der Greef, J.; et al. Discovery of early-stage biomarkers for diabetic kidney disease using ms-based metabolomics (FinnDiane study). Metabolomics 2012, 8, 109–119. [Google Scholar] [CrossRef] [PubMed] [Green Version]
- Mäkinen, V.P.; Tynkkynen, T.; Soininen, P.; Forsblom, C.; Peltola, T.; Kangas, A.J.; Groop, P.H.; Ala-Korpela, M. Sphingomyelin is associated with kidney disease in type 1 diabetes (The FinnDiane Study). Metabolomics 2012, 8, 369–375. [Google Scholar] [CrossRef] [Green Version]
- Sharma, K.; Karl, B.; Mathew, A.V.; Gangoiti, J.A.; Wassel, C.L.; Saito, R.; Pu, M.; Sharma, S.; You, Y.H.; Wang, L.; et al. Metabolomics reveals signature of mitochondrial dysfunction in diabetic kidney disease. J. Am. Soc. Nephrol. 2013, 24, 1901–1912. [Google Scholar] [CrossRef] [PubMed]
- Pena, M.J.; Lambers Heerspink, H.J.; Hellemons, M.E.; Friedrich, T.; Dallmann, G.; Lajer, M.; Bakker, S.J.; Gansevoort, R.T.; Rossing, P.; de Zeeuw, D.; et al. Urine and plasma metabolites predict the development of diabetic nephropathy in individuals with Type 2 diabetes mellitus. Diabet. Med. 2014, 31, 1138–1147. [Google Scholar] [CrossRef]
- Klein, R.L.; Hammad, S.M.; Baker, N.L.; Hunt, K.J.; Al Gadban, M.M.; Cleary, P.A.; Virella, G.; Lopes-Virella, M.F. Decreased plasma levels of select very long chain ceramide species are associated with the development of nephropathy in type 1 diabetes. Metabolism 2014, 63, 1287–1295. [Google Scholar] [CrossRef] [Green Version]
- Niewczas, M.A.; Sirich, T.L.; Mathew, A.V.; Skupien, J.; Mohney, R.P.; Warram, J.H.; Smiles, A.; Huang, X.; Walker, W.; Byun, J.; et al. Uremic solutes and risk of end-stage renal disease in type 2 diabetes: Metabolomic study. Kidney Int. 2014, 85, 1214–1224. [Google Scholar] [CrossRef] [Green Version]
- Looker, H.C.; Colombo, M.; Hess, S.; Brosnan, M.J.; Farran, B.; Dalton, R.N.; Wong, M.C.; Turner, C.; Palmer, C.N.; Nogoceke, E.; et al. Biomarkers of rapid chronic kidney disease progression in type 2 diabetes. Kidney Int. 2015, 88, 888–896. [Google Scholar] [CrossRef] [Green Version]
- Liu, J.J.; Ghosh, S.; Kovalik, J.P.; Ching, J.; Choi, H.W.; Tavintharan, S.; Ong, C.N.; Sum, C.F.; Summers, S.A.; Tai, E.S.; et al. Profiling of Plasma Metabolites Suggests Altered Mitochondrial Fuel Usage and Remodeling of Sphingolipid Metabolism in Individuals With Type 2 Diabetes and Kidney Disease. Kidney Int. Rep. 2017, 2, 470–480. [Google Scholar] [CrossRef] [Green Version]
- Solini, A.; Manca, M.L.; Penno, G.; Pugliese, G.; Cobb, J.E.; Ferrannini, E. Prediction of Declining Renal Function and Albuminuria in Patients With Type 2 Diabetes by Metabolomics. J. Clin. Endocrinol. Metab. 2016, 101, 696–704. [Google Scholar] [CrossRef] [Green Version]
- Li, L.; Wang, C.; Yang, H.; Liu, S.; Lu, Y.; Fu, P.; Liu, J. Metabolomics reveal mitochondrial and fatty acid metabolism disorders that contribute to the development of DKD in T2DM patients. Mol. Biosyst. 2017, 13, 2392–2400. [Google Scholar] [CrossRef]
- Niewczas, M.A.; Mathew, A.V.; Croall, S.; Byun, J.; Major, M.; Sabisetti, V.S.; Smiles, A.; Bonventre, J.V.; Pennathur, S.; Krolewski, A.S. Circulating Modified Metabolites and a Risk of ESRD in Patients with Type 1 Diabetes and Chronic Kidney Disease. Diabetes Care 2017, 40, 383–390. [Google Scholar] [CrossRef] [PubMed] [Green Version]
- Haukka, J.K.; Sandholm, N.; Forsblom, C.; Cobb, J.E.; Groop, P.H.; Ferrannini, E. Metabolomic Profile Predicts Development of Microalbuminuria in Individuals with Type 1 Diabetes. Sci. Rep. 2018, 8, 13853. [Google Scholar] [CrossRef] [PubMed]
- Welsh, P.; Rankin, N.; Li, Q.; Mark, P.B.; Würtz, P.; Ala-Korpela, M.; Marre, M.; Poulter, N.; Hamet, P.; Chalmers, J.; et al. Circulating amino acids and the risk of macrovascular, microvascular and mortality outcomes in individuals with type 2 diabetes: Results from the ADVANCE trial. Diabetologia 2018, 61, 1581–1591. [Google Scholar] [CrossRef] [Green Version]
- Tavares, G.; Venturini, G.; Padilha, K.; Zatz, R.; Pereira, A.C.; Thadhani, R.I.; Rhee, E.P.; Titan, S.M.O. 1,5-Anhydroglucitol predicts CKD progression in macroalbuminuric diabetic kidney disease: Results from non-targeted metabolomics. Metabolomics 2018, 14, 39. [Google Scholar] [CrossRef]
- Barrios, C.; Zierer, J.; Würtz, P.; Haller, T.; Metspalu, A.; Gieger, C.; Thorand, B.; Meisinger, C.; Waldenberger, M.; Raitakari, O. Circulating metabolic biomarkers of renal function in diabetic and non-diabetic populations. Sci. Rep. 2018, 8, 15249. [Google Scholar] [CrossRef] [PubMed]
- Afshinnia, F.; Nair, V.; Lin, J.; Rajendiran, T.M.; Soni, T.; Byun, J.; Sharma, K.; Fort, P.E.; Gardner, T.W.; Looker, H.C.; et al. Increased lipogenesis and impaired β-oxidation predict type 2 diabetic kidney disease progression in American Indians. JCI Insight 2019, 4, e130317. [Google Scholar] [CrossRef] [PubMed]
- Tofte, N.; Suvitaival, T.; Trost, K.; Mattila, I.M.; Theilade, S.; Winther, S.A.; Ahluwalia, T.S.; Frimodt-Møller, M.; Legido-Quigley, C.; Rossing, P. Metabolomic Assessment Reveals Alteration in Polyols and Branched Chain Amino Acids Associated with Present and Future Renal Impairment in a Discovery Cohort of 637 Persons with Type 1 Diabetes. Front. Endocrinol. 2019, 10, 818. [Google Scholar] [CrossRef] [PubMed]
- Tang, X.; You, J.; Liu, D.; Xia, M.; He, L.; Liu, H. 5-Hydroxyhexanoic Acid Predicts Early Renal Functional Decline in Type 2 Diabetes Patients with Microalbuminuria. Kidney Blood Press. Res. 2019, 44, 245–263. [Google Scholar] [CrossRef]
- Colombo, M.; Looker, H.C.; Farran, B.; Hess, S.; Groop, L.; Palmer, C.N.A.; Brosnan, M.J.; Dalton, R.N.; Wong, M.; Turner, C.; et al. Serum kidney injury molecule 1 and β(2)-microglobulin perform as well as larger biomarker panels for prediction of rapid decline in renal function in type 2 diabetes. Diabetologia 2019, 62, 156–168. [Google Scholar] [CrossRef] [Green Version]
- Colombo, M.; Valo, E.; McGurnaghan, S.J.; Sandholm, N.; Blackbourn, L.A.K.; Dalton, R.N.; Dunger, D.; Groop, P.H.; McKeigue, P.M.; Forsblom, C.; et al. Biomarker panels associated with progression of renal disease in type 1 diabetes. Diabetologia 2019, 62, 1616–1627. [Google Scholar] [CrossRef] [Green Version]
- Winther, S.A.; Henriksen, P.; Vogt, J.K.; Hansen, T.H.; Ahonen, L.; Suvitaival, T.; Hein Zobel, E.; Frimodt-Møller, M.; Hansen, T.W.; Hansen, T.; et al. Gut microbiota profile and selected plasma metabolites in type 1 diabetes without and with stratification by albuminuria. Diabetologia 2020, 63, 2713–2724. [Google Scholar] [CrossRef]
- Huang, J.; Huth, C.; Covic, M.; Troll, M.; Adam, J.; Zukunft, S.; Prehn, C.; Wang, L.; Nano, J.; Scheerer, M.F.; et al. Machine Learning Approaches Reveal Metabolic Signatures of Incident Chronic Kidney Disease in Individuals with Prediabetes and Type 2 Diabetes. Diabetes 2020, 69, 2756–2765. [Google Scholar] [CrossRef]
- Kwan, B.; Fuhrer, T.; Zhang, J.; Darshi, M.; Van Espen, B.; Montemayor, D.; de Boer, I.H.; Dobre, M.; Hsu, C.Y.; Kelly, T.N.; et al. Metabolomic Markers of Kidney Function Decline in Patients With Diabetes: Evidence From the Chronic Renal Insufficiency Cohort (CRIC) Study. Am. J. Kidney Dis. 2020, 76, 511–520. [Google Scholar] [CrossRef] [PubMed]
- Tofte, N.; Vogelzangs, N.; Mook-Kanamori, D.; Brahimaj, A.; Nano, J.; Ahmadizar, F.; van Dijk, K.W.; Frimodt-Møller, M.; Arts, I.; Beulens, J.W.J.; et al. Plasma Metabolomics Identifies Markers of Impaired Renal Function: A Meta-analysis of 3089 Persons with Type 2 Diabetes. J. Clin. Endocrinol. Metab. 2020, 105, 2275–2287. [Google Scholar] [CrossRef]
- Pongrac Barlovic, D.; Harjutsalo, V.; Sandholm, N.; Forsblom, C.; Groop, P.H. Sphingomyelin and progression of renal and coronary heart disease in individuals with type 1 diabetes. Diabetologia 2020, 63, 1847–1856. [Google Scholar] [CrossRef] [PubMed]
- Pawlak, D.; Tankiewicz, A.; Matys, T.; Buczko, W. Peripheral distribution of kynurenine metabolites and activity of kynurenine pathway enzymes in renal failure. J. Physiol. Pharmacol. 2003, 54, 175–189. [Google Scholar] [PubMed]
- Kopple, J.D. Phenylalanine and tyrosine metabolism in chronic kidney failure. J. Nutr. 2007, 137, 1586S–1590S; discussion 1597S–1598S. [Google Scholar] [CrossRef]
- Lanktree, M.B.; Thériault, S.; Walsh, M.; Paré, G. HDL Cholesterol, LDL Cholesterol, and Triglycerides as Risk Factors for CKD: A Mendelian Randomization Study. Am. J. Kidney Dis. 2018, 71, 166–172. [Google Scholar] [CrossRef]
- van der Veen, J.N.; Kennelly, J.P.; Wan, S.; Vance, J.E.; Vance, D.E.; Jacobs, R.L. The critical role of phosphatidylcholine and phosphatidylethanolamine metabolism in health and disease. Biochim. Biophys. Acta Biomembr. 2017, 1859, 1558–1572. [Google Scholar] [CrossRef] [PubMed]
- Harris, K.; Oshima, M.; Sattar, N.; Würtz, P.; Jun, M.; Welsh, P.; Hamet, P.; Harrap, S.; Poulter, N.; Chalmers, J.; et al. Plasma fatty acids and the risk of vascular disease and mortality outcomes in individuals with type 2 diabetes: Results from the ADVANCE study. Diabetologia 2020, 63, 1637–1647. [Google Scholar] [CrossRef] [PubMed]
- Perkovic, V.; Jardine, M.J.; Neal, B.; Bompoint, S.; Heerspink, H.J.L.; Charytan, D.M.; Edwards, R.; Agarwal, R.; Bakris, G.; Bull, S.; et al. Canagliflozin and Renal Outcomes in Type 2 Diabetes and Nephropathy. N. Engl. J. Med. 2019, 380, 2295–2306. [Google Scholar] [CrossRef] [PubMed] [Green Version]
- Wanner, C.; Inzucchi, S.E.; Zinman, B. Empagliflozin and Progression of Kidney Disease in Type 2 Diabetes. N. Engl. J. Med. 2016, 375, 1801–1802. [Google Scholar] [CrossRef] [PubMed]
- Mulder, S.; Heerspink, H.J.L.; Darshi, M.; Kim, J.J.; Laverman, G.D.; Sharma, K.; Pena, M.J. Effects of dapagliflozin on urinary metabolites in people with type 2 diabetes. Diabetes Obes. Metab. 2019, 21, 2422–2428. [Google Scholar] [CrossRef] [PubMed]
- Mulder, S.; Hammarstedt, A.; Nagaraj, S.B.; Nair, V.; Ju, W.; Hedberg, J.; Greasley, P.J.; Eriksson, J.W.; Oscarsson, J.; Heerspink, H.J.L. A metabolomics-based molecular pathway analysis of how the sodium-glucose co-transporter-2 inhibitor dapagliflozin may slow kidney function decline in patients with diabetes. Diabetes Obes. Metab. 2020, 22, 1157–1166. [Google Scholar] [CrossRef]
- Taegtmeyer, H.; Young, M.E.; Lopaschuk, G.D.; Abel, E.D.; Brunengraber, H.; Darley-Usmar, V.; Des Rosiers, C.; Gerszten, R.; Glatz, J.F.; Griffin, J.L.; et al. Assessing Cardiac Metabolism: A Scientific Statement from the American Heart Association. Circ. Res. 2016, 118, 1659–1701. [Google Scholar] [CrossRef]
- McGarrah, R.W.; Crown, S.B.; Zhang, G.F.; Shah, S.H.; Newgard, C.B. Cardiovascular Metabolomics. Circ. Res. 2018, 122, 1238–1258. [Google Scholar] [CrossRef]
- Ussher, J.R.; Elmariah, S.; Gerszten, R.E.; Dyck, J.R. The Emerging Role of Metabolomics in the Diagnosis and Prognosis of Cardiovascular Disease. J. Am. Coll. Cardiol. 2016, 68, 2850–2870. [Google Scholar] [CrossRef]
- Iliou, A.; Mikros, E.; Karaman, I.; Elliott, F.; Griffin, J.L.; Tzoulaki, I.; Elliott, P. Metabolic phenotyping and cardiovascular disease: An overview of evidence from epidemiological settings. Heart 2021, 107, 1123–1129. [Google Scholar] [CrossRef] [PubMed]
- Soedamah-Muthu, S.S.; Chang, Y.F.; Otvos, J.; Evans, R.W.; Orchard, T.J. Lipoprotein subclass measurements by nuclear magnetic resonance spectroscopy improve the prediction of coronary artery disease in Type 1 diabetes. A prospective report from the Pittsburgh Epidemiology of Diabetes Complications Study. Diabetologia 2003, 46, 674–682. [Google Scholar] [CrossRef] [Green Version]
- Krzyzanowska, K.; Mittermayer, F.; Krugluger, W.; Schnack, C.; Hofer, M.; Wolzt, M.; Schernthaner, G. Asymmetric dimethylarginine is associated with macrovascular disease and total homocysteine in patients with type 2 diabetes. Atherosclerosis 2006, 189, 236–240. [Google Scholar] [CrossRef] [PubMed]
- Lajer, M.; Tarnow, L.; Jorsal, A.; Teerlink, T.; Parving, H.H.; Rossing, P. Plasma concentration of asymmetric dimethylarginine (ADMA) predicts cardiovascular morbidity and mortality in type 1 diabetic patients with diabetic nephropathy. Diabetes Care 2008, 31, 747–752. [Google Scholar] [CrossRef] [PubMed] [Green Version]
- Krzyzanowska, K.; Mittermayer, F.; Wolzt, M.; Schernthaner, G. Asymmetric dimethylarginine predicts cardiovascular events in patients with type 2 diabetes. Diabetes Care 2007, 30, 1834–1839. [Google Scholar] [CrossRef] [PubMed] [Green Version]
- Kume, S.; Araki, S.; Ono, N.; Shinhara, A.; Muramatsu, T.; Araki, H.; Isshiki, K.; Nakamura, K.; Miyano, H.; Koya, D.; et al. Predictive properties of plasma amino acid profile for cardiovascular disease in patients with type 2 diabetes. PLoS ONE 2014, 9, e101219. [Google Scholar] [CrossRef] [PubMed]
- Liu, X.; Gao, J.; Chen, J.; Wang, Z.; Shi, Q.; Man, H.; Guo, S.; Wang, Y.; Li, Z.; Wang, W. Identification of metabolic biomarkers in patients with type 2 diabetic coronary heart diseases based on metabolomic approach. Sci. Rep. 2016, 6, 30785. [Google Scholar] [CrossRef] [PubMed]
- Croyal, M.; Saulnier, P.J.; Aguesse, A.; Gand, E.; Ragot, S.; Roussel, R.; Halimi, J.M.; Ducrocq, G.; Cariou, B.; Montaigne, D.; et al. Plasma Trimethylamine N-Oxide and Risk of Cardiovascular Events in Patients with Type 2 Diabetes. J. Clin. Endocrinol. Metab 2020, 105. [Google Scholar] [CrossRef]
- Magnusson, M.; Lewis, G.D.; Ericson, U.; Orho-Melander, M.; Hedblad, B.; Engström, G.; Ostling, G.; Clish, C.; Wang, T.J.; Gerszten, R.E.; et al. A diabetes-predictive amino acid score and future cardiovascular disease. Eur. Heart J. 2013, 34, 1982–1989. [Google Scholar] [CrossRef] [Green Version]
- Ruiz-Canela, M.; Toledo, E.; Clish, C.B.; Hruby, A.; Liang, L.; Salas-Salvadó, J.; Razquin, C.; Corella, D.; Estruch, R.; Ros, E.; et al. Plasma Branched-Chain Amino Acids and Incident Cardiovascular Disease in the PREDIMED Trial. Clin. Chem. 2016, 62, 582–592. [Google Scholar] [CrossRef] [Green Version]
- Würtz, P.; Havulinna, A.S.; Soininen, P.; Tynkkynen, T.; Prieto-Merino, D.; Tillin, T.; Ghorbani, A.; Artati, A.; Wang, Q.; Tiainen, M.; et al. Metabolite profiling and cardiovascular event risk: A prospective study of 3 population-based cohorts. Circulation 2015, 131, 774–785. [Google Scholar] [CrossRef] [Green Version]
- Delles, C.; Rankin, N.J.; Boachie, C.; McConnachie, A.; Ford, I.; Kangas, A.; Soininen, P.; Trompet, S.; Mooijaart, S.P.; Jukema, J.W.; et al. Nuclear magnetic resonance-based metabolomics identifies phenylalanine as a novel predictor of incident heart failure hospitalisation: Results from PROSPER and FINRISK 1997. Eur. J. Heart Fail. 2018, 20, 663–673. [Google Scholar] [CrossRef] [Green Version]
- Voight, B.F.; Peloso, G.M.; Orho-Melander, M.; Frikke-Schmidt, R.; Barbalic, M.; Jensen, M.K.; Hindy, G.; Hólm, H.; Ding, E.L.; Johnson, T.; et al. Plasma HDL cholesterol and risk of myocardial infarction: A mendelian randomisation study. Lancet 2012, 380, 572–580. [Google Scholar] [CrossRef] [Green Version]
- Holmes, M.V.; Asselbergs, F.W.; Palmer, T.M.; Drenos, F.; Lanktree, M.B.; Nelson, C.P.; Dale, C.E.; Padmanabhan, S.; Finan, C.; Swerdlow, D.I.; et al. Mendelian randomization of blood lipids for coronary heart disease. Eur. Heart J. 2015, 36, 539–550. [Google Scholar] [CrossRef] [Green Version]
- Barter, P.J.; Caulfield, M.; Eriksson, M.; Grundy, S.M.; Kastelein, J.J.; Komajda, M.; Lopez-Sendon, J.; Mosca, L.; Tardif, J.C.; Waters, D.D.; et al. Effects of torcetrapib in patients at high risk for coronary events. N. Engl. J. Med. 2007, 357, 2109–2122. [Google Scholar] [CrossRef] [Green Version]
- Schwartz, G.G.; Olsson, A.G.; Abt, M.; Ballantyne, C.M.; Barter, P.J.; Brumm, J.; Chaitman, B.R.; Holme, I.M.; Kallend, D.; Leiter, L.A.; et al. Effects of dalcetrapib in patients with a recent acute coronary syndrome. N. Engl. J. Med. 2012, 367, 2089–2099. [Google Scholar] [CrossRef] [PubMed] [Green Version]
- Lincoff, A.M.; Nicholls, S.J.; Riesmeyer, J.S.; Barter, P.J.; Brewer, H.B.; Fox, K.A.A.; Gibson, C.M.; Granger, C.; Menon, V.; Montalescot, G.; et al. Evacetrapib and Cardiovascular Outcomes in High-Risk Vascular Disease. N. Engl. J. Med. 2017, 376, 1933–1942. [Google Scholar] [CrossRef]
- Bowman, L.; Hopewell, J.C.; Chen, F.; Wallendszus, K.; Stevens, W.; Collins, R.; Wiviott, S.D.; Cannon, C.P.; Braunwald, E.; Sammons, E.; et al. Effects of Anacetrapib in Patients with Atherosclerotic Vascular Disease. N. Engl. J. Med. 2017, 377, 1217–1227. [Google Scholar] [CrossRef] [PubMed]
- Boden, W.E.; Probstfield, J.L.; Anderson, T.; Chaitman, B.R.; Desvignes-Nickens, P.; Koprowicz, K.; McBride, R.; Teo, K.; Weintraub, W. Niacin in patients with low HDL cholesterol levels receiving intensive statin therapy. N. Engl. J. Med. 2011, 365, 2255–2267. [Google Scholar] [CrossRef] [PubMed] [Green Version]
- Nissen, S.E.; Tardif, J.C.; Nicholls, S.J.; Revkin, J.H.; Shear, C.L.; Duggan, W.T.; Ruzyllo, W.; Bachinsky, W.B.; Lasala, G.P.; Tuzcu, E.M. Effect of torcetrapib on the progression of coronary atherosclerosis. N. Engl. J. Med. 2007, 356, 1304–1316. [Google Scholar] [CrossRef]
- Rader, D.J.; Hovingh, G.K. HDL and cardiovascular disease. Lancet 2014, 384, 618–625. [Google Scholar] [CrossRef]
- Oram, J.F.; Heinecke, J.W. ATP-binding cassette transporter A1: A cell cholesterol exporter that protects against cardiovascular disease. Physiol. Rev. 2005, 85, 1343–1372. [Google Scholar] [CrossRef] [PubMed]
- Du, X.M.; Kim, M.J.; Hou, L.; Le Goff, W.; Chapman, M.J.; Van Eck, M.; Curtiss, L.K.; Burnett, J.R.; Cartland, S.P.; Quinn, C.M.; et al. HDL particle size is a critical determinant of ABCA1-mediated macrophage cellular cholesterol export. Circ. Res. 2015, 116, 1133–1142. [Google Scholar] [CrossRef] [PubMed] [Green Version]
- Camont, L.; Chapman, M.J.; Kontush, A. Biological activities of HDL subpopulations and their relevance to cardiovascular disease. Trends Mol. Med. 2011, 17, 594–603. [Google Scholar] [CrossRef] [PubMed]
- Kingwell, B.A.; Chapman, M.J.; Kontush, A.; Miller, N.E. HDL-targeted therapies: Progress, failures and future. Nat. Rev. Drug Discov. 2014, 13, 445–464. [Google Scholar] [CrossRef] [PubMed]
- Kontush, A.; Chantepie, S.; Chapman, M.J. Small, dense HDL particles exert potent protection of atherogenic LDL against oxidative stress. Arterioscler. Thromb. Vasc. Biol. 2003, 23, 1881–1888. [Google Scholar] [CrossRef] [PubMed] [Green Version]
- Camont, L.; Lhomme, M.; Rached, F.; Le Goff, W.; Nègre-Salvayre, A.; Salvayre, R.; Calzada, C.; Lagarde, M.; Chapman, M.J.; Kontush, A. Small, dense high-density lipoprotein-3 particles are enriched in negatively charged phospholipids: Relevance to cellular cholesterol efflux, antioxidative, antithrombotic, anti-inflammatory, and antiapoptotic functionalities. Arterioscler. Thromb. Vasc. Biol. 2013, 33, 2715–2723. [Google Scholar] [CrossRef] [Green Version]
- Hunter, W.G.; McGarrah, R.W., 3rd; Kelly, J.P.; Khouri, M.G.; Craig, D.M.; Haynes, C.; Felker, G.M.; Hernandez, A.F.; Velazquez, E.J.; Kraus, W.E.; et al. High-Density Lipoprotein Particle Subfractions in Heart Failure with Preserved or Reduced Ejection Fraction. J. Am. Coll. Cardiol. 2019, 73, 177–186. [Google Scholar] [CrossRef]
- Chei, C.L.; Yamagishi, K.; Kitamura, A.; Kiyama, M.; Imano, H.; Ohira, T.; Cui, R.; Tanigawa, T.; Sankai, T.; Ishikawa, Y.; et al. High-density lipoprotein subclasses and risk of stroke and its subtypes in Japanese population: The Circulatory Risk in Communities Study. Stroke 2013, 44, 327–333. [Google Scholar] [CrossRef] [Green Version]
- Otvos, J.D.; Collins, D.; Freedman, D.S.; Shalaurova, I.; Schaefer, E.J.; McNamara, J.R.; Bloomfield, H.E.; Robins, S.J. Low-density lipoprotein and high-density lipoprotein particle subclasses predict coronary events and are favorably changed by gemfibrozil therapy in the Veterans Affairs High-Density Lipoprotein Intervention Trial. Circulation 2006, 113, 1556–1563. [Google Scholar] [CrossRef]
- Silbernagel, G.; Pagel, P.; Pfahlert, V.; Genser, B.; Scharnagl, H.; Kleber, M.E.; Delgado, G.; Ohrui, H.; Ritsch, A.; Grammer, T.B.; et al. High-Density Lipoprotein Subclasses, Coronary Artery Disease, and Cardiovascular Mortality. Clin. Chem. 2017, 63, 1886–1896. [Google Scholar] [CrossRef] [Green Version]
- McGarrah, R.W.; Craig, D.M.; Haynes, C.; Dowdy, Z.E.; Shah, S.H.; Kraus, W.E. High-density lipoprotein subclass measurements improve mortality risk prediction, discrimination and reclassification in a cardiac catheterization cohort. Atherosclerosis 2016, 246, 229–235. [Google Scholar] [CrossRef] [Green Version]
- Martin, S.S.; Khokhar, A.A.; May, H.T.; Kulkarni, K.R.; Blaha, M.J.; Joshi, P.H.; Toth, P.P.; Muhlestein, J.B.; Anderson, J.L.; Knight, S.; et al. HDL cholesterol subclasses, myocardial infarction, and mortality in secondary prevention: The Lipoprotein Investigators Collaborative. Eur. Heart J. 2015, 36, 22–30. [Google Scholar] [CrossRef] [Green Version]
- Parish, S.; Offer, A.; Clarke, R.; Hopewell, J.C.; Hill, M.R.; Otvos, J.D.; Armitage, J.; Collins, R. Lipids and lipoproteins and risk of different vascular events in the MRC/BHF Heart Protection Study. Circulation 2012, 125, 2469–2478. [Google Scholar] [CrossRef] [Green Version]
- Joshi, P.H.; Toth, P.P.; Lirette, S.T.; Griswold, M.E.; Massaro, J.M.; Martin, S.S.; Blaha, M.J.; Kulkarni, K.R.; Khokhar, A.A.; Correa, A.; et al. Association of high-density lipoprotein subclasses and incident coronary heart disease: The Jackson Heart and Framingham Offspring Cohort Studies. Eur. J. Prev. Cardiol. 2016, 23, 41–49. [Google Scholar] [CrossRef] [Green Version]
- Mora, S.; Otvos, J.D.; Rifai, N.; Rosenson, R.S.; Buring, J.E.; Ridker, P.M. Lipoprotein particle profiles by nuclear magnetic resonance compared with standard lipids and apolipoproteins in predicting incident cardiovascular disease in women. Circulation 2009, 119, 931–939. [Google Scholar] [CrossRef] [Green Version]
- Akinkuolie, A.O.; Paynter, N.P.; Padmanabhan, L.; Mora, S. High-density lipoprotein particle subclass heterogeneity and incident coronary heart disease. Circ. Cardiovasc. Qual. Outcomes 2014, 7, 55–63. [Google Scholar] [CrossRef] [Green Version]
- Xepapadaki, E.; Nikdima, I.; Sagiadinou, E.C.; Zvintzou, E.; Kypreos, K.E. HDL and type 2 diabetes: The chicken or the egg? Diabetologia 2021, 64, 1917–1926. [Google Scholar] [CrossRef] [PubMed]
- Ahmed, M.O.; Byrne, R.E.; Pazderska, A.; Segurado, R.; Guo, W.; Gunness, A.; Frizelle, I.; Sherlock, M.; Ahmed, K.S.; McGowan, A.; et al. HDL particle size is increased and HDL-cholesterol efflux is enhanced in type 1 diabetes: A cross-sectional study. Diabetologia 2021, 64, 656–667. [Google Scholar] [CrossRef] [PubMed]
- Soria-Florido, M.T.; Castañer, O.; Lassale, C.; Estruch, R.; Salas-Salvadó, J.; Martínez-González, M.; Corella, D.; Ros, E.; Arós, F.; Elosua, R.; et al. Dysfunctional High-Density Lipoproteins Are Associated With a Greater Incidence of Acute Coronary Syndrome in a Population at High Cardiovascular Risk: A Nested Case-Control Study. Circulation 2020, 141, 444–453. [Google Scholar] [CrossRef] [PubMed]
- Holmes, M.V.; Millwood, I.Y.; Kartsonaki, C.; Hill, M.R.; Bennett, D.A.; Boxall, R.; Guo, Y.; Xu, X.; Bian, Z.; Hu, R.; et al. Lipids, Lipoproteins, and Metabolites and Risk of Myocardial Infarction and Stroke. J. Am. Coll. Cardiol. 2018, 71, 620–632. [Google Scholar] [CrossRef]
- Wang, T.J. Assessing the role of circulating, genetic, and imaging biomarkers in cardiovascular risk prediction. Circulation 2011, 123, 551–565. [Google Scholar] [CrossRef] [Green Version]
- Wang, T.J.; Gona, P.; Larson, M.G.; Tofler, G.H.; Levy, D.; Newton-Cheh, C.; Jacques, P.F.; Rifai, N.; Selhub, J.; Robins, S.J.; et al. Multiple biomarkers for the prediction of first major cardiovascular events and death. N. Engl. J. Med. 2006, 355, 2631–2639. [Google Scholar] [CrossRef] [Green Version]
- Roberts, L.D.; Gerszten, R.E. Toward new biomarkers of cardiometabolic diseases. Cell Metab. 2013, 18, 43–50. [Google Scholar] [CrossRef] [Green Version]
- Joshi, A.; Rienks, M.; Theofilatos, K.; Mayr, M. Systems biology in cardiovascular disease: A multiomics approach. Nat. Rev. Cardiol. 2021, 18, 313–330. [Google Scholar] [CrossRef]
- Lotta, L.A.; Pietzner, M.; Stewart, I.D.; Wittemans, L.B.L.; Li, C.; Bonelli, R.; Raffler, J.; Biggs, E.K.; Oliver-Williams, C.; Auyeung, V.P.W.; et al. A cross-platform approach identifies genetic regulators of human metabolism and health. Nat. Genet. 2021, 53, 54–64. [Google Scholar] [CrossRef] [PubMed]
- Kettunen, J.; Tukiainen, T.; Sarin, A.P.; Ortega-Alonso, A.; Tikkanen, E.; Lyytikäinen, L.P.; Kangas, A.J.; Soininen, P.; Würtz, P.; Silander, K.; et al. Genome-wide association study identifies multiple loci influencing human serum metabolite levels. Nat. Genet. 2012, 44, 269–276. [Google Scholar] [CrossRef] [Green Version]
- Illig, T.; Gieger, C.; Zhai, G.; Römisch-Margl, W.; Wang-Sattler, R.; Prehn, C.; Altmaier, E.; Kastenmüller, G.; Kato, B.S.; Mewes, H.W.; et al. A genome-wide perspective of genetic variation in human metabolism. Nat. Genet. 2010, 42, 137–141. [Google Scholar] [CrossRef] [PubMed] [Green Version]
- Davies, N.M.; Holmes, M.V.; Davey Smith, G. Reading Mendelian randomisation studies: A guide, glossary, and checklist for clinicians. BMJ 2018, 362, k601. [Google Scholar] [CrossRef] [PubMed] [Green Version]
- Choobdar, S.; Ahsen, M.E.; Crawford, J.; Tomasoni, M.; Fang, T.; Lamparter, D.; Lin, J.; Hescott, B.; Hu, X.; Mercer, J. Assessment of network module identification across complex diseases. Nat. Methods 2019, 16, 843–852. [Google Scholar] [CrossRef] [PubMed] [Green Version]
- O’Sullivan, A.; Gibney, M.J.; Brennan, L. Dietary intake patterns are reflected in metabolomic profiles: Potential role in dietary assessment studies. Am. J. Clin. Nutr. 2011, 93, 314–321. [Google Scholar] [CrossRef] [Green Version]
- Wang, Z.; Klipfell, E.; Bennett, B.J.; Koeth, R.; Levison, B.S.; DuGar, B.; Feldstein, A.E.; Britt, E.B.; Fu, X.; Chung, Y.-M. Gut flora metabolism of phosphatidylcholine promotes cardiovascular disease. Nature 2011, 472, 57–63. [Google Scholar] [CrossRef] [PubMed] [Green Version]
- Jia, J.; Dou, P.; Gao, M.; Kong, X.; Li, C.; Liu, Z.; Huang, T. Assessment of Causal Direction Between Gut Microbiota-Dependent Metabolites and Cardiometabolic Health: A Bidirectional Mendelian Randomization Analysis. Diabetes 2019, 68, 1747–1755. [Google Scholar] [CrossRef] [PubMed]


| NMR | GC-MS | LC-MS | |
|---|---|---|---|
| Applications | Targeted and untargeted | Targeted and untargeted | Targeted and untargeted |
| Throughput | 10–30 min | 20–60 min | 15–60 min |
| Advantages | Nondestructive and suitable for in vivo | Sensitive | Highly sensitive |
| Quantitative of absolute concentrations | Quantitative of absolute concentrations | Wide dynamic range | |
| Requiring little or no sample preparation | Robust and reproducible | No need for derivatization | |
| Automated and robust | Small sample volume required (~1 uL) | Small sample volume required (10–100 uL) | |
| Highly reproducible | Available databases for identification (i.e., NIST) | Compatible with solids and liquids | |
| Less expensive compared with LC-MS | |||
| Disadvantages | Poor sensitivity | Destructive | Destructive |
| Large sample volumes required (~0.5 mL) | Requiring derivatization and separation | Requiring separation | |
| Not compatible with solids | Lack of absolute quantification in untargeted applications | ||
| Less reproducible | |||
| Difficulty in unknown metabolite identification | |||
| More expensive compared with GC-MS |
| Reference; Year | Study Design | Number, Follow-Up | Technique | Biological Matrix | Outcome | Adjustments | Major Findings | Replication |
|---|---|---|---|---|---|---|---|---|
| [36]; 2005 | IRAS; America; population-based cohort | 825 (129 T2D); 5.2 years | Targeted; NMR | Plasma | Incident T2D | Age, gender, and ethnicity | (+): VLDL particle, large VLDL, LDL particle, small LDL, small HDL, triglycerides; (−): large HDL, HDL cholesterol | No |
| [37]; 2010 | WHS; America; randomized, double-blinded, placebo-controlled trial | 26,836 (1687 T2D); 13.3 years | Targeted; NMR | Plasma | Incident T2D | Age, race, randomized treatment assignment, smoking, exercise, education, menopausal status, hormone use, blood pressure, BMI, family history of diabetes, HbA1C, and high-sensitivity C-Reactive protein | (+): total LDL particle, IDL particle, small LDL particle, small HDL particle, triglycerides, total VLDL particle, large VLDL particle, small VLDL particle (−): large LDL particle, HDL cholesterol, total HDL particle, large HDL particle | No |
| [38]; 2011 | FHS; America; nested case–control | 189 T2D and 189 control; 12 years | Targeted; LC-MS | Plasma | Incident T2D | Age, sex, BMI, FPG, and family history of T2D | (+): isoleucine, leucine, valine, tyrosine, phenylalanine | Yes; Malmö Diet and Cancer study, Sweden; nested case–control (163 T2D and 163 no T2D) |
| [39]; 2012 | METSIM; Finland; population-based cohort | 1775 (151 T2D); 4.7 years | Targeted; NMR | Serum | Incident T2D | Age, BMI | (+): alanine, isoleucine, leucine, phenylalanine, tyrosine; (−): glutamine | No |
| [40]; 2012 | KORA; Germany; population-based cohort | 589 (118 IGT) and 876 (91 T2D); 7 years | Targeted; LC-MS | Plasma | Incident IGT and T2D | Age, sex, BMI, physical activity, alcohol intake, smoking, systolic BP and HDL cholesterol | (−): glycine, LPC (18:2) | No |
| [41]; 2013 | Botnia study; Finland; family-based study | 2580 (151 T2D); 9.5 years | Targeted; LC-MS | Plasma | Incident T2D | Age, sex, BMI, family history of diabetes, and fasting glucose | (+): a-hydroxybutyrate; (−): L-GPC | No |
| [42]; 2013 | EPIC; Germany; case–cohort | 2282 (800 T2D); 7 years | Targeted; MS | Serum | Incident T2D | Age, sex, alcohol intake, smoking, physical activity, education, coffee intake, red meat intake, whole-grain bread intake, prevalent hypertension BMI, and waist circumference | (+): hexose, phenylalanine, diacyl-phosphatidylcholines (C32:1, C36:1, C38:3, C40:5); (−): glycine, sphingomyelin C16:1, lysophospha-tidylcholine C18:2, and acyl-alkyl-phosphatidylcholines (C34:3, C40:6, C42:5, C44:4, C44:5) | Yes; KORA, Germany; 876 (91 T2D); 7 years |
| [43], 2013 | METSIM; Finland; population-based cohort | 4306 (276 T2D); 5 years | Targeted; NMR | Plasma | Incident T2D | Age, BMI, smoking, and physical activity | (+): acetoacetate | No |
| [44]; 2013 | METSIM; Finland; population-based cohort | 4335 (276 T2D); 4.5 years | Targeted; NMR | Plasma | Incident T2D | Age, BMI, smoking, and physical activity | (+): glycerol, total fatty acids, triglycerides, monounsaturated fatty acids%, saturated fatty acids%; (−): n-3 fatty acids%, n-6 fatty acids%, linoleic acid%. | No |
| [45]; 2015 | SABRE; Britain; population-based cohort | 801 Europeans (113 T2D) and 643 South Asians (227 T2D); 19 years | Targeted; NMR | Serum | Incident T2D | Age, WHR, truncal skinfold thickness, Matsuda-IR, HDL-cholesterol level, current smoking, and alcohol consumption | (+): tyrosine for South Asians; (−): glycine for Europeans | No |
| [46]; 2015 | METSIM; Finland; population-based cohort | 6607 (386 T2D); 5.9 years | Targeted; NMR | Serum | Incident T2D | Age, BMI, smoking, and physical activity | (+): ApoA1/HDL-C ratio, ApoB/LDL-C ratio, ApoB/non-HDL-C ratio; (−): HDL cholesterol and large HDL particles | No |
| [47]; 2015 | IRAS; America; population-based cohort | 146 (76 T2D); 5 years | Targeted; MS/MS | Plasma | Incident T2D | Age, sex, BMI, and ethnicity | (+): alanine, valine, leucine or isoleucine, phenylalanine, glutamine and glutamate; (−): glycine, asparagine and aspartate | No |
| [48]; 2016 | Four cohorts: ULSAM; Sweden, population-based cohort; PIVUS; Sweden, population-based cohort; the TwinGene study; Sweden, case–cohort; KORA; Germany, population-based cohort | 1138 from ULSAM (78 T2D), 970 from PIVUS (70 T2D), 1630 from TwinGene (122 T2D), and 855 from KORA (88 T2D) | Untargeted; LC-MS | Plasma and serum | Incident T2D | Age, sex, BMI, waist circumference, and fasting glucose | (+): γ-glutamyl-leucine, 2-methylbutyroylcarnitine, barogenin, L-tyrosine, monoacylglycerol (18:2), deoxycholic acid; (−): cortisol, LysoPC/PC(O-16:1/0:0), SM (33:1, d18:2/18:1, 34:2), LysoPC (20:2), CerPE (38:2), PC (42:7) | No |
| [49]; 2016 | Two Chinese cohorts: DFTJ and JSNCD; nested case–control studies | 2078 from DFJT (1039 T2D); 4.6 years; 140 form JSNCD (520 T2D); 7.6 years | Targeted; LC-MS | Plasma | Incident T2D | Age, BMI, smoking and drinking status, education level, physical activity, systolic blood pressure, serum HDL cholesterol and triglycerides, fasting glucose, family history of diabetes, and metabolomics batch | (+): alanine, phenylalanine, tyrosine, palmitoylcarnitine | Yes |
| [50]; 2016 | RISC; Europe, population-based cohort DMVhi; Britain; population-based cohort | 855 (623 NGT, 56 isolated IGT (iIGT), 220 isolated IFG, 56 IFG and IGT); 3 years 668 (not given); 3 years | Targeted; LC-MS/MS | Plasma | iIGT | Age, sex, and BMI | (+): a-hydroxybutyric acid, oleic acid; (−): linoleoyl-glycerophosphocholine | Yes, Botnia, Finland; 2430 (not given) |
| [51]; 2016 | SCHS; Singapore; nested case–control | 394 (197 T2D); 6 years | Untargeted; LC-MS and GC-MS | Serum | Incident T2D | BMI, smoking status, and history of hypertension | (+): aminomalonic acid, glycine, isoleucine, leucine, threonine, valine, hippuric acid, cytidine diphosphate glucose, D-galactose, gluconate, palmitic acid (16:0), stearic acid (18:0), oleic acid (18:1), linoleic acid (18:2), LPG (12:0), LPI (16:1, 18:1, 18:2, 20:3, 20:4, 22:6), lactic acid, pyruvate, urea, 1,3-propanediol; (−): 2-aminooctanoic acid, ornithine, phosphoserine, proline, serine, glycerol, 9-decenoylcarnitine (C10), CMPF, LPE (20:3, 20:5) | No |
| [52]; 2017 | Botnia Prospective Study; Finland; population-based cohort | 543 (146 T2D); 7.7 years | Untargeted and targeted; MS | Serum | Incident T2D | Age, sex, BMI, fasting insulin level, and family history of type 2 diabetes | (+): glucose, mannose, α-hydroxybutyrate, isoleucine, valine, glutamate, trehalose; (−): histidine, bilirubin, glutamine, α-Tocopherol | Yes; DESIR, France; 1044 (231 T2D); 9 years |
| [53]; 2017 | ERF; Netherlands; population-based cohort | 1571 (137 T2D); 11.3 years | Targeted; NMR and LC-MS | Plasma | Incident T2D | Age, sex, and lipid-lowering medication | (+): isoleucine, tyrosine, 2-hydroxybutyrate, 2-oxoglutaric acid, glycerol, lactate, pyruvate, TG (48:0), TG (48:1), TG (50:5), VLDL free cholesterol, extremely large VLDL cholesterol, VLDL triglycerides, very small LDL and ApoB | No |
| [54]; 2018 | The Västerbotten Intervention Programme cohort; Sweden; nested case–control study | 1006 (503 T2D); 7 years | Untargeted; LC-MS | Plasma | Incident T2D | BMI and FPG | (+): PC(16:0/16:1), DAG(16:1/16:1, 14:0/16:0, 14:0/18:1, 16:0/18:1), 3-hydroxyisovalerylcarnitine, phenylalanine, leucine, isoleucine, valine, tryptophan, L-tyrosine, alanine, citrulline; (−): lysoPC (18:2, 18:1, p16:0, 17:0, 19:1, 20:1), PC (15:1/18:2, 17:0/18:2), n-acetylglycine, 2-hydroxyethanesulfonate, 3-methyl-2-oxovaleric acid | No |
| [55]; 2018 | SCHS; Singapore; nested case–control study | 320 (160 T2D); not given | Targeted; LC-MS and GC-MS | Serum | Incident T2D | BMI, history of hypertension, smoking, physical activity, fasting status, triglycerides, and HDL-cholesterol | (+): lysophosphatidylinositol (16:1, 18:0), myristic acid (14:0), palmitic acid (16:0), palmitoleic acid (16:1n-7), stearic acid (18:0), eicosadienoic acid (20:2n-6), dihomo-gamma-linolenic acid (20:3n-6), arachidonic acid (20:4n-6), adrenic acid (22:4n-6) | No |
| [56]; 2018 | KoGES; community-based cohort | 1939 (282 T2D); 8 years | Targeted; MS | Serum | Incident T2D | Sex, age, energy intake, body-mass index, metabolic equivalent, smoking status, drinking status, household income, and education level, consumption of coffee, red meat, and whole grain, and history of hypertension | (+): alanine, arginine, isoluecine, proline, tyrosine, valine, hexose, phosphatidylcholine diacyl (C32:1, C34:1, C36:1, C40:5, C42:5); (−): spermine, lyso phosphatidylcholine acyl (C17:0, C18:2, C38:0, C40:1, C42:1, C34:3, C36:3), hydroxysphingomyelin C22:2, sphingomyelin C16:1 | No |
| [57]; 2018 | ARIC; America; community-based cohort | 2939 (1126 T2D); 20 years | Untargeted; LC-MS | Serum | Incident T2D | Age, sex, race, center, batch, education level, systolic blood pressure, diastolic blood pressure, BMI, HDL-cholesterol, LDL-cholesterol, smoking status, physical activity level, history of cardiovascular disease, eGFR, and fasting glucose | (+): isoleucine, leucine, 3-(4-hydroxyphenyl)lactate, valine, trehalose, erythritol; (−): asparagine | No |
| [58]; 2018 | FHS; America; community-based cohort | 1150 with NFG (95 T2D); 20 years | Targeted; LC-MS/MS | Plasma | Incident T2D | Age, sex, BMI, fasting glucose, and triglycerides | (+): phenylalanine; (−): glycine, taurine | No |
| [59]; 2019 | Four Finnish population-based cohorts: YFS; FINRISK-1997; DILGOM; NFBC | 11,896 (392 T2D); 8–15 years | Targeted; NMR | Serum | Incident T2D | Sex, baseline age, BMI, and fasting glucose | (+): isoleucine, leucine, phenylalanine, glycerol, glycoprotein acetyls, total fatty acids, monounsaturated fatty acids%, triacylglycer/phosphoglyceride ratio, VLDL cholesterol, total triacylglycerol, triacylglycerol in VLDL, triacylglycerol in LDL, apo B/apo A1 ratio, VLDL particle size; (−): polyunsaturated fatty acids%, n-6 fatty acids%, linoleic acid%, HDL cholesterol, HDL particle size | No |
| [60]; 2019 | METSIM; Finland; population-based cohort | 4851 (522 T2D); 7.4 years | Untargeted; LC-MS | Plasma | Incident T2D | Batch effect, age, BMI, smoking, and physical activity | (+): tyrosine, alanine, isoleucine, aspartate, glutamate | No |
| [61]; 2019 | MPP; Sweden; case–cohort study | 698 (202 T2D); 6.3 years | Untargeted; LC-MS | Plasma | Incident T2D | Age, sex, fasting glucose, and BMI | (+): N2,N2-dimethylguanosine, 7-methylguanine, 3-hydroxy-trimethyllysine, urea | Yes, MDC-CC, Sweden; population-based cohort; 3423 (402 T2D); 18.2 years |
| [62]; 2019 | PREDIMED; Spain; case–cohort | 853 (243 T2D); 3.8 years | Targeted; LC-MS | Plasma | Incident T2D | Age, sex, intervention, BMI, smoking, dyslipidemia, hypertension, and baseline plasma glucose | (+): lysine, 2-aminoadipic acid | No |
| [63]; 2020 | METSIM; Finland; population-based cohort | 4851 (522 T2D); 7.4 years | Untargeted; LC-MS | Plasma | Incident T2D | Age, BMI, smoking, and physical activity | (+): creatine; 1-palmitoleoylglycerol (16:1), urate, 2-hydroxybutyrate, xanthine, xanthurenate, kynurenate, 3-(4-hydroxyphenyl) lactate, 1-oleoylglycerol (18:1), 1-myristoylglycerol (14:0), dimethylglycine, 2-hydroxyhippurate; (−): 1-linoleoyl-GPC (18:2) | No |
| [64]; 2021 | DFTJ; China; nested case–control | 1000 (500 T2D); 4.61 years | Untargeted; LC-MS | Serum | Incident T2D | Age, sex, BMI, smoking status, drinking status, and physical activity | (+): carnitine 14:0, PE 34:2, FFA 20:4; (−): pipecolinic acid, 1,5-Anhydro-D-Glucitol, LPC 18:2, Isoleucine/leucine, epinephrine | No |
| [65]; 2021 | Five cohorts from America: HCHS/SOL; ARIC; FHS, WHI and a case–cohort study nested in PREDIMED; prospective | 9180 (2031 T2D); 5.7 years | LC-MS | Serum and plasma | Incident T2D | Age, sex, smoking, alcohol consumption, education, family income, family history of diabetes, self-reported hypertension and/or antihypertensive medication use, self-reported dyslipidemia and/or lipid-lowering medication use, other study-specific covariates, BMI and WHR; yes | (+): tryptophan, kynurenine, kynurenate, xanthurenate, quinolinate; (−): indolepropionate | No |
| [66]; 2021 | PREVEND; Netherlands; population-based cohort | 4828 (265 T2D); 7.3 years | Targeted; NMR | Plasma | Incident T2D | Age, sex, family history of diabetes, smoking, alcohol assumption, BMI, hypertension, high-sensitivity C-reactive protein, lipid-lowering medication, and fasting glucose | (+): small HDL; (−): HDL cholesterol, large HDL, medium HDL | No |
| Reference; Year | Study Design | Number, Follow-Up | Technique | Biological Matrix | Outcome, Number | Adjustments | Major Findings | Replication |
|---|---|---|---|---|---|---|---|---|
| [81]; 2009 | China; case–control | 119 (31 control: no DM and DN, 23 T2D without DN, 65 T2D and DN) | Targeted; LC-MS | Plasma | NA | NA | Higher levels of inosine, adenosine, uric acid, and xanthine in DN group compared with control or T2D without DN group | No |
| [82]; 2012 | Japan; case–control | 78 T2D (20 normoalbuminuria, 32 microalbuminuria, 26 macroalbuminuria) | Untargeted; MS | Serum | NA | No | Higher levels of creatinine, aspartic acid, γ-butyrobetaine, citrulline, SDMA and kynurenine and lower levels of azelaic acid and galactaric acid in macroalbuminuria group compared with normoalbuminuria group | No |
| [83]; 2012 | FinnDiane; Finland; nested case–control | 52 T1D (26 progressing to micro/macroalbuminuria, 26 nonprogressor); 5.5 years | Untargeted; LC-MS and GC-MS | Urine | Progression from normoalbuminuria to micro- or macro-albuminuria; 26 | No | Higher level of substituted carnitine and S-(3-oxododecanoyl) cysteamine and lower level of hippuric acid in progressors | No |
| [84]; 2012 | FinnDiane; Finland; cross-sectional | 326 T1D (182 normal AER, 58 microalbuminuria, 86 macroalbuminuria) | Targeted; NMR | Serum | 24 h AER | Diabetes duration, gender, waist, SBP, HbA1C, triglycerides, HDL cholesterol, and serum creatinine | (+): sphingomyelin | No |
| [85]; 2013 | America; case–control | 47: 23 healthy control, 24 T2D with CKD (screening group) | Targeted; GC-MS | Urine and plasma | NA | Age, race, and sex | Lower levels of urine 3-hydroxy isovalerate, aconitic acid, citric acid, 2-ethyl 3-OH propionate, glycolic acid, homovanillic acid, 3-hydroxyisobutyrate, 2-methylacetoacetate, 3-methyladipic acid, 3-methylcrotonylglycine, 3-hydroxypropionate, tiglylglycine, and uracil in DM with CKD group compared with control group | Yes; 61 diabetes (12 T1D and 49 T2D) with CKD as validation group |
| [86]; 2014 | PREVEND; Netherlands; The Steno Diabetes Center; Denmark; nested case–control | 90 T2D (24 from normoalbuminuria to microalbuminuria, 24 normoalbuminuria control; 21 from microalbuminuria to macroalbuminuria, 21 microalbuminuria control); 2.9 years | Targeted; LC-MS | Urine and Plasma | Transition from normo- to micro-albuminuria or from micro- to macro-albuminuria; 24 from normo- to micro-albuminuria, 21 from micro- to macro-albuminuria | Baseline UAE and eGFR | Higher plasma levels of butenoylcarnitine and lower levels of plasma histidine, urine hexose, urine glutamine, and urine tyrosine in patients progressing from microalbuminuria to macroalbuminuria compared with controls | No |
| [87]; 2014 | DCCT; America; prospective | 497 T1D; 14–20 years | Targeted; LC-MS | Plasma | Incident macroalbuminuria; 65 | DCCT Treatment Group, baseline retinopathy status, use of ACE/ARB drugs during study period, gender, and baseline measures of duration of T1DM, age, HbA1C %, BMI, triglyceride levels, and AER | (−): very long chain ceramide species (C20, C22:1, C24, C26, and C26:1) | No |
| [88]; 2014 | The Joslin Study of the Genetics of Type 2 Diabetes and Kidney Complications; America; nested case–control | 80 T2D (40 incident ESRD, 40 without ESRD); 8–12 years | Targeted and untargeted; LC-MS and GC-MS | Plasma | Incident ESRD: renal death, renal replacement therapy | HbA1C, AER, and eGFR | (+): p-cresol sulfate, gulono-1,4-lactone, threitol, erythronate, pseudouridine, N2,N2-dimethylguanosine, N4-acetylcytidine, C-glycosyltryptophan, glutaroyl carnitine, methylglutarylcarnitine, 3-dehygrocarnitine, urea, myo-inositol, urate, phenylacetylglutamine; (−): 2-hydroxyisocaproate, 2-oxoisoleucine, 2-hydroxyisovalerate, 2-hydroxybutyrate | No |
| [89]; 2015 | GO-DARTS; Scotland; nested case–control | 307 T2D with baseline eGFR 30–60 mL/min/1.73 m2; 3.5 years | Targeted; LC-MS | Serum | Rapid eGFR progression: >40% compared with baseline; 154 | Age, sex, eGFR, albuminuria status, HbA1C, use of ACE inhibitors, and use of ARBs | (+): C16-acylcarnitine, creatinine, methylmalonic acid, n-acetylaspartate, sialic acid, SDMA, SDMA/ADMA, uracil; (-): lysine, tryptophan | No |
| [90]; 2016 | Singapore; case–control | 129 T2D without DKD (control), 126 T2D with ACR 30–299 mg/g and eGFR 60 mL/min/1.73 m2 (early DKD), 154 T2D with ACR ≥300 mg/g or eGFR <60 mL/min/1.73 m2 (overt DKD) | Targeted; LC-MS and GC-MS | Plasma | NA | Age, sex, and ethnicity | Higher levels of C2, C3, C4, C4-OH, C5, C4-DC, C5:1, C5-DC, C5-OH/C3-DC, C6, C8-OH/C6-DC, C14:1-OH, C14-OH/C12-DC, C18-OH/C16-DC acylcarnitines, Cer 18:1/16:0, GlcCer 18:1/18:0, SM 18:1/16:1, and sphingosine and lower levels of serine, (32:2, 34:3, 36:6, 38:3, 40:5) in overt DKD compared with control group | Yes, 149 T2D without DKD, 149 T2D with overt DKD |
| [91]; 2016 | Italy; prospective | 286 T2D; 3 years | Untargeted; LC-MS and GC-MS | Urine and serum | Association with baseline eGFR and ACR; incident >10 mL/min/1.73 m2 eGFR decline; incident >14 mg/g ACR increase; number not given | Gender, age, glucose, and baseline eGFR | (+): C-glycosyl tryptophan, pseudouridine, N-acetylthreonine | No |
| [92]; 2017 | China; case–control | 20 healthy controls (control); 25 T2D with UACR <30 mg/g (T2D); 24 T2D with UACR ≥30 mg/g (DKD) | Untargeted; GC-MS | Urine | NA | No | Higher levels of uric acid, stearic acid, palmitic acid, and hippuric acid and lower levels of uracil, glycine, aconitic acid, isocitric acid, 4-hydroxybutyrate, glycolic acid, and 2-deoxyerythritol in DKD compared with control or compared with T2D group | No |
| [93]; 2017 | The Joslin Proteinuria Cohort Study; America; prospective | 158 T1D with proteinuria and stage three CKD; 11 years | Targeted; LC-MS and GC-MS | Serum | Incident ESRD: renal death or renal replacement therapy; 99 | Blood pressure, BMI, smoking status, HbA1C, ACR, eGFR, uric acid levels, treatment with renin-angiotensin system inhibitors, other antihypertensive treatment, and statins | (+): n-acetylserine, n-acetylthreonine, n6-acetyllysine, n6-carbamoylthreonyladenosine, c-glycosyltryptophan, pseudouridine, o-sulfotyrosine | No |
| [94]; 2018 | FinnDiane; Finland; nested case–control | 200 T1D (102 progressing to microalbuminuria, 98 nonprogressors); 3.2 and 7.1 years, respectively | Untargeted; LC-MS and GC-MS | Serum | Progression to microalbuminuria; 102 | Age of diabetes onset, HbA1C, and AER | (+): erythritol, 3-phenylpropionate, N-trimethyl-5-aminovalerate | No |
| [95]; 2018 | ADVANCE; Australia; case–cohort | 3587 T2D; 5 years | Targeted; NMR | Plasma | Major microvascular events: a composite of new or worsening nephropathy or retinopathy; 342 | Age, sex, region and randomized treatment, a prior macrovascular complication, duration of diabetes, current smoking, systolic blood pressure, BMI, ACR, eGFR, HbA1C, plasma glucose, total cholesterol, HDL-cholesterol, triacylglycerols, aspirin or other antiplatelet agent, statin or other lipid-lowering agent, β-blocker, ACE inhibitor or angiotensin receptor blocker, metformin use, history of heart failure, participation in moderate and/or vigorous exercise for >15 min at least once weekly, and high-sensitivity CRP | (−): alanine, tyrosine | No |
| [96]; 2018 | Macroalbuminuric DKD; Brazil; prospective | 56 with T2D; 2.5 years | Untargeted, GC-MS | Plasma | All-cause death, doubling of baseline serum creatinine and/or dialysis initiation; 17 | eGFR | (−): 1,5-anhydroglucitol, norvaline, l-aspartic acid | No |
| [97]; 2018 | GenodiabMar; not given; TwinsUK; Britain; KORA; Germany; prospective | 655 T2D from GenodiabMar; 111 T2D from TwinsUK; 160 T2D from KORA; cross-sectional | Targeted; NMR | Serum | Association with baseline eGFR; 926 | Age, gender, and BMI | (+): apolipoprotein A1, total cholesterol in HDL2, total cholesterol in very large HDL, total cholesterol in HDL, free cholesterol in medium HDL, cholesterol esters in very large HDL, concentration of very large HDL particles, concentration of medium HDL particles, total lipids in medium HDL, phospholipids in medium HDL, esterified cholesterol, total cholesterol, total cholesterol in large LDL, total cholesterol in large LDL, total cholesterol in medium LDL, total cholesterol in small LDL, total cholesterol in LDL, total cholesterol in IDL, free cholesterol in large LDL, free cholesterol in medium LDL, free cholesterol in small LDL, free cholesterol in IDL, cholesterol esters in large LDL, cholesterol esters in medium LDL, cholesterol esters in small LDL, cholesterol esters in IDL, concentration of large LDL particles, concentration of IDL particles, total lipids in large LDL, total lipids in medium LDL, total lipids in small LDL, total lipids in IDL, phospholipids in large LDL, phospholipids in medium LDL, phospholipids in small LDL, phospholipids in IDL; (−): glycine, phenylalanine, citrate, glycerol | No |
| [98]; 2019 | The Renoprotection in Early Diabetic Nephropathy in Pima Indians trial; America; prospective | 92 T2D with baseline eGFR ≥90 mL/min/1.73 m2; 9.6 years | Untargeted; LC-MS | Serum | ≥40% reduction in eGFR compared with baseline; 32 | GFR and ACR | (+): unsaturated PEs; (−): unsaturated FFAs | No |
| [99]; 2019 | Denmark; prospective cohort study | 637 T1D; 5.5 years | Targeted; GC-MS | Serum | Combined renal endpoint: ≥30% decrease in eGFR, ESRD, or all-cause mortality; 123 | Age, sex, HbA1C, SBP, smoking, BMI, statin treatment, triglycerides, total cholesterol, eGFR, and logAER | (+): ribonic acid; (−): isoleucine, leucine, valine | No |
| [100]; 2019 | China; nested case–control | 52 T2D with macroalbuminuria and eGFR >90 mL/min/1.73 m2 (25 progressors and 27 nonprogressors); 5–6 years | Targeted and untargeted; LC-MS | Urine | Early progressive renal function decline: at least a 33.3% decline of eGFR and eGFR <60 mL/min/1.73 m2; 25 | No | (−): 5-hydroxyhexanoic acid | No |
| [101]; 2019 | GoDARTS; Scotland; nested case–control; SDR; Sweden; prospective; CARDS; Britain; clinical trial | 430 T2D from GoDARTS, 227 T2D from SDR, 183 from CARDS; 7 years | MS | Serum | >20% eGFR reduction compared with baseline; 403 | Age, sex, baseline eGFR, albuminuria, HbA1C, and calendar time | (+): ADMA, SDMA | No |
| [102]; 2019 | SDRNT1BIO; Scotland; prospective | 859 T1D with baseline eGFR 30–75 mL/min/1.73 m2; 5.2 years | Targeted; LC-MS | Serum | Rapid eGFR decline during follow-up: > 3 mL/min/1.72 m2/year; 194 | Age, sex, duration of diabetes, study day eGFR, and length of follow-up | (+): free sialic acid; (−): tryptophan/kynurenine, threonine, methionine, tryptophan | No |
| [103]; 2020 | Denmark; case–control | 211 (50 heathy control, 161 T1D: 50 normoalbuminuria, 50 micoralbuminuria, 61 macroalbuminuria); cross-sectional | Targeted; MS | Plasma | NA | Use of medication, HbA1C, and diabetes duration | Higher levels of indoxyl sulphate, L-citrulline in T1D and macroalbuminuria group compared with normo-or microalbuminuria group; higher levels of homocitrulline, L-kynurenine and lower level of tryptophan in macroalbuminuria group compared with normoalbuminuria group | No |
| [104]; 2020 | KORA; Germany; population-based cohort | 385 prediabetes or T2D; 6.5 years | Targeted; LC-MS | Serum | Incident CKD: eGFR <60 mL/mL/min/1.73 m2 and/or UACR ≥ 30 mg/g; 85 | Age, sex, BMI, SBP, smoking status, triglyceride, total cholesterol, HDL cholesterol, fasting glucose, use of lipid-lowering, antihypertensive and antidiabetic medications, baseline eGFR, and ACR | (+): PC aa (C38:0, C42:0, C40:6), SM (OH) (C14:1, C16:1), SM (C16:0, C16:1, C18:0, C18:1, C20:2, C24:1, C26:1); (−): PC aa C32:2 | No |
| [105]; 2020 | CRIC; America; prospective cohort study | 1001 diabetes with baseline eGFR 20–70 mL/min/1.73 m2; 8 years | Untargeted; MS | Urine | ESRD (incident kidney failure with replacement therapy); 359 | Age, race, sex, smoked more than 100 cigarettes, BMI, HbA1C, mean arterial pressure, AER, and baseline eGFR | (+): 3-hydroxypropionate, 3-hydroxyisobutyrate, glycolic acid | No |
| [106]; 2020 | 5 Dutch cohort studies: DCS West-Friesland, the Maastricht study, the Rotterdam study, the Netherlands Epidemiology of Obesity study, the Cohort of Diabetes and Atherosclerosis Maastricht study | 3089 T2D; 4–7 years | Targeted; NMR | Plasma | Cross-sectional association with baseline eGFR and ACR | Age, sex, use of statins, other lipid-modifying agents, oral glucose-lowering medications, insulins, RAS-blocking agents and other antihypertensives, SBP, BMI, smoking, diabetes duration, HbA1C, and baseline ACR/UAE | 1) For baseline eGFR: (+): tyrosine, lactate, glucose, HDL particle, HDL cholesterol, apo A1, (−): phenylalanine, isoleucine, glutamine, histidine, leucine, glycoprotein acetyls, citrate, acetoacetate, VLDL particle, non-HDL cholesterol, triglycerides, lipid components in IDL and LDL 2) for baseline ACR: (+): glucose, glycoprotein acetyls, phosphatidylcholine and other cholines, free cholesterol in large VLDL; (−): very large HDL particle, glutamine | No |
| [107]; 2020 | FinnDiane; Finland; nationwide prospective cohort | 1087 T1D; 10.7 years | Targeted; NMR | Serum | Fastest eGFR decline: highest quartile of eGFR decline over follow up (−4.4 mL/min/1.73 m2) and progression from macroalbuminuria to ESRD | Age at diabetes onset, sex, diabetes duration, smoking, SBP, HbA1C, BMI, HDL cholesterol, and triacylglycerols | (+): sphingomyelin | No |
| Reference; Year | Study Design | Number, Follow-Up | Technique | Biological Matrix | Outcome, Number | Adjustments | Major Findings | Replication |
|---|---|---|---|---|---|---|---|---|
| [121]; 2003 | EDC; America; nested case–control | 118 T1D (59 coronary artery disease); 10 years | Targeted; NMR | Plasma | Fatal or nonfatal myocardial infarction, angina, coronary stenosis >50%; 59 | eGDR, smoking, overt nephropathy, retinopathy, WHR, and blood-pressure lowering drugs | (+): medium HDL particle, VLDL particle (−): large HDL particle | No |
| [122]; 2006 | Austria; cross-sectional | 136 T2D | Targeted; LC | Plasma | Macrovascular disease: history of stroke, myocardial infarction, coronary heart disease or peripheral arterial occlusive disease; 55 | L-arginine, AER, homocysteine, and eGFR | (+): ADMA | No |
| [123]; 2007 | SDC; Denmark; prospective | 572 T1D (397 with overt DN, 175 with persistent normoalbuminuria); 11.3 years | Targeted; LC | Plasma | fatal and nonfatal cardiovascular disease; 116 | Sex, age, HbA1C, SBP, GFR, cholesterol, smoking status, previous CVD events, antihypertensive treatment, NT-proBNP, and CRP | (+): ADMA | No |
| [124]; 2007 | Austria; prospective | 125 T2D; 21 months | Targeted; LC | Plasma | Cardiovascular events: myocardial infarction, percutaneous coronary intervention, coronary artery bypass graft, stroke, carotid revascularization, and all-cause mortality; 48 | Age, sex, history of macrovascular disease, and GFR | (+): ADMA | No |
| [125]; 2014 | The Shiga Prospective Observational Follow-up Study; Japan; prospective | 385 T2D; 10 years | Targeted; LC-MS | Plasma | Cardiovascular composite endpoints: myocardial infarction, angina pectoris, worsening of congestive heart failure, and stroke; 63 | Age, SBP, hypertension, log (HDL cholesterol), log (AER), eGFR, and baPWV | (+): cardiovascular disease-amino acid-based index composed of ethanolamine, hydroxyproline, glutamic acid, 3-methylhistidine, tyrosine, tryptophan | No |
| [126]; 2016 | China; case–control | 15 healthy control, 13 CHD, 15 T2D, 28 T2D and CHD | Untargeted; NMR | Plasma | No | Higher levels of VLDL/LDL, glucose and lower levels of isoleucine, valine, isopropanol, alanine, leucine, arginine, acetate, proline, glutamine, creatine, creatinine, glycine, threonine, tyrosine, 3-methylhistidine in T2D and CHD compared with healthy control | No | |
| [95]; 2018 | ADVANCE; Australia; case–cohort | 3587 T2D; 5 years | Targeted; NMR | Plasma | Macrovascular events: cardiovascular death, nonfatal myocardial infarction or nonfatal stroke; 655 | Age, sex, region and randomized treatment, a prior macrovascular complication, duration of diabetes, current smoking, systolic blood pressure, BMI, ACR, eGFR, HbA1C, plasma glucose, total cholesterol, HDL-cholesterol, triacylglycerol, aspirin or other antiplatelet agent, statin or other lipid-lowering agent, β-blocker, ACE inhibitor or angiotensin receptor blocker, metformin use, history of heart failure, participation in moderate and/or vigorous exercise for >15 min at least once weekly, and high-sensitivity CRP | (+): phenylalanine before fully adjustment (−): glutamine, histidine before full adjustment | No |
| [107]; 2020 | FinnDiane; Finland; nationwide prospective cohort | 1087 T1D; 10.7 years | Targeted; NMR | Serum | Coronary heart disease: myocardial infarction or coronary revascularisation; 110 | Age at diabetes onset, sex, diabetes duration, and smoking | (+): sphingomyelin | No |
| [127]; 2020 | SURDIAGENE; France; prospective | 1463 T2D; 85 months | Targeted; LC-MS | Plasma | Major adverse cardiovascular events: a composite of CV death, nonfatal MI, nonfatal stroke; 403 | Sex, age, MI history, eGFR, ACR, and NT-proBNP | (+): TMAO | No |
| [112]; 2020 | ADVANCE; Australia; case–cohort | 3576 T2D; 5 years | Targeted; NMR | Plasma | Major macrovascular events: cardiovascular death, fatal myocardial infarction and nonfatal stroke; 654 | Age, sex, region and the treatments randomly allocated, history of macrovascular disease, duration of diabetes, current smoking status, SBP, BMI, ACR, eGFR, HbA1C, HDL-cholesterol, triacylglycerol, and use of aspirin or other antiplatelet agents, statins or other lipid-lowering agents, β-blockers and ACE inhibitors or angiotensin receptor blockers | (−): n-3 fatty acids, DHA | No |
Publisher’s Note: MDPI stays neutral with regard to jurisdictional claims in published maps and institutional affiliations. |
© 2021 by the authors. Licensee MDPI, Basel, Switzerland. This article is an open access article distributed under the terms and conditions of the Creative Commons Attribution (CC BY) license (https://creativecommons.org/licenses/by/4.0/).
Share and Cite
Jin, Q.; Ma, R.C.W. Metabolomics in Diabetes and Diabetic Complications: Insights from Epidemiological Studies. Cells 2021, 10, 2832. https://doi.org/10.3390/cells10112832
Jin Q, Ma RCW. Metabolomics in Diabetes and Diabetic Complications: Insights from Epidemiological Studies. Cells. 2021; 10(11):2832. https://doi.org/10.3390/cells10112832
Chicago/Turabian StyleJin, Qiao, and Ronald Ching Wan Ma. 2021. "Metabolomics in Diabetes and Diabetic Complications: Insights from Epidemiological Studies" Cells 10, no. 11: 2832. https://doi.org/10.3390/cells10112832
APA StyleJin, Q., & Ma, R. C. W. (2021). Metabolomics in Diabetes and Diabetic Complications: Insights from Epidemiological Studies. Cells, 10(11), 2832. https://doi.org/10.3390/cells10112832