Abstract
Boron (B) excess frequently impair plant performances and their productivity; in particular in arid and semi-arid environments. In the present experiment; hydroponically-grown ‘Granny Smith’ apple plants grafted on M9 rootstock were treated with optimal (25 μΜ) or excess (400 μΜ) B for 116 days to evaluate allometric responses of plants to B toxicity and to highlight physiological (photosynthesis and chlorophyll fluorescence) and biochemical (pigment content and sugar metabolism) responses of apple plants to B excess. Boron accumulated principally in top > middle > basal stems and leaves of high-B-stressed plants. Notably, the stem dramatically accumulated a higher level of B, as an attempt to preserve leaves, especially the youngest from further B accumulation. B accumulation seriously affected photosynthesis of younger leaves and caused both stomata (reduced stomatal conductance) and biochemical (reduction of apparent CO2 use efficiency and pigment content) limitations and altered the photochemistry and energy partitioning in photosystem II. Boron excess altered leaf sugar proportion; increasing the accumulation of non-translocating sugars such as glucose and fructose. Our dataset adds knowledge on the effect of B excess in apple tree and poses serious concerns about the possible effect of B in altering sugar metabolism; which, in turn, can strongly affect fruit production of this worldwide-cropped species.
1. Introduction
The critical role of boron (B) for optimal plant growth has been established since the 1920s [1]. B is a microelement with uneven distribution within plants and a remarkably narrow window between essential and toxic concentrations [2,3]. The main sources of B enrichment in the environment are the weathering of B-containing minerals and the geothermal steams, which enrich B soil and water [4,5]. However, the most impactful source of high-concentrated B (on average 4.6 mg L−1 B) is the seawater which can contaminate groundwater in coastal areas (e.g., in Mediterranean countries) increasing B concentrations in irrigated water up to 8 mg L−1 [6,7]. Differently from other nutrient elements, environmental B excess in the soil, is slightly affected by human activities when correlated with the extend of environmental B enrichment derived from natural sources [2,8]. Plant species show extremely high variability in responses to B in the soil. Adequate tissue B concentrations for the optimal plant growth of monocots can range from 1 to 6 mg kg−1, whereas, dicots can range from 20 to 70 mg kg−1, demonstrating the broad extent of B concentration that can lead to toxicity effects [6]. On the other hand, considerable tolerance to B excess has been observed among species [9] and genotypes [10,11,12,13,14,15,16,17].
B is found in soil mainly as boric acid B(OH)3 and partially as tetra hydroxyl borate anion B(OH)4− which are unevenly distributed in the water and in the organic and mineral deposits [6]. B uptake in plants can happen either through passive diffusion into root hair cells or through channels [18]. Inside plant cells, where the pH is about 7.0–7.5, boric acid is a weak acid and can easily bind to molecules with mono−, di− and polyhydroxyl groups such polyalcohols [19]. In the presence of excessive B concentration, B is primarily absorbed passively as boric acid by the roots due to its high permeability to lipid layers [18,20]. After absorption, boric acid is principally translocated by the non-leaving xylem cells principally to mature leaves, which have the highest transpiration rates and therefore can exhibit more severe B toxicity symptoms than younger tissues [18]. It was generally accepted that B is an immobile nutrient and therefore it tends to accumulate in mature leaves, characterized by higher transpiration rates [21]. Recently, evidence has shown that in some plant species (e.g., Pyrus, Malus, Prunus, Allium and Brassica), where sugar alcohols (i.e., mannitol and sorbitol) substitute sucrose for phloem translocation of photosynthates, B is uniformly distributed in young and old plant tissue, or is even found at a higher concentration in young tissues than in mature leaves [21,22]. These findings demonstrated the capability of B to be translocated by phloem flux in some plant species due to its ability to bind with cis-hydroxyl groups of sorbitol and mannitol, this producing diol-B complexes [23]. Phloem flux does not follow the evapotranspiration stream and it supplies with the major proportion of nutrient requirements the actively-growing organs, such as young leaves and fruit, which lower transpiration rates [21] and in which B symptoms occur in sugar alcohol-translocating species such as apple (Malus domestica). Apple is considered to be very sensitive to high B levels, since the levels of B concentration in irrigation water should not exceed 0.3 mg L−1 [24].
Nevertheless, there is very limited knowledge on the effect of B excess to apple plants yield and metabolism. Particularly, there are no investigations about changes in leaf sugar pattern and nutrient partitioning induced by increasing concentrations of B in apple plants. There is evidence in loquat, another sugar alcohol-translocating species, that B excess caused dramatic perturbations in metabolism by altering morpho-anatomical, physiological and biochemical parameters. These reactions preceded the appearance of typical symptoms of B toxicity over the leaf [25]. In this experiment, an optimal concentration (25 μM) and a high level of B (400 μΜ) were supplied to the nutrient solution during the hydroponic cultivation of apple seedlings. Boron treatments were protracted until the appearance of typical symptoms of B toxicity (necrosis of stem’s bark tissue and yellow-brown necrotic areas over the leaf lamina), which occurred 116 days from the beginning of the experiment. Plant biometric parameters and B allocation patterns, photosynthetic performance, chlorophyll, carotenoid, soluble sugar and polyol (mannitol and sorbitol) content were assessed to generate knowledge on the physiological/biochemical effects induced by B excess in apple plants (Malus domestica Borkh cv. Granny Smith).
2. Materials and Methods
2.1. Plant Material and Experimental Design
A total of 16 (8 per treatment) one-and-a-half-year-old apple (Malus domestica Borkh.) plants of the cultivar ‘Granny Smith’ grafted on the M9 clonal rootstock were used in the current study. They all were uniform in stem diameter, leaf area and height. The plants were grown singularly in black plastic pots (7 L) containing an inert mixture of silica sand:perlite (1:2, v/v) in a glasshouse located at the arboretum of the Agricultural University of Athens (latitude 37.981907, longitude 23.705639). Plants were irrigated every two days with a full-strength Hoagland’s nutrient solution containing 25 μΜ B (controls) or 400 μM B (B excess). Each watering (fertigation) supplied enough solution to fill the pores (field capacity), allowing some drainage for salt leaching from the planting medium. Furthermore, with this procedure the B concentrations in the planting media were identical to the original solution [10]. Climatic parameters were monitored by weather station located inside the glasshouse. The minimum, maximum and averaged air temperature were 16, 37 and 26.5 °C, respectively. When some typical B toxicity symptoms were present in the top part of the shoots (stem, leaves) of plants treated with 400 μM B (in this experiment 116 days after the beginning of B treatments) all the experimental plants were harvested and separated into scion’s shoots, rootstock’s stem and root. Scion’s shoots of each experimental plant were further divided lengthwise into three similar parts (basal, middle and top). Thus, top, middle and basal leaves and stems were collected separately.
To evaluate whether basal leaves were also suffering for physiological impairments due to B-excess, gas exchanges were measured in basal, middle and top fully-expanded leaves. Chlorophyll a fluorescence parameter was measured in top leaves to assess possible damages to photosystem II (PSII).
Leaf samples were collected from the basal, middle and top stem of each experimental plant for the determination of chlorophyll (Chl a and Chl b) and carotenoid (Car) content in leaves. Top fully expanded leaves were further sampled for the determination of carbohydrates. Afterwards, all the remaining plant materials (basal, middle and top leaves, basal, middle and top scion’s stems, rootstock’s stem and roots) were collected and weighted (fresh weight; FW), washed initially with tap water and then twice with deionized water, oven-dried at 70 °C until constant weight (dry weight; DW).
2.2. Gas Exchange and Chlorophyll a Fluorescence Analyses
Gas exchange parameters [photosynthetic rate (A; µmol CO2 m−2 s−1), transpiration rate (E; mmol H2O m−2 s−1), intercellular CO2 concentration (Ci; µmol CO2 mol air−1), stomatal conductance (gs; mmol H2O m−2 s−1), instantaneous (A/E; µmol CO2 * mmol H2O−1), intrinsic water use efficiency (A/gs; µmol CO2 * mmol H2O−1) and CO2 use efficiency (A/Ci; [µmol CO2 m−2 s−1 (µmol CO2 mol air−1)] were measured in basal, middle and top fully-expanded leaves (one leaf per plant; six plants per treatment) using a an Portable Infrared Gas Analyzer (mod. Li-6400; LI-COR Inc., Lincoln, NE, USA) in light-saturated conditions (1200 μmol photons m−2 s−1) and ambient CO2 concentration (390 ± 5 µmol CO2 mol air−1) at the end of experiment (116 days from the beginning of the treatments). Measurements were carried out in the morning (9:45–11:00 a.m.; solar time). In top leaves, light curve responses were measured at increasing Photosynthetic Active Radiation (PAR) intensities (0, 15, 30, 60, 120, 250, 500, 1000, 1500 or 2000 μmol m−2 s−1) whereas A/Ci curves were measured at the following CO2 concentrations: 0, 50, 100, 200, 400 or 600 mg L−1. During the measurements, leaf temperature ranged between 24 and 26 °C and RH from 43 to 48%.
Chlorophyll a fluorescence parameters were measured in top leaves with a MINI-PAM fluorometer (Walz, Effeltrich, Germany) at PAR intensities, ranging from 0 to 2800 μmol photons m−2 s−1 in the top leaves of plants treated with either 25 or 400 μM B. Chlorophyll fluorescence parameters were measured in homogeneous top leaves used for gas exchange determinations. Values of F0 and Fm were measured in dark-adapted leaves (30 min) before and after a saturating pulse (8000 μmol m−2 s−1 for 1 s), whilst the maximal photosystem II (PSII) photochemical efficiency [Fv/Fm = (Fm − F0)/Fm] and the operating PSII efficiency [ΦPSII = (Fm’ − Fs)/Fm’] were calculated according to Genty et al. [26]. The proportion of open reaction center, qP, was calculated according to Schreiber et al. [27]. The quantum yield of regulated (ΦNPQ) or nonregulated (ΦNO) photochemical energy loss in PSII and operational PSII efficiency (ΦPSII) at increasing photon flux densities were determined as reported by Kramer et al. [28] based on the lake model. Electron transport rate (ETR) was calculated as reported in Guidi et al. [29]. Light-response curves were performed using a light ramp of nine steps from 0 to 2800 μmol m−2 s−1 using the light source supplied by the instrument.
2.3. Boron Concentration, Content and Distribution in Apple Organs
An aliquot (0.25–1.00 g) of dry plant parts (top leaves, top stem, basal leaves, basal stem, rootstock’s stem, root) was dry-ashed for 5 h at 500 °C. The ashes were dissolved in 0.1 N HCl and B concentration was determined colorimetrically (420 nm) by using the Azomethine-H method [30]. Afterward, by multiplying the concentration of B in each plant part by the corresponding dry weight, the B contents in leaves, rootstock’s and scion’s stems and root as well as the total per plant B content were calculated. Finally, B partitioning to the scion (cultivar), rootstock and the ratio for B accumulation between aboveground and underground plant part were further computed.
2.4. Chlorophyll and Carotenoid Determinations
Fresh leaf samples (75 mg for each replication) were grinded in a cold mortar with 10 mL of cold acetone (80%; v/v), transferred in falcon tubes, kept in the dark for 1 h and in the meantime vortexed at 15 min intervals. After that, samples were centrifuged at 4400× g for 5 min at 4 °C. Chlorophyll and carotenoid concentrations were determined spectrophotometrically (Helios Gamma UV-Vis Spectrophotometer 9423 UVG, Unicam, UK) by collecting extract absorbance at 470 nm, 647 nm and 663 nm and using the equation described by Lichtenthaler and Buschmann [31]:
[Chl a] = 12.25A663 − 2.79A647
[Chl b] = 21.5A647 − 5.1A663
[Carotenoids] = (1000A470 − 1.82 [Chl a] − 85.02 [Chl b])/198
2.5. Carbohydrate Determination
An aliquot of 30 mg of freeze-dried leaf tissues (derived from top leaves) were added to 2 mL of HPLC-grade water (Carlo Erba Reagents S.A.S, Val-de-Reuil, France) and vortexed for 20 sec. Then, extraction of the water-soluble carbohydrates was performed in a microwave oven for 2 min at 400 watts. After centrifugation (4400× g for 10 min at 4 °C), the supernatant was removed and the process was repeated twice. The two supernatants were pooled together and filtered by using syringe filters (0.2 μM pore size). HPLC analyses were performed in isocratic mode using a HPLC pump (model 510 Waters, Milford, MA, USA) equipped with an HP refractive index-RI (HP 1047A, HP, Palo Alto, CA, USA). The mobile phase consisted of HPLC grade water. An aliquot (20 μL) of extract was injected into an Agilent HI-PLEX Ca2+ column (7.7 × 300 mm, 8 µm/Mobile phase 100% H2O, flow rate 0.6 mL min−1, temperature 80 °C, detector: Refractive Index) (Agilent, Santa Clara, CA, USA). The processing of the chromatograms was done by means of Peak Simple Chromatograpy Data System consisting in a hardware (Model 302, SRI Instruments, Bad Honnef, Germany) and the Peak Simple 4.51 chromatography acquisition and integration software for Windows (SRI Instruments, Bad Honnef, Germany). Sucrose, glucose, fructose, sorbitol and mannitol content were determined by fitting values to reference curves done with HPLC pure grade standards.
2.6. Statistical Analysis
Experiments were set up following a completely-randomized experimental design. All data were subjected to Bartlett’s test to assess homoscedasticity of data across populations. Differences between treatments, for each parameter under study, were then evaluated using the Student’s t-test (p ≤ 0.05). All the statistical analyses were carried out using the SPSS-17 software (SPSS INC., Chicago, IL, USA).
3. Results
3.1. Plant Growth and B Allocation Patterns
High concentration of B in the nutrient solution (400 μM) caused a significant reduction in root biomass in terms of DW compared to 25 μΜ B-control treatment (dry weight; was 63.3 g; Table 1). Measurements of aboveground plant parts, such as leaves, scion’s stems and rootstock’s stem, did not show any biomass changes between the two B treatments, but the ratio between aboveground/underground plant biomass was significantly increased in B-excess treated plants with respect to controls (Table 1).

Table 1.
Effects of B concentration in the nutrient solution (25 or 400 μM) on various growth parameters of apple plants, based on dry weight (DW) measurements.
Even though the aboveground biomass was not affected by the increased B levels in the nutrient solution, a noticeable increase of B levels (μg g−1 DW) was observed in leaves, scion’s stem, rootstock’s stem and root at 400 μM B compared to 25 μM B (Table 2). As expected and irrespectively of B treatment, B accumulated principally in top leaves and stem, followed by middle and basal leaves and stem, as typically occur in polyol-translocating species (Table 2). Specifically, in both 25 μM and 400 μM B-treatments, B concentrations at the top sample of leaves (88.9 and 441.2 μg g−1 DW, respectively) and scion’s stem (59.8 and 458.3 μg g−1 DW, respectively) were dramatically higher compared to middle and even greater compared to basal leaves (47.1 and 268.9 μg g−1 DW, respectively) and scion’s stem (35.1 and 254.1 μg g−1 DW, respectively) samples. In terms of absolute values (not as concentrations), B accumulation (μg) at total plant level was approximately 6.4-fold higher in plants treated with 400 μM B as compared to controls. B content-quantity (μg) on root, stems of rootstock and scion and leaves was also significantly increased in high B treatment compared to controls, though the ratio between B content of aboveground to underground plant part was similar in both B treatments (Table 2).
Table 2.
Effects of B concentration in the nutrient solution (25 or 400 μM) on the B concentration (μg g−1 DW) and content (absolute quantity, μg) in various vegetative parts of apple plants.
3.2. Gas Exchange, Chlorophyll Fluorescence Parameters and Photosynthetic Pigments
As reported in Figure 1, leaf photosynthetic parameters were significantly affected by B excess in a wide range of 0 to 2000 PAR in top leaves.
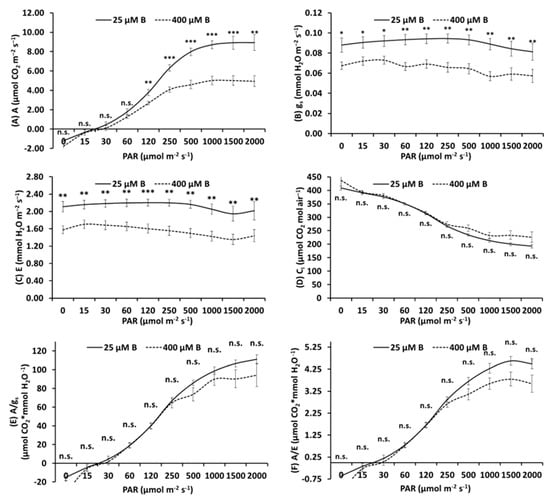
Figure 1.
Net photosynthesis (A; µmol CO2 m−2 s−1) (A), stomatal conductance (gs; mmol H2O m−2 s−1) (B), transpiration rate (E; mmol H2O m−2 s−1) (C), intercellular CO2 concentration (Ci; µmol CO2 mol air−1) (D), intrinsic water use efficiency (A/gs; µmol CO2 * mmol H2O−1) (E) and instantaneous water use efficiency (A/E; µmol CO2 * mmol H2O−1) (F) measured in control (25 μM B) and high B-treated top leaves (400 μM B) of apple plants using increasing Photosynthetic Active Radiation (PAR) intensities (0, 15, 30, 60, 120, 250, 500, 1000, 1500 or 2000 μmol m−2 s−1). Mean ± S.E., n = 8; each replicate (n) corresponds to a different plant per B treatment. *, **, *** Significant differences at p< 0.05, p < 0.01 or p < 0.001, respectively; n.s., non-significant differences.
The effect was evident in terms of reduction of A (Figure 1A, Table 3), gs (Figure 1B, Table 3) and E (Figure 1C, Table 3), whilst Ci was not affected by B excess (Figure 1D, Table 3). Conversely, concerning the leaf photosynthetic parameters, no alterations were observed in basal leaves. However, important changes were observed in middle leaves, where the values of A, gs and E were significantly lowered in 400 μM B-treated plants versus controls but to a lesser extent compared to the top leaves (Table 3).
Table 3.
Net photosynthesis (A; µmol CO2 m−2 s−1), stomatal conductance (gs; mmol H2O m−2 s−1), intercellular CO2 concentration (Ci; µmol CO2 mol air−1), transpiration rate (E; mmol H2O m−2 s−1), intrinsic water use efficiency (A/gs; µmol CO2 * mmol H2O−1), CO2 use efficiency (A/Ci; µmol CO2 m−2 s−1/(µmol CO2 mol air−1) and instantaneous water use efficiency (A/E; µmol CO2 * mmol H2O−1) in top, middle and basal leaves of control (25 μM B) and high B-treated (400 μM B) apple plants. Measurements were carried out under steady levels of CO2 (390 mg L−1) and PAR (1200 μmol m−2 s−1).
When the same parameters were assessed in the top leaves at different CO2 levels, ranging from 50 to 600 mg L−1, significant impairment was observed in 400 μM B-treated plants in the values of A, gs and E in all CO2 levels (Figure 2A–C), Ci values were increased in 400 μM B- treated plants compared to controls (Figure 2D) and the values of intrinsic and instantaneous water use efficiency (Figure 2E,F, respectively) were impaired at 400–600 mg L−1 CO2 levels.
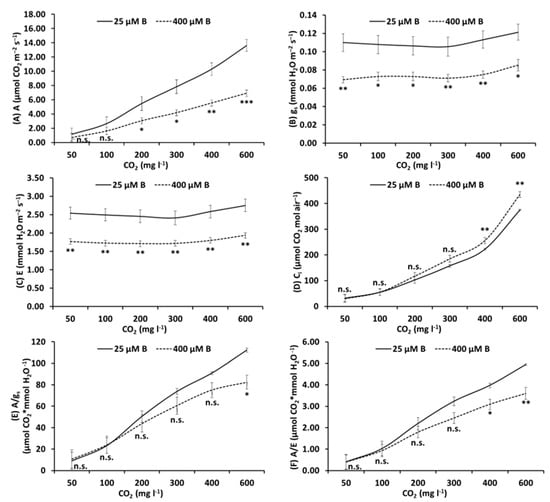
Figure 2.
Net photosynthesis (A; µmol CO2 m−2 s−1) (A), stomatal conductance (gs; mmol H2O m−2 s−1) (B), transpiration rate (E; mmol H2O m−2 s−1) (C), intercellular CO2 concentration (Ci; µmol CO2 mol air−1) (D), intrinsic water use efficiency (A/gs; µmol CO2 * mmol H2O−1) (E) and instantaneous water use efficiency (A/E; µmol CO2 * mmol H2O−1) (F) measured in control (25 μM B) and high B-treated top leaves (400 μM B) of apple plants using different levels of CO2 (0, 50, 100, 200, 400 or 600 mg L−1). Mean ± S.E., n = 8; each replicate (n) corresponds to a different plant per B treatment. *, **, *** Significant difference at p < 0.05, p < 0.01 or p < 0.001, respectively; n.s., non-significant differences.
Chlorophyll fluorescence highlighted a reduction of Fv/Fm under B toxicity (Figure 3A), caused by an increase of F0 (Figure 3B) and unchanged level of Fm (Figure 3C). Dramatic alterations were also observed in 400 μM B-treated plants where ETR (Figure 3D), ΦPSII (Figure 3E) and qp (Figure 3F) were strongly reduced by B excess. Conversely, ΦNO and ΦNPQ were not influenced by B treatment (Figure 3 G and H, respectively).
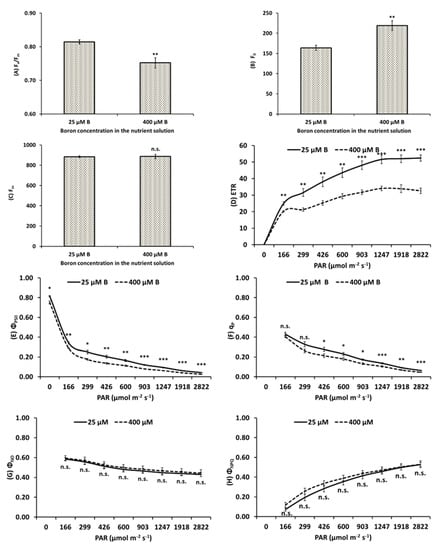
Figure 3.
Chlorophyll a fluorescence parameters (mean ± S.E.) derived from the rapid light curves measurements at different Photosynthetic Active Radiation (PAR) intensities, ranging from 0 to 2800 μmol photons m−2 s−1, that were carried out in top leaves of apple plants treated with either 25 (control) or 400 μΜ Β (B excess): Maximal photosystem II (PSII) photochemical efficiency Fv/Fm (A), minimal level of fluorescence F0 (B), maximum level of fluorescence Fm (C), electron transport rate electron transport rate (ETR) (D), operating PSII efficiency, ΦPSII (E), photochemical quenching of PSII, qp (F), quantum yield of non-regulated (ΦNO) (G) or regulated (ΦNPQ) (H) photochemical energy loss. Mean ± S.E., n = 8; each replicate (n) corresponds to a different plant per B treatment. *, **, *** Significant differences at p < 0.05, p < 0.01 or p < 0.001, respectively; n.s., non-significant differences.
Values of Chl a, Chl b, Chl a + b and total carotenoid were significantly impaired by B excess in top leaves, except Chl a/b ratio which was substantially unchanged (Table 4). The measurements of the photosynthetic pigments in the middle and basal leaves did not show in total any alterations between the two B treatments, whereas only a slight increment of Chl a/b ratio was promoted by B excess in basal leaves (Table 4).
Table 4.
Effects of B concentration in the nutrient solution (25 or 400 μM) on photosynthetic pigments (chlorophylls and carotenoids) measured in top, middle and basal leaves of apple plants.
3.3. Soluble Sugars
As demonstrated in Table 5, apple plants treated with 400 μM B showed reduced sucrose concentration whereas their glucose and fructose concentrations were enhanced, which explains the increment of non-trans/total sugar ratio. Conversely, non-significant differences were observed concerning the total values of translocated sugars, even though some changes occurred in translocated sugar profile of 400 μM B-treated plants. The ratios of trans/total sugars and sucrose/fructose + glucose content also showed significant reduction (Table 5).
Table 5.
Effects of B concentration in the nutrient solution (25 or 400 μM) on carbohydrates (% DW), measured in top leaves of apple plants. Concentrations of Sucrose (Suc), Glucose (Glu), Fructose (Fru), Mannitol (Man), Sorbitol (Sorb), Total sugars (Suc + Glu + Fru + Man + Sorb), Translocating sugars (Trans; Suc + Man + Sorb), Non-translocating sugars (Non-trans; Fru + Glu), the ratios Trans/Non-trans, Trans/Tot, Non-trans/Tot and Starch in control (25 μM B) and high B-treated (400 μM B) apple plants.
4. Discussion
Boron effects are principally addressed to mature tissues in those plant species where B is essentially immobile into the phloem and it moves solely following the transpiration stream. Conversely, in sugar-alcohol translocating species, including apple tree B is readily remobilized to sink organs by the phloem flux via B-polyol complexes [21] and accumulated principally in young tissues with a negative gradient from the top (higher B concentration) to the basal parts of plants (lower B concentration), which is in accordance with our results. In the present experiment, two aspects should be noted in terms of B accumulation and translocation within the plant. Firstly, scion’s stem accumulated comparatively much more B (μg) than leaves, irrespective of B treatment (25 or 400 μΜ). Moreover, in comparison to 25 μΜ B treatment, Β content (μg) in plants treated with 400 μΜ Β was 7.24-fold higher in scion’s stem, 6.81 in rootstock’s stem, 5.19 in leaves and 4.17 in roots. Our results clearly reveal the key role of apple stem in preserving the leaves, especially the younger (top) ones, from more severe B accumulation. The ameliorative role of apple stem is correlated with the different biomass accumulated in different plant organs, which contributes in mitigating the B concentration in organ with higher biomass (e.g., scion’s stems vs. leaves). B concentration is indeed similar in scion’s stem and leaves but scion’s stem had a 2-fold higher amount of B. This is in accordance with [32] who observed that in condition of B excess, species which produce polyalcohols accumulated B principally in stems rather than in older leaves, where B typically accumulates in sucrose-translocating species. Papadakis et al. [25] also observed that the phloem is the site of higher concentration of B in loquat plants, suggesting that it represents a mechanism of plant adaptation to B excess through binding and immobilizing B within the cell walls of the newly formed non-photosynthesizing phloem tissues, preserving other tissues to harmful effects to B toxicity. Secondly, comparing 400 with 25 μΜ Β treatment, the gradient of the increment of B concentrations in plant stem level was positive from the base to the top of the plant (+536% in rootstock’s stem and +624, +639 or +667% in basal, middle and top scion’s stem, respectively). The opposite gradient was a fact for the leaves, i.e., +471, +407 and +396% in basal, middle and top leaves, respectively. Both these patterns of B accumulation are likely an attempt adopted by the plants to limit B-triggered damages to young leaves. If from one side it can reduces B-triggered damages, especially to young leaves, it does not preserve completely the plants that at the end of treatments showed chlorotic top leaves and brown spots in the top part of stems as first visible symptom of B toxicity.
Toxic effects of B excess on plant biomass only consisted in a reduction of root biomass and an imbalance of aboveground/underground plant ratio, whereas unchanged total biomass production of B-excess treated plants is likely attributable to the exposure time which was not sufficient to cause such variation.
The reduction in root growth observed in apple plants could be dependent to an excessive lignification of the cell wall, which is a known phenomenon induced by B excess in several herbaceous and perennial species [33,34,35,36], mainly attributable to a reduction of cell wall extensibility. However, Ghanati et al. [35,36] suggested that cell wall lignification was not the main responsible of root growth inhibition, but conversely it was a defense reaction aimed at reducing B uptake and limiting/delaying its negative effects on plant growth.
Moreover, in agreement to the results presented herein, studies on barley and wheat highlighted that root biomass was impaired more than the shoot under condition of B excess [37,38]. Similarly, Sheng et al. [39], in orange scion–rootstock combination, observed that under B excess conditions the stronger reductions in dry biomass were found in roots than in other plant parts, indicating that in comparison to other tissues roots were more sensitive to toxic effect of B.
Despite the low reduction in total biomass observed on apple plants, the study of the leaf physiology and biochemistry highlight that B excess promoted multiple biochemical and physiological alterations.
Although the physiological basis for B toxicity has not been fully elucidated, three main causes have been proposed, taking into account the ability of B to bind compounds with cis-hydroxyl groups: (i) changes of cell wall structure; (ii) metabolic impairments caused by B bindings to the ribose-containing compounds, such as ATP, NADH and NADPH; and (iii) alteration of cell division and development by binding directly to ribose (as a simple polyol) or within ribose contained in RNA [23,40]. Plants subjected to B stress usually exhibit altered sugar metabolism and, in particular, results of the present experiment highlight that B excess induced accumulation of non-translocating sugars, glucose and fructose, in apple tree leaves [25,40]. However, the level of sugars sensu lato (including polyols) was not significantly altered by B excess and this is principally dependent to unchanged levels of sorbitol (the most abundant sugar alcohol in apple tree leaves) and to the reduction of sucrose concentrations found in leaves of 400 µM B treated plants as compared to those of controls. The fact that the level of translocating sugars (sum of sucrose and sorbitol) was similar in both control and B-stressed plants, while non-translocating sugar accumulation (glucose and fructose) was only promoted by B excess, is the reason behind the unbalance of the ratios Trans/Non-trans, Trans/Total, Non-trans/Total sugars observed between controls and B-excess treated plants.
Accumulation of soluble sugars and reduction of sucrose level is a common response observed in plant species in reaction to B excess [12,25,41] that can be attributed to the cleavage of sucrose in favor of simpler reducing sugars [42]. This reaction was likely dependent to both the reduction of the photosynthetic level of top leaves, which were compromised by B toxicity, as well as the impairment of phloem functionality, which can cause downregulation of the biosynthesis of sucrose by source (mature) leaves [41,43]. The biosynthesis of fructose is essential for the biosynthesis of many defensive compounds [44] and this can explain higher level of phenolic compounds (including for example anthocyanins [14]), ascorbic acid and glutathione [12,14] found in B-stressed plants. The accumulation of molecules with powerful antioxidant properties is useful to counteract B-triggered reactive oxygen species (reviewed by [45]). In addition, in a recent paper Lewis [46] proposed that B is and always has been, potentially toxic for plants and the author hypothesized that B as well as phenolics (compounds considered toxic for cellular metabolism) are strictly related and plants have evolved the ability to mitigate adverse effects of both B and phenolics by chemical (as organic complexes: cis-diols for B and lignin for phenolics) and physical (into vacuoles/apoplast) sequestration. Therefore, formation of B complexes in the cell wall is a detoxifying mechanism and not an evidence of B essentiality.
Differently to fructose, a huge body of reports show that glucose acts as an osmolyte in plants subjected to environmental cues (reviewed by [47]), but there is no information whether B toxicity in leaves is caused principally by osmotic stress [23]. Glucose is a key substrate for cellular respiration as well as a signaling molecule in plants whih experience stressful conditions [47,48]. For example, several genes related to photosynthesis are down-regulated by glucose-induced phosphorylation [43,48].
Moreover, it has been reported that soluble sugars accumulation (among them glucose and fructose) induce a negative regulation of genes involved in photosynthesis, including the expression of genes involved in the Calvin cycle [49,50,51]. Guo et al. [52] also found that the effect of B toxicity in citrus consisted in both the decrease of CO2 assimilation and the expression of genes related to photosynthesis and carbohydrate metabolism (e.g., Rubisco and ADP-glucose pyrophosphorylase). This may thus cause, even under normal conditions of illumination, a transient poor recycling of NADP+ and excessive electron transfer that may lead to the production of reactive oxygen species.
In our experiment, first evidences of an impairment of photosynthetic process started 29 days after the beginning of experiment only in top leaves, whereas only at the end of experimental trial (i.e., 116 days after its beginning) reduction of A and gs were also observed in middle leaves. Noteworthy, although basal leaves also accumulated significant amount of B (269 μg g−1 DW), no changes were observed in photosynthesis at the end of B treatment. The reduction of photosynthetic rate in top leaves was partially attributable to stomatal limitation (severe reduction of gs) which impair the diffusion of CO2 to carboxylation sites. Most available reports highlight that B is directly or indirectly responsible for stomata closures given that stomatal limitations were reported in some cases [53,54,55,56], whilst this stomata reaction has not been observed in others [57]. This suggests that this stomatal reaction to B excess is a species-specific responsive trait and/or a characteristic which depends to specific experimental conditions (which affect B accumulation/transport) and leaf age (reviewed by [45]). Results of gas exchange show that stomata closure was not the only cause of A reduction, given that carbon use efficiency at ambient CO2 (A/Ci) was decreased in B-stressed plants. In addition, A/Ci curves reveal that under non-limiting CO2 supply (e.g., 600 ppm), 400 µM B treated plants did not recover completely their level of A. Biochemical limitations also emerge from light curves at increasing irradiances, which reveal that A increased until 1500 µmol m−2 s−1 in controls while only at 1000 µmol m−2 s−1 PAR in B-stressed plants.
Boron stress typically promotes multiple biochemical limitations, which are considered the main constrains in the impairment of the photosynthetic process [11,14], as described below for this experimental trial. Firstly, we speculate that the decline of the carboxylation efficiency is dependent to the effect of B on ribulose, which is another cis-diol compound able to bind to B ions [23], or to the accumulation of glucose/fructose which can be responsible for feedback regulation of photosynthesis [58]. Secondly, the photoinhibition dected in leaves, associated with increased values of F0 (whilst Fm values remained unchanged) in B excess treated plants, highlight some damages to light harvesting complexes of PSII (LHCIIs) and PSII reaction centers (RCIIs). In particular, F0 originates primarily from the LHCII, while Fm is associated with the reduction/oxidation state of the primary quinone electron acceptor of PSII (QA). However, an accumulation of reduced QA has been also proposed to explain the induced increase of F0 [59]. Our dataset does not allow to describe the specific reason behind the increase of F0 values, but it is conceivable that in a general way the increase of F0 can be due to a decrease of the other paths of PSII deactivation: photochemistry and internal conversions. In agreement, in the present experiment the severe reduction of chlorophyll content found in top leaves of B excess treated plants might be on the base of the reduction of light harvested and the decreased photon flux to RCII in those young leaves, associated with a reduction in the rate of ATP and NADPH consumption necessary for CO2 assimilation by Calvin-Benson cycle (confirmed by reduced levels of CO2 use efficiency). This resulted in decreases in ETR values, especially when Mehler reaction (and operation of the water–water cycle sensu lato) and photorespiration does not compensate the lower rate of Calvin-Benson cycle [60]. Beside the lower photon flux tunnel to photochemistry, lower values of ΦPSII suggested some damages to RCII, which are connected to over-reduction of QA as revealed by lower values of qP.
In relation to the partitioning of absorbed energy between controlled (ΦNPQ) and non-controlled dissipative mechanisms (ΦNO) we did not observe any alteration in B-stressed plants at increasing irradiances when compared to their respective controls. ΦNO represents the proportion of energy that is passively dissipated in the form of heat and fluorescence, whereas ΦNPQ corresponds to the fraction of energy dissipated in the form of heat via the regulated photoprotective NPQ mechanisms [61,62]. Under saturating light intensities, the inability of plants to increase the level of ΦNO and ΦNPQ is supportive for the sub-optimal capacity of photoprotection, which eventually leads to photodamage and photoinhibition, in most cases shifting from dynamic to chronic photoinhibition [61]. Responsive plants, in response to environmental stresses, tend indeed to maximize values of ΦPSII, with the remaining loss 1 − ΦPSII should be dissipated by both regulated and non-regulated mechanisms, aimed in maximizing the ratio of ΦNPQ/ΦNO, as occurred in B-stressed sweet basil plants [14]. This inability is likely connected to the severe reduction of total carotenoids observed in top leaves of apple tree B-stressed plants.
Altogether, these results are supportive for strong damages induced by B toxicity to the photosynthetic machinery. Therefore, gas exchanges and chlorophyll fluorescence parameters variations described in the present manuscript can be used as screening methodologies for detection of high-B stress in apple tree plants.
5. Conclusions
This dataset highlights that high-B stress did not cause severe impairments in aboveground plant biomass at the end of the experimental period, but it provokes the perturbation of multiple physiological and biochemical parameters in apple plants. Irrespective of B treatment, B accumulation followed a gradient from the top to the basal plant tissues (leaves, stems), with the highest increment of B concentration found in upper part of the shoot (stem > leaves). Alterations in sugar patterns were observed in which a shift from the production of sucrose to that of glucose and fructose was found. Reduction of plant performances included both stomata and non-stomata limitation. In particular, damages to photosystem II reaction centers, associated to lower level of chlorophylls and carotenoids are the main reasons of photoinhibition of high-B-treated plants. However, some specific effect of boron-polyol complexes [e.g., complexation of B to ATP and NAD(P)H] cannot be excluded as further reasons of the impairment of the photosynthetic process. In conclusion, the present manuscript adds new insights to the comprehension of the effect of B excess in apple tree and the severe alteration of photosynthetic processes as well as sugar metabolism in leaves raises possible concerns for the fruit production of this widely cultivated species in condition of B excess, which need future research.
Author Contributions
Conceptualization I.E.P., T.S., G.C.; methodology A.O., E.-V.L., G.C.; formal analyses T.M., M.L., A.O., E.-V.L., I.E.P., T.S.; resources I.E.P.; writing original draft T.M., M.L.; editing and revisions F.A., I.E.P., T.S., G.C., E.-V.L., A.O.; supervision I.E.P.
Funding
This research received no external funding.
Acknowledgments
The authors would like to thank V. Kotsantis and E. Strati for providing technical assistance during the experimental cultivation of apple plants.
Conflicts of Interest
The authors declare no conflict of interest.
References
- Warington, K. The effect of boric acid and borax on the broad bean and certain other plants. Ann. Bot. 1923, 37, 629–672. [Google Scholar] [CrossRef]
- Nable, R.O.; Bañuelos, G.S.; Paull, J.G. Boron toxicity. Plant Soil 1997, 193, 181–198. [Google Scholar] [CrossRef]
- Saleem, M.; Khanif, Y.; Fauziah, I.; Samsuri, A.; Hafeez, B. Importance of boron for agriculture productivity: A review. IRJAS 2011, 1, 293–300. [Google Scholar]
- Chatzissavvidis, C.; Therios, I.; Antonopoulou, C. Seasonal variation of nutrient concentration in two olive (Olea europaea L.) cultivars irrigated with high boron water. JHSB 2004, 79, 683–688. [Google Scholar]
- Pennisi, M.; Gonfiantini, R.; Grassi, S.; Squarci, P. The utilization of boron and strontium isotopes for the assessment of boron contamination of the Cecina River alluvial aquifer (central-western Tuscany, Italy). Appl. Geochem. 2006, 21, 643–655. [Google Scholar] [CrossRef]
- Princi, M.P.; Lupini, A.; Araniti, F.; Longo, C.; Mauceri, A.; Sunseri, F.; Abenavoli, M.R. Boron toxicity and tolerance in plants: Recent advances and future perspectives. In Plant Metal Interaction; Elsevier: Amsterdam, The Netherlands, 2016; pp. 115–147. [Google Scholar]
- Kabay, N.; Güler, E.; Bryjak, M. Boron in seawater and methods for its separation—A review. Desalination 2010, 261, 212–217. [Google Scholar] [CrossRef]
- Landi, M.; Benelli, G. Protecting crop species from biotic and abiotic constraints in the era of global change: Are we ready for this challenge? Am. J. Agric. Biol. Sci. 2016, 11, 51–53. [Google Scholar] [CrossRef][Green Version]
- Ferreyra, R.E.; Aljaro, A.U.; Ruiz, R.S.; Rojas, L.P.; Oster, J. Behavior of 42 crop species grown in saline soils with high boron concentrations. Agric. Water Manag. 1997, 34, 111–124. [Google Scholar] [CrossRef]
- Papadakis, I.; Dimassi, K.; Therios, I. Response of two citrus genotypes to six boron concentrations: Concentration and distribution of nutrients, total absorption and nutrient use efficiency. Aust. J. Agric. Res. 2003, 54, 571–580. [Google Scholar] [CrossRef]
- Papadakis, I.E.; Dimassi, K.N.; Bosabalidis, A.M.; Therios, I.N.; Patakas, A.; Giannakoula, A. Boron toxicity in ‘Clementine’mandarin plants grafted on two rootstocks. Plant Sci. 2004, 166, 539–547. [Google Scholar] [CrossRef]
- Cervilla, L.M.; Blasco, B.; Ríos, J.J.; Romero, L.; Ruiz, J.M. Oxidative stress and antioxidants in tomato (Solanum lycopersicum) plants subjected to boron toxicity. Ann. Bot. 2007, 100, 747–756. [Google Scholar] [CrossRef] [PubMed]
- Landi, M.; Remorini, D.; Pardossi, A.; Guidi, L. Boron excess affects photosynthesis and antioxidant apparatus of greenhouse Cucurbita pepo and Cucumis sativus. J. Plant Res. 2013, 126, 775–786. [Google Scholar] [CrossRef] [PubMed]
- Landi, M.; Pardossi, A.; Remorini, D.; Guidi, L. Antioxidant and photosynthetic response of a purple-leaved and a green-leaved cultivar of sweet basil (Ocimum basilicum) to boron excess. Environ. Exp. Bot. 2013, 85, 64–75. [Google Scholar] [CrossRef]
- Pardossi, A.; Romani, M.; Carmassi, G.; Guidi, L.; Landi, M.; Incrocci, L.; Maggini, R.; Puccinelli, M.; Vacca, W.; Ziliani, M. Boron accumulation and tolerance in sweet basil (Ocimum basilicum L.) with green or purple leaves. Plant Soil 2015, 395, 375–389. [Google Scholar] [CrossRef]
- Meriño-Gergichevich, C.; Reyes-Díaz, M.; Guerrero, J.; Ondrasek, G. Physiological and nutritional responses in two highbush blueberry cultivars exposed to deficiency and excess of boron. J. Soil Sci. Plant Nutr. 2017, 17, 307–318. [Google Scholar] [CrossRef][Green Version]
- Sarafi, E.; Siomos, A.; Tsouvaltzis, P.; Therios, I.; Chatzissavvidis, C. The influence of Boron on pepper plants nutritional status and nutrient efficiency. J. Soil Sci. Plant Nutr. 2018, 18, 653–667. [Google Scholar] [CrossRef]
- Tanaka, M.; Fujiwara, T. Physiological roles and transport mechanisms of boron: Perspectives from plants. Pflüg. Arch. 2008, 456, 671–677. [Google Scholar] [CrossRef] [PubMed]
- Ralston, N.V.; Hunt, C.D. Diadenosine phosphates and S-adenosylmethionine: Novel boron binding biomolecules detected by capillary electrophoresis. BBA Gen. Subj. 2001, 1527, 20–30. [Google Scholar] [CrossRef]
- Brown, P.; Bellaloui, N.; Wimmer, M.; Bassil, E.; Ruiz, J.; Hu, H.; Pfeffer, H.; Dannel, F.; Römheld, V. Boron in plant biology. Plant Biol. 2002, 4, 205–223. [Google Scholar] [CrossRef]
- Brown, P.H.; Shelp, B.J. Boron mobility in plants. Plant Soil 1997, 193, 85–101. [Google Scholar] [CrossRef]
- Camacho-Cristóbal, J.J.; Rexach, J.; González-Fontes, A. Boron in plants: Deficiency and toxicity. J. Integr. Plant Biol. 2008, 50, 1247–1255. [Google Scholar] [CrossRef] [PubMed]
- Reid, R.J.; Hayes, J.E.; Post, A.; Stangoulis, J.C.R.; Graham, R.D. A critical analysis of the causes of boron toxicity in plants. Plant Cell Environ. 2004, 27, 1405–1414. [Google Scholar] [CrossRef]
- Keren, R.; Bingham, F. Boron in water, soils and plants. In Advances in Soil Science; Springer: Berlin, Germany, 1958; pp. 229–276. [Google Scholar]
- Papadakis, I.E.; Tsiantas, P.I.; Tsaniklidis, G.; Landi, M.; Psychoyou, M.; Fasseas, C. Changes in sugar metabolism associated to stem bark thickening partially assist young tissues of Eriobotrya japonica seedlings under boron stress. J. Plant Physiol. 2018, 231, 337–345. [Google Scholar] [CrossRef] [PubMed]
- Genty, B.; Briantais, J.-M.; Baker, N.R. The relationship between the quantum yield of photosynthetic electron transport and quenching of chlorophyll fluorescence. BBA Gen. Subj. 1989, 990, 87–92. [Google Scholar] [CrossRef]
- Schreiber, U.; Schliwa, U.; Bilger, W. Continuous recording of photochemical and non-photochemical chlorophyll fluorescence quenching with a new type of modulation fluorometer. Photosynth. Res. 1986, 10, 51–62. [Google Scholar] [CrossRef] [PubMed]
- Kramer, D.M.; Johnson, G.; Kiirats, O.; Edwards, G.E. New fluorescence parameters for the determination of Q A redox state and excitation energy fluxes. Photosynth. Res. 2004, 79, 209. [Google Scholar] [CrossRef] [PubMed]
- Guidi, L.; Remorini, D.; Cotrozzi, L.; Giordani, T.; Lorenzini, G.; Massai, R.; Nali, C.; Natali, L.; Pellegrini, E.; Trivellini, A. The harsh life of an urban tree: The effect of a single pulse of ozone in salt-stressed Quercus ilex saplings. Tree Physiol. 2016, 37, 246–260. [Google Scholar]
- Wolf, B. The determination of boron in soil extracts, plant materials, composts, manures, water and nutrient solutions. Commun. Soil Sci. Plant 1971, 2, 363–374. [Google Scholar] [CrossRef]
- Lichtenthaler, H.K.; Buschmann, C. Chlorophylls and carotenoids: Measurement and characterization by UV-VIS spectroscopy. Curr. Protoc. Food Anal. Chem. 2001, 1, F4. 3.1–F4. 3.8. [Google Scholar] [CrossRef]
- El-Motaium, R.; Hu, H.; Brown, P.H. The relative tolerance of six Prunus rootstocks to boron and salinity. J. Am. Soc. Hortic. Sci. 1994, 119, 1169–1175. [Google Scholar] [CrossRef]
- Schopfer, P.; Lapierre, C.; Nolte, T. Light-controlled growth of the maize seedling mesocotyl: Mechanical cell-wall changes in the elongation zone and related changes in lignification. Physiol. Plant 2001, 111, 83–92. [Google Scholar] [CrossRef]
- Cervilla, L.; Rosales, M.; Rubio-Wilhelmi, M.; Sánchez-Rodríguez, E.; Blasco, B.; Ríos, J.; Romero, L.; Ruiz, J. Involvement of lignification and membrane permeability in the tomato root response to boron toxicity. Plant Sci. 2009, 176, 545–552. [Google Scholar] [CrossRef] [PubMed]
- Ghanati, F.; Morita, A.; Yokota, H. Deposition of suberin in roots of soybean induced by excess boron. Plant Sci. 2005, 168, 397–405. [Google Scholar] [CrossRef]
- Ghanati, F.; Morita, A.; Yokota, H. Induction of suberin and increase of lignin content by excess boron in tobacco cells. J. Plant Nutr. Soil Sci. 2002, 48, 357–364. [Google Scholar] [CrossRef]
- Hayes, J.E.; Reid, R.J. Boron tolerance in barley is mediated by efflux of boron from the roots. Plant Physiol. 2004, 136, 3376–3382. [Google Scholar] [CrossRef] [PubMed]
- Kalayci, M.; Alkan, A.; Cakmak, I.; Bayramoğlu, O.; Yilmaz, A.; Aydin, M.; Ozbek, V.; Ekiz, H.; Ozberisoy, F. Studies on differential response of wheat cultivars to boron toxicity. Euphytica 1998, 100, 123–129. [Google Scholar] [CrossRef]
- Sheng, O.; Zhou, G.; Wei, Q.; Peng, S.; Deng, X. Effects of excess boron on growth, gas exchange and boron status of four orange scion–rootstock combinations. J. Plant Nutr. Soil Sci. 2010, 173, 469–476. [Google Scholar] [CrossRef]
- Landi, M.; Margaritopoulou, T.; Papadakis, I.E.; Araniti, F. Boron toxicity in higher plants: An update. Planta 2019, 250, 1–22. [Google Scholar] [CrossRef] [PubMed]
- Han, S.; Tang, N.; Jiang, H.-X.; Yang, L.-T.; Li, Y.; Chen, L.-S. CO2 assimilation, photosystem II photochemistry, carbohydrate metabolism and antioxidant system of citrus leaves in response to boron stress. Plant Sci. 2009, 176, 143–153. [Google Scholar] [CrossRef]
- Farrant, J.M.; Pammenter, N.; Berjak, P. Seed development in relation to desiccation tolerance: A comparison between desiccation-sensitive (recalcitrant) seeds of Avicennia marina and desiccation-tolerant types. Seed Sci. Res. 1993, 3, 1–13. [Google Scholar] [CrossRef]
- Lemoine, R.; La Camera, S.; Atanassova, R.; Dédaldéchamp, F.; Allario, T.; Pourtau, N.; Bonnemain, J.-L.; Laloi, M.; Coutos-Thévenot, P.; Maurousset, L. Source-to-sink transport of sugar and regulation by environmental factors. Front. Plant Sci. 2013, 4, 272. [Google Scholar] [CrossRef] [PubMed]
- Rosa, M.; Prado, C.; Podazza, G.; Interdonato, R.; González, J.A.; Hilal, M.; Prado, F.E. Soluble sugars: Metabolism, sensing and abiotic stress: A complex network in the life of plants. Plant Signal. Behav. 2009, 4, 388–393. [Google Scholar] [CrossRef] [PubMed]
- Landi, M.; Degl’Innocenti, E.; Pardossi, A.; Guidi, L. Antioxidant and photosynthetic responses in plants under boron toxicity: A review. Am. J. Agric. Biol. Sci. 2012, 7, 255–270. [Google Scholar] [CrossRef]
- Lewis, D.H. Boron: The essential element for vascular plants that never was. New Phytol. 2019, 221, 1685–1690. [Google Scholar] [CrossRef] [PubMed]
- Gupta, A.K.; Kaur, N. Sugar signalling and gene expression in relation to carbohydrate metabolism under abiotic stresses in plants. J. Biosci. 2005, 30, 761–776. [Google Scholar] [CrossRef] [PubMed]
- Sheen, J. Master regulators in plant glucose signaling networks. J. Plant Biol. 2014, 57, 67–79. [Google Scholar] [CrossRef] [PubMed]
- Koch, K. Carbohydrate-modulated gene expression in plants. Annu. Rev. Plant Biol. 1996, 47, 509–540. [Google Scholar] [CrossRef] [PubMed]
- Pego, J.V.; Kortstee, A.J.; Huijser, C.; Smeekens, S.C. Photosynthesis, sugars and the regulation of gene expression. J. Exp. Bot. 2000, 51, 407–416. [Google Scholar] [CrossRef] [PubMed]
- Rolland, F.; Moore, B.; Sheen, J. Sugar sensing and signaling in plants. Plant Cell 2002, 14, S185–S205. [Google Scholar] [CrossRef] [PubMed]
- Guo, P.; Qi, Y.-P.; Yang, L.-T.; Ye, X.; Jiang, H.-X.; Huang, J.-H.; Chen, L.-S. cDNA-AFLP analysis reveals the adaptive responses of citrus to long-term boron-toxicity. BMC Plant Biol. 2014, 14, 284. [Google Scholar] [CrossRef] [PubMed]
- Landi, M.; Remorini, D.; Pardossi, A.; Guidi, L. Purple versus green-leafed Ocimum basilicum: Which differences occur with regard to photosynthesis under boron toxicity? J. Plant Nutr. Soil Sci. 2013, 176, 942–951. [Google Scholar] [CrossRef]
- Lovatt, C.J.; Bates, L.M. Early effects of excess boron on photosynthesis and growth of Cucurbita pepo. J. Exp. Bot. 1984, 35, 297–305. [Google Scholar] [CrossRef]
- Macho-Rivero, M.Á.; Camacho-Cristóbal, J.J.; Herrera-Rodríguez, M.B.; Müller, M.; Munné-Bosch, S.; González-Fontes, A. Abscisic acid and transpiration rate are involved in the response to boron toxicity in Arabidopsis plants. Physiol. Plant. 2017, 160, 21–32. [Google Scholar] [CrossRef] [PubMed]
- Macho-Rivero, M.A.; Herrera-Rodríguez, M.B.; Brejcha, R.; Schäffner, A.R.; Tanaka, N.; Fujiwara, T.; González-Fontes, A.; Camacho-Cristóbal, J.J. Boron toxicity reduces water transport from root to shoot in arabidopsis plants. Evidence for a reduced transpiration rate and expression of major PIP aquaporin genes. Plant Cell Physiol. 2018, 59, 836–844. [Google Scholar] [CrossRef] [PubMed]
- Sotiropoulos, T.E.; Therios, I.N.; Dimassi, K.N.; Bosabalidis, A.; Kofidis, G. Nutritional status, growth, CO2 assimilation and leaf anatomical responses in two kiwifruit species under boron toxicity. J. Plant Nutr. 2002, 25, 1249–1261. [Google Scholar] [CrossRef]
- Lobo, A.K.M.; de Oliveira Martins, M.; Neto, M.C.L.; Machado, E.C.; Ribeiro, R.V.; Silveira, J.A.G. Exogenous sucrose supply changes sugar metabolism and reduces photosynthesis of sugarcane through the down-regulation of Rubisco abundance and activity. J. Plant Physiol. 2015, 179, 113–121. [Google Scholar] [CrossRef] [PubMed]
- Cao, J. Chlorophyll a fluorescence transient as an indicator of active and inactive photosystem II in thylakoid membranes. BBA Bioenerg. 1990, 1015, 180–188. [Google Scholar] [CrossRef]
- Flexas, J.; Bota, J.; Escalona, J.M.; Sampol, B.; Medrano, H. Effects of drought on photosynthesis in grapevines under field conditions: An evaluation of stomatal and mesophyll limitations. Funct. Plant Biol. 2002, 29, 461–471. [Google Scholar] [CrossRef]
- Klughammer, C.; Schreiber, U. Complementary PS II quantum yields calculated from simple fluorescence parameters measured by PAM fluorometry and the Saturation Pulse method. PAM Appl. Notes 2008, 1, 201–247. [Google Scholar]
- Pfündel, E.; Klughammer, C.; Schreiber, U. Monitoring the effects of reduced PS II antenna size on quantum yields of photosystems I and II using the Dual-PAM-100 measuring system. PAM Appl. Notes 2008, 1, 21–24. [Google Scholar]
© 2019 by the authors. Licensee MDPI, Basel, Switzerland. This article is an open access article distributed under the terms and conditions of the Creative Commons Attribution (CC BY) license (http://creativecommons.org/licenses/by/4.0/).