Article

Substitution of Inorganic Nitrogen Fertilizer with Green Manure (GM) Increased Yield Stability by Improving C Input and Nitrogen Recovery Efficiency in Rice Based Cropping System

1
National Engineering Laboratory for Improving Quality of Arable Land, Institute of Agricultural Resources and Regional Planning, Chinese Academy of Agricultural Sciences, Beijing 100081, China
2
National Observation Station of Qiyang Agri-Ecology System, Institute of Agricultural Resources and Regional Planning, Chinese Academy of Agricultural Sciences, Qiyang, Hunan 426182, China
3
Institute of Soil, Fertilizer and Agricultural Water Conservation, Xinjiang Academy of Agricultural Sciences, Urumqi 830091, China
4
College of Agriculture, Henan University of Science and Technology, Luoyang 471000, China
*
Authors to whom correspondence should be addressed.
Muhammad Qaswar and Huang Jing equally contributed for this research.
Agronomy 2019, 9(10), 609; https://doi.org/10.3390/agronomy9100609
Submission received: 22 July 2019 / Revised: 27 September 2019 / Accepted: 30 September 2019 / Published: 3 October 2019
(This article belongs to the Section Soil and Plant Nutrition)

Abstract

:
A long-term field experiment was carried out (since 2008) for evaluating the effects of different substitution rates of inorganic nitrogen (N) fertilizer by green manure (GM) on yield stability and N balance under double rice cropping system. Treatments included, (1) N0 (no N fertilizer and no green manure); (2) N100 (recommended rate of N fertilizer and no green manure); (3) N100-M (recommended rate of N fertilizer and green manure); (4) N80-M (80% of recommended N fertilizer and green manure); (5) N60-M (60% of recommended N fertilizer and green manure); and (6) M (green manure without N fertilization). Results showed that, among all treatments, annual crop yield under N80-M treatment was highest. Crop yield did not show significant differences between N100-M and N80-M treatments. Substitution of different N fertilizer rates by GM reduced the yield variability index. Compared to the N0 treatment, yield variability index of early rice under N100-M, N80-M, and N60-M treatments was decreased by 11%, 26%, and 36%, respectively. Compared to the N0 treatment, yield variability index of late rice was decreased by 12%, 38%, 49%, 47%, and 24% under the N100, N100-M, N80-M, N60-M, and M treatments, respectively. During period of 2009–2013 and 2014–2018, nitrogen recovery efficiency (NRE) was highest under N80-M treatment and N balance was highest under N100 treatment. NRE of all treatments with GM was increased over the time from 2009–2013 to 2014–2018. All treatments with GM showed increasing trend of SOC over the years. Substitution of N fertilizer by GM also increased C inputs and soil C:N ratio compared to the N100 and N0 treatments. Boosted regression model indicated that C input, N uptake and AN were most influencing factors of crop yield. Thus, we concluded that N fertilization rates should be reduced by 20% under GM rotation to attain high yield stability of double rice cropping system through increasing NRE and C inputs.

1. Introduction

Rice is the main food for more than 50% of the world’s population and more than 60% of the Chinese population [1,2]. China will need to produce about 20% more rice, as population will increase by 2030, to meet the domestic need at current level of rice consumption per capita [3]. Chinese farmers mainly depend on chemical nitrogen (N) fertilizer to get high crop yield that is making China the world’s largest N fertilizer consumer. According to Food and Agriculture Organization [4], N fertilizer use in China in 2013 was 33% of world’s N fertilizer consumption. During the past decades, despite of high rate of N application, growth of rice yield was lower and stagnated in many rice cultivated regions of China [5,6]. No increase in crop yield with excessive N application led to a lower N recovery efficiency (NRE) [7]. The long-term excessive application of inorganic N fertilizers increased crop yield and improved soil fertility over the past decades [8,9], but continuous excessive N fertilizer inputs, degraded soil quality by increasing soil acidification and losses of soil organic carbon [10], then reducing the N fertilizer use efficiency. Excessive inorganic N fertilizer application also threatens the environmental health by increasing greenhouse gas emissions and groundwater contamination [10,11]. In the southern part of China acidification has become one of the major problem of agricultural soils that limit the crop yield [10].
Therefore, to increase the agricultural sustainability by sustaining long-term high yield with minimum environmental problem has become major concern. New strategies of crop management are urgently required to prevent the soil degradation by long-term excessive inorganic fertilization. Leguminous crops are known as N efficient crops that fix the atmospheric N2 in root nodules by symbiosis with rhizobia [12,13]. Therefore, legumes can save the use of inorganic N fertilizer and improve soil C/N cycling and fertility [14]. Furthermore, under long-term cultivation practices, changes in the physical and chemical properties of soil will influence the soil microbial population and microbial activities [15,16].
International organizations working for agricultural sustainability have focused on the prospective role of introducing legumes in intensive cropping systems in the past two decades [17,18]. In the rice-based cropping systems, legume cultivation during fallow season of crop followed by incorporation of green manure (GM) in paddy soil, enhanced soil fertility and reduced environmental losses of N by reducing the rate of inorganic N fertilization [19]. It is essential to explore the agronomic and environmental role of rice/legume rotation, to attain high crop yield stability with environmental sustainability.
Soil organic carbon (SOC) is one of the main soil fertility indexes [20]. Different organic and inorganic fertilization enhances the soil C inputs and influences soil carbon sequestration rate [21]. Long-term inorganic fertilization can also affect the SOC sequestration rate by addition of C input from crop residue and root stubbles. For instance, Zhang et al. [22] reported that inorganic fertilization enhanced the soil C input by 2.5 to 5.0 Mg ha−1 in Southern China. GM enhanced the SOC stock by 14–24% as compared to the fallow [23]. In the meta-analysis study, McDaniel et al. [24] reported that compared to fallow, cover crops increased the SOC sequestration. Benbi et al. [25] showed that the combined use of inorganic N fertilizer and GM can not only improve the soil organic matter (SOM) and soil N contents [26], but also increase the activities of arbuscular mycorrhizal fungi and extra-radical hyphae and microbial communities in soil [27]. Furthermore, GM increased water stable macro-aggregates in the topsoil layer and rate of organic N mineralization, which can enhance the availability and uptake of N by plants [28,29]. However, excessive or sole GM application can negatively affect crop yield [30,31], and the optimal rate of inorganic N by GM mainly depends on species of crop and soil fertility status [32]. In previous studies, effect of GM on crop production was investigated in monoculturally or over a short period of cultivation [33]. However, the impact of long-term GM substitution for inorganic N fertilizer on crop yield stability is not fully understood. Particularly, no long-term studies have investigated the yield stability under GM substitution for inorganic N fertilizer under double rice cropping system. The aim of this study was to investigate the effects of long-term different substitution rates of inorganic N fertilizer by milkvetch green manure on yield stability and N recovery efficiency under double rice cropping system in paddy soil.

2. Materials and Methods

2.1. Site Description

A field experiment was initiated in 2008 at red soil experimental station in Qiyang, Hunan province of China (26°45′42″ N, 111°52′32″ E) under the observation of Chinese academy of agricultural sciences. In this region, the mean annual rain fall is 1289 mm and the mean annual temperature (MAT) is 17.6 °C. The rain fall period is from early of April to end of June. MAT and mean annual precipitation (MAP) during the experiment duration is given in the supplement file (Figure S1). The soil type at the experimental site is ferralic cambisol, which is a paddy soil and according to the Chinese classification of soil it is known as red soil [34]. The initial characteristics of topsoil (0–20 cm soil depth) included, soil pH of 6.4; SOC of 12.5 g kg−1; total N (TN) of 1.57 g kg−1; available N (AN) of 110 mg kg−1; total P (TP) of 0.89 g kg−1; available P (AP) of 24 mg kg−1; total K (TK) of 8.9 g kg−1; and available K (AK) of 41 mg kg−1.

2.2. Experimental Design

This study was randomly designed under rice-rice-milkvetch cropping system receiving different rates of inorganic N fertilizer. In this study, we selected six treatments (Table 1): (1) N0 (no N fertilizer and no green manure); (2) N100 (recommended rate of N fertilizer and no green manure); (3) N100-M (recommended rate of N fertilizer and green manure); (4) N80-M (80% of recommended N fertilizer and green manure); (5) N60-M (60% of recommended N fertilizer and green manure); and (6) M (green manure without N fertilization). Each plot (1.8 m by 15.0 m) of the treatments had three replications arranged in randomized complete block design (RCBD). Each plot was separated from the nearby plot by a cemented barrier to prevent the water and nutrient contamination from adjacent plot. The fertilizers urea, calcium superphosphate, and potassium chloride were applied for N, P, and K, respectively. Fresh green manure was incorporated in soil after harvest before early rice transplantation. All inorganic fertilizers were applied as basal application. The treatments and rates of fertilizer application for both early and late rice crop are given in Table 1.

2.3. Crop Managent

The experiment was carried out under rice-rice-milkvetch rotation cropping system. Before starting the experiment, field was disposed of for three years to make sure the same soil properties. The locally cultivated rice verities having similar yield potential were used in this experiment (Table S1). During the experiment, cultivars were changed after every three years of cultivation. The rate of seedling was 200,000 holes per hectare. The cultivation period for early rice was after mid-April to July and for the late rice was end of July to October. The milkvetch as green manure crop was grown in each milkvetch treatment plot during August to March, and after milkvetch harvest, incorporated in the same plot in the end of March (before early rice transplantation). The average yield (dry weight) of milkvetch is given as supplementary data (Figure S2). The routine field management conventional practices such as irrigation and pest management were carried out. During the early rice cultivation, the field was kept flooded and the field was drained during the ripening stage of late rice crop. At full maturity, the crop was manually harvested. The grain and straw yields were air-dried and weighted separately.

2.4. Sampling and Laboratory Analysis

Straw and grain samples were oven-dried at 105 °C then heated at 70 °C to a constant weight to determine the dry matter and N content. After oven-drying, plant samples were ground and digested at 265–275 °C using H2SO4-H2O2. N content of straw, and grain was determined according to semi micro Kjeldahl digestion method [35]. N and P contents of GM were determined according to semi micro Kjeldahl digestion method and vanadomolybdate yellow method, respectively [35,36]. K content in GM was measured using flame photometer. The uptake of N was calculated by multiplying N content with crop yield. Each year after late rice harvest, soil samples at topsoil (0–20 cm soil depth) were collected at five different points from each plot. Each composite soil sample was mixed thoroughly to make homogenous, air-dried, and stored in clean polythene bags for further analysis. To measure soil chemical properties, soil samples were ground to pass through 0.25 mm sieve. SOC was determined by vitriol acid potassium dichromate oxidation method [37]. Soil total N, P, and K contents were measured following the methods by Black [38], Murphy and Riley [39], and Knudsen et al. [40], respectively. Soil AN, AP, and AK were determined according to Lu et al. [41], Olsen [42], and Page et al. [37], respectively. The bulk density (BD) of soil was measured once using a cutting ring of 100 cm3 volume, 50.46 mm inner diameter, and 50 mm sampling depth [43].

2.5. Calculations

Apparent N balance (ANB) (kg ha−1 year−1) was measured using the following equation:
ANB   ( kg   ha 1   year 1 ) = total   annual   N   input   total   Nuptake
Agronomic N recovery efficiency (NRE, %) was calculated by following equation:
NRE ( % ) = ( NU f NU c ) × 100 N applied
RE is agronomic recovery efficiency (%) of N. NUf is uptake of N (kg ha−1) in rice plant under fertilized treatment and NUc is uptake of N (kg ha−1) in rice plant under no nitrogen fertilization treatment. Napplied is amount of nitrogen applied in fertilized treatment (kg ha−1).
The amount of total C input included C from GM and plant residues. The annual input of soil C (C input, t ha−1) was calculated from the C content of belowground biomass (Croot, t ha−1), incorporated stubble (Cstubble, t ha−1), and the incorporated green manure (CGM, t ha−1).
C   input = C belowground + C stubble + C GM
C belowground = RTM × CR × 10 3
C stubble = STM × CS × 10 3
RTM is the roots residue (t ha−1 year−1) calculated as 30% of above-ground biomass of rice [44]. CR is carbon content of plant (418 g kg−1). STM is quantity of sables in the field (t ha−1 yr−1) calculated as 5.6% of rice straw yield [45]. CS is C content of rice straw (444 g kg−1).
The C stocks were measured by following equation:
SSOC = C × BD × H × 10 1
where, SSOC is stock of SOC (t ha−1 year−1), C is soil C content (g kg−1), BD is bulk density of soil (g cm−3), and H is depth of soil (cm).
The crop yield stability as influenced by different treatments was estimated by its variability (CV%):
CV = Y std Y m × 100
where, Ystd is the standard deviation of crop yield of a specific treatment over the 10 years of experiment and Ym is mean yield of that treatment over the 10 years of experiment.
The relative yield (YR) of the crop was estimated as follow:
RY = Y treatment Y control
where, Ytreatment is the grain yield of fertilizer treatment (t ha−1) and Ycontrol is the yield (t ha−1) of control treatment in a specific year.

2.6. Statistical Analysis

The differences among treatments were assessed (2009–2013 and 2014–2018) by one-way ANOVA followed by Tukey’s HSD test at p = 0.05 level of significance using SPSS.19.0 software. Changes in SOC over the fertilization years were investigated by linear regression. The relationship between C inputs and SOC stock, and SOC stock and crop yield were assessed also by linear regression. A boosted regression tree (BRT) was constructed to assess the relative influence of different predictors variables on relative yield using gbm package in R version 3.3.3 [46].

3. Results

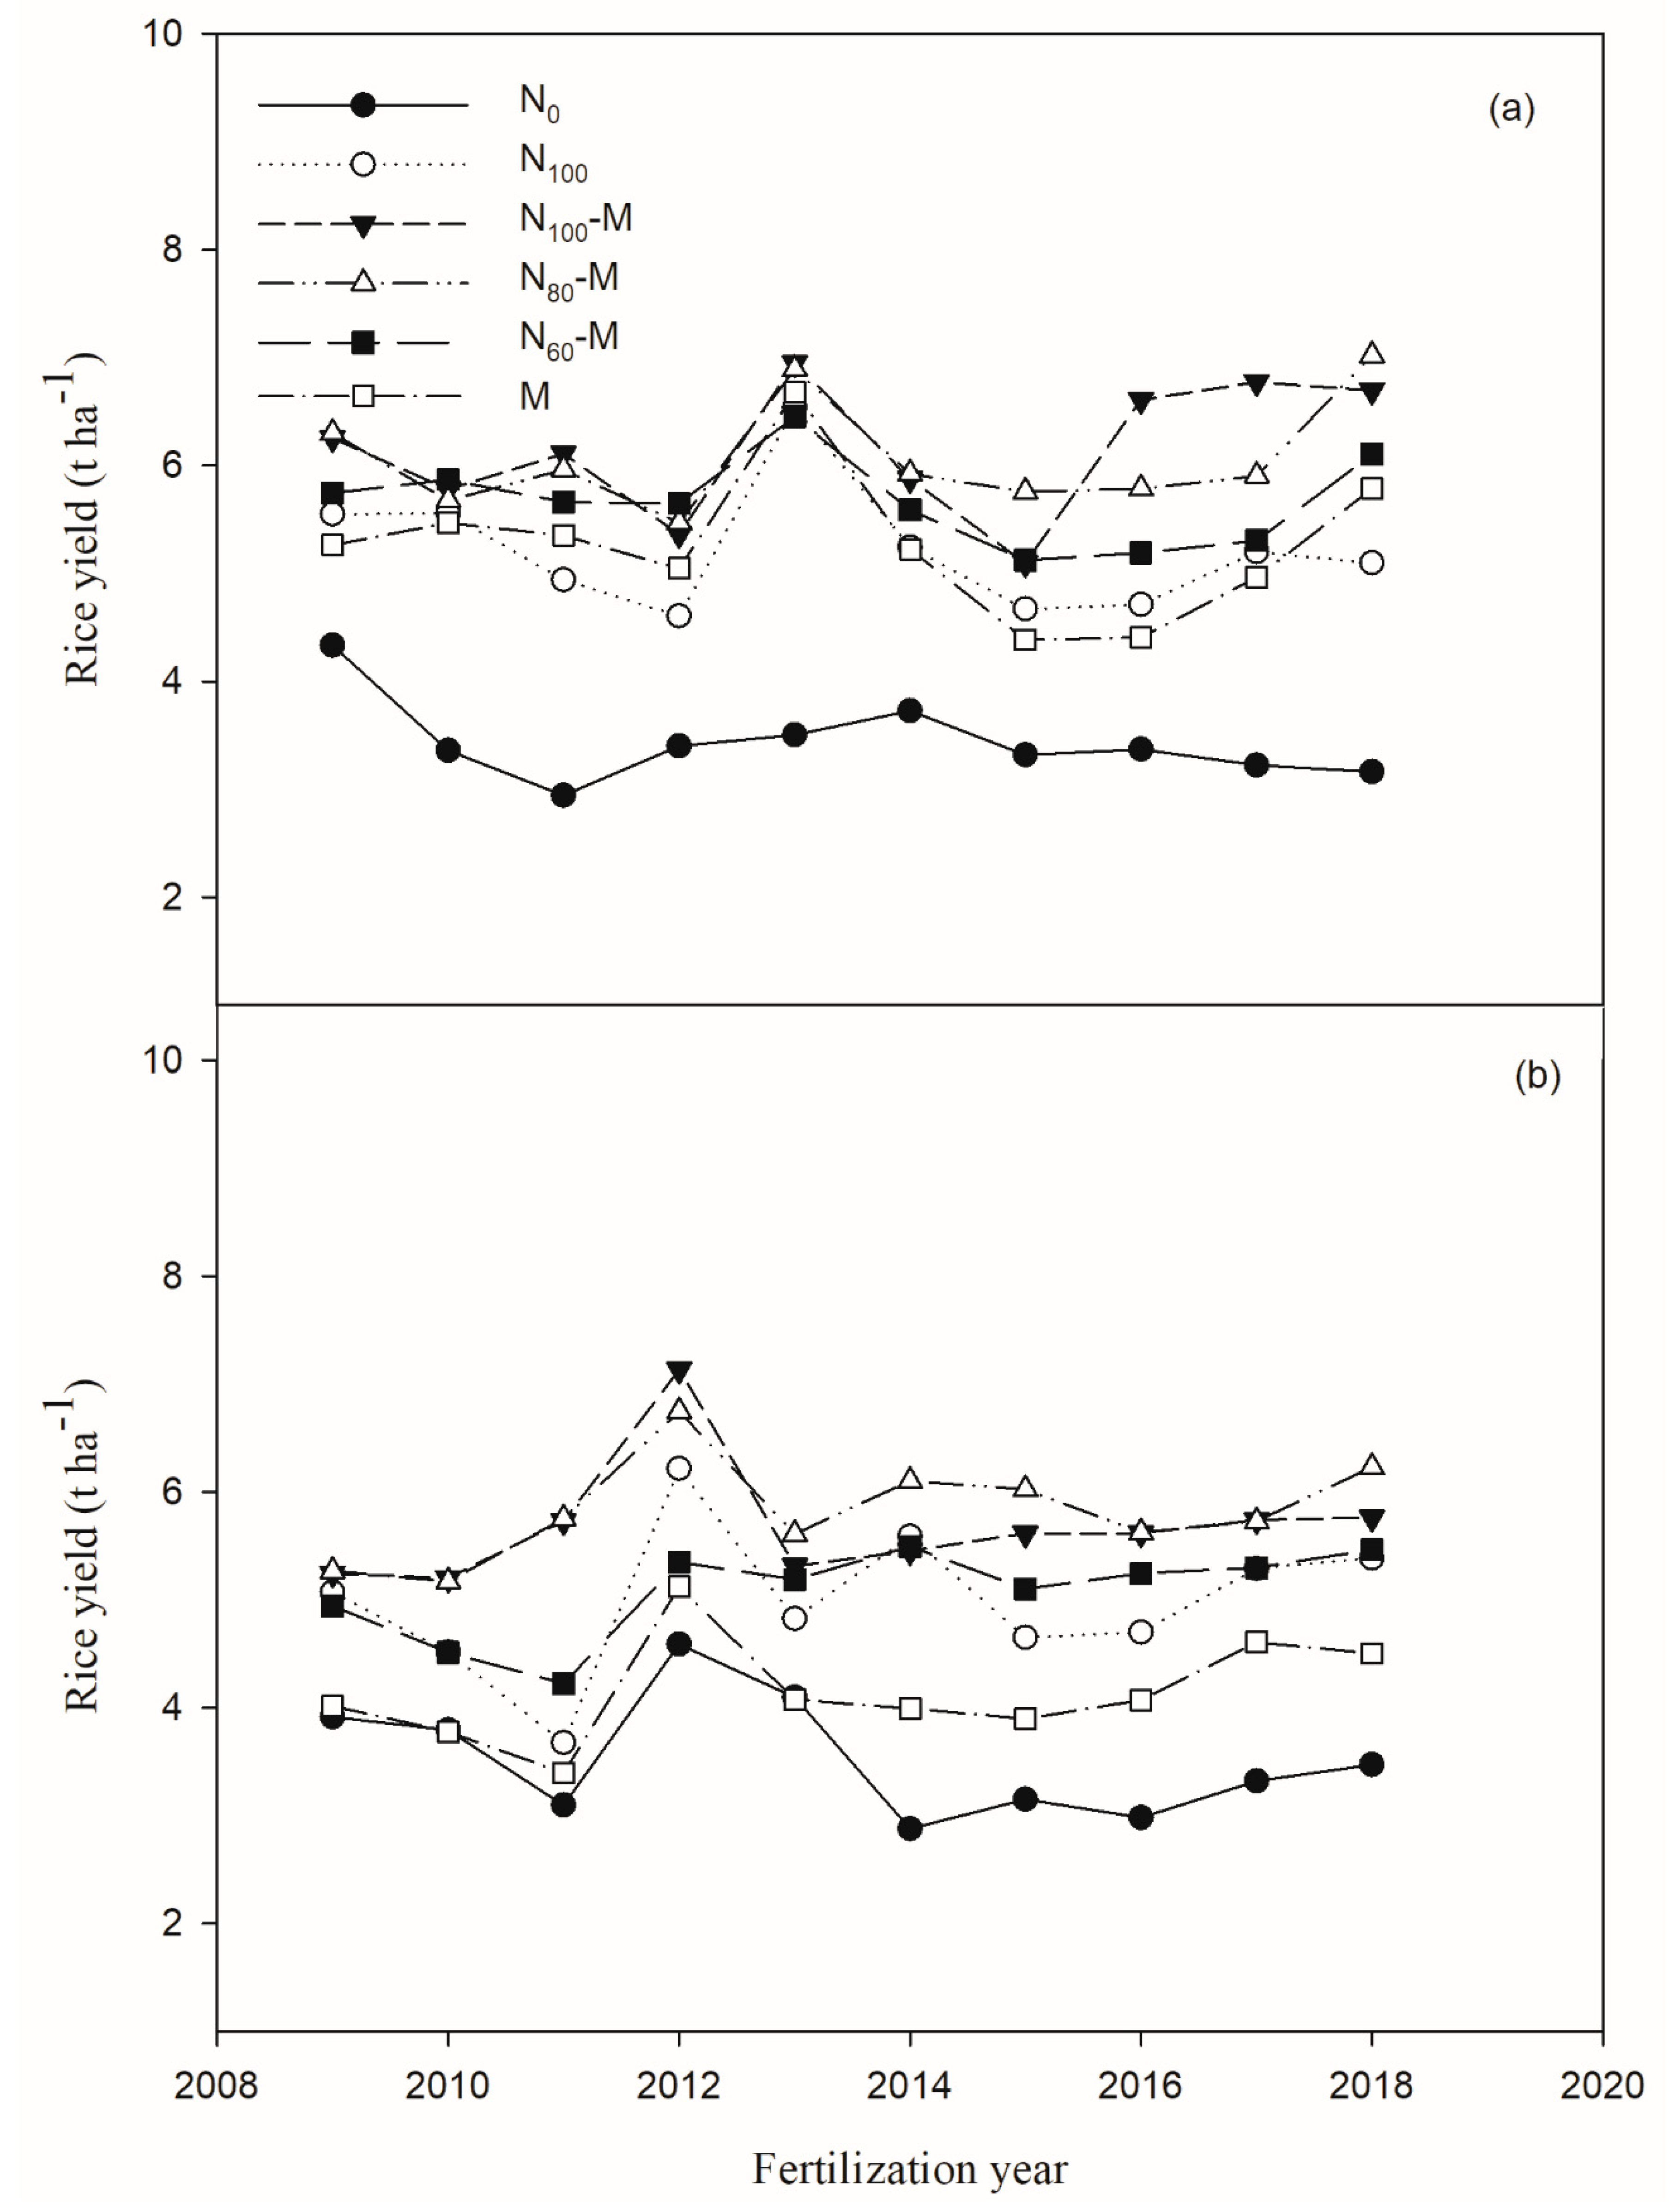
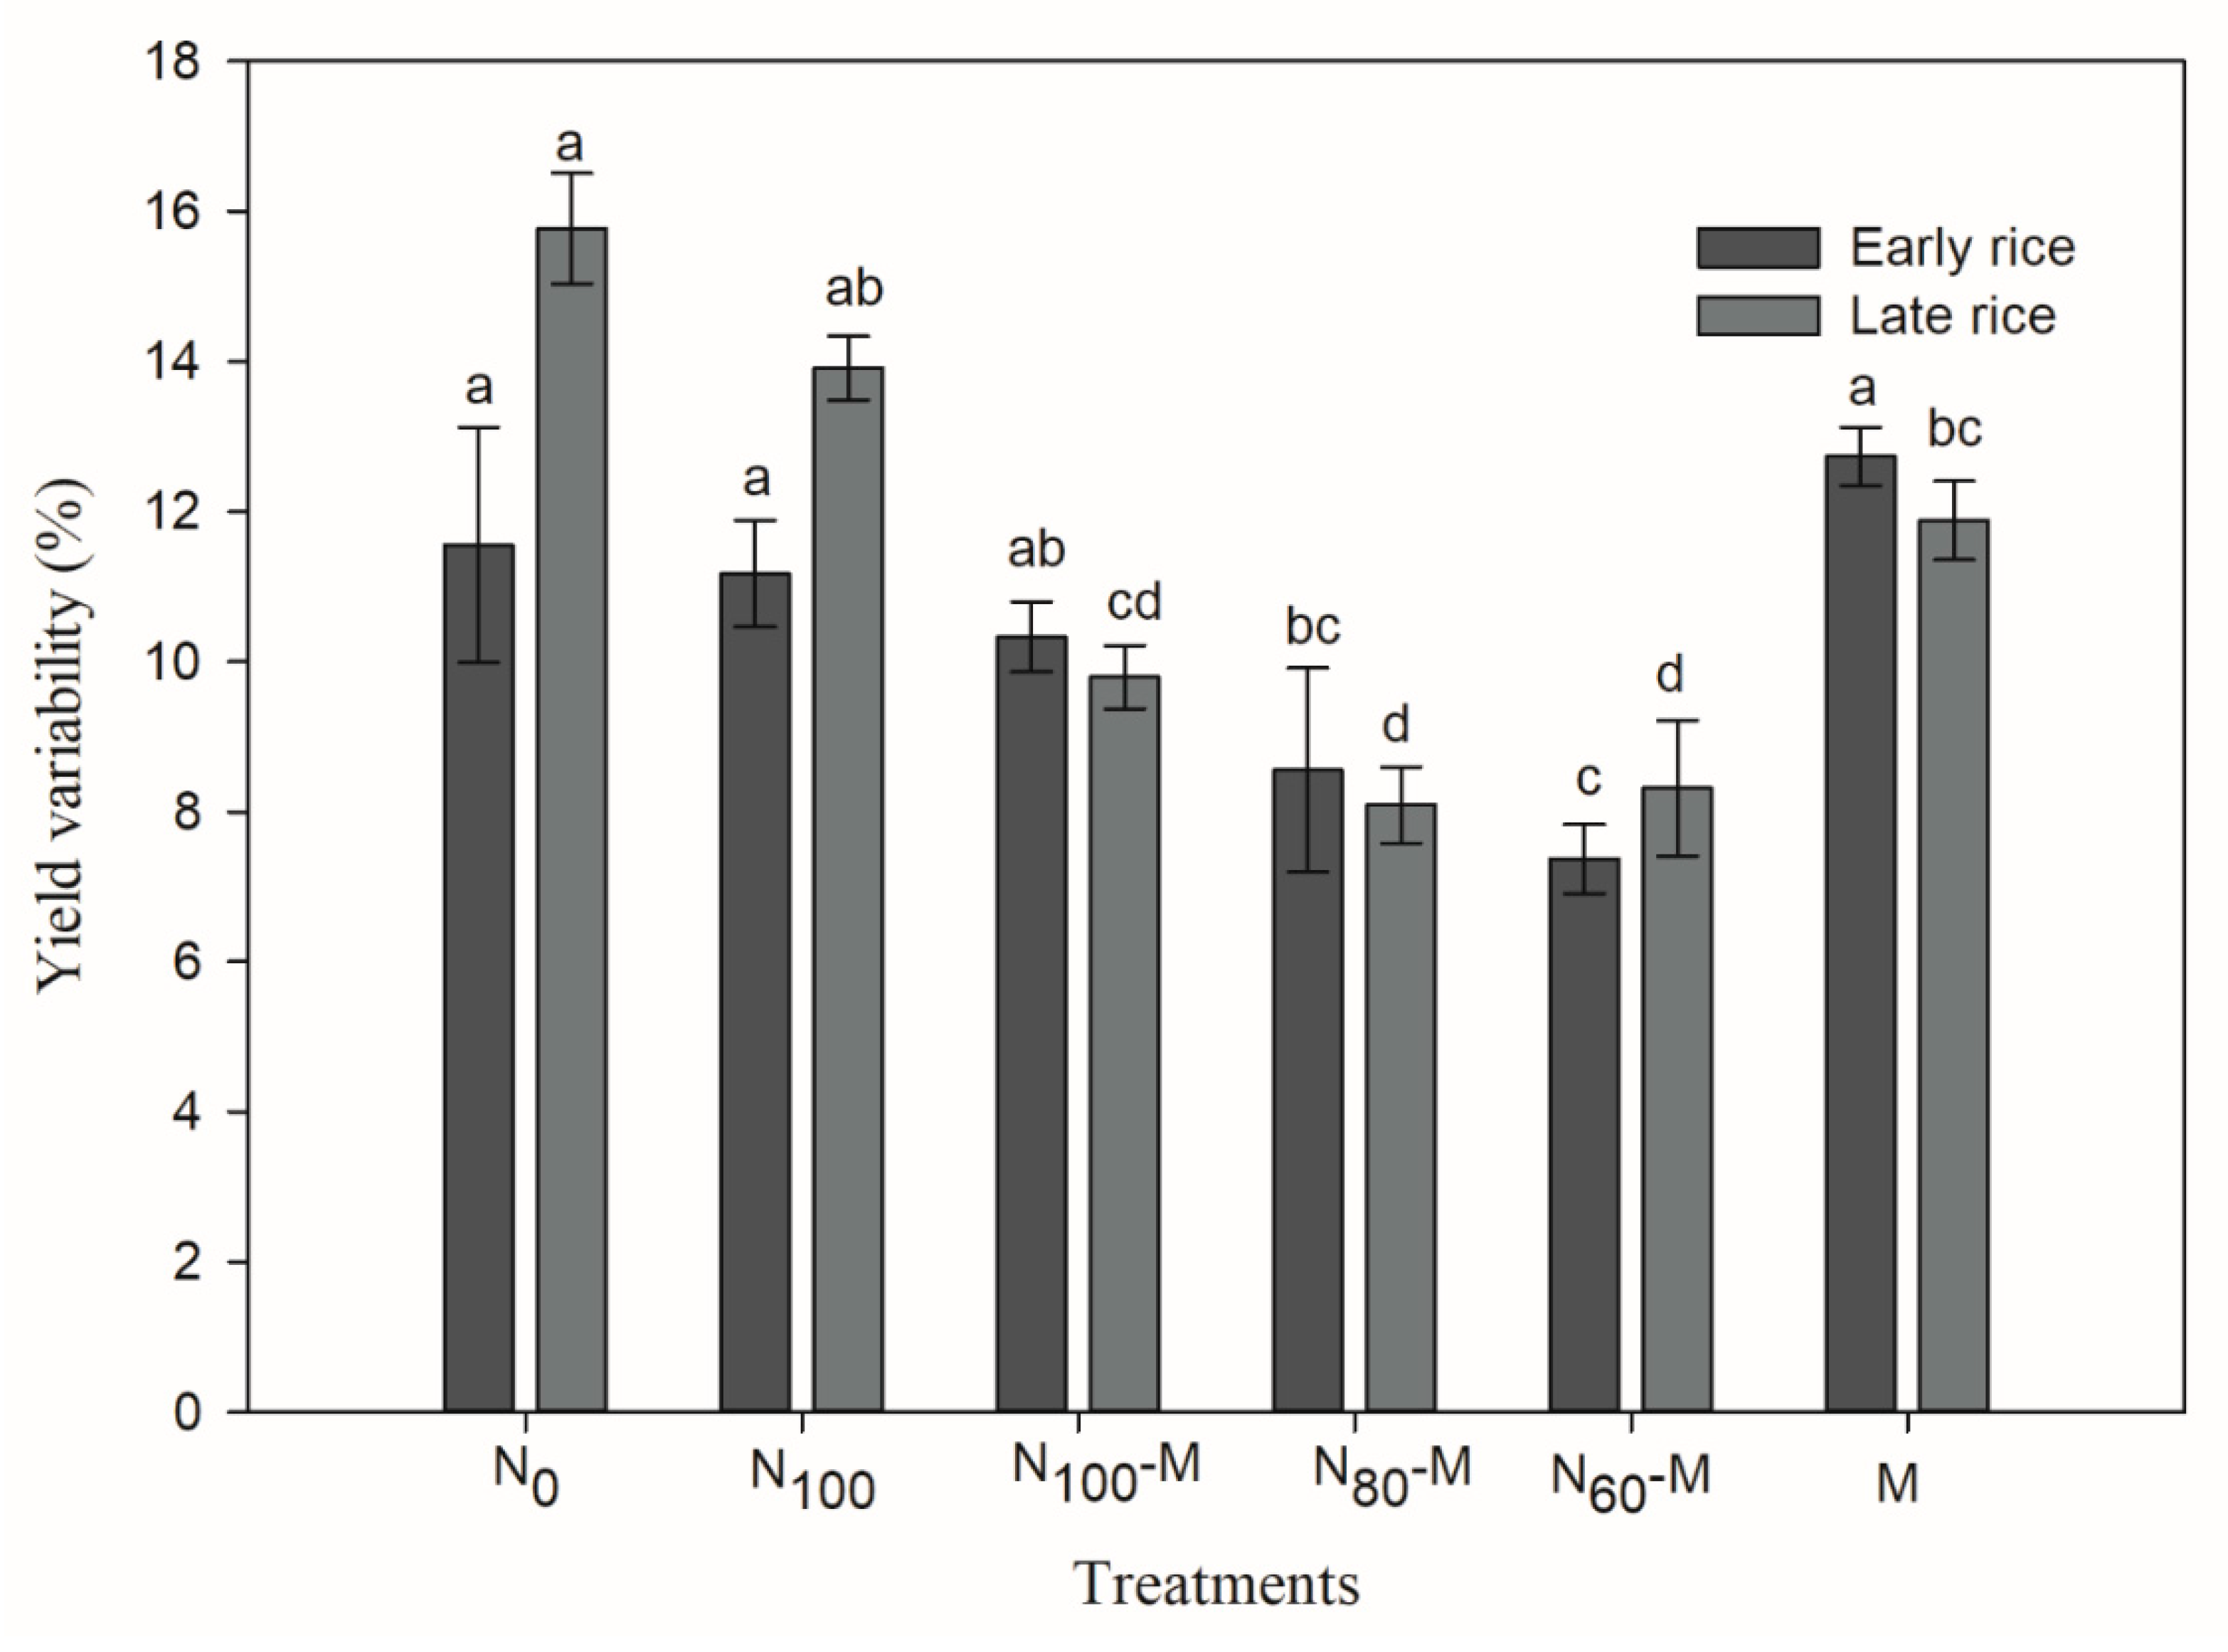
3.1. Crop Yield and Yield Stability

Long-term substitution of inorganic N fertilizer with green manure significantly influenced rice yield and stability in paddy soil under double rice cropping system (Figure 1 and Figure 2). Annual crop yield during 2009–2013 and 2014–2018 was highest under N100-M and N80-M, and crop yield was lowest in N0 treatment (Table 2). Annual grain yield did not show significant differences between 2009–2013 and 2014–2018 in the N100-M, N80-M, and N60-M treatments. Compared to 2009–2013, the annual grain yield during 2014–2018 under the N0, N100, and M treatments was decreased by 11%, 2%, and 5%, respectively. During 2009–2013, compared to the N0 treatment, annual increase in grain yield in the N100, N100-M, N80-M, N60-M, and M treatment was by 39%, 60%, 59%, 45%, and 30%, respectively. The respective increase in annual grain yield during 2014–2018 in the N100, N100-M, N80-M, N60-M, and M treatments was by 55%, 82%, 84%, 65%, and 41%, respectively, compared to N0 treatment.
The yield variability for the early rice was ranged from 7.5 to 12.7% and the yield variability for late rice was ranged from 8.1 to 15.7% (Figure 2). For early rice, yield variability did not show significant differences between N0 and N100 and M treatments. For early rice, yield variability in the N100-M, N80-M, and N60-M treatment was by 11%, 26%, and 36%, respectively, lower as compared to yield variability under the N0 treatment. For the late rice crop, the yield variability was highest in the N0 treatment, and did not show significant differences between the treatments N80-M and N60-M. Yield variability of late rice crop under the N100, N100-M, N80-M, N60-M, and M treatment was by 12%, 38%, 49%, 47%, and 24%, respectively, lower compared to that of the N0 treatment.

3.2. Nitrogen Uptake, Balance and Recovery Efficiency

The treatments significantly influenced N uptake, apparent N balance, and N recovery efficiencies (Table 2). Annual N uptake during 2009–2013 did not show significant differences among the N100-M and N80-M treatments. During 2009–2013, uptake of N under N100, N100-M, N80-M, N60-M, and M treatment was by 24%, 81%, 84%, 52%, and 32%, respectively, higher than that of the N0 treatment. During 2014–2018, N uptake under the N100, N100-M, N80-M, N60-M, and M treatment was by 49%, 111%, 147%, 93%, and 72%, respectively, higher than that of N0 treatment. Uptake of N during the 2009–2013 under all treatment except N80-M was lower than during the 2014–2018. N uptake under N80-M treatment was increased during 2014–2018 by 0.6% compared to the period of 2009–2013. N balance during 2009–2013 was ranged from −168 kg ha−1 year−1 in the M treatment to 165 kg ha−1year−1 in the N100 treatment. Apparent N balance was highest under N100 treatment. N balance during 2014–2018 was ranged from −164 kg ha−1 year−1 in M treatment to 181 kg ha−1 year−1 under N100 treatment. N balance during both cultivation periods (2009–2013 and 2014–2016) was higher in N80-M compared with N60-M treatment. Among different treatments of N inputs, NRE was lowest under N100 treatment. Compared to 2009–2013, NRE was increased during 2014–2018. During, 2009–2013, NRE under N100-M, N80-M, and N60-M treatment was by 171%, 193%, and 123%, respectively, greater than that of the N100 treatment. During 2014–2018, NRE under N100-M, N80-M, and N60-M treatment was by 87%, 117%, and 69%, respectively, greater than that of the N100 treatment.

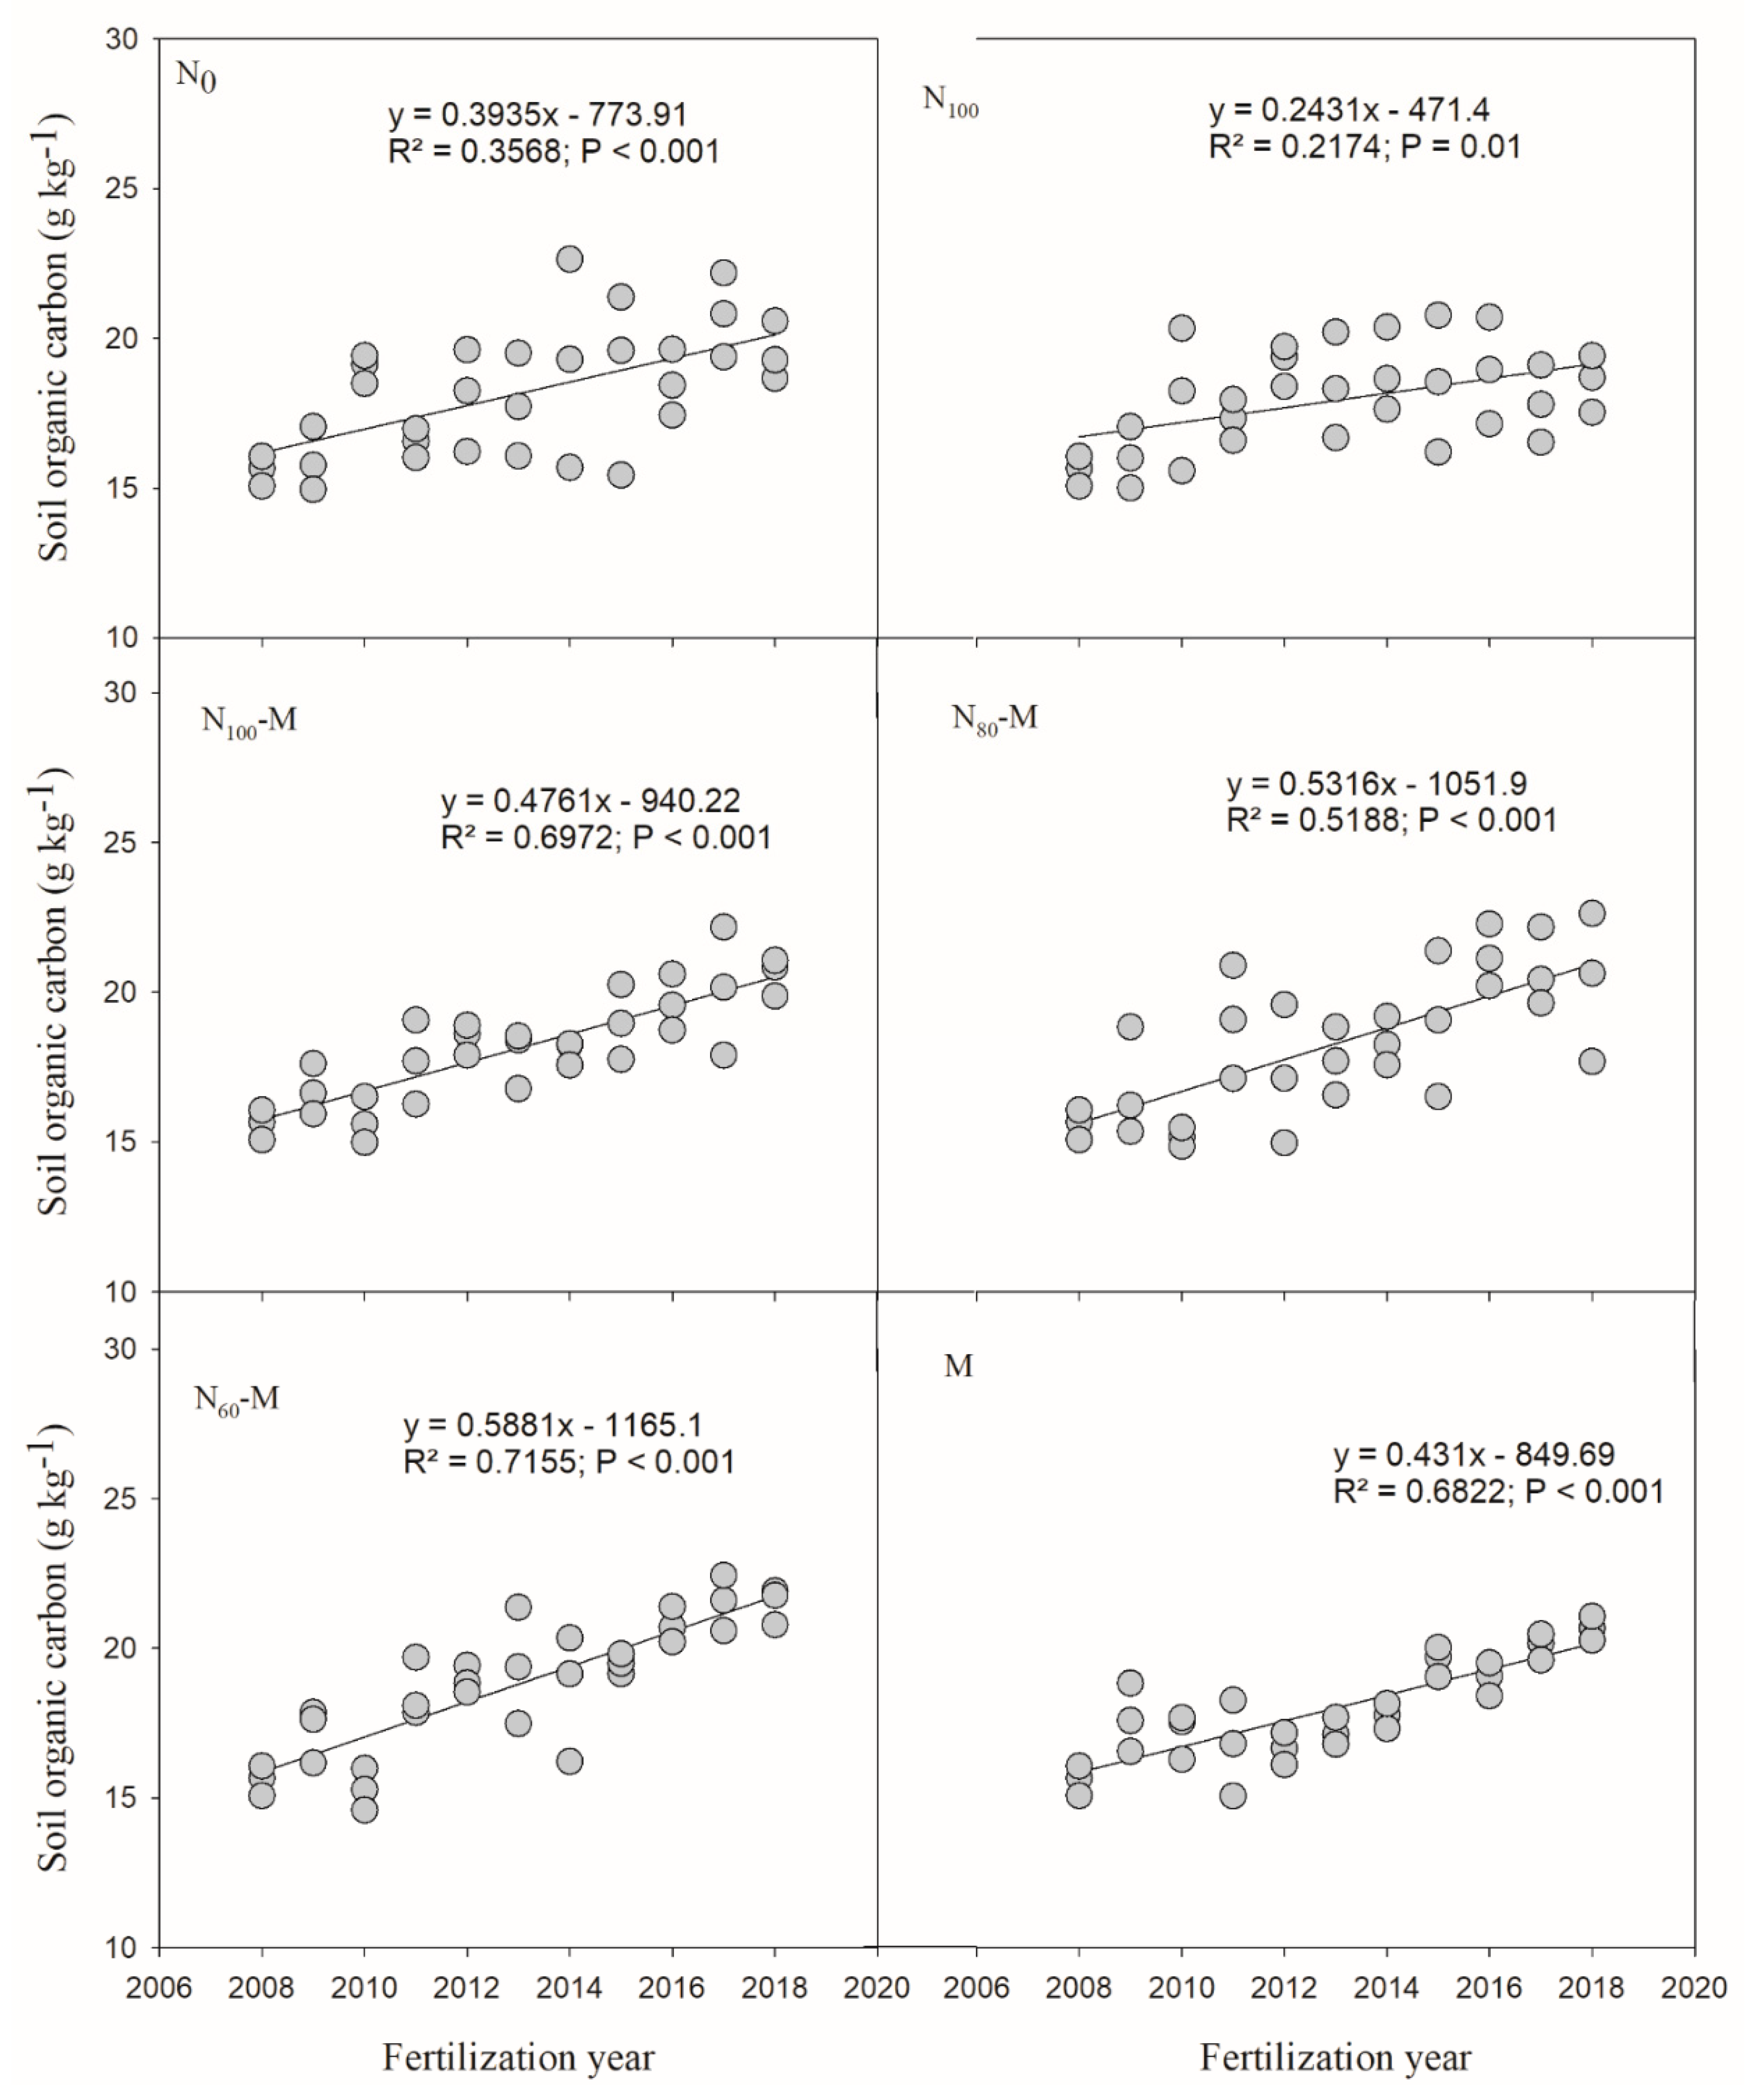
3.3. Changes in Soil Nutrients

The treatments significantly affected soil nutrients, pH and estimated C input (Table 3). Soil organic carbon showed significant increasing trends over the years in all treatments (Figure 3). Compared to the initial value, soil pH during 2009–2013 was decreased in all treatments except N60-M. Soil pH under the treatment N60-M during 2009–2013 was 6% greater than initial soil pH. Soil pH during 2014–2018 under the N80-M and N60-M treatments was increased by 2% and under the M treatment was increased by 7.2% compared to the initial soil pH. While, soil pH during 2014–2018 decreased under N0, N100, and N100-M treatments by 6%, 4%, and 2%, respectively, compared to the initial soil pH. During 2009–2013, soil TN and AN contents in all treatments were greater than their initial values. Soil TN and AN contents during 2009–2013 did not show significant differences between N80-M and N100-M. Soil TN and AN was highest in the N100-M treatment during 2009–2013 and during 2014–2018. During 2014–2018, soil TN contents in all treatments were increased except N0 compared to its initial value, in N0 treatment soil TN was decreased compared to its initial value. During 2014–2018, soil AN content was increased under the N100-M, N80-M, N60-M, and M treatments and soil AN content decreased under N0 and N100 treatments, compared to the initial soil AN. As compared to 2009–2013, the AN content during 2014–2018 were increased in N100-M, N80-M, N60-M, and M treatments and decreased in N0 and N100 treatments. Soil TP in all treatments except N0 and AP in all treatments during 2009–2013 and 2014–2018 was increased compared to their initial values. Compared to 2009–2013, soil TP content was increased in all treatments except N0 treatment during 2014–2018. But the AP during 2014–2018 was decreased in all treatments (except N100 treatment) compared to 2009–2013. Among all treatments, soil TK contents were lowest under N0 treatment. Soil AK content in all treatments except N0 during 2009–2013 and 2014–2018 was higher than initial soil AK content. Soil AK content during 2013 did not show significant differences between N100-M, N80-M, and N60-M treatments. Soil AK during 2014–2018 also did not show significant differences among N100-M, N80-M, N60-M, and M treatments. Soil AK content was also lowest under N0, compared to all other treatments. Soil C input did not show significant differences between the N100-M and N80-M treatments during 2009–2013. Soil C input during 2009–2013 highest in the N100-M treatment and during 2014–2018 was highest under N80-M treatment. Over the fertilization years, soil C input increased from 2009–2013 to 2014–2018 in N60-M and N80-M treatments. Moreover, Annual C inputs showed significant positive linear relationship with annual C stock (p < 0.001; R2 = 0.0397) (Figure 4). Soil C:N ratio during 2009–2013 did not show significant differences among all treatments. Soil C:N ratio during 2009–2013 was highest in N60-M treatment and during 2014–2018 was highest under N0 treatment. During 2014–2018, soil C:N ratio also did not show significant differences between N100, N100-M, N80-M, and M treatments.

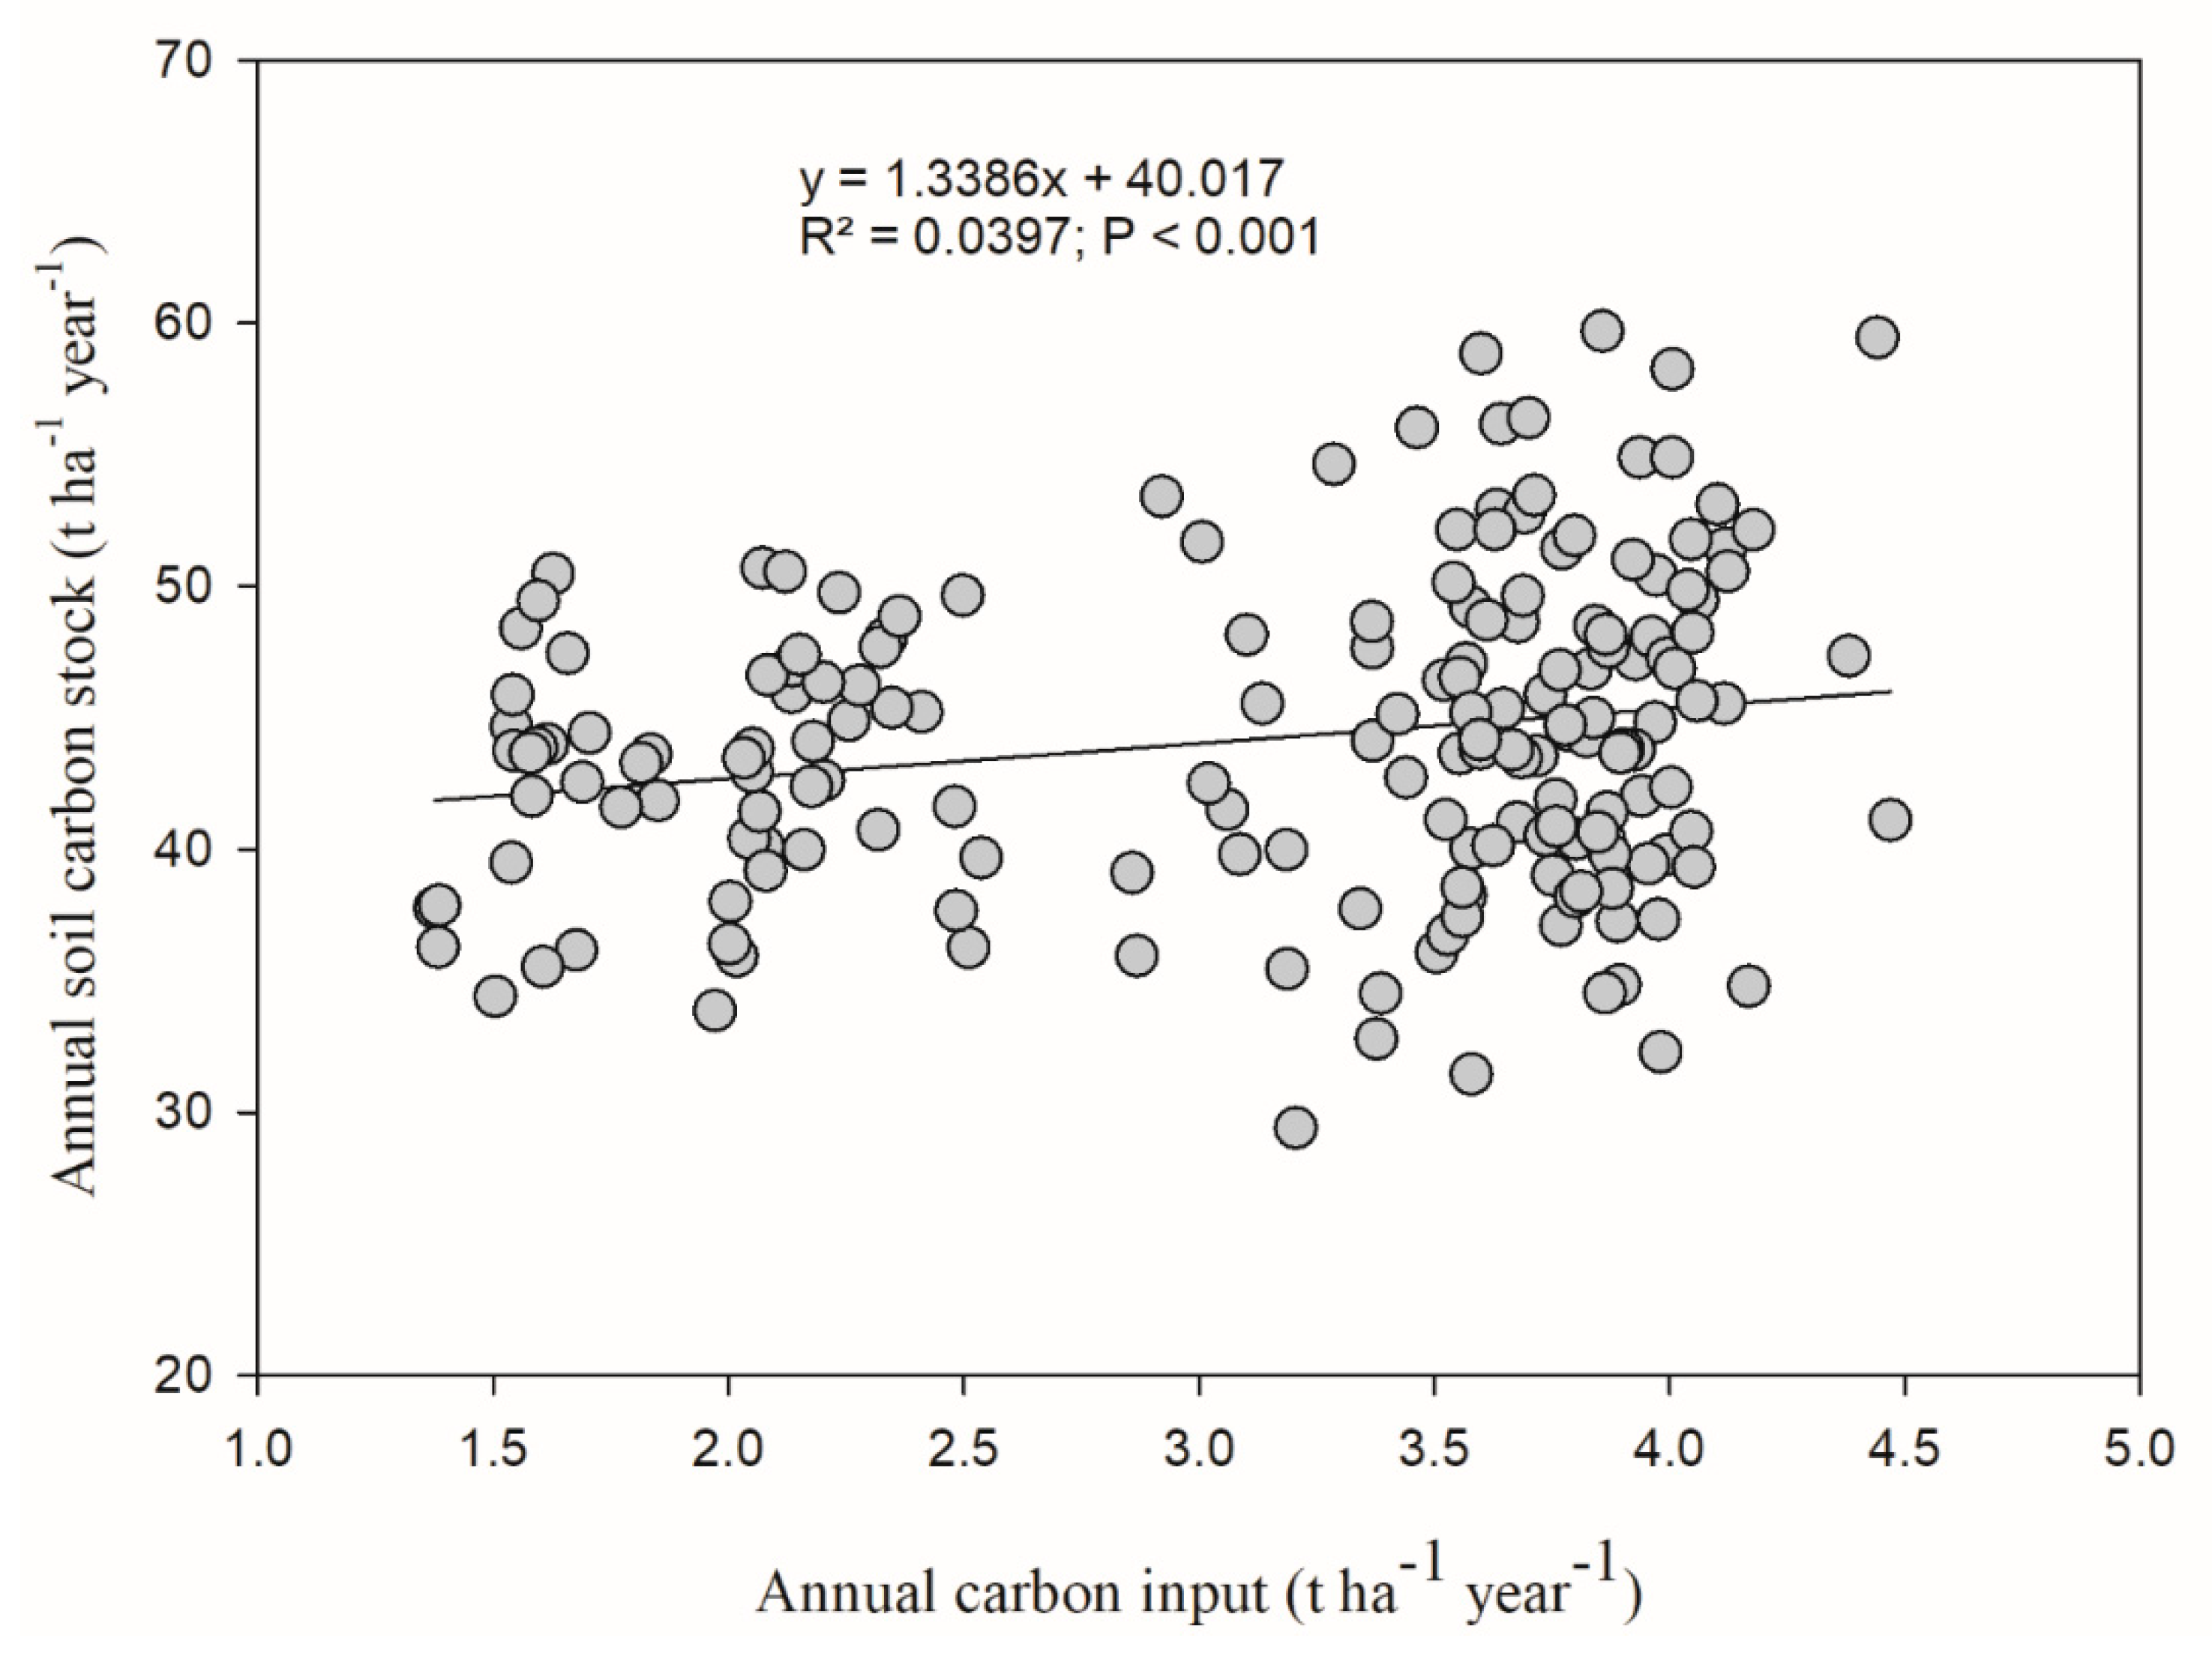
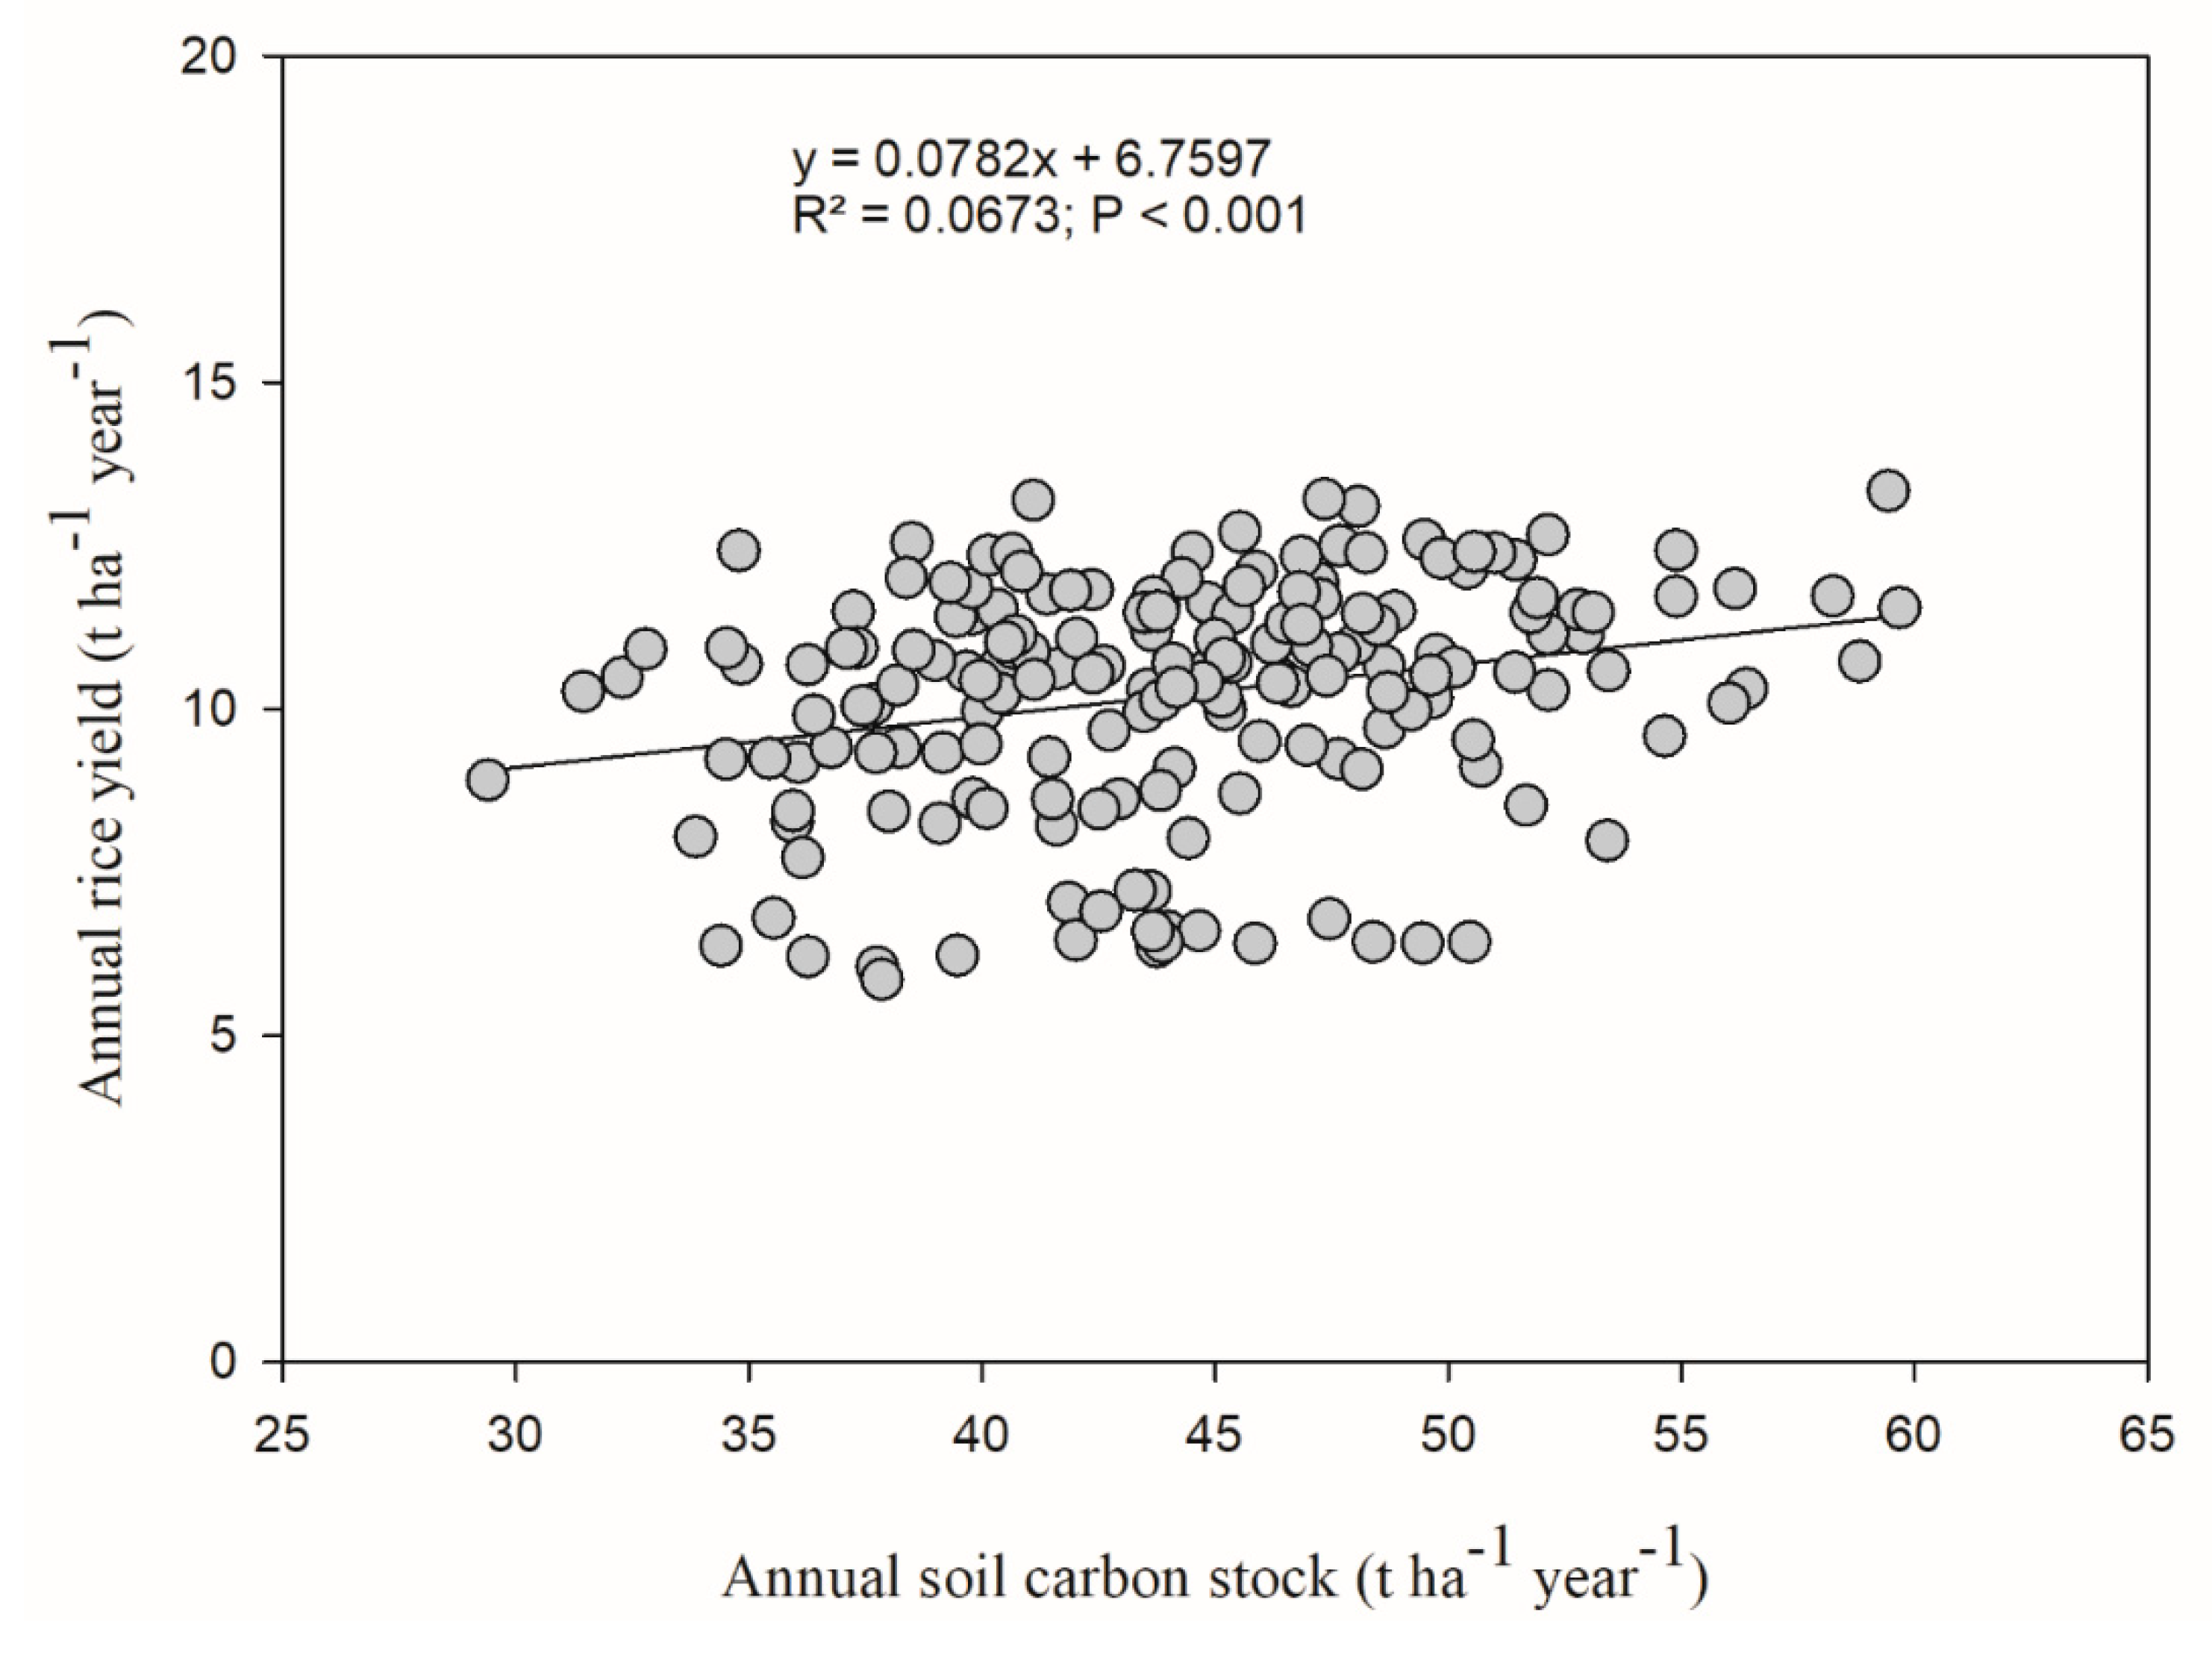
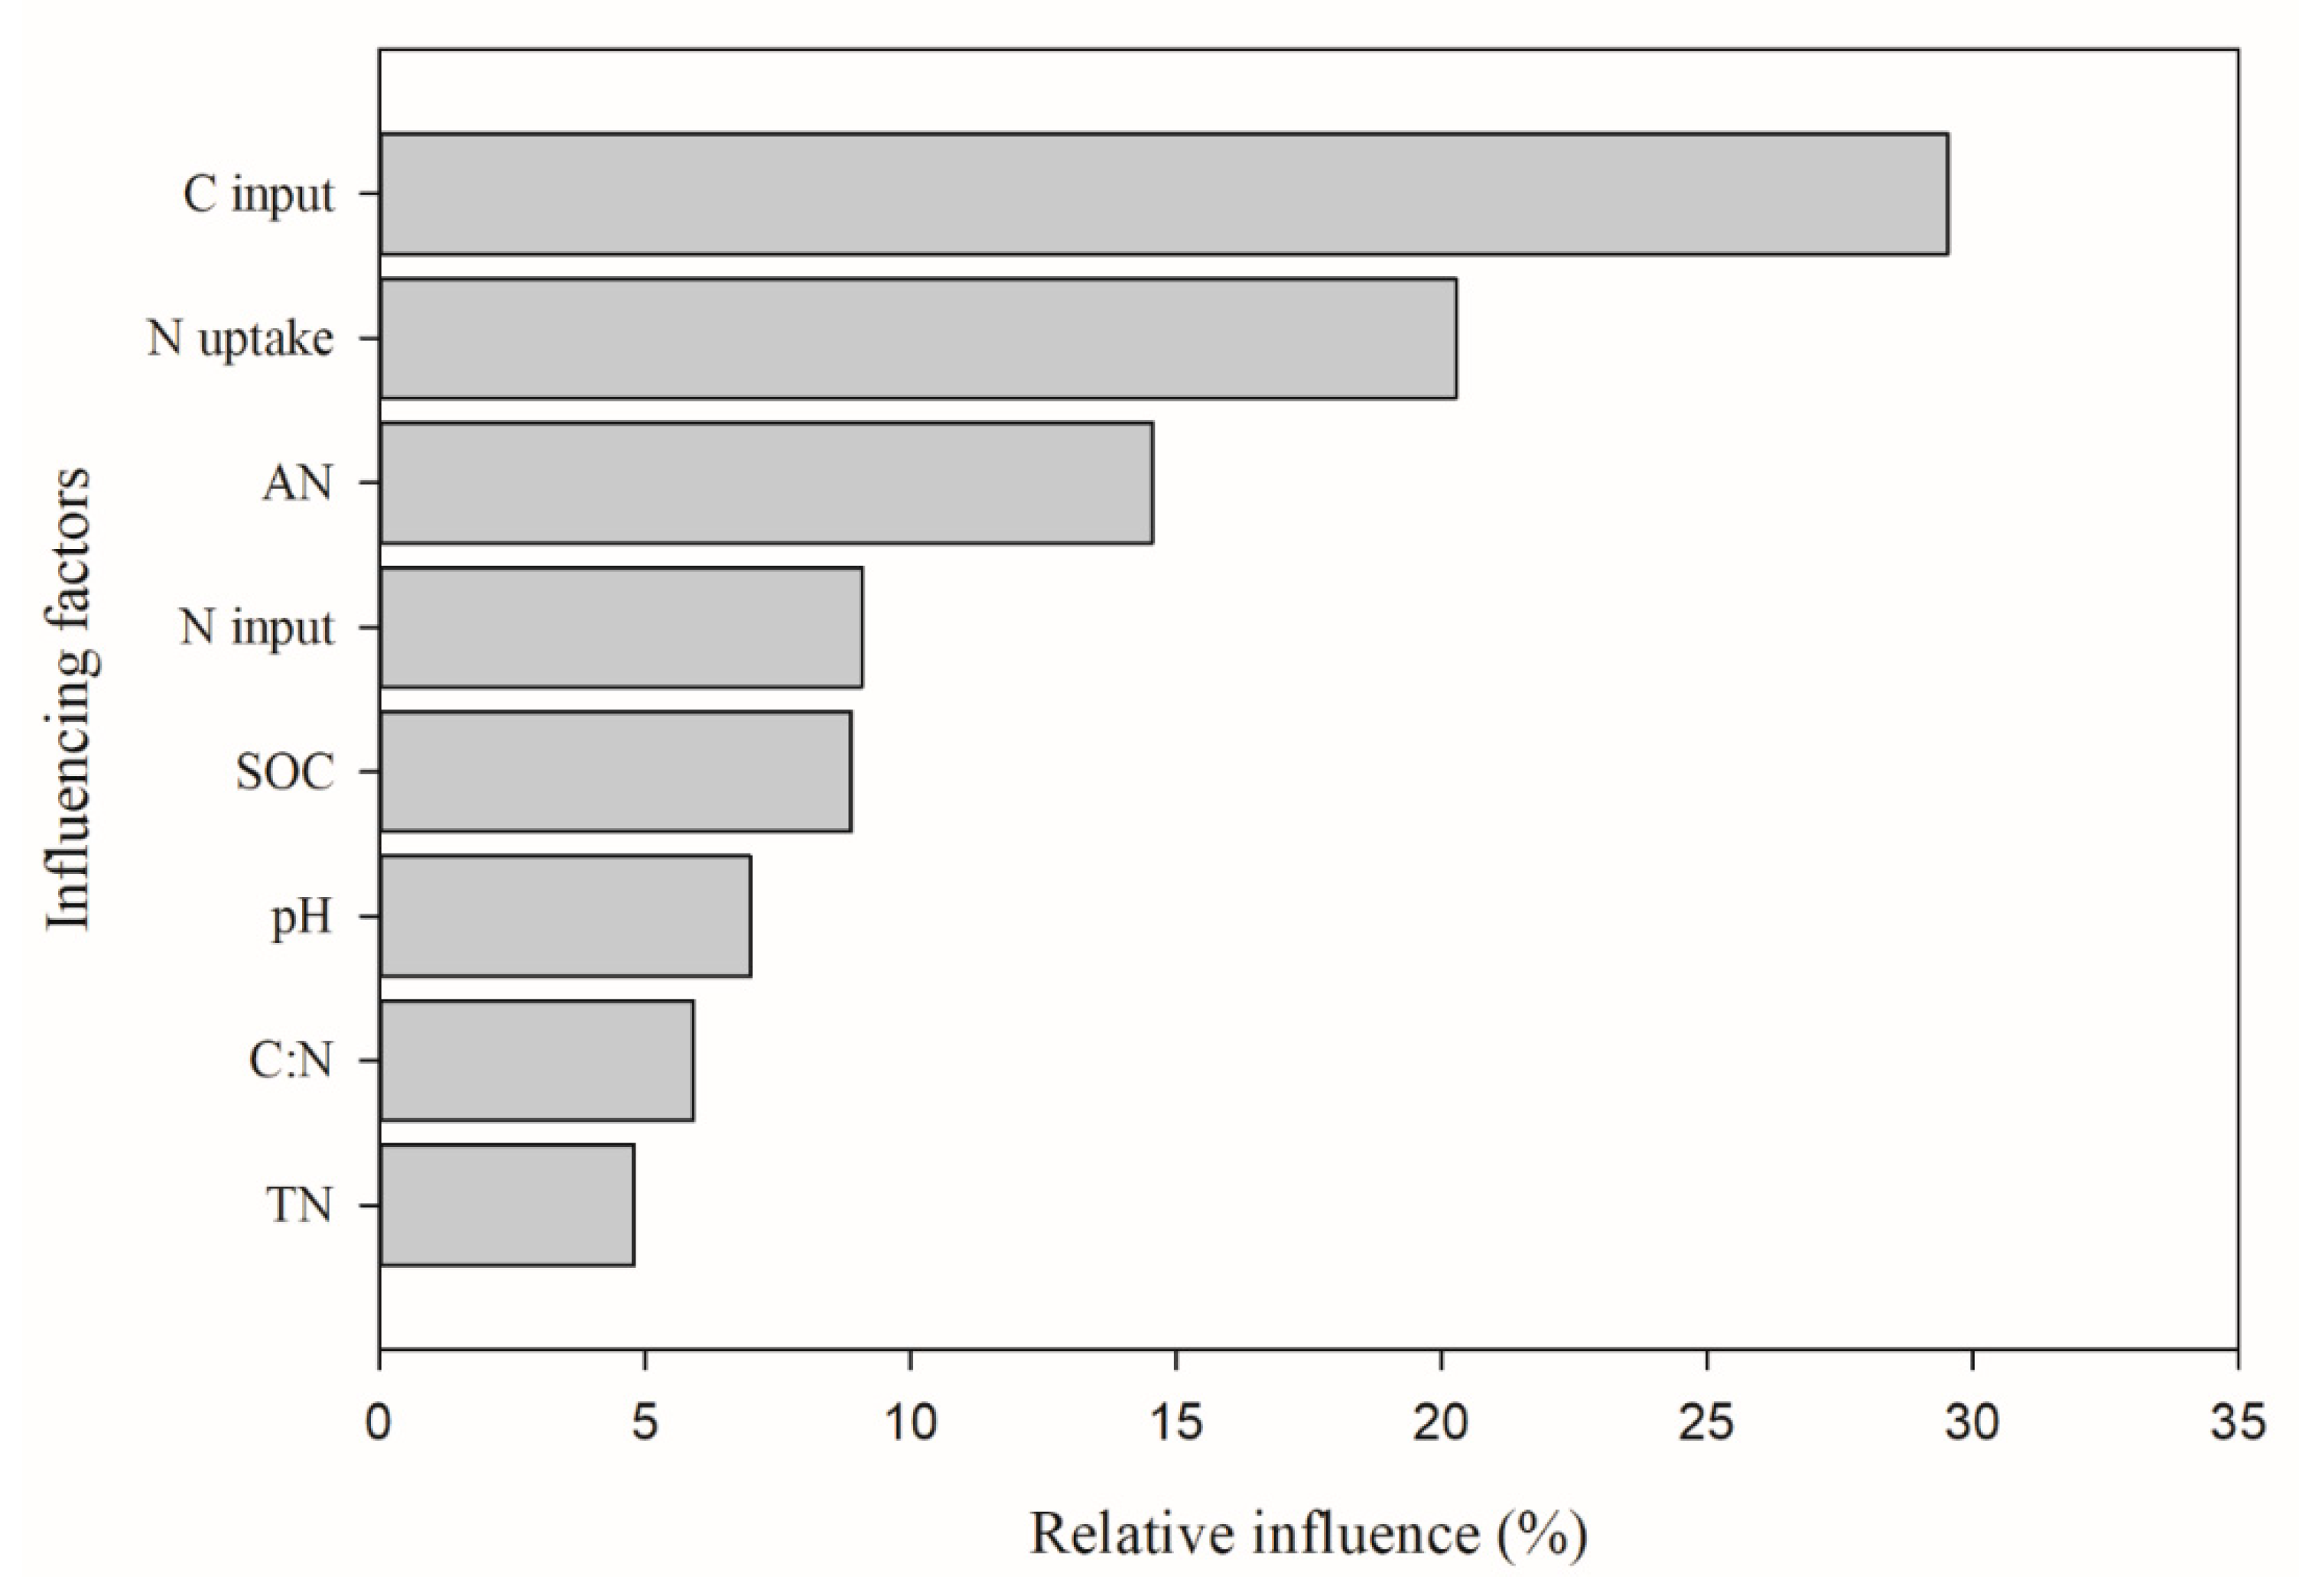
3.4. Influencing Factors of Crop Yield

Linear regression showed significant positive relationship between soil annual C stock and annual crop yield (p < 0.001; R2 = 0.067) (Figure 5). The boosted regression tree model showed that C input, N uptake, AN, and SOC were the most influencing factors of relative crop yield (Figure 6). The relative influence of C input, N uptake, and AN on relative crop yield was 29.5%, 20.3%, 14.6%, and 9.0%, respectively. The relative influence of N input, SOC, soil pH, C:N ratio, and TN was below 10%.

4. Discussion

The effective management of inorganic N fertilizer is essential to attain long-term stable and high crop yield [47]. Usually, application of inorganic N fertilizer increases the crop yield, but the high rates of N application are not assured to enhance the crop yield, but it may decrease the N use efficiency [10,48]. For the stable crop production sustainable N management relies on the balance between supply of N fertilizer to the crop and requirement of N by the crop [49]. In our results, crop yield under N100-M and N80-M were significantly higher than those of N60-M, N100, N0, and M treatments (Table 2). In a previous study, Xie et al. [50] also found that the substitution of GM for chemical N fertilization increased the rice grain yield under double rice cropping system. In our results, the decrease in crop yield over the years in N0 and N100 treatments was consistent with previous studies [50,51]. Cai et al. [52] also reported that crop yield was not increased after 12 years of inorganic N application due to decreasing in soil pH. Long-term application of inorganic N fertilizer decreased NRE due to reducing soil pH and hardening soil structure [53]. Worldwide, N is the most yield-limiting nutrients in the crop production [54], it is required relatively higher amount for optimum crop growth and N is the most mobile element in the soil [55]. Although, there are many agro-climatic factors that affect the crop yield. The rate of N application is one of the most important factors which affect the crop yield [56,57]. The variability of the yield over the period of experiment is estimated as negative measure of yield stability [58]. Different crop yield response to N fertilization is well documented in previous studies [59,60,61]. The yield stability plays a vital role to indicate the agricultural sustainability [62]. In our results, GM with reduced N application rates increased the yield stability of both early and late rice as compared to high N application. Yield variability with N60-M and N80-M was significantly lower than N100-M and N100 treatments (Figure 2). GM is important agricultural practice which can increase the crop yield and stability by improving soil physiochemical properties [50]. For example, GM increase the soil pH [63], fix the atmospheric N2 and enhance the SOC content [64], N mineralization, and N use efficiency [50]. Long-term inorganic N application increase the soil hardening and decrease the soil pH and N uptake [51,65]. In our results, N uptake was highest under N80-M and N100-M, and NRE was highest under N80-M treatment (Table 2). The increasing in NRE decreased N balance under N60-M and N80-M as compared to that of N100 treatment over the years (Table 2). Xie et al. [50] also found that GM with relatively lower rate increased N use efficiency. The factors affecting N use efficiency indices included crop, availability of other nutrients, climate, soil type, and genotypic differences [66,67]. High NRE under N80-M as compared to sole N application could be due to improvement in soil pH by GM and high C inputs under N80-M treatment as compared to N100 and N0 treatments (Table 3). GM substitution for inorganic N fertilization significantly decreased N balance by increasing NRE, which can reduce the environmental losses of N. However, in this study we did not measured the N losses in form of leaching and emissions. But N balance is robust estimation of N losses that is easy to calculate based on annual N inputs and crop uptake [68]. Snyder et al. [69] reported that the reduction of N balance can be achieved by better matching N fertilizer inputs and output in a cropping system while maintaining the crop yield. In the present study, milkvetch as GM crop proved as best substitution of inorganic N fertilizer to maintain high crop yield while decreasing the N balance.
In the present study, GM with lower N application increased soil pH and nutrient availability and C inputs as compared to sole N application and no N application treatments (Figure 3). Cultivation of leguminous crops as cover crop in fallow period of rice-based cropping system enhance the soil nutrient availability and fix the atmospheric N2 by symbiotic association with root nodules [70], and GM easily decomposed in soil and enhance the SOC and nutrient availability [28,71]. Many studies of long-term experiments reported the soil acidification due to inorganic N fertilization in different soil and cropping systems [65,72]. Plant usually release the net H+ ions, anions uptake exceeds the cations uptake, and plants release net excess of OH- or HCO3- [73]. Soil pH decreased by application of inorganic N fertilizer due to reduction in base cations in soil. Furthermore, inorganic N fertilization shifts soil into the Al3+ buffering stage. In soil solution, Al is released during the hydrolysis of Al-hydroxides on the surface clay minerals at relatively lower soil pH, which decrease the base cations and increase the soil acidification [74]. Manure application improve the soil pH by neutralizing protons in the soil [75].
The increase in SOC contents under GM treatments over the year (Figure 3) was due to increase in C inputs through long-term GM incorporation (Figure 4). Sainju et al. [76] observed that crimson clover as GM crop highly affected the SOC from 0.1 to 1 t C ha−1 year−1, which increased soil C stock. The GM increased soil microbial activities, microbial biomass, soil CO2 efflux which leads to increase C stock [77]. Therefore, SOC stock showed positive relationship with annual rice yield (Figure 5). Over the years, soil C:N ratio was increased due to increase in soil C input through GM incorporation and C:N ratio in all treatments was higher than initial soil C:N ratio, due to addition of soil C through crop residue during long-term cultivation. The soil C:N ratio under N60-M was highest among all treatments (Table 3), it could be due to relatively higher biomass production with lower N inputs and GM incorporation. In all treatments the soil C:N ratio was increased over the years (Table 3). In contrast, Yang et al. [78] observed relatively stable soil C:N ratio over the long-term organic and inorganic fertilization. The stable soil C/N ratio could be due to linear relationship between SOC and TN contents [79]. The soil C:N ratio, play important role in nutrient mineralization and microbial activities [64]. The variations in effects of organic material on soil C:N ratio mainly relate to the differences in soil C and N distribution in soil type of the paper plant systems and in the use of C and N by soil microorganisms under different treatments [78]. Khalil et al. [64] reported that soil C:N ratio play important role in mineralization of C and N in soil. Relatively higher soil C:N ratio favors the accumulation of C in soil, would help to reduce N losses by decreasing retention of soil N [80]. Furthermore, estimated C input and N uptake and AN were mainly factors influencing crop yield (Figure 6). In a previous study, Cai et al. [52] observed that manure was main influencing factor of crop yield. Therefore, substitution of inorganic N fertilizer by GM not only increased NRE and N uptake but also increased soil C content more than sole N fertilizer treatment that helped to reduce the yield variability and increased long-term crop yield stability.

5. Conclusions

In double rice cropping system, soil N content and crop yield was decreased over the time under no N fertilizer and sole N fertilizer application. During period of 2009–2013 and 2014–2018, highest annual crop yield was under N80-M treatment. Milkvetch crop as GM with reduced N application rates decreased the variability in yield and therefore increased yield stability. Estimated C inputs increased over the years which increased soil C:N ratio. C inputs, N uptake, and AN were the most influencing factors of crop yield. GM with relatively lower N rates increased NRE, C inputs, and decreased apparent N balance that could be helpful to reduce environmental losses of N fertilizers. Therefore, N fertilization rates need to be reduced by 20% under GM rotations to enhance yield stability in double rice cropping system in southern region of China.

Supplementary Materials

The following are available online at https://www.mdpi.com/2073-4395/9/10/609/s1. The supplementary material related to this article can be found in online version.

Author Contributions

Conceptualization and writing-original draft preparation, M.Q.; methodology, J.H.; formal analysis, W.A.; investigation, S.L.; resources, D.L. and L.Z.; writing-review and editing, L.L., Y.X., T.H. and J.D.; project administration, J.G.; supervision, H.Z.; funding acquisition, J.G. and H.Z.

Funding

This research was financially supported by the National Key Research and Development Program of China (2016YFD0300901, 2016YFD0300902 and 2017YFD0800101), and China Agriculture Research System-Green Manure (CARS-22-Z-09), and Fundamental Research Funds for Central Non-profit Scientific Institution (No. 161032019035, No. 161032019020).

Conflicts of Interest

The authors declare no conflict of interest.

References

  1. Patel, D.; Das, A.; Munda, G.; Ghosh, P.; Bordoloi, J.S.; Kumar, M. Evaluation of yield and physiological attributes of high-yielding rice varieties under aerobic and flood-irrigated management practices in mid-hills ecosystem. Agric. Water Manag. 2010, 97, 1269–1276. [Google Scholar] [CrossRef]
  2. Xiong, J.; Ding, C.Q.; Bin Wei, G.; Ding, Y.F.; Wang, S.H. Characteristic of Dry-Matter Accumulation and Nitrogen-Uptake of Super-High-Yielding Early Rice in China. Agron. J. 2013, 105, 1142–1150. [Google Scholar] [CrossRef]
  3. Peng, S.; Tang, Q.; Zou, Y. Current Status and Challenges of Rice Production in China. Plant Prod. Sci. 2009, 12, 3–8. [Google Scholar] [CrossRef] [Green Version]
  4. Food and Agriculture Organization (FAO). Agricultural production 2014; FAO: Rome, Italy, 2014. [Google Scholar]
  5. Zhao, M.; Tian, Y.; Ma, Y.; Zhang, M.; Yao, Y.; Xiong, Z.; Yin, B.; Zhu, Z. Mitigating gaseous nitrogen emissions intensity from a Chinese rice cropping system through an improved management practice aimed to close the yield gap. Agric. Ecosyst. Environ. 2015, 203, 36–45. [Google Scholar] [CrossRef]
  6. Grassini, P.; Eskridge, K.M.; Cassman, K.G. Distinguishing between yield advances and yield plateaus in historical crop production trends. Nat. Commun. 2013, 4, 2918. [Google Scholar] [CrossRef]
  7. Ju, X.T.; Xing, G.X.; Chen, X.P.; Zhang, S.L.; Zhang, L.J.; Liu, X.J.; Cui, Z.L.; Yin, B.; Christie, P.; Zhu, Z.-L.; et al. Reducing environmental risk by improving N management in intensive Chinese agricultural systems. Proc. Natl. Acad. Sci. USA 2009, 106, 3041–3046. [Google Scholar] [CrossRef] [Green Version]
  8. Liu, Y.; Pan, X.; Li, J. A 1961–2010 record of fertilizer use, pesticide application and cereal yields: A review. Agron. Sustain. Dev. 2014, 35, 83–93. [Google Scholar] [CrossRef]
  9. Zeng, J.; Liu, X.; Song, L.; Lin, X.; Zhang, H.; Shen, C.; Chu, H. Nitrogen fertilization directly affects soil bacterial diversity and indirectly affects bacterial community composition. Soil Boil. Biochem. 2016, 92, 41–49. [Google Scholar] [CrossRef]
  10. Guo, J.H.; Liu, X.J.; Zhang, Y.; Shen, J.L.; Han, W.X.; Zhang, W.F.; Christie, P.; Goulding, K.W.T.; Vitousek, P.M.; Zhang, F.S. Significant Acidification in Major Chinese Croplands. Science 2010, 327, 1008–1010. [Google Scholar] [CrossRef] [Green Version]
  11. Zhong, Y.; Yan, W.; Shangguan, Z. Impact of long-term N additions upon coupling between soil microbial community structure and activity, and nutrient-use efficiencies. Soil Boil. Biochem. 2015, 91, 151–159. [Google Scholar] [CrossRef]
  12. Touchton, J.; Rickerl, D.; Walker, R.; Snipes, C. Winter legumes as a nitrogen source for no-tillage cotton. Soil Tillage Res. 1984, 4, 391–401. [Google Scholar] [CrossRef]
  13. Postgate, J.R. Biological Nitrogen Fixation. Nature 1970, 226, 25–27. [Google Scholar] [CrossRef] [PubMed]
  14. Drinkwater, L.E.; Wagoner, P.; Sarrantonio, M. Legume-based cropping systems have reduced carbon and nitrogen losses. Nature 1998, 396, 262–265. [Google Scholar] [CrossRef]
  15. Geisseler, D.; Scow, K.M. Long-term effects of mineral fertilizers on soil microorganisms—A review. Soil Boil. Biochem. 2014, 75, 54–63. [Google Scholar] [CrossRef]
  16. Li, C.; Yan, K.; Tang, L.; Jia, Z.; Li, Y. Change in deep soil microbial communities due to long-term fertilization. Soil Boil. Biochem. 2014, 75, 264–272. [Google Scholar] [CrossRef]
  17. Crews, T.; Peoples, M. Legume versus fertilizer sources of nitrogen: ecological tradeoffs and human needs. Agric. Ecosyst. Environ. 2004, 102, 279–297. [Google Scholar] [CrossRef]
  18. Voisin, A.S.; Guéguen, J.; Huyghe, C.; Jeuffroy, M.H.; Magrini, M.B.; Meynard, J.M.; Mougel, C.; Pellerin, S.; Pelzer, E. Legumes for feed, food, biomaterials and bioenergy in Europe: a review. Agron. Sustain. Dev. 2014, 34, 361–380. [Google Scholar] [CrossRef]
  19. Li, P.; Lu, J.; Wang, Y.; Wang, S.; Hussain, S.; Ren, T.; Cong, R.; Li, X. Nitrogen losses, use efficiency, and productivity of early rice under controlled-release urea. Agric. Ecosyst. Environ. 2018, 251, 78–87. [Google Scholar] [CrossRef]
  20. Tian, S.; Ning, T.; Wang, Y.; Liu, Z.; Li, G.; Li, Z.; Lal, R. Crop yield and soil carbon responses to tillage method changes in North China. Soil Tillage Res. 2016, 163, 207–213. [Google Scholar] [CrossRef]
  21. Cai, Z.; Wang, B.; Xu, M.; Zhang, H.; He, X.; Zhang, L.; Gao, S. Intensified soil acidification from chemical N fertilization and prevention by manure in an 18-year field experiment in the red soil of southern China. J. Soils Sediments 2015, 15, 260–270. [Google Scholar] [CrossRef]
  22. Zhang, W.; Xu, M.; Wang, X.; Huang, Q.; Nie, J.; Li, Z.; Li, S.; Hwang, S.W.; Lee, K.B. Effects of organic amendments on soil carbon sequestration in paddy fields of subtropical China. J. Soils Sediments 2012, 12, 457–470. [Google Scholar] [CrossRef]
  23. Yao, Z.; Zhang, D.; Yao, P.; Zhao, N.; Liu, N.; Zhai, B.; Zhang, S.; Li, Y. Science of the Total Environment Coupling life-cycle assessment and the RothC model to estimate the carbon footprint of green manure-based wheat production in China. Sci. Total Environ. 2017, 607–608, 433–442. [Google Scholar] [CrossRef] [PubMed]
  24. McDaniel, M.D.; Tiemann, L.K.; Grandy, A.S. Does agricultural crop diversity enhance soil microbial biomass and organic matter dynamics? A meta-analysis. Ecol. Appl. 2014, 24, 560–570. [Google Scholar] [CrossRef] [PubMed] [Green Version]
  25. Benbi, D.K.; Toor, A.S.; Kumar, S. Management of organic amendments in rice-wheat cropping system determines the pool where carbon is sequestered. Plant Soil 2012, 360, 145–162. [Google Scholar] [CrossRef]
  26. Bedada, W.; Karltun, E.; Lemenih, M.; Tolera, M. Long-term addition of compost and NP fertilizer increases crop yield and improves soil quality in experiments on smallholder farms. Agric. Ecosyst. Environ. 2014, 195, 193–201. [Google Scholar] [CrossRef]
  27. Bedini, S.; Avio, L.; Sbrana, C.; Turrini, A.; Migliorini, P.; Vazzana, C.; Giovannetti, M. Mycorrhizal activity and diversity in a long-term organic Mediterranean agroecosystem. Boil. Fertil. Soils 2013, 49, 781–790. [Google Scholar] [CrossRef]
  28. Mohanty, S.; Nayak, A.; Kumar, A.; Tripathi, R.; Shahid, M.; Bhattacharyya, P.; Raja, R.; Panda, B.; Shahid, D.M. Carbon and nitrogen mineralization kinetics in soil of rice–rice system under long term application of chemical fertilizers and farmyard manure. Eur. J. Soil Boil. 2013, 58, 113–121. [Google Scholar] [CrossRef]
  29. Kumar, S.; Patra, A.K.; Singh, D.; Purakayastha, T.J. Long-Term Chemical Fertilization Along with Farmyard Manure Enhances Resistance and Resilience of Soil Microbial Activity against Heat Stress. J. Agron. Crop Sci. 2014, 200, 156–162. [Google Scholar] [CrossRef]
  30. Dawe, D.; Dobermann, A.; Ladha, J.; Yadav, R.; Bao, L.; Gupta, R.; Lal, P.; Panaullah, G.; Sariam, O.; Singh, Y.; et al. Do organic amendments improve yield trends and profitability in intensive rice systems? Field Crop. Res. 2003, 83, 191–213. [Google Scholar] [CrossRef]
  31. Thorup-Kristensen, K.; Dresbøll, D.B.; Kristensen, H.L. Crop yield, root growth, and nutrient dynamics in a conventional and three organic cropping systems with different levels of external inputs and N re-cycling through fertility building crops. Eur. J. Agron. 2012, 37, 66–82. [Google Scholar] [CrossRef] [Green Version]
  32. Yadav, R.; Dwivedi, B.; Prasad, K.; Tomar, O.; Shurpali, N.; Pandey, P.; Shurpali, N. Yield trends, and changes in soil organic-C and available NPK in a long-term rice–wheat system under integrated use of manures and fertilisers. Field Crop. Res. 2000, 68, 219–246. [Google Scholar] [CrossRef]
  33. Zhao, X.; Wang, S.; Xing, G. Maintaining rice yield and reducing N pollution by substituting winter legume for wheat in a heavily-fertilized rice-based cropping system of southeast China. Agric. Ecosyst. Environ. 2015, 202, 79–89. [Google Scholar] [CrossRef]
  34. Baxter, S. World Reference Base for Soil Resources. World Soil Resources Report 103. Rome: Food and Agriculture Organization of the United Nations (2006), pp. 132, US$22.00 (paperback). ISBN 92-5-10511-4. Exp. Agric. 2007, 43, 264. [Google Scholar] [CrossRef]
  35. Jackson, M. Soil Chemical Analysis: Advanced Course; Parallel Press: Medison, WI, USA, 1969. [Google Scholar]
  36. Nelson, D.W.; Sommers, L. Total carbon, organic carbon, and organic matter. In Methods of Soil Analysis. Part 2. Chemical and Microbiological Properties; Soil Science Society of America Inc.: Madison, WI, USA, 1982; pp. 539–579. [Google Scholar]
  37. Pages, A.L.; Miller, R.H.; Dennis, R.K. Methods of Soil Analysis. Part 2 Chemical Methods; Soil Science Society of America Inc.: Madison, WI, USA, 1982. [Google Scholar]
  38. Black, C.A. Methods of Soil Analysis Part II. Chemical and Microbiological Properties; American Society of Agriculture: Madison, WI, USA, 1965. [Google Scholar]
  39. Murphy, J.; Riley, J.P. A modified single solution method for the determination of phosphate in natural waters. Anal. Chim. Acta 1964, 27, 31–36. [Google Scholar] [CrossRef]
  40. Knudsen, D.; Peterson, G.A.; Pratt, P.F. Lithium sodium and potassium. In Methods of Soil Analysis Part II. Chemical and Microbiological Properties; Pages, A.L., Miller, R.H., Dennis, R.K., Eds.; American Society of Agronomy: Medison, WL, USA, 1982; pp. 225–246. [Google Scholar]
  41. Lu, R.K. Analytical Methods of Soil Agricultural Chemistry; China Agricultural Science and Technology Press: Beijing, China, 2000. [Google Scholar]
  42. Olsen, S.R. Estimation of Available Phosphorus in Soils by Extraction with Sodium Bicarbonate; US Government Printing Office: Washington, DC, USA, 1954.
  43. Głąb, T.; Kulig, B. Effect of mulch and tillage system on soil porosity under wheat (Triticum aestivum). Soil Tillage Res. 2008, 99, 169–178. [Google Scholar] [CrossRef]
  44. Kundu, S.; Bhattacharyya, R.; Prakash, V.; Ghosh, B.; Gupta, H. Carbon sequestration and relationship between carbon addition and storage under rainfed soybean–wheat rotation in a sandy loam soil of the Indian Himalayas. Soil Tillage Res. 2007, 92, 87–95. [Google Scholar] [CrossRef]
  45. Huang, J.; Zhang, Y.Z.; Gao, J.S.; Zhang, W.J.; Liu, A.J. Variation characteristics of soil carbon sequestration under long-term different fertilization in red paddy soil. Chin. J. Appl. Ecol. 2015, 26, 3373–3380. (In Chinese) [Google Scholar]
  46. De’Ath, G. Boosted trees for ecological modeling and prediction. Ecology 2007, 88, 243–251. [Google Scholar] [CrossRef]
  47. Pan, G.; Zhou, P.; Li, Z.; Smith, P.; Li, L.; Qiu, D.; Zhang, X.; Xu, X.; Shen, S.; Chen, X. Combined inorganic/organic fertilization enhances N efficiency and increases rice productivity through organic carbon accumulation in a rice paddy from the Tai Lake region, China. Agric. Ecosyst. Environ. 2009, 131, 274–280. [Google Scholar] [CrossRef]
  48. Tilman, D.; Balzer, C.; Hill, J.; Befort, B.L. Global food demand and the sustainable intensification of agriculture. Proc. Natl. Acad. Sci. USA 2011, 108, 20260–20264. [Google Scholar] [CrossRef] [Green Version]
  49. Yousaf, M.; Li, X.; Zhang, Z.; Ren, T.; Cong, R.; Ata-Ul-Karim, S.T.; Fahad, S.; Shah, A.N.; Lu, J. Nitrogen Fertilizer Management for Enhancing Crop Productivity and Nitrogen Use Efficiency in a Rice-Oilseed Rape Rotation System in China. Front. Plant Sci. 2016, 7, 1496. [Google Scholar] [CrossRef] [PubMed]
  50. Xie, Z.; Tu, S.; Shah, F.; Xu, C.; Chen, J.; Han, D.; Liu, G.; Li, H.; Muhammad, I.; Cao, W. Substitution of fertilizer-N by green manure improves the sustainability of yield in double-rice cropping system in south China. Field Crop. Res. 2016, 188, 142–149. [Google Scholar] [CrossRef] [Green Version]
  51. Liu, C.A.; Li, F.R.; Zhou, L.M.; Zhang, R.H.; Jia, Y.; Lin, S.L.; Wang, L.J.; Siddique, K.H.; Li, F.M. Effect of organic manure and fertilizer on soil water and crop yields in newly-built terraces with loess soils in a semi-arid environment. Agric. Water Manag. 2013, 117, 123–132. [Google Scholar] [CrossRef]
  52. Cai, A.; Xu, M.; Wang, B.; Zhang, W.; Liang, G.; Hou, E.; Luo, Y. Manure acts as a better fertilizer for increasing crop yields than synthetic fertilizer does by improving soil fertility. Soil Tillage Res. 2019, 189, 168–175. [Google Scholar] [CrossRef]
  53. Yadav, R.; Dwivedi, B.; Pandey, P. Rice-wheat cropping system: assessment of sustainability under green manuring and chemical fertilizer inputs. Field Crop. Res. 2000, 65, 15–30. [Google Scholar] [CrossRef]
  54. Guo, C.; Li, P.; Lu, J.; Ren, T.; Cong, R.; Li, X. Application of Controlled-release Urea in Rice: Reducing Environmental Risk while Increasing Grain Yield and Improving Nitrogen Use Efficiency. Commun. Soil Sci. Plant Anal. 2016, 47, 1176–1183. [Google Scholar] [CrossRef]
  55. Timsina, J.; Panaullah, G.M.; Saleque, M.A.; Ishaque, M.; Pathan, A.B.M.B.U.; Quayyum, M.A.; Connor, D.J.; Saha, P.K.; Humphreys, E.; Meisner, C.A. Nutrient Uptake and Apparent Balances for Rice-Wheat Sequences. I. Nitrogen. J. Plant Nutr. 2006, 29, 137–155. [Google Scholar] [CrossRef]
  56. Witt, C.; Cassman, K.; Olk, D.; Biker, U.; Liboon, S.; Samson, M.; Ottow, J. Crop rotation and residue management effects on carbon sequestration, nitrogen cycling and productivity of irrigated rice systems. Plant Soil 2000, 225, 263–278. [Google Scholar] [CrossRef]
  57. Singh, Y.; Singh, B.; Timsina, J. Crop Residue Management for Nutrient Cycling and Improving Soil Productivity in Rice-Based Cropping Systems in the Tropics. In Advances in Agronomy; Elsevier: Amsterdam, The Netherlands, 2005; Volume 85, pp. 269–407. [Google Scholar]
  58. Xu, J.; Han, H.; Ning, T.; Li, Z.; Lal, R. Long-term effects of tillage and straw management on soil organic carbon, crop yield, and yield stability in a wheat-maize system. Field Crop. Res. 2019, 233, 33–40. [Google Scholar] [CrossRef]
  59. Liang, X.Q.; Li, L.; Chen, Y.; Li, H.; Liu, J.; He, M.; Ye, Y.; Tian, G.; Lundy, M. Dissolved Phosphorus Losses by Lateral Seepage from Swine Manure Amendments for Organic Rice Production. Soil Sci. Soc. Am. J. 2013, 77, 765–773. [Google Scholar] [CrossRef]
  60. Salantur, A.; Ozturk, A.; Akten, S. Growth and yield response of spring wheat (Triticum aestivum L.) to inoculation with rhizobacteria. Plant Soil Environ. 2006, 52, 111–118. [Google Scholar] [CrossRef]
  61. An, N.; Wei, W.; Qiao, L.; Zhang, F.; Christie, P.; Jiang, R.; Dobermann, A.; Goulding, K.W.; Fan, J.; Fan, M. Agronomic and environmental causes of yield and nitrogen use efficiency gaps in Chinese rice farming systems. Eur. J. Agron. 2018, 93, 40–49. [Google Scholar] [CrossRef]
  62. Yan, X.; Gong, W. The role of chemical and organic fertilizers on yield, yield variability and carbon sequestration— results of a 19-year experiment. Plant Soil 2010, 331, 471–480. [Google Scholar] [CrossRef]
  63. Liu, Z.; Rong, Q.; Zhou, W.; Liang, G. Effects of inorganic and organic amendment on soil chemical properties, enzyme activities, microbial community and soil quality in yellow clayey soil. PLoS ONE 2017, 12, e0172767. [Google Scholar] [CrossRef]
  64. Khalil, M.I.; Hossain, M.; Schmidhalter, U. Carbon and nitrogen mineralization in different upland soils of the subtropics treated with organic materials. Soil Boil. Biochem. 2005, 37, 1507–1518. [Google Scholar] [CrossRef]
  65. Lin, H.; Jing, C.M.; Wang, J.H. The Influence of Long-Term Fertilization on Soil Acidification. Adv. Mater. Res. 2014, 955, 3552–3555. [Google Scholar] [CrossRef]
  66. Tan, D.S.; Jin, J.Y.; Huang, S.W.; Li, S.T.; He, P. Effect of Long-Term Application of K Fertilizer and Wheat Straw to Soil on Crop Yield and Soil K Under Different Planting Systems. Agric. Sci. China 2007, 6, 200–207. [Google Scholar]
  67. Takahashi, S.; Anwar, M.R. Wheat grain yield, phosphorus uptake and soil phosphorus fraction after 23 years of annual fertilizer application to an Andosol. Field Crop. Res. 2007, 101, 160–171. [Google Scholar] [CrossRef]
  68. McLellan, E.L.; Cassman, K.G.; Eagle, A.J.; Woodbury, P.B.; Sela, S.; Tonitto, C.; Marjerison, R.D.; Van Es, H.M. The Nitrogen Balancing Act: Tracking the Environmental Performance of Food Production. Bioscience 2018, 68, 194–203. [Google Scholar]
  69. Snyder, C.; Davidson, E.; Smith, P.; Venterea, R. Agriculture: sustainable crop and animal production to help mitigate nitrous oxide emissions. Curr. Opin. Environ. Sustain. 2014, 9, 46–54. [Google Scholar] [CrossRef]
  70. Chen, C.; Lawes, R.; Fletcher, A.; Oliver, Y.; Robertson, M.; Bell, M.; Wang, E. How well can APSIM simulate nitrogen uptake and nitrogen fixation of legume crops? Field Crops Res. 2016, 187, 35–48. [Google Scholar] [CrossRef]
  71. Zhang, D.; Yao, P.; Zhao, N.; Cao, W.; Zhang, S.; Li, Y.; Huang, D.; Zhai, B.; Wang, Z.; Gao, Y. Building up the soil carbon pool via the cultivation of green manure crops in the Loess Plateau of China. Geoderma 2019, 337, 425–433. [Google Scholar] [CrossRef]
  72. Zhu, Q.; Liu, X.; Hao, T.; Zeng, M.; Shen, J.; Zhang, F.; Vries, W. De Modeling soil acidi fi cation in typical Chinese cropping systems. Sci. Total Environ. 2018, 613–614, 1339–1348. [Google Scholar] [CrossRef] [PubMed]
  73. Tang, C.; Conyers, K.M.; Nuruzzaman, M.; Poile, G.J.; Liu, D.L. Biological amelioration of subsoil acidity through managing nitrate uptake by wheat crops. Plant Soil 2011, 338, 383–397. [Google Scholar] [CrossRef]
  74. Stevens, C.J.; Dise, N.B.; Gowing, D.J. Regional trends in soil acidification and exchangeable metal concentrations in relation to acid deposition rates. Environ. Pollut. 2009, 157, 313–319. [Google Scholar] [CrossRef] [PubMed] [Green Version]
  75. Rukshana, F.; Butterly, C.R.; Xu, J.M.; Baldock, J.A.; Tang, C. Organic anion-to-acid ratio influences pH change of soils differing in initial pH. J. Soils Sediments 2013, 14, 407–414. [Google Scholar] [CrossRef]
  76. Sainju, U.M.; Singh, H.P.; Singh, B.P. Soil Carbon and Nitrogen in Response to Perennial Bioenergy Grass, Cover Crop and Nitrogen Fertilization. Pedosphere 2017, 27, 223–235. [Google Scholar] [CrossRef]
  77. Liang, Z.; Elsgaard, L.; Nicolaisen, M.H.; Lyhne-Kjærbye, A.; Olesen, J.E. Carbon mineralization and microbial activity in agricultural topsoil and subsoil as regulated by root nitrogen and recalcitrant carbon concentrations. Plant Soil 2018, 433, 65–82. [Google Scholar] [CrossRef] [Green Version]
  78. Yang, J.; Gao, W.; Ren, S. Long-term effects of combined application of chemical nitrogen with organic materials on crop yields, soil organic carbon and total nitrogen in fluvo-aquic soil. Soil Tillage Res. 2015, 151, 67–74. [Google Scholar] [CrossRef]
  79. Gál, A.; Vyn, T.J.; Michéli, E.; Kladivko, E.J.; McFee, W.W. Soil carbon and nitrogen accumulation with long-term no-till versus moldboard plowing overestimated with tilled-zone sampling depths. Soil Tillage Res. 2007, 96, 42–51. [Google Scholar] [CrossRef]
  80. Tong, C.; Xiao, H.; Tang, G.; Wang, H.; Huang, T.; Xia, H.; Keith, S.J.; Li, Y.; Liu, S.; Wu, J. Long-term fertilizer effects on organic carbon and total nitrogen and coupling relationships of C and N in paddy soils in subtropical China. Soil Tillage Res. 2009, 106, 8–14. [Google Scholar] [CrossRef]
Figure 1. Effect of long-term substitution of nitrogen (N) fertilizer by green manure on early rice yield (a) and late rice yield (b) in paddy soil.
Agronomy 09 00609 g001
Figure 2. Yield variation in early and late rice yield under long-term substitution of inorganic N fertilizer by green manure in rice-based cropping system. Different small letters over the bars represent the significant (p ≤ 0.05) difference among different treatments according to Tukey’s HSD test.
Agronomy 09 00609 g002
Figure 3. Changes in soil organic carbon (SOC) content under long-term substitution of inorganic N fertilizer by green manure in rice-based cropping system.
Agronomy 09 00609 g003
Figure 4. Linear relationship of annual soil carbon input with annual soil carbon stock under long-term substitution of inorganic N fertilizer by green manure in rice-based cropping system.
Agronomy 09 00609 g004
Figure 5. Linear relationship of annual soil carbon stock with annual rice yield under long-term substitution of inorganic N fertilizer by green manure in rice-based cropping system.
Agronomy 09 00609 g005
Figure 6. Relative influence (%) of different predictors on relative crop yield by boosted regression tree model.
Agronomy 09 00609 g006
Table 1. Treatments and annual fertilization input rates for early and late rice in rice-based cropping system.
TreatmentsCropping SystemEarly RiceLate Rice
NPKNPK
N0Rice-rice rotation0.0039.275.00.0019.493.4
N100Rice-rice rotation15039.275.0172.519.493.4
N100-MRice-rice-milkvetch rotation15039.275.0172.519.493.4
N80-MRice-rice-Milkvetch rotation12039.275.0138.019.493.4
N60-MRice-rice-Milkvetch rotation90.039.275.0103.519.493.4
MRice-rice-Milkvetch rotation0.0039.275.00.0019.493.4
Note: N0, no nitrogen fertilizer; N100, recommended rate of N fertilizer; N100-M, recommended rate of nitrogen fertilizer plus green manure; N80-M, 80% of recommended rate of N fertilizer plus green manure; N60-M, 60% of recommended rate of N fertilizer and green manure; and M, milkvetch as green manure. The milkvetch after harvest freshly incorporated to the soil during soil preparation for before early rice transplantation.
Table 2. Annual crop yield, N uptake, balance, and recovery efficiency (NRE) in long-term experiment under rice-based cropping system.
YearTreatmentsCrop Yield
(t ha−1)
N Uptake
(kg ha−1 year−1)
N Balance
(kg ha−1 year−1)
NRE (%)
2009–2013N07.40 ± 0.03 e127 ± 2.35 e−127 ± 2.4 e
N10010.3 ± 0.04 c158 ± 1.01 d165 ± 1.0 a15.5 ± 1.9 d
N100-M11.8 ± 0.15 a230 ± 3.11 a92.9 ± 3.1 b42.0 ± 0.6 b
N80-M11.8 ± 0.14 a233 ± 0.94 a24.6 ± 0.9 c45.5 ± 1.3 a
N60-M10.7 ± 0.04 b194 ± 1.47 b−0.7 ± 1.5 d34.5 ± 1.2 c
M9.60 ± 0.11 d168 ± 1.33 c−168 ± 1.3 f
2014–2018N06.50 ± 0.14 e95.0 ± 2.64 f−95.1 ± 2.64 e
N10010.1 ± 0.09 c141 ± 3.58 e181 ± 3.58 a26.7 ± 0.4 d
N100-M11.8 ± 0.15 a201 ± 1.50 b121 ± 1.50 b49.9 ± 1.5 b
N80-M12.0 ± 0.18 a235 ± 1.70 a23.2 ± 1.70 c57.8 ± 1.1 a
N60-M10.8 ± 0.06 b184 ±1.91 c9.34 ± 1.91 d45.1 ± 0.7 c
M9.20 ± 0.11 d164 ± 3.39 d−164 ± 3.39 f
Values are means ± standard deviations. Means followed by different letters are significantly (p ≤ 0.05) different from each other according to Tukey’s HSD test.
Table 3. Changes in soil nutrient contents, C input and carbon sequestration rate long-term experiment of paddy soil.
YearTreatmentspHTN
(g kg−1)
AN
(mg kg−1)
TP
(g kg−1)
AP
(mg kg−1)
TK
(g kg−1)
AK
(mg kg−1)
C Input
(t ha−1 y−1)
C:N Ratio
Initial values 6.4 ± 0.061.57 ± 0.01110 ± 3.40.89 ± 0.0324 ± 3.88.9 ± 0.6741 ± 1.43-10.0
2009–2013N06.23 ± 0.003 de1.62 ± 0.004 c116 ± 3.5 c0.85 ± 0.01 d31.7 ± 0.85 d8.9 ± 0.53 b43.8 ±2.17 d1.79 ± 0.02 e10.78 ± 0.22 ns
N1006.15 ± 0.06 e1.64 ± 0.013 abc122 ± 0.6 b0.97 ± 0.02 b30.4 ± 0.51 d13.5 ± 0.67 a58.5 ± 1.34 c2.34 ± 0.02 d10.85 ± 0.16
N100-M6.30 ± 0.02 cd1.67 ± 0.009 a128 ± 0.7 a1.00 ± 0.01 b40.2 ± 0.49 a13.8 ± 0.38 a70.1 ±0.95 a3.88 ± 0.04 a10.33 ± 0.15
N80-M6.32 ± 0.02 bc1.67 ± 0.014 ab127 ± 0.2 a1.08 ± 0.01 a37.1 ± 0.50 b14.1 ± 0.44 a69.4 ± 2.11 a3.95 ± 0.05 a10.31 ± 0.39
N60-M6.45 ± 0.02 a1.64 ± 0.003 bc115 ± 1.2 c1.01 ± 0.01 b35.0 ± 0.99 c13.5 ± 0.75 a66.5 ± 1.08 ab3.71 ± 0.09 b10.92 ± 0.21
M6.39 ± 0.03 ab1.65 ± 0.023 abc120 ± 0.6 b0.93 ± 0.02 c32.2 ± 0.55 d12.3 ± 0.92 a64.9 ±1.47 b3.41 ± 0.05 c10.35 ± 0.24
2014-2018N06.02 ± 0.01 d1.39 ± 0.027 d87 ± 3.9 d0.83 ± 0.01 d28.6 ± 0.84 c7.60 ± 0.16 c43.5 ± 1.41 c1.58 ± 0.03 e13.98 ± 0.77 a
N1006.16 ± 0.09 cd1.60 ± 0.016 c91 ± 2.1 d1.08 ± 0.01 c30.4 ± 0.46 c10.7 ± 1.18 b53.2 ± 1.03 b2.15 ± 0.03 d11.61 ± 1.06 b
N100-M6.28 ± 0.05 c1.7 ± 0.007 a145 ± 0.8 a1.13 ± 0.03 a37.7 ± 0.39 a14.6 ± 0.65 a 71.5 ± 1.16 a3.84 ± 0.03 b11.42 ± 0.55 b
N80-M6.52 ± 0.12 b1.7 ± 0.008 a128 ± 1.2 b1.129 ± 0.01 ab36.8 ± 0.22 a14.8 ± 0.43 a72.0 ± 0.65 a4.00 ± 0.06 a11.67 ± 0.75 b
N60-M6.54 ± 0.03 b1.64 ± 0.006 b121 ± 0.8 c1.078 ± 0.02 bc33.5 ± 1.11 b14.1 ± 0.32 a71.8 ± 1.82 a3.72 ± 0.04 b12.43 ± 0.42 ab
M6.86 ± 0.06 a1.70 ± 0.009 a129 ± 1.1 b1.12 ± 0.01 abc29.6 ± 1.04 c13.4 ± 1.14 a69.4 ± 1.46 a3.19 ± 0.09 c11.43 ± 0.12 b
Values are means ± standard deviations. Means followed by different letters are significantly (p ≤ 0.05) different from each other according to Tukey’s HSD test. Note: TN, total nitrogen; AN, available nitrogen; TP, total phosphorus; AP, available phosphorus; TK, total potassium; AK, available potassium.

