Abstract
Heat waves (HWs), characterized by periods of unusually high temperature, would inevitably affect the soil microenvironment and then soil respiration (Rs), which is considered to be the most active part of the global carbon cycle. An in situ spring and summer HWs simulation experiment combined with a locally common human disturbance (mowing) was conducted to separate Rs into autotrophic respiration (Ra) and heterotrophic respiration (Rh) on a natural Eurasian meadow steppe in 2018 and 2019. HWs significantly affected grassland Rs, Rh and Ra (p < 0.01) and also interacted with mowing, but the effect of spring HW and summer HW were different. During the summer HWs, daily Rs of the non-mowed plots increased by 1.07 μmol m−2 s−1 (11.71%) and increased in the mowed plots by 2.15 μmol m−2 s−1 (23.81%). During the spring HWs, daily Rs of the non-mowed plots decreased by 0.13 μmol m−2 s−1 (2.36%) and decreased by 0.52 μmol m−2 s−1 (9.02%) in the mowed plots. Rs, Rh and Ra were inhibited by spring HWs, but promoted by summer HWs. Our results indicated that the occurring time change in HWs would cause widely divergent influences on the ecosystem, and mowing would decrease the anti-interference ability of the ecosystem, which acted as an enhancement on both the positive and negative effects of HWs. These findings have important implications for accurate model prediction and carbon budget assessment.
1. Introduction
Under the continuous influence of natural processes and human activities, the frequency and intensity of heat waves (HWs) were increased, and the duration of HWs promoted. As a typical extreme climate against the background of global warming, HWs have attracted more and more attention from the scientific community [1,2,3]. The main reason is that although HWs occur for a short time, its effects are not temporary; it exerts a significant impact on the natural ecosystem, regional economy and human health [4,5,6,7]. For example, a 10-day long HW in Europe reduced the net primary productivity of the ecosystem by 30%, and there was a 5-year legacy effect [8]. Studies on typical grasslands have also shown that HWs significantly decreased the net ecosystem exchange (NEE) of CO2, ecosystem respiration (ER) and gross ecosystem productivity (GEP) by 31%, 5% and 16%, respectively [6]. The impact of HWs on NEE was much greater than that on ER, with a gap of up to six times; the hypothesis was that (1) ER had multiple sources, such as plant respiration and soil respiration (Rs) [9]; (2) the increase in litter in areas where HWs occurred might promote Rs in the ecosystem [10,11], but this hypothesis still lacks direct evidence.
It is also necessary to consider time when the HWs occurred [3,12]. Historical data of different Inner Mongolia grasslands showed the increasing frequency of HWs and also indicated an advancing trend in which the HW occurrence time changed from July to June [6]. HWs occurring at different times and their impact intensity and mechanisms would be different due to the different hydrothermal conditions and plant growth stages [4]. In addition to the different effects of the HW periods, compared with the common HWs at a later time, the HWs affected the plants for a longer time in the year, and the medium- and long-term effects (i.e., the legacy effect of the HWs) would be coupled to the subsequent environment conditions, which had a more profound impact on vegetation [13]. Studies on HWs found that spring HWs were beneficial to alleviate the damage of summer drought to plants. The carbon budget was that the increased carbon absorption of spring HWs offset the decrease in carbon absorption caused by summer droughts, and the ecosystem still acted as a carbon sink in the drought year [3]. However, such a conclusion was controversial; if the spring HWs could offset part of the destructive effects of the summer drought and increase the carbon absorption of the ecosystem, it indicated that the spring HWs were beneficial to plant growth. But more plants also carried a higher consumption of soil water resources to the increasing of evapotranspiration, thereby magnifying the damage of the summer drought [14]. Moreover, the earlier HWs would increase carbon absorption, and such results were contrary to most previous conclusions that HWs led to a decline in carbon absorption. Previous studies proved that the long-term legacy of a heat wave one year after the occurrence reduced carbon absorption capacity by 38% [6]. Therefore, in this study, we simulated different HWs occurring at different times to verify and explore such contradictory conclusions and their potential mechanism.
Rs refers to all the metabolic processes that produce CO2 in the undisturbed soil. It includes three biological processes: soil microbial respiration, root respiration, and soil animal respiration; and one non-biological process, which is the chemical oxidation of carbonaceous minerals: the contribution of this process to Rs was very small, usually negligible, of which roots and microorganisms had the greatest impact on Rs [15]. As the second-largest carbon flux, Rs was the most active part of the global carbon cycle. Very small changes in the frequency or severity of HWs might also greatly increase Rs, thereby reducing carbon sinks, and might have huge implications on global warming [16,17]. It was found that HWs on wetlands, when combined with drought, had almost no effect on Rs [18]. Against the background of frequent HWs caused by global warming, the increase in frequency of HWs (currently common summer HWs in the middle and late summer, and spring HWs in spring and early summer) would undoubtedly affect the changes in soil carbon pools. At present, the degree and mechanism of influence on Rs and its components (i.e., autotrophic respiration (Ra) and heterotrophic respiration (Rh)) are still unclear. A comparative study on the transition and sustained effects of spring and summer HWs in autotrophic and heterotrophic respiration is needed.
The Inner Mongolia grassland was an important part of the Eurasian grassland. The region has been affected by climate change and human activities for decades, which has caused great changes in land use patterns and vegetation coverage. These changes were bound to have a huge impact on the regional carbon cycle, and as an important driving process of climate change, they had an effect on the structure and function of the grassland ecosystem [6,19,20]. In the past 20 years, with the implementation of the national “returning grazing to grass” project, the traditional free grazing was replaced by shed-raising and half-living livestock raising methods, and mowing became the most important way of using grassland and carrying out human activities in Inner Mongolia. In addition to its impact on the biological processes of grassland ecosystems, mowing had a particularly significant impact on vegetation structure and coverage patterns and might reduce the ability to cope with extreme climates. A study on the effects of HWs combined with mowing on the typical steppe ecosystem carried out in Inner Mongolia in 2012–2014 showed that HWs had a significant impact on reducing the stability of the ecosystem and the tolerance to climate change [21].
An in situ HW simulation experiment was conducted on a natural meadow grassland in Inner Mongolia, combined with a local human disturbance (mowing) to systematically study the occurrence of HWs in different periods (spring HWs, summer HWs) and the short-, medium-, and long-term effects of mowing and its interaction on Rs. The aims are (1) assess the impact of HWs (spring and summer HWs) on meadow grassland Rs and partitioning (Rh and Ra); (2) assess the effect of mowing on Rs and the interaction with HWs; (3) quantify the short-, medium-, and long-term effects of the advancement of HWs on Rs (i.e., instantaneous, post-mortem and residual effects). We hypothesized that spring HWs have a greater impact on meadow grassland Rs than summer HWs, and their effects are significantly different when combined with mowing.
2. Materials and Methods
2.1. Experimental Site
This research work was carried out in the experimental plot of the Hulunbuir National Research Station of the Chinese Academy of Agricultural Sciences (49°23′13″ N, 120°02′47″ E). It is the most concentrated and most representative of temperate meadow grasslands in China. The region belongs to a mid-temperate semi-arid continental climate, with an altitude of 627~635 m, an average annual temperature of 2.4 °C, an annual accumulated temperature of 1580~1800 °C, and a frost-free period of 110 days. The long-term average annual precipitation is around 380–400 mm, mostly in July to September. The vegetation type is a meadow grassland Leymus chinensis community. The sub-dominant species include Stipa baicalensis, Thalictrum squarrosum, Carex duriuscula, etc. The soil type is dark chestnut soil. The 0–10 cm soil pH value is 6.41 ± 0.36, soil organic carbon 3.39 ± 0.57 g kg−1, total nitrogen 3.52 ± 0.55 g kg−1, and total phosphorus 0.40 ± 0.14 g kg−1. The daily maximum temperature data of the Hulunbuir League Hailar Meteorological Station in the past 40 years (1978–2017, data source: China Meteorological Data Network http://data.cma.cn/site/index.html, accessed on 10 January 2019) is used to determine the time of the HWs and occurrence intensity.
2.2. Experimental Design
The specific experimental design included two factors: HWs and mowing. HWs were divided into three levels: heat wave in advance of occurrence time (spring HWs), heat wave did not occur in advance (summer HWs), and no HWs. There were 2 levels: mowing and without mowing; in total, 6 treatments were included, namely, spring heat wave mowing (HWsp × M), summer heat wave mowing (HWsu × M), spring heat wave without mowing (HWsp), summer heat wave without mowing (HWsu), no heat wave mowing (M), and no heat wave and no mowing (Control). Each treatment was repeated 4 times, for a total of 24 plots. Each plot area was 2 m × 2 m with a buffer zone of 2 m between any two adjacent plots (Figure 1).
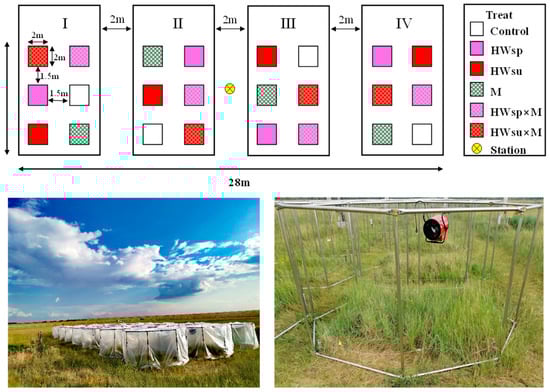
Figure 1.
Field layout of interactive experiments on HWs with mowing and warming devices for HWs experiment (6 treatments, namely, spring heat wave mowing (HWsp × M), summer heat wave mowing (HWsu × M), spring heat wave without mowing (HWsp), summer heat wave without mowing (HWsu), no heat wave mowing (M), and no heat wave and no mowing (Control); each treatment was repeated 4 times).
2.3. HWs and Mowing Treatment
In order to simulate the HWs effect, that is, asymmetric day and night temperature increase, an OTC (open-top chamber) with a heater was set up to simulate the HWs event (Figure 1). The test box was composed of 24 hollow steel pipes, each with a 2 m diameter and a 1.5 m height [6]. During the experiment, it was covered with transparent plastic cloth and a heater was hung in the heating box to increase the temperature. The plastic cloth was made of highly transparent polyvinyl chloride (PVC) plastic cloth, with the film light transmittance > 90%. The air temperature could be raised to ~10 °C during the day and ~4 °C at night. The heating period was selected in fully sunny days [22]. After calculation (Table 1), the summer HWs experiment started from 10 to 14 August 2018, and the spring HWs experiment started from 8 to 13 July 2019, with continuous heating over five days, and the second summer HWs experiment started from 2 to 5 August of the same year.

Table 1.
Statistics of 40-year heat waves in the Hailar steppe on the Mongolian Plateau from 1978 to 2017 (10-year interval).
A light lawn mower (Yard-man 160CC, USA) was used for mowing to simulate the local mowing or grazing treatment. The height of mowing stubble was 5~8 cm, which is commonly used in management. In 2018, the mowing process was carried out on 30 July. In 2019, the mowing process was carried out on 20 August.
2.4. Rs, Ts and SWC Measurement
In order to distinguish between Ra and Rh, two Rs ring bases were arranged in the middle of each plot half a month in advance, for a total of 48 bases. The base was a polypropylene ring with a diameter of 10.5 cm. The heights of the two bases were 5 cm and 20 cm, and the ground was 3 cm. At the same time, the plants in the base were evenly mowed.
Measuring Rs used the LI-8100A soil carbon flux automatic measurement system (Li-Cor Inc., Lincoln, NE, USA). The temperature and humidity sensors (10 cm in length) were connected through the auxiliary sensor port on the LI-8100A soil carbon flux automatic measurement system. A LI-8100-102 soil breathing chamber with an inner diameter of 10.3 cm was buckled on the base to measure Rs. At the same time, the temperature and humidity sensor measured Ts and SWC. Rs, Ts and SWC were measured once before heating, each day during heating, and at 1, 2, 3, 4, 5, 6, 7, 8, and 15 days after heating, fixed at 9:00–11:00 in the morning or 2:00–4:00 in the afternoon.
2.5. Biomass Measurement (Above and Underground)
Before mowing in 2018 and 2019, we used a 0.5 m × 0.5 m sample box to sample in a clockwise order at the same site in each plot, separated the green leaves from the dead stand, dried them at 65 °C (more than 48 h) until constant, and weighed them to estimate the peak value of ANPP. After the end of the HWs experiment in 2018 and 2019, a root drill was used to collect the underground soil samples of each plot, divided into five layers (0–10 cm, 10–20 cm, 20–30 cm, 30–40 cm, 40–50 cm), and the roots were washed. After drying to constant weight, it was weighed to estimate the peak BNPP.
2.6. Statistical Analysis
We used SPSS 23.0 for statistical analysis (repeated-measures ANOVA, post hoc tests), and SigmaPlot 12.5 for drawing analysis. And we analyzed the correlations between Ts, SWC and Rs, Rh, Ra, and analyzed the correlations between ANPP, BNPP and Ra.
3. Results
3.1. Changes in HWs on Rs and Its Components
The differences in Rs, Rh and Ra between the six different treatments were significant (p < 0.01), showing that summer HWs increased Rs while spring HWs decreased Rs. During the summer HWs, the Rs of the mowed and non-mowed plots increased overall, and the Rs of the non-mowed plots increased by 1.07 μmol m−2 s−1 (11.71%) per day on average. The Rs of the mowed plots increased 2.15 μmol m−2 s−1 (23.81%), which was 1.03 times higher than that of non-mowed plots. During the spring HWs, the Rs of the mowed and non-mowed plots decreased, and the Rs of the non-mowed plots decreased by 0.13 μmol m−2 s−1 (2.36%) on average. The Rs of the mowed plots decreased to 0.52 μmol m−2 s−1 (9.02%), which was 2.83 times that of the non-mowed plots.
HWs had different effects on the Ra of mowed and non-mowed plots, with the summer HWs increasing non-mowed Ra, while spring HWs decreased both mowed and non-mowed Ra. The first summer HWs reduced the Ra of the mowed and non-mowed plots, and the Ra of the non-mowed plots decreased by 0.75 μmol m−2 s−1 (16.03%) on average, but the Ra of the mowed plots increased by 0.59 μmol m−2 s−1 (16.48%). Different from the first summer HWs, the second summer HWs increased the Ra of the mowed and non-mowed plots, and the Ra of the non-mowed plot increased by 1.34 μmol m−2 s−1 (38.84%) on average, but the Ra of the mowed plot increased by 2.53 μmol m−2 s−1 (79.98%), which was an increase of 1.06 times compared with that of the non-mowed plot. The spring HWs reduced the Ra of the mowed and non-mowed plots. The Ra of the non-mowed plots decreased by 0.22 μmol m−2 s−1 (12.28%) on average, but the Ra of the mowed plots decreased by 0.50 μmol m−2 s−1 (23.87%), which was 0.94 times that of the non-mowed plots.
The first summer HWs increased while the second one decreased the Rh at both the mowed and non-mowed plots, while the spring HWs showed a convergent response to the mowed and non-mowed plots. The Rh of the non-mowed plots increased by 1.71 μmol m−2 s−1 (30.92%) on average, and the Rh of the mowed plots increased by 1.00 μmol m−2 s−1 (16.05%). On the contrary, the second summer HWs reduced the Rh at both the mowed and non-mowed plots. The Rh of the non-mowed plots decreased by 0.17 μmol m−2 s−1 (3.45%) on average, but the Rh of the mowed plots increased by 0.18 μmol m−2 s−1 (3.26%), and the result was completely different than that of the mowed plots. The spring HWs made the Rh of the mowed and non-mowed plots increase and decrease, and the Rh of the non-mowed plots increased by 0.09 μmol m−2 s−1 (2.20%) on average, but the Rh of the mowed plots only decreased 0.02 μmol m−2 s−1 (0.52%); the difference was not obvious (Figure 2 and Figure 3).
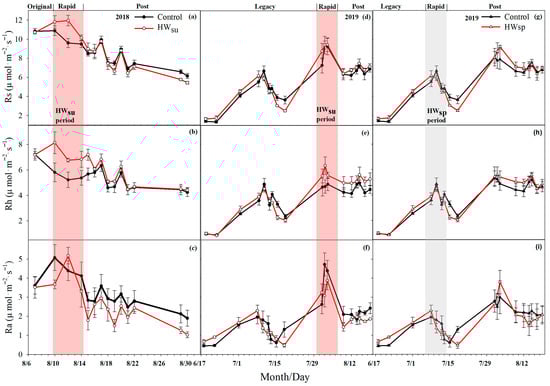
Figure 2.
Changes in soil respiration (Rs), heterotrophic respiration (Rh) and autotrophic respiration (Ra) under different heat wave treatments (without mowing). (a–c), summer heat wave in 2018, (d–f), summer heat wave in 2019, (g–i), spring heat wave in 2019.
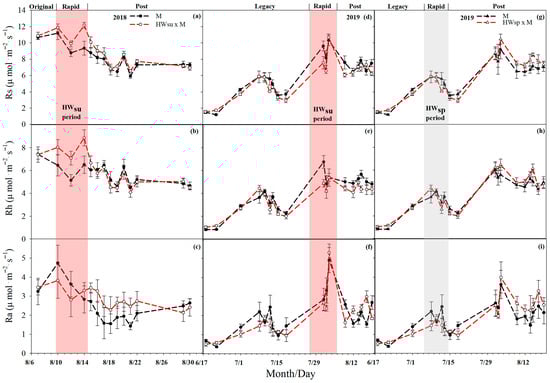
Figure 3.
Changes in soil respiration (Rs), heterotrophic respiration (Rh) and autotrophic respiration (Ra) under different heat wave treatments (with mowing). (a–c), summer heat wave in 2018, (d–f), summer heat wave in 2019, (g–i), spring heat wave in 2019.
3.2. Rs Composition Changes Under Different HWs Treatment Conditions
During the heating period, the proportion of Rh in the mowed and non-mowed plots would increase with the extension of the heating time. Among them, the proportion of Rh in the mowed plots increased more significantly than that of the non-mowed plots; on the contrary, the proportion of Ra decreased with the extension of heating time in both the mowed and non-mowed plots, and the decrease in the mowed plots was more obvious; after a period of time, the proportions of Rh and Ra were basically stable. During the heating period, the proportion of Rh in the control plots were between 45% and 75%, the proportion of Rh in the M plots were between 55% and 70%, the proportion of Rh in the HWsp plots were between 60% and 80%, the proportion of Rh in the HWsp × M plots were between 60% and 75%, the proportion of Rh in the HWsu plots were between 55% and 70%, and the proportion of Rh in the HWsu × M plots were between 45% and 75% (Table 2 and Table 3, Figure 4, Figure 5 and Figure 6).
Table 2.
The ratio and percentage of Ra and Rh in different treatments in 2019 (spring HWs).
Table 3.
The ratio and percentage of Ra and Rh in different treatments in 2018 and 2019 (summer HWs).
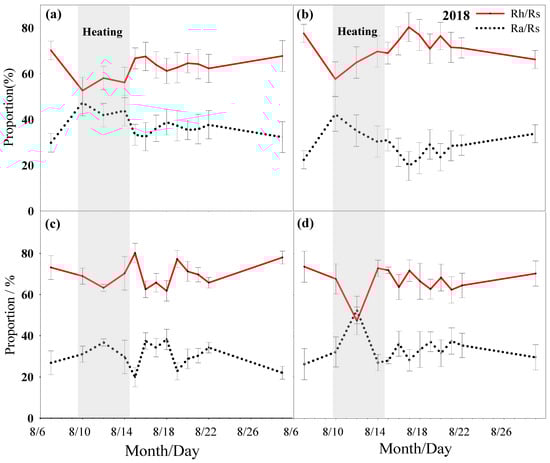
Figure 4.
Rs ratio changes under different summer HWs treatment conditions in 2018 ((a) no heat wave no mowing, (b) no heat wave mowing, (c) summer heat wave without mowing, (d) summer heat wave mowing).
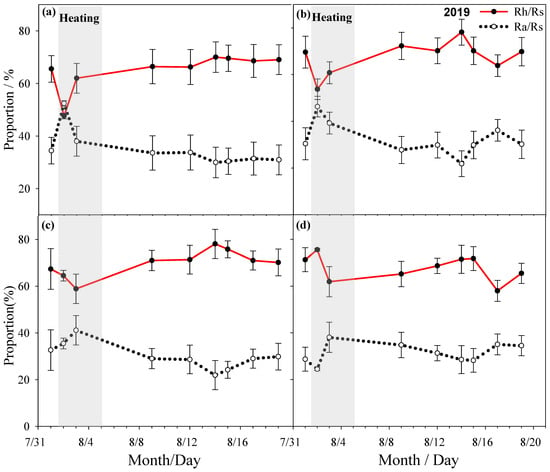
Figure 5.
Rs ratio changes under different summer HWs treatment conditions in 2019 ((a) no heat wave no mowing, (b) no heat wave mowing, (c) summer heat wave without mowing, (d) summer heat wave mowing).
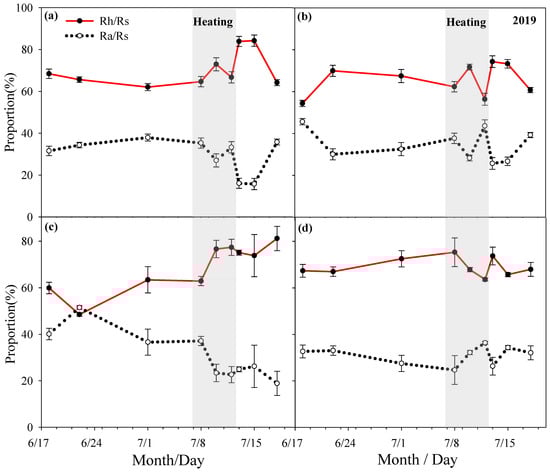
Figure 6.
Rs ratio changes under different spring HWs treatment conditions in 2019 ((a) no heat wave no mowing, (b) no heat wave mowing, (c) spring heat wave without mowing, (d) spring heat wave mowing).
3.3. Correlation of Rs, Rh, Ra with Ts and SWC Under Different HWs Treatments
Under summer HWs conditions, the Rs, Rh and Ra of the different treatment plots all had a high correlation with Ts. Under the condition of spring HWs, the Rs, Rh and Ra of the different treatment plots all had a high correlation with SWC (Table 4).
Table 4.
Correlation of Rs, Rh, Ra with Ts and SWC. ** indicates that the difference is significant at level p < 0.01; * at p < 0.05.
3.4. Effects of Different Treatments of Biomass on Ra
Under the condition of spring HWs, the Ra of mowed plots had a high correlation with BNPP. Under the summer HWs condition, the Ra of the non-mowed plots had a high correlation with the ANPP and BNPP. The Ra of the mowed plots had a high correlation with the BNPP (Table 5).
Table 5.
Correlation between ANPP or BNPP and Ra. ** indicates that the difference is significant at level p < 0.01; * at p < 0.05.
4. Discussion
4.1. Response of Rs, Rh and Ra to HWs
The response of Rs, Rh and Ra to HWs was mainly because HWs could change Ts and SWC [18,23]. By studying the effects of HWs on Rs, we found that HWs could increase Ts but decrease SWC. Our results showed that in the meadow grasslands, summer HWs could promote Rs, Rh and Ra, which was especially obvious in mowed plots. On the contrary, spring HWs could inhibit Rs, Rh and Ra, which was especially obvious at mowed plots. Both were interesting phenomena.
The most similar experimental results showed that Rs increases with the increase in Ts, and the relationship between Rh and Ts satisfied an exponential regression relationship, and a linear regression relationship with SWC [24,25,26]. Although there was no related literature directly describing how HWs affect Rh, many studies found that increasing Ts could directly or indirectly affect Rh through the following three ways: (1) improving the soil microbial community structure and its metabolic activity, which could directly promote Rh; (2) by changing the SWC to regulate the effectiveness of the respiratory substrate and the chance of contact between the respiratory substrate and microorganisms, which indirectly affected Rh. SWC could also control the O2 concentration and CO2 diffusion process in the soil voids by affecting the aeration of the soil, which in turn could affect Rh; (3) the respiration of soil microorganisms required for the participation of soil enzymes, while soil warming generally promoted soil enzyme activity. Therefore, under normal circumstances, increasing Ts would promote Rh [27,28,29].
For Ra, it was mainly the root respiration of plants. Direct measurement had some technical difficulties, and indirect measurement had uncertainties, but through a large number of previous experiments by some researchers, certain rules could also be found. An increase in Ts led to a decrease in SWC. Plants would allocate more carbon to the underground root system to obtain sufficient water and nutrients; therefore, the root respiration would increase significantly. In the case of unrestricted SWC, increasing Ts could also increase the nitrogen content in root tissues and increase root respiration by promoting nutrient mineralization and nitrogen diffusion. Plant root respiration was driven by above-ground photosynthetic products, and any factors that affect plant productivity could participate in the regulation of root respiration. For example, increasing Ts could affect plant productivity and the expansion of plant roots by changing the availability of soil nutrients and SWC, thereby affecting root respiration. Within a certain temperature range, increasing Ts could promote plant root metabolism, and root respiration increases exponentially with the increase in Ts. Combined with Figure 2 and Figure 3, the results of this experiment could also be explained. At the beginning period of the HWs, compared with the middle and late periods of the HWs, the increase in Ts was smaller, while SWC decreased, perhaps because at this stage, HWs mainly evaporated the water in the soil, resulting in a smaller increase in Ts, and then Ra decreased. While in the middle period of the HWs, the increase in Ts was within the range suitable for plant root respiration, and both Ts and Ra increased together. In the latter HWs period, because both Ts and SWC increased, Ra therefore increased, with a reduction in the magnitude of the increase. At the end period of the HWs, Ra decreased. This might be because in the late HWs period, Ts was too high, which led to the death of some plant roots, and then a reduced Ra.
4.2. Response of Rs, Rh and Ra to Mowing
The response of Rs, Rh and Ra to mowing was mainly because mowing affected the degree to which HWs changed SWC and Ts, which in turn affected Rs, Rh and Ra. Combining Figure 2 and Figure 3 and Table 4, we could find that summer HWs would promote Rs, Rh and Ra, and this was more obvious in mowed plots. While spring HWs would inhibit Rs, Rh and Ra, this was more obvious in mowed plots. It might be that Ts changed greatly due to mowing. During the summer HWs, both the air humidity and SWC were higher than those during the spring HWs. Ts was a key factor affecting Rs, Rh and Ra. During the spring HWs, because both SWC and air humidity were low, the key factor affecting Rs, Rh and Ra was SWC. Even if the Ts was high, Rs, Rh and Ra would not increase; in fact, they would decrease instead.
4.3. Influence of HWs on the Ratio of Rh and Ra
Because HWs had varying degrees of influence on Rh and Ra in meadow grasslands, it could affect the distribution ratio of Rs. In the study of Rs components in semi-arid grasslands, Rh contributed 51% to Rs, Ra contributed 49%, and the proportion of Rh was similar to that of Ra [30]. The results of this experiment showed that during the heating period, the proportion of Rh among treatments was varied. At the same time, the results of this experiment also showed that when SWC was low, the proportion of Ra would increase, becoming even higher than that of Rh. This indicated that the plants in this drier ecosystem were more tolerant of water stress, which was similar to that of plums. The analysis of our experimental data was consistent with others [30], in that overall HWs promote Rh more strongly than Ra.
4.4. ANPP and BNPP Response to Ra
Separating the Rs from Ra and Rh was very necessary for detecting the relationships between ANPP or BNPP and Rs. For example, one previous study found that there were no evident relations between ANPP and Rs because they did not separate Ra and Rh, due to most of the components of Rs on grasslands being derived from soil microorganisms and animals, which could interfere with the comparison of Ra and NPP. We analyzed the correlation between the separated Ra and NPP and found that under the condition of spring HWs, the Ra of mowed plots had a high correlation with BNPP (p < 0.01). Under the summer HWs conditions, the Ra of the non-mowed plots had a high correlation with the ANPP and BNPP (p < 0.05). The Ra of the mowed plots had a high correlation with the BNPP (p < 0.05) (Table 5).
Although the results obtained in this experiment could be explained, for some reasons, interference with the experiment was certain. For example, during the HWs experiment, each time Rs, Rh and Ra were measured, the highly transparent polyvinyl chloride (PVC) plastic sheet must be opened, and the loss of heat was more or less inevitable. Analyzing all the graphs drawn from the data obtained, it could be found from the trend and changes that HWs had a considerable influence on Rs, Rh and Ra. In July, August 2018 and August 2019, Hulunbuir’s rainfall was relatively sufficient [15]. Therefore, Ts was the main limiting factor during summer HWs. In July 2019, the situation was the opposite. Because there was little rain and the soil was dry, SWC during the spring HWs was the limiting factor.
5. Conclusions
An in situ spring and summer HW simulation experiment, combined with a local human disturbance (mowing), was conducted to demonstrate the effects on soil respiration, autotrophic respiration and heterotrophic respiration in a natural Eurasian meadow steppe. The three kinds of respirations were inhibited by spring HWs, but promoted by summer HWs, mostly because of significantly increased heterotrophic respiration during summer HWs, but which were insignificant during spring HWs. Our results indicated that the changing of the HWs’ occurring time would cause widely divergent influences on the same ecosystem. We also found that mowing would decrease the anti-interference ability of the ecosystem, which acted as an enhancer on both the positive and negative effects of HWs.
There were few experiments on the impact of HWs on Rs, Rh and Ra. According to the prediction results of climate models, future global climate change would bring more HWs, with HWs’ time of occurrence and intensity changing further. In the future, HW simulation experiments need to focus on not only the HWs’ occurring time but also on HW characteristics such as changing HW intensity and last-period impacts on the ecosystem’s carbon cycle, providing quantitative supports on accurate model prediction and carbon budget assessment.
Author Contributions
Performed the experiments: Y.S., Q.T. and T.G.L.; Conceived and designed the experiments: Y.S., Q.T., C.S. and X.Z.; Analyzed the data: Y.S., Q.T. and X.Z.; Contributed reagents/materials/analysis tools: Y.S., Q.T. and X.Z.; Wrote the paper: Y.S., Q.T., T.G.L., C.S. and X.Z.; Proposal writing and funding: C.S. and X.Z. All authors have read and agreed to the published version of the manuscript.
Funding
This study was supported the National Key Research and Development Program of China (2024YFE0198604), the Natural Science Foundation of China (31870466), Special Foundation for National Science and Technology Basic Research Program of China (2019FY102000).
Data Availability Statement
Data for this manuscript was collected through field sampling and observation in the field/laboratory.
Acknowledgments
During the preparation of this manuscript/study, the authors used SPSS 23.0 and SigmaPlot 12.5 for the purposes of drawing analysis. The authors have reviewed and edited the output and take full responsibility for the content of this publication.
Conflicts of Interest
The authors declare no conflicts of interest.
Abbreviations
The following abbreviations are used in this manuscript:
| ANPP | Above-ground net primary production |
| BNPP | Below-ground net primary production |
| Control | No heat waves no mowing |
| ER | Ecosystem respiration |
| GEP | Gross ecosystem productivity |
| HWs | Heat waves |
| HWsp | Spring heat waves without mowing |
| HWsp × M | Spring heat waves plus mowing |
| HWsu | Summer heat waves without mowing |
| HWsu × M | Summer heat waves plus mowing |
| M | Mowing |
| NEE | Net ecosystem exchange |
| OTC | Open-top chamber |
| PVC | Polyvinyl chloride |
| Ra | Autotrophic respiration |
| Rh | Heterotrophic respiration |
| Rs | Soil respiration |
| SWC | Soil water content |
| Ts | Soil temperature |
References
- De Boeck, H.J.; Bassin, S.; Verlinden, M.; Zeiter, M.; Hiltbrunner, E. Simulated heat waves affected alpine grassland only in combination with drought. New Phytol. 2016, 209, 531–541. [Google Scholar] [CrossRef] [PubMed]
- Li, Z.; He, L.; Zhang, H.; Urrutia-Cordero, P.; Ekvall, M.K.; Hollander, J.; Hansson, L.-A. Climate warming and heat waves affect reproductive strategies and interactions between submerged macrophytes. Glob. Change Biol. 2017, 23, 108–116. [Google Scholar] [CrossRef] [PubMed]
- Sippel, S.; Zscheischler, J.; Reichstein, M. Ecosystem impacts of climate extremes crucially depend on the timing. Proc. Natl. Acad. Sci. USA 2016, 113, 5768–5770. [Google Scholar] [CrossRef]
- Cremonese, E.; Filippa, G.; Galvagno, M.; Siniscalco, C.; Oddi, L.; Morra di Cella, U.; Migliavacca, M. Heat wave hinders green wave: The impact of climate extreme on the phenology of a mountain grassland. Agric. For. Meteorol. 2017, 247, 320–330. [Google Scholar] [CrossRef]
- Frank, D.; Reichstein, M.; Bahn, M.; Thonicke, K.; Frank, D.; Mahecha, M.D.; Smith, P.; Van der Velde, M.; Vicca, S.; Babst, F.; et al. Effects of climate extremes on the terrestrial carbon cycle: Concepts, processes and potential future impacts. Glob. Change Biol. 2015, 21, 2861. [Google Scholar] [CrossRef]
- Qu, L.; Chen, J.; Dong, G.; Shao, C. Heavy mowing enhances the effects of heat waves on grassland carbon and water fluxes. Sci. Total Environ. 2018, 627, 561–570. [Google Scholar] [CrossRef]
- Yu, Q.; Xu, C.; Wu, H.; Ke, Y.; Zuo, X.; Luo, W.; Ren, H.; Gu, Q.; Wang, H.; Ma, W. Contrasting drought sensitivity of Eurasian and North American grasslands. Nature 2025, 639, 114–118. [Google Scholar] [CrossRef] [PubMed]
- Christidis, N.; Jones, G.S.; Stott, P.A. Dramatically increasing chance of extremely hot summers since the 2003 European heatwave. Nat. Clim. Change 2015, 5, 46–50. [Google Scholar] [CrossRef]
- Susan, T. Carbon respired by terrestrial ecosystems—Recent progress and challenges. Glob. Change Biol. 2006, 12, 141–153. [Google Scholar]
- Tatarinov, F.; Rotenberg, E.; Maseyk, K.; Ogee, J.; Klein, T.; Yakir, D. Resilience to seasonal heat wave episodes in a Mediterranean pine forest. New Phytol. 2016, 210, 485–496. [Google Scholar] [CrossRef]
- Wan, S.; Hui, D.; Wallace, L.; Luo, Y. Direct and indirect effects of experimental warming on ecosystem carbon processes in a tallgrass prairie. Glob. Biogeochem. Cycles 2005, 19, GB2014. [Google Scholar] [CrossRef]
- Jentsch, A.; Kreyling, J.; Beierkuhnlein, C. A new generation of climate-change experiments: Events, not trends. Front. Ecol. Environ. 2007, 5, 365–374. [Google Scholar] [CrossRef]
- Legesse, T.; Dong, G.; Dong, X.; Qu, L.; Chen, B.; Daba, N.A.; Sorecha, E.M.; Zhu, W.; Lei, T.; Shao, C. The extreme wet and large precipitation size increase carbon uptake in Eurasian meadow steppes: Evidence from natural and manipulated precipitation experiments. Environ. Res. 2023, 237, 117029. [Google Scholar] [CrossRef]
- Wolf, S.; Keenan, T.F.; Fisher, J.B.; Baldocchi, D.D.; Desai, A.R.; Richardson, A.D.; Scott, R.L.; Law, B.E.; Litvak, M.E.; Brunsell, N.A. Warm spring reduced carbon cycle impact of the 2012 US summer drought. Proc. Natl. Acad. Sci. USA 2016, 113, 5880–5885. [Google Scholar] [CrossRef]
- Legesse, T.G.; Qu, L.; Dong, G.; Dong, X.; Ge, T.; Daba, N.A.; Tadesse, K.A.; Sorecha, E.M.; Tong, Q.; Yan, Y.; et al. Extreme wet precipitation and mowing stimulate soil respiration in the Eurasian meadow steppe. Sci. Total Environ. 2022, 851, 158130. [Google Scholar] [CrossRef] [PubMed]
- Reichstein, M.; Bahn, M.; Ciais, P.; Frank, D.; Mahecha, M.D.; Seneviratne, S.I.; Zscheischler, J.; Beer, C.; Buchmann, N.; Frank, D.C.; et al. Climate extremes and the carbon cycle. Nature 2013, 500, 287–295. [Google Scholar] [CrossRef]
- Ohlert, T.; Smith, M.D.; Collins, S.L.; Knapp, A.K.; Dukes, J.S.; Sala, O.; Wilkins, K.D.; Munson, S.M.; Anderson, M.I.; Avolio, M.L. Drought intensity and duration interact to magnify losses in primary productivity. Science 2025, 390, 284–289. [Google Scholar] [CrossRef]
- Hoover, D.L.; Knapp, A.K.; Smith, M.D. The immediate and prolonged effects of climate extremes on soil respiration in a mesic grassland. J. Geophys. Res. Biogeosciences 2016, 121, 1034–1044. [Google Scholar] [CrossRef]
- Shao, C.; Chen, J.; Li, L.; Zhang, L. Ecosystem responses to mowing manipulations in an arid Inner Mongolia steppe: An energy perspective. J. Arid. Environ. 2012, 82, 1–10. [Google Scholar] [CrossRef]
- Zhang, X.; Zhang, K.; Zhang, K.; Shao, C.; Zhang, A.; Chen, Y.; Hou, L. Soil fertility assessment and spatial heterogeneity of the natural grasslands in the Tibetan Plateau using a novel index. Agronomy 2025, 15, 2743. [Google Scholar] [CrossRef]
- Wu, J.; Xu, J.; Wang, L. The physiological response of anatomical structures and physiological indexes of two potentilla species to drought stress. Acta Agrestia Sin. 2015, 23, 125–129. [Google Scholar]
- Wang, D.; Heckathorn, S.A.; Mainali, K.; Tripathee, R. Timing effects of heat-stress on plant ecophysiological characteristics and growth. Front. Plant Sci. 2016, 7, 1629. [Google Scholar] [CrossRef] [PubMed]
- Bauweraerts, I.; Wertin, T.M.; Ameye, M.; McGuire, M.A.; Teskey, R.O.; Steppe, K. The effect of heat waves, elevated CO2 and low soil water availability on northern red oak (Quercus rubra L.) seedlings. Glob. Change Biol. 2013, 19, 517–528. [Google Scholar] [CrossRef]
- Li, Y.; Xu, M.; Zou, X. Heterotrophic Soil Respiration in Relation to Environmental Factors and Microbial Biomass in Two Wet Tropical Forests. Plant Soil 2006, 281, 193–201. [Google Scholar] [CrossRef]
- Tucker, C.L.; Reed, S.C. Low soil moisture during hot periods drives apparent negative temperature sensitivity of soil respiration in a dryland ecosystem: A multi-model comparison. Biogeochemistry 2016, 128, 155–169. [Google Scholar] [CrossRef]
- Wagle, P.; Kakani, V.G. Confounding Effects of Soil Moisture on the Relationship Between Ecosystem Respiration and Soil Temperature in Switchgrass. BioEnergy Res. 2014, 7, 789–798. [Google Scholar] [CrossRef]
- Cable, J.M.; Ogle, K.; Lucas, R.W.; Huxman, T.E.; Loik, M.E.; Smith, S.D.; Tissue, D.T.; Ewers, B.E.; Pendall, E.; Welker, J.M.; et al. The temperature responses of soil respiration in deserts: A seven desert synthesis. Biogeochemistry 2010, 103, 71–90. [Google Scholar] [CrossRef]
- Carbone, M.S.; Still, C.J.; Ambrose, A.R.; Dawson, T.E.; Williams, A.P.; Boot, C.M.; Schaeffer, S.M.; Schimel, J.P. Seasonal and episodic moisture controls on plant and microbial contributions to soil respiration. Oecologia 2011, 167, 265–278. [Google Scholar] [CrossRef]
- Cusack, D.F.; Ashdown, D.; Dietterich, L.H.; Neupane, A.; Ciochina, M.; Turner, B.L. Seasonal changes in soil respiration linked to soil moisture and phosphorus availability along a tropical rainfall gradient. Biogeochemistry 2019, 145, 235–254. [Google Scholar] [CrossRef]
- Li, W.; Chen, S.; Zhang, B.; Tan, X.; Wang, S.; You, C. Partitioning of soil respiration components and evaluating the mycorrhizal contribution to soil respiration in a semiarid grassland. Chin. J. Plant Ecol. 2018, 042, 850–862. [Google Scholar] [CrossRef]
Disclaimer/Publisher’s Note: The statements, opinions and data contained in all publications are solely those of the individual author(s) and contributor(s) and not of MDPI and/or the editor(s). MDPI and/or the editor(s) disclaim responsibility for any injury to people or property resulting from any ideas, methods, instructions or products referred to in the content. |
© 2026 by the authors. Licensee MDPI, Basel, Switzerland. This article is an open access article distributed under the terms and conditions of the Creative Commons Attribution (CC BY) license.