Abstract
Co-incorporating rice straw and Chinese milk vetch (CMV) residues can enhance soil organic carbon (SOC) sequestration and productivity. However, limited information exists regarding its effects on SOC and nitrogen (N) pools as well as the sustainability of rice production in the middle and lower reaches of the Yangtze River Basin. A 3-year field experiment was conducted to assess the effects of co-incorporating rice and CMV residues into paddy soils with chemical-N reduction on SOC and total N (TN) sequestration, SOC and N fractions, grain yields and the sustainable yield index (SYI) in Ma’anshan City, Anhui Province. The treatments included winter fallow–rice rotation without or with both rice straw incorporation and fertilization, as the control (CK and WF-IF, respectively), and rice-CMV rotation with the co-incorporation of rice and CMV residues under 100%, 80%, and 70% recommended N fertilization (CMV-IF, CMV-MIF and CMV-LIF, respectively). Compared with the CK, the CMV-IF significantly increased the rice grain yield and the SYI by 82.1% and 90.4%, respectively. The SOC and TN stocks under CMV-IF were significantly enhanced by 6.3% and 26.4%, respectively, relative to the CK. The CMV-IF exhibited the highest soil active organic C (AOC) and active total N (ATN) contents, followed by CMV-MIF, CMV-LIF, WF-IF, and CK. Microbial biomass C and microbial biomass N were the primary components of soil AOC and ATN, respectively, and linked more explicitly to the SYI than other soil C and N parameters. Therefore, the co-incorporation of rice and CMV residues, coupled with 70~80% recommended N fertilization, might represent an environmentally friendly field management practice for rice production in the middle and lower reaches of the Yangtze River Basin.
1. Introduction
Soil represents one of the largest terrestrial reservoirs of organic carbon (OC, ~1580 Gt C), where approximately 81% of the OC resources actively involved in the global C cycle are stored [1]. Soil OC (SOC) pools are involved in a variety of physical, chemical, and biological processes, and play crucial roles in soil ecosystem functions, such as maintaining soil fertility and agricultural sustainability [2,3], sequestering pollutants in soil [4], and regulating global climate change [5]. Paddy soils are recognized as an important source of greenhouse gases (GHGs), and even minor changes in soil C pools may profoundly affect global GHG emissions, which in turn provide feedback to climate change [6]. Enhancing the sequestration of atmospheric CO2 by soil is considered to contribute effectively to the increase in SOC storage and the mitigation of global warming [7]. Although rice (Oryza sativa L.) paddies account for only ~9% of the global arable land area, they are highly susceptible to anthropogenic disturbance, which could result in distinct soil C losses into the environment [6]. On the other hand, a huge potential exists for SOC sequestration by paddy soils when adopting green and sustainable agricultural production practices [8,9].
As well-established organic amendments, the residues of rice and Chinese milk vetch (Astragalus sinicus L., CMV) can provide agricultural soils with organic matter and renew soil organic matter (SOM) in rice paddies [10,11]. A growing body of evidence linking manipulative experiments [12] and meta-analyses [13,14] has suggested that incorporating CMV residues into paddy soils could maintain or even boost the rice yields, even under lowering 20~30% N rate based on conventional fertilization. However, the response of grain yield to the return of rice residue is inconsistent, with decreases [15], enhancements [16], and no changes [17,18] being reported previously. With increasing attention given to the industrial utilization of straw, a more robust understanding of how straw return, especially in combination with CMV residue under lowering 20~30% N rate, alters soil quality and crop productivity in rice paddies is needed [19]. As such, this study can provide scientific evidence for whether it is feasible to remove rice straw or not and how to address the challenges of achieving high grain yields via an environmentally friendly approach.
Fertilization is an important practice to maintain and/or enhance soil productivity in paddy fields [2,12]. Variations in soil active nitrogen (N) pools are associated with global climate change due to the high N2 O emission stimulated by the large supplies of mineral N fertilizer [20,21]. Enhancing soil N fixation can reduce the amount and cost of N fertilizer applied while sustaining the potential supply of soil N and alleviating the adverse impacts of N losses on the environment [7]. The form, amount, and characteristics of soil C and N fractions change when the soils are provided with organic amendments, although the contents of active organic matter are generally low due to the extensive contact with soil environment, microorganisms, and plants [22,23]. Even so, the active organic C and N in soil exhibit great importance in the variations in C and N cycling and soil quality [24]. The differences in physicochemical composition and turnover time of different SOM components make a distinct difference in SOC stability [25]. The SOM degradation has been proven to be relatively slow, and its changes are generally delayed, thus making it unsuitable for short-term studies [22,26]. The complexity of soil systems makes the determination of single organic C and N fractions not accurately reflect the impacts of field management practices on soil quality [27,28]. Therefore, mechanistic explanations of the C and N fate in soil are needed to provide a basis for the reliable parameterization of substrates in models for potential environmental impact assessment and agroecological decision support.
To fill these knowledge gaps, we conducted a 3-year field experiment to: (1) investigate the effects of co-incorporating rice and CMV residues, coupled with 70~80% recommended N fertilization on changes in grain yield and the sustainability of rice production; (2) assess the responses of SOC and TN sequestration to the co-incorporation of rice and CMV residues with chemical-N reduction; (3) establish the relationships among different active C and N fractions; and (4) identify the optimal fertilizer management practice with the co-incorporation of rice and CMV residues for sustainable rice production in the middle and lower reaches of the Yangtze River Basin.
2. Materials and Methods
2.1. Site Description
The experiment was conducted from October 2022 to October 2025 at the Taocun rice planting base in Yanchuan District, Ma’anshan City, Anhui Province (31°43′ N, 118°18′ E). This experimental area belongs to the subtropical humid monsoon climate zone, with an annual average temperature of 15.7 °C and an annual precipitation of 1036 mm. The tested soil is a rice paddy soil. Before the experiment, the soil in the plow layer (0–20 cm) had a bulk density of 1.34 g cm−3 and a pH of 6.18. Other soil properties such as SOC, total N, alkali-hydrolyzale N, available phosphorus, and available potassium content are 9.61 g kg−1, 0.78 g kg−1, 82.90 mg kg−1, 7.80 mg kg−1, and 70.98 mg kg−1, respectively.
2.2. Experimental Design and Crop Management
Prior to the experiment, single-cropped rice cultivation lasted for more than 20 years with similar field management practices in the study site. Five planting patterns were implemented: winter fallow–rice rotation without or with both rice straw incorporation and fertilization, as the control (CK and WF-IF, respectively), rice-CMV rotation with the co-incorporation of rice and CMV residues under 100%, and 80% and 70% recommended N fertilization (CMV-IF, CMV-MIF and CMV-LIF, respectively). The treatments were arranged in a randomized complete block design with three replications. Each plot was 20 m2 (4 m × 5 m). The plots were separated from each other using 0.3 m high and 0.4 m wide ridges. The ridges were wrapped with polyethylene film to avoid water and nutrient exchange.
The rice (Oryza sativa L., cv. “Yueliangyou 19 Fragrant”) was manual transplanted after mid-May and harvested at the end of September. The transplanting density was 16.5 cm × 26.4 cm. Twenty days before the rice harvest, the CMV was seeded directly with an application rate of 30 kg hm−2 in the plots of CMV-IF, CMV-MIF, and CMV-LIF. One week before the rice transplanting, the CMV was harvested at full-bloom stage. Fresh CMV residues (C:N ratio = 32:1) were incorporated into the soil at a rate of 18 tons hm−2. After the incorporation, the plots were flooded up to 6−10 cm depth. Under WF-IF and CMV-IF, basal fertilizers were recommended with 108 kg N hm−2, 90 kg P2O5 hm−2 and 90 kg K2 O hm−2 before rice transplantation, and topdressing fertilizers were recommended with 36 kg N hm−2 at 5 and 10 days after rice transplantation, respectively. Under CMV-MIF and CMV-LIF, the N dose was 80% and 70% of that under CMV-IF. The mineral fertilizers were supplied as urea, superphosphate, and potassium chloride. At rice maturity, all the plants in the plot were harvested for yield determination. The field management practices followed the recommendations of the local agricultural technology department. No obvious weed, pest, or flooding problems were found during any of the rice-growing seasons.
2.3. Sample Collection and Measurement
At rice physiological maturity from 2023 to 2025, grain yields were measured by manually harvesting three separate 1 m2 quadrats from each of the aforementioned plots. The dry constant weight of rice grain was determined after separation and oven-drying at 65 °C.
After the rice maturity period in October 2025, soil sampling was conducted with a stainless-steel auger at 0−20 and 20−40 cm soil depth. Eight soil cores (2 cm in diameter) were collected from each plot. The sampled soil was mixed sufficiently into a composite sample after removing plant roots and stones. After being sieved to pass through a 2 mm mesh, the composite sample was divided into 2 parts, one part was used to measure the contents of soil dissolved organic C (DOC), dissolved total N (DTN), microbial biomass C (MBC), and microbial biomass N (MBN). The other subsample was air-dried, ground, and sieved to pass through a 0.15 mm mesh for the analyses of SOC and TN. The DOC and DTN were measured with 0.5 mol L−1 K2SO4 extraction-volumetric analysis and CaCl2 for extraction-potassium persulfate colorimetry, respectively [29]. The MBC and MBN were extracted with 0.5 mol L−1 K2SO4 from chloroform-fumigated and nonfumigated samples and analyzed using a total organic carbon (TOC) analyzer (Elemental Analyzer TOC-Vario, Heraeus, Germany) [29]. The SOC and TN were determined with an Elemental Analyzer (Thermo Fisher Scientific, Bremen, Germany) [29]. Soil active organic C (AOC) was represented by the sum total of MBC and DOC and added to the MBN and DTN to represent the soil active total N (ATN) [29].
2.4. Data Calculation
The sustainable yield index (SYI) reflects whether a crop can be sustainably produced in a given soil ecosystem [30]. The higher the SYI is, the more likely it is that a field management system will be adopted to sustain a particular crop yield over time. To quantify the impact of co-incorporating rice and CMV residues with different reduction rates in chemical-N fertilization on soil quality, which is closely associated with crop productivity, the SYI of rice was calculated for each treatment from 2023 to 2025 as follows:
where Y represents the mean yield (Mg hm−2) over the years; δ is the standard deviation; and Ymax is the maximum yield in the treatments. The closer the SYI is to 1.0, the better the soil management is at the optimal sustainable crop productivity over the past years.
Soil organic C and TN stock was calculated using Equations (2) and (3):
where SOC stock and SOC content are the SOC stock (Mg hm−2) and content (g kg−1) at a given depth, respectively; TN stock and TN content are the TN stock (Mg ha−1) and TN content (g kg−1) at a given depth (i.e., 0−20 or 20−40 cm), respectively; and H is soil depth (m), BD is soil bulk density (g cm−3).
2.5. Statistical Analysis
The statistical analyses were conducted by the windows-based SPSS program (SPSS v19.0) (Statistical Package for the Social Science, SPSS, Chicago, IL, USA). One-way One-way analysis of variation ANOVA) was conducted to analyze the variance and to determine the statistical significance of the treatment effects. The treatment means were compared using Fisher’s protected least significant difference (LSD) test. Differences were considered significant at p < 0.05. Simple correlation coefficients and regression equations were used to quantify the relationships among grain yields, SYI, and different soil C and N parameters.
3. Results
3.1. Grain Yields and the SYI
Compared with the CK, the CMV-IF exhibited an average increase of 87.4% in grain yield over the three years, while it was only 82.1% under WF-IF (Figure 1). The average grain yield visibly increased by 86.3% and 86.8% under CMV-MIF and CMV-LIF relative to the CK. However, no obvious discrepancy was found among the treatments of CMV-MIF, CMV-LIF, and CMV-IF in every year (p > 0.05). Compared with the CK, the WF-IF, CMV-IF, CMV-MIF, and CMV-LIF increased the SYI by 85.0%, 90.4%, 89.3%, and 89.9%, respectively, during the 4 yr experiment (Figure 2, p < 0.05). The SYI values were comparable in the treatments of WF-IF, CMV-IF, CMV-MIF, and CMV-LIF, with no significant differences among them (p > 0.05).
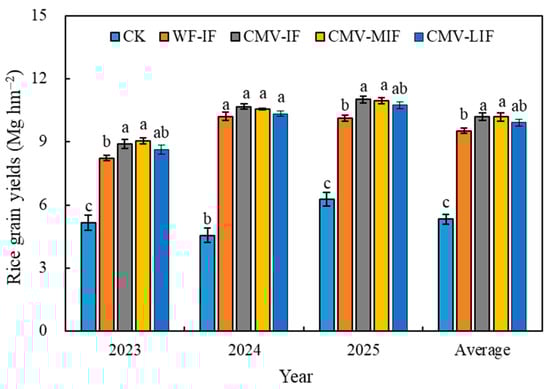
Figure 1.
Comparisons of rice yields between treatments during the 3 years of experimental cropping. CK, winter fallow–rice rotation without both rice straw incorporation and fertilization; WF-IF, winter fallow–rice rotation with both rice straw incorporation and recommended N fertilization; CMV-IF, rice-CMV rotation with the co-incorporation of rice and CMV residues under 100% recommended N fertilization; CMV-MIF, rice-CMV rotation with the co-incorporation of rice and CMV residues under 80% recommended N fertilization; CMV-LIF, rice-CMV rotation with the co-incorporation of rice and CMV residues under 70% recommended N fertilization. Bars represent standard errors (n = 3). Means with different letters are significantly different at p < 0.05.
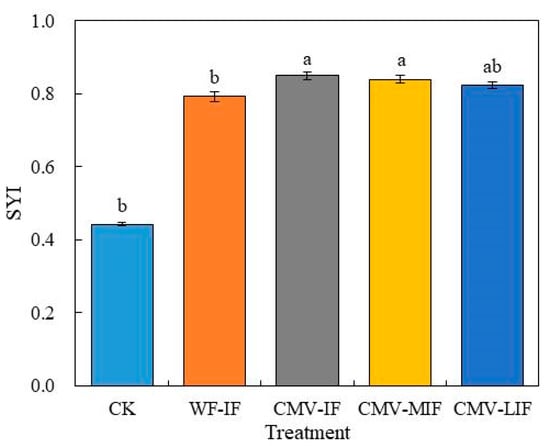
Figure 2.
Comparisons of sustainable yield indexes (SYI) between treatments during the 3 years of experimental cropping. CK, winter fallow–rice rotation without both rice straw incorporation and fertilization; WF-IF, winter fallow–rice rotation with both rice straw incorporation and recommended N fertilization; CMV-IF, rice-CMV rotation with the co-incorporation of rice and CMV residues under 100% recommended N fertilization; CMV-MIF, rice-CMV rotation with the co-incorporation of rice and CMV residues under 80% recommended N fertilization; CMV-LIF, rice-CMV rotation with the co-incorporation of rice and CMV residues under 70% recommended N fertilization. Bars represent standard errors (n = 3). Means with different letters are significantly different at p < 0.05.
3.2. SOC and TN Sequestration
3.2.1. SOC and TN Contents
Planting patterns affected SOC and TN contents in both the 0–20 cm and 20–40 cm soil layers (Figure 3a–d, p < 0.05). Compared with the CK, the SOC content under WF-IF exhibited an increase of 11.8% and 26.6% in the 0–20 and 20–40 cm layers, respectively (Figure 3a,b, p < 0.05). Under CMV-IF, CMV-MIF, and CMV-LIF, the SOC content showed increases of 24.6%, 20.9%, and 18.8%, respectively, in the 0–20 cm layer, and of 47.4%, 50.0%, and 29.2%, respectively, in the 20–40 cm layer, compared with the CK (p < 0.05). In addition, the SOC contents under CMV-IF and CMV-MIF were significantly enhanced by 11.4% and 8.1% in the 0–20 cm layer, and by 16.4% and 18.5% in the 20–40 cm layer, respectively, relative to the WF-IF (p < 0.05). However, the differences between the CMV-IF, CMV-MIF, and CMV-LIF did not reach statistical significance in either the 0–20 or 10–20 cm layers (p > 0.05).
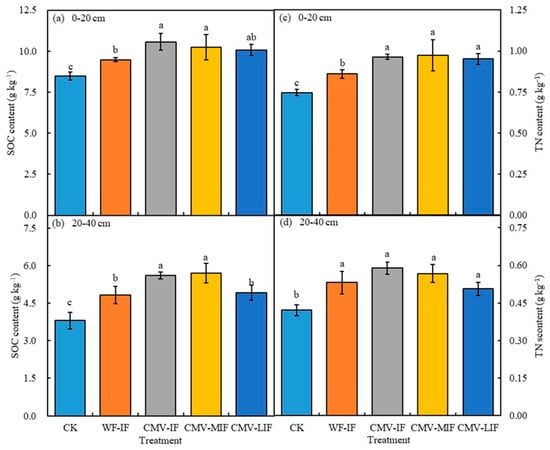
Figure 3.
Soil organic carbon (SOC) and total nitrogen (TN) contents in the 0–20 and 20–40 cm soil layers after the rice maturity in October 2025. CK, winter fallow–rice rotation without both rice straw incorporation and fertilization; WF-IF, winter fallow–rice rotation with both rice straw incorporation and recommended N fertilization; CMV-IF, rice-CMV rotation with the co-incorporation of rice and CMV residues under 100% recommended N fertilization; CMV-MIF, rice-CMV rotation with the co-incorporation of rice and CMV residues under 80% recommended N fertilization; CMV-LIF, rice-CMV rotation with the co-incorporation of rice and CMV residues under 70% recommended N fertilization. Bars represent standard errors (n = 3). Means with different letters are significantly different at p < 0.05.
With similar trends with the SOC content, the TN content increased by 15.2~30.5% and 20.3~39.9% under WF-IF, CMV-IF, CMV-MIF, and CMV-LIF in the 0–20 and 20–40 cm layers, respectively, relative to the CK (Figure 3c,d, p < 0.05). It is worth noting that the highest TN contents in the 0–20 and 20–40 cm layers were found under CMV-MIF (0.97 g kg−1) and CMV-IF (0.59 g kg−1), respectively. However, there were no significant differences between the WF-IF, CMV-IF, CMV-MIF, and CMV-LIF in both of the 0–20 or 20–40 cm layers (p > 0.05).
3.2.2. SOC and TN Stocks
The SOC and TN stocks exhibited similar trends with those of SOC and TN contents throughout the 0–40 cm soil layer (Figure 4a–f). The CMV-IF exhibited the highest SOC and TN stocks, which were significantly greater by 20.4% and 24.7% in the 0–20 cm soil layer, by 38.1% and 29.1% in the 20–40 cm soil layer, and by 26.3% and 26.4% in the whole 0–40 cm soil layer, respectively, compared with those under CK (Figure 4a–f, p < 0.05). Compared with the WF-IF, the SOC stock in the 0–20 and 0–40 cm soil layers was significantly greater by 9.6% and 12.6%, respectively (Figure 4a,c, p < 0.05). However, no obvious discrepancy existed between the CMV-IF, CMV-MIF, and CMV-LIF throughout the 0–40 cm soil layer (Figure 4a–f, p > 0.05).
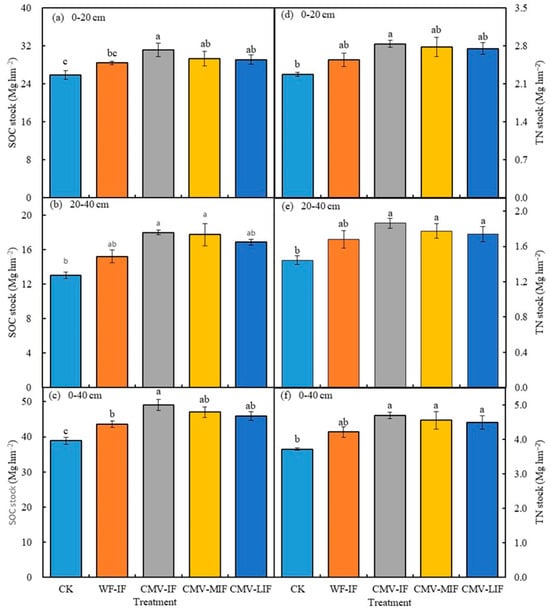
Figure 4.
Soil organic carbon (SOC) and total nitrogen (TN) stocks in the 0–20, 20–40, and 0–40 cm soil layers after the rice maturity in October 2025. CK, winter fallow–rice rotation without both rice straw incorporation and fertilization; WF-IF, winter fallow–rice rotation with both rice straw incorporation and recommended N fertilization; CMV-IF, rice-CMV rotation with the co-incorporation of rice and CMV residues under 100% recommended N fertilization; CMV-MIF, rice-CMV rotation with the co-incorporation of rice and CMV residues under 80% recommended N fertilization; CMV-LIF, rice-CMV rotation with the co-incorporation of rice and CMV residues under 70% recommended N fertilization. Bars represent standard errors (n = 3). Means with different letters are significantly different at p < 0.05.
Compared to the initial SOC stocks in 2022, the SOC and TN stocks in the CK were reduced by 7.9% and 4.7%, respectively, throughout the total 0–40 cm soil layer (Figure 5). However, the SOC and TN stocks were enhanced by 3.3~16.3% and 8.1~20.4% under both plant residue incorporation and recommended N fertilization throughout the total 0–40 cm soil layer, with the trend of CMV-IF > CMV-MIF > CMV-LIF > WF-IF.
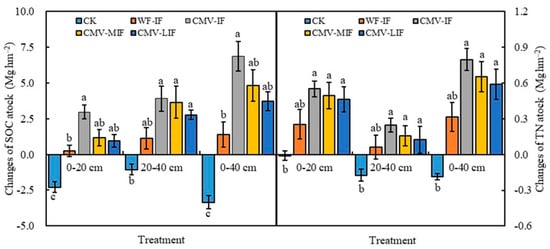
Figure 5.
Changes in soil organic carbon (SOC) and total nitrogen (TN) stocks in the 0–40 cm soil layer during 2022–2025. The initial SOC stocks in the 0–20 cm, 20–40 cm, and 0–40 cm soil layers were 28.12, 14.08, and 42.20 Mg hm−2, respectively. The initial TN stocks in the 0–20 cm, 20–40 cm, and 0–40 cm soil layers were 2.28, 1.62, and 3.90 Mg hm−2, respectively. CK, winter fallow–rice rotation without both rice straw incorporation and fertilization; WF-IF, winter fallow–rice rotation with both rice straw incorporation and recommended N fertilization; CMV-IF, rice-CMV rotation with the co-incorporation of rice and CMV residues under 100% recommended N fertilization; CMV-MIF, rice-CMV rotation with the co-incorporation of rice and CMV residues under 80% recommended N fertilization; CMV-LIF, rice-CMV rotation with the co-incorporation of rice and CMV residues under 70% recommended N fertilization. Bars represent standard errors (n = 3). Means with different letters are significantly different at p < 0.05.
3.3. Soil OC and N Fractions
3.3.1. Soil DOC and DTN
Soil DOC contents ranged from 44.6 mg kg−1 to 78.3 mg kg−1 and from 18.3 mg kg−1 to 35.6 mg kg−1 in 0–20 and 20–40 cm soil layers, respectively (Figure 6). Compared to the CK, both plant residue incorporation and recommended N fertilization increased soil DOC contents by 32.8~75.6% and 55.3~94.9%, respectively, in 0–20 and 20–40 cm soil layers, with the highest values under CMV-IF (Figure 6a,b, p < 0.05). Similarly, both plant residue incorporation and recommended N fertilization increased soil DTN content by 45.6~94.7% relative to the CK in the 20–40 cm soil layer (Figure 6d, p < 0.05). In contrast to the soil DOC, the highest soil DTN content was found under CMV-MIF, followed by the CMV-LIF, WF-IF, CMV-IF, and CK in the 20–40 cm soil layer. In addition, there were no differences among all treatments in the 0–20 cm soil layer (Figure 6c, p > 0.05).
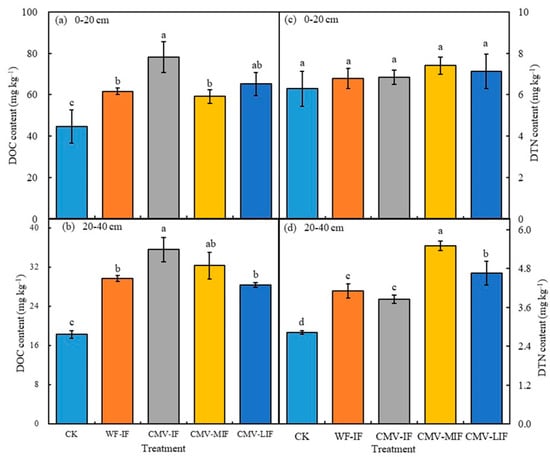
Figure 6.
Soil dissolved organic C (DOC), dissolved total N (DTN) content in 0–20 and 20–40 cm soil layers after the rice maturity in October 2025. CK, winter fallow–rice rotation without both rice straw incorporation and fertilization; WF-IF, winter fallow–rice rotation with both rice straw incorporation and recommended N fertilization; CMV-IF, rice-CMV rotation with the co-incorporation of rice and CMV residues under 100% recommended N fertilization; CMV-MIF, rice-CMV rotation with the co-incorporation of rice and CMV residues under 80% recommended N fertilization; CMV-LIF, rice-CMV rotation with the co-incorporation of rice and CMV residues under 70% recommended N fertilization. Bars represent standard errors (n = 3). Means with different letters are significantly different at p < 0.05.
3.3.2. Soil MBC and MBN
Soil MBC contents ranged from 379.0 mg kg−1 to 645.9 mg kg−1 and from 110.5 mg kg−1 to 197.1 mg kg−1 in the 0–20 and 20–40 cm soil layers (Figure 7). Compared to the CK, both plant residue incorporation and recommended N fertilization increased soil DOC contents by 20.4~70.4% and 35.6~78.4% in the 0–20 and 20–40 cm soil layers, with the highest values under CMV-IF (Figure 7a,b, p < 0.05). In addition, the CMV-MIF and CMV-LIF reduced soil MBC contents by 37.9% and 71.1% in the 0–20 soil layer, and by 24.0% and 44.6% in the 20–40 soil layer, relative to those under CMV-IF (p < 0.05).
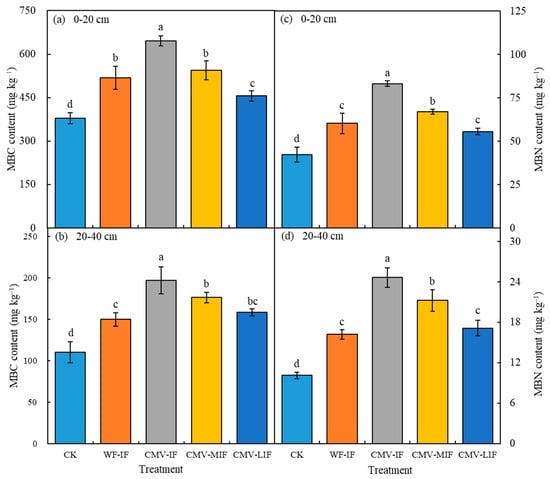
Figure 7.
Soil microbial biomass C (MBC) and microbial biomass N (MBN) content in 0–20 and 20–40 cm soil layers after the rice maturity in October 2025. CK, winter fallow–rice rotation without both rice straw incorporation and fertilization; WF-IF, winter fallow–rice rotation with both rice straw incorporation and recommended N fertilization; CMV-IF, rice-CMV rotation with the co-incorporation of rice and CMV residues under 100% recommended N fertilization; CMV-MIF, rice-CMV rotation with the co-incorporation of rice and CMV residues under 80% recommended N fertilization; CMV-LIF, rice-CMV rotation with the co-incorporation of rice and CMV residues under 70% recommended N fertilization. Bars represent standard errors (n = 3). Means with different letters are significantly different at p < 0.05.
The changes in soil MBN and MBC contents were similar and both plant residue incorporation and recommended N fertilization significantly increased the MBN content throughout the 0–40 cm soil layer (Figure 7c,d, p < 0.05). Compared to the CK, the soil MBN contents in the paddy fields receiving the WF-IF treatment increased by 42.5% and 60.1% in the 0–20 and 20–40 cm soil layers (p < 0.05). In the CMV-IF and CMV-MIF treatments, the soil MBN increased by 96.7% and 58.1% in the 0–20 soil layer, and by 143.4% and 109.8% in the 20–40 soil layer, compared to the CK, and they increased 38.1% and 11.0% in the 0–20 soil layer, and by 52.1% and 31.1% in the 20–40 soil layer, compared to the WF-IF (p < 0.05). In addition, the soil MBN contents reduced by 39.9% and 67.6% in the 0–20 soil layer, and by 23.5% and 51.8% in the 20–40 soil layer, relative to those under CMV-IF (p < 0.05).
3.3.3. Soil Active Organic C (AOC) and Soil Active Total N (ATN)
Soil MBC and MBN accounted for 83.5~90.2% and 78.6~92.4% of soil AOC and ATN, respectively (Figure 8). The percentages of DOC and DTN in soil AOC and ATN were only 9.8~16.5% and 7.6~21.8%, respectively. These results indicated that MBC and MBN were the primary components of soil AOC and ATN, and were more closely associated with the total amount of active organic C and N.
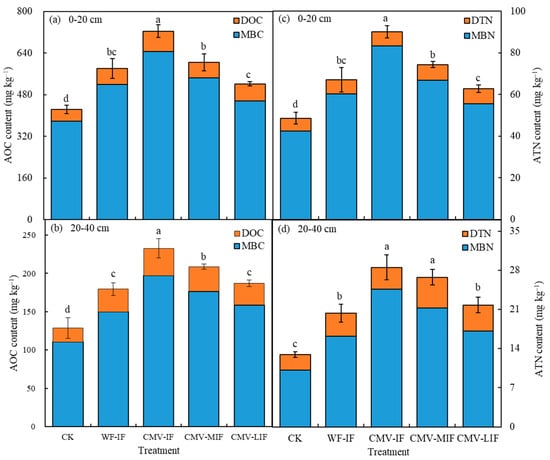
Figure 8.
Soil active organic C (AOC) and active total N (ATN) content in 0–20 and 20–40 cm soil layers after the rice maturity in October 2025. CK, winter fallow–rice rotation without both rice straw incorporation and fertilization; WF-IF, winter fallow–rice rotation with both rice straw incorporation and recommended N fertilization; CMV-IF, rice-CMV rotation with the co-incorporation of rice and CMV residues under 100% recommended N fertilization; CMV-MIF, rice-CMV rotation with the co-incorporation of rice and CMV residues under 80% recommended N fertilization; CMV-LIF, rice-CMV rotation with the co-incorporation of rice and CMV residues under 70% recommended N fertilization. Bars represent standard errors (n = 3). Means with different letters are significantly different at p < 0.05.
Compared to the CK, both plant residue incorporation and recommended N fertilization increased soil AOC contents by 23.1~71.0% and 302.5~421.9% in the 0–20 and 20–40 cm soil layers, all of which had the highest values under CMV-IF (Figure 8a,b, p < 0.05). The CMV-MI and CMV-LIF significantly decreased soil AOC contents by 16.6% and 28.0% in the 0–20 soil layer, and by 10.4% and 19.7% in the 20–40 soil layer, respectively, relative to the CMV-FI (p < 0.05). In addition, no difference existed for soil AOC contents between CMV-LIF and WF-IF in both of the 0–20 and 20–40 cm soil layers (p > 0.05). With similar trends with soil AOC content, soil ATN content increased by 29.0~85.3% and 56.9~120.1% under both plant residue incorporation and recommended N fertilization relative to those under the CK in the 0–20 and 20–40 cm soil layers (Figure 8c,d, p < 0.05).
3.4. Relationships of the Soil C/N Ratio and C and N Fractions
The ratios of C and N fractions in SOC and TN exhibited differences (Table 1). Taking the relevant C/N ratios in the 0–20 cm soil layer as one example, the WF-IF significantly increased the ratios of AOC/SOC and ATN/TN relative to the CK (p < 0.05). In addition to these two ratios, the CMV-IF also significantly increased the ratios of MBC/SOC, DOC/SOC, MBN/TN, and DTN/TN relative to the CK, while it reduced the MBC/MBN and AOC/ATN ratio (p < 0.05). Similarly, the ratios of DOC/SOC, AOC/SOC, MBN/TN, and ATN/TN under CMV-MI, and the ratios of AOC/SOC and ATN/TN were also higher than those under the CK (p < 0.05). Compared to the WF-IF, the CMV-IF increased the ratios of DOC/SOC, AOC/SOC, MBN/TN, DTN/TN, and ATN/TN, while it reduced the ratios of MBC/MBN and AOC/ATN (p < 0.05).

Table 1.
Relevant C/N ratios in the different fertilization treatments.
A highly significant positive correlation was observed between SOC and TN, SOC and MBC, SOC and AOC, SOC and ATN, TN and MBC, and TN and AOC, with correlation coefficients that were all above 0.63 in the 0–20 cm soil layer (Table 2, p < 0.01). Significant correlations were also found between SOC and MBN, SOC and DTN, TN and MBN, TN and DTN, and TN and ATN in the 0–20 cm soil layer (p < 0.05). Similar patterns were observed in the 20–40 cm soil layer, while a highly significant positive correlation was also observed between SOC and DOC (p < 0.01), but no correlation existed between TN and DTN in the 20–40 cm soil layer (p > 0.05). These results indicated that after the co-incorporation of rice and CMV residues, the increase in SOC accumulation mostly reflected in MBC and AOC in the 0–20 cm soil layer, but was also highly correlated with the DOC in the 20–40 cm soil layer. The increased soil TN accumulation came from MBN, DTN, and ATN in the 0–20 cm soil layer, but with very little correlation with the DTN in the 20–40 cm soil layer.
Table 2.
The correlations among different soil C and N parameters and sustainable yield indexes.
4. Discussion
4.1. Crop Yields Response to Plant-Derived Biomass Incorporation and N Reduction
For nearly five decades, rice yields have increased and are maintained at a high level globally through modified crop varieties and the large supply of mineral fertilizer [31,32]. Indeed, the inputs of mineral fertilizers resulted in a 59.9~132.4% increase in rice yields in combination with the incorporation of plant-derived biomass in the present study (Figure 1). However, the large inputs of mineral fertilizer will not only maintain high rice yields but also lead to a serious loss of nutrients resulting in water eutrophication and a serious decline in SOC level and nutrient supply, which is not conducive to sustainable rice production [6,33]. Plant-derived biomass, mainly reflected in rice straw in paddy field, occupies more than half of the net primary productivity of rice [19]. The incorporation of plant-derived biomass can enrich SOM, increase soil available nutrients, stimulate microbial activity, elevate macro-aggregate percentage, and enhance porosity, which are vitally beneficial for maintaining soil quality and promoting soil productivity [34,35,36]. Previous studies have also shown that the incorporation of plant-derived biomass can moderate soil temperature, facilitating root and plant growth, and thus contribute to an increase in grain yields [19,37,38]. Furthermore, the incorporation of CMV residues could significantly increase rice yields by 5.6% under CMV-IF relative to the WF-IF in 2025, while showing no obvious differences between CMV-IF and WF-IF in other years (Figure 1). It is worth noting that rice yields could be maintained under the co-incorporation of both rice straw and CMV residues even with 20~30% reductions in N application rate (Figure 1). This phenomenon could be due to the substitute for partial chemical fertilizers, especially N fertilizers, by incorporating CMV residues into the soils [11,39]. As a common winter leguminous green manure in rice paddies, the CMV can provide amounts of N to paddy soils through biological N fixation, thus enhancing the N supply capacity of the soil to subsequent rice [10,40]. Furthermore, the SYI values were higher by 85.0~90.4% under WF-IF, CMV-IF, CMV-MIF, and CMV-LIF relative to the CK, and no significant differences were found among WF-IF, CMV-IF, CMV-MIF, and CMV-LIF (Figure 2). These results indicate that the co-incorporation of both rice straw and CMV residues are promising for rice production when considering higher yields under N reduction.
4.2. Responses of SOC and TN Sequestration to Plant-Derived Biomass Return and N Reduction
Organic amendments have been advocated and practiced to increase the soil in C and N pools, and to enhance soil fertility and soil productivity [10,12]. Our results showed that returning the residues of rice and CMV could significantly increase the contents of soil organic C and N fractions (Figure 3, Figure 4, Figure 5, Figure 6, Figure 7 and Figure 8). This finding is consistent with the results from previous field studies [8,9,23]. Several long-term studies have revealed a positive correlation between SOC increase and the inputs of plant-derived biomass [11,13,41]. The returns of plant-derived biomass can not only contribute directly to the soil C input, but also indirectly increase it in the forms of higher subsequent plant-derived biomass, such as roots, root exudates, and aboveground plant biomass returned to the soil [10]. In addition, the returned plant-derived biomass is an important source of soil N, P, and K, which can reduce N, P, and K limitations on plant growth and SOC building, especially under treatments with the incorporation of green manure, such as CMV [42,43]. The CMV-IF increased the contents of SOC and TN by 11.4% and 12.2% in the 0–20 cm layer, and by 16.4% and 10.8% in the 20–40 cm layer, respectively, relative to the WF-IF (Figure 3a–d). Meanwhile, the SOC and TN stock under CMV-IF increased by 12.6% and 11.4% throughout the 0–40 cm soil layer, relative to the WF-IF (Figure 4c,f). These increases are higher than the observations of Poeplau and Don [44] and Jian et al. [45], who reported that SOC stocks increased by 0.32~0.37 Mg C ha−1 yr−1 (0–20 cm) for upland soils with green manure based on the global meta-analysis. Previous studies have also shown that the physical fractionation of SOC and the C contents in the light fractions of SOC could significantly increase with green manure [23,46]. This phenomenon could also be due to the relative higher microbial activity from CMV’s low C:N ratio (32:1), which could promote the transformation of SOC and TN from plant-derived biomass [27,28]. In addition, this phenomenon might result in the low decomposition rate of plant-derived residues under flooding and anaerobic conditions in paddy systems, which could increase the formation of water-stable aggregate fractions and the intra-aggregate SOC sequestration, thus enhanced SOC stock [34,47]. Furthermore, the incorporation of green manure could increase the abundance, activity, and diversity of soil microorganisms, especially the relative abundance of actinomyces, which play important roles in the cycling of soil carbon and N [11,48,49].
In the present study, the stocks of SOC and TN were not remarkably different among the treatments of CMV-IF, CMV-MIF, and CMV-LIF, although they gradually decreased with the decrease in N application rate under the co-incorporation of rice and CMV residues throughout the 0–40 cm soil layer (Figure 4a–f). In addition, the enhancements of SOC and TN stocks under CMV-LIF were obviously higher than those under CK and WF-IF throughout the 0–40 cm soil layer (Figure 5). These results indicated that the co-incorporation of rice and CMV residues has remarkable improvement effects on the enhancements of SOC and TN stocks even under N reduction. This result is consistent with the observation of Zhang et al. [50], who used a location-fixed field experiment to show that long-term utilization of CMV to substitute partial chemical-N fertilizer simultaneously improving crop productivity and soil quality, mainly reflected in the maintenance and enhancement of SOC and TN in paddy soils. Based on long-term experiments, Gao et al. [11] found the co-incorporation of rice and CMV residues could improve the SOC and TN of paddy soils by 3.95~4.15 and 1.22~1.74%, and the inputs of chemical fertilizers could decrease 20~40% without compromising the rice yields. Similar results were also found by Zhang et al. [51,52]. Therefore, technological advancements of field management strategies, such as the optimized Chinese milk vetch-rice rotation with the co-incorporation of rice and CMV residues and 70~80% of recommended N dose, are promising for rice production when considering higher rice yields and SOC and TN enhancements in the middle and lower reaches of the Yangtze River Basin.
4.3. Responses of Soil Active C and N Fractions to Plant-Derived Biomass Return and N Reduction
Compared to the CK, the CMV-IF significantly increased the AOC content by 71.0% and 421.9% in the 0–20 and 20–40 cm soil layers, respectively, while they were 37.0% and 302.5% under WF-IF in the 0–20 and 20–40 cm soil layers, respectively (Figure 8). These variations could be primarily attributed to the greater inputs of CMV-derived C under CMV-IF, which is consistent with results from previous field studies [2,28]. Yu et al. [29] found soil AOC and active N were significantly increased by 27.0~42.6% under the 10-year application of organic materials, such as the incorporation of CMV, rice residues and pig manure, relative to that under recommended N fertilization. Another possible reason could be that the co-incorporation of rice and CMV residues promotes rice growth, and increases root exudates and litter fall residues, which is conducive to the propagation of soil microorganisms, and thereby facilitate the build-up of C and N fractions [48,53]. The present study showed that the co-incorporation of rice and CMV residues with N fertilization, even under N reduction, significantly increased the soil DOC, MBC, and MBN (Figure 6 and Figure 7). This outcome occurred because the co-incorporation of Rice and CMV residues along with chemical fertilizer ameliorated the soil physicochemical properties, and thus, enhanced the absorption and utilization of inorganic N by the rice. Indeed, the co-incorporation of rice and CMV residues facilitated the conversion of inorganic N to MBN and other organic N forms [54]. The co-incorporation of CMV and chemical fertilizers regulated soil microbial community functional gene structure, which accelerated mineralization and assimilatory nitrate reduction and inhibited nitrification, supporting the conversion of inorganic N to organic N forms and the short-time scale positive N priming effects in paddy soils [55].
The ratio of MBC/SOC, known as the microbial quotient (qMB), can sufficiently reflect the proportion of AOC in the soil [56]. This ratio reveals the difference in soil fertility from the perspective of microbiology and can be used as a good indicator for gauging SOC dynamics and soil quality. In general, the range of soil MBC/SOC ratio is 1~4% and can be enhanced by the inputs of organic materials [57]. As shown in Table 1, the MBC/SOC ratios in the 0–20 cm soil layer were 4.48% and 5.47% under CK and WF-IF, respectively, while it was up to 6.14 under CMV-IF (Table 1). This result indicated that the MBC/SOC ratio can be significantly enhanced by the co-incorporation of rice and CMV residues and that the CMV-IF was beneficial to the improvement of soil quality. The ratio of MBC/MBN can reflect the characteristics of soil microbial community structure [27]. Previous studies have shown that the C/N ratios in fungi, actinomycetes, and bacteria were 10:1, 6:1, and 5:1, respectively [58]. In the present study, the ratio of MBC/MBN was significantly reduced from 8.95 under CK to 7.77 under CMV-IF in the 0–20 cm soil layer, and from 10.84 under CK to 8.05 under CMV-IF in the 20–40 cm soil layer, respectively (Table 1). This result indicated that the abundance of actinomycetes in the soil microbial community had been increased in paddy fields with the co-incorporation of rice and CMV residues, especially in the 0–20 cm soil layer. However, with the decrease in N application, the conversion gradually slowed down due to the smaller reduction in MBC/MBN ratio throughout the 0–40 cm soil layer (Table 1). Previous studies have also shown that SOM consisted mostly of plant residues when the SOC/TN ratio was approaching 20, while the primary components of SOM were humic substances, including lignin and aromatic substances when the SOC/TN ratio came near to 10 [26]. As shown in Table 1, the SOC/TN ratios were reduced to some extent, especially under the treatments with the co-incorporation of rice and CMV residues in the 0–20 cm soil layer, which indicated that with the co-incorporation of rice and CMV residues, the SOM was gradually converted into humic substances, easily and tightly bound to the clay particles in small soil aggregates, which facilitated the construction of a high-quality plow layer [1,23,46]. However, the SOC/TN ratios were increased with the significant increments of soil carbon and N fractions in the 20–40 cm soil layer, even when reducing N application rate (Table 1, Figure 3, Figure 4, Figure 5, Figure 6, Figure 7 and Figure 8), indicating that the plant-derived carbon and N could be sequestered in the 20–40 cm soil layer, and thus could ameliorate the plow soil.
5. Conclusions
The co-incorporation of rice and Chinese milk vetch (CMV) residues may enhance grain yields, sustainable yield index (SYI), soil organic carbon (SOC), total nitrogen (TN) sequestration, and increase the SOC and N fraction contents, even under reduced chemical-N application. The highest grain yields (10.19 Mg hm−2) and SYI (0.844) were observed in the Chinese milk vetch-rice rotation combined with the co-incorporation of rice and CMV residues under recommended N fertilization (CMV-IF), with no significant differences observed among CMV-IF, 20% and 30% N reduction based on CMV-IF (CMV-MIF and CMV-LIF). Relative to the control (CK), the CMV-IF significantly increased SOC and TN stocks in the entire 0–40 cm soil layer by 26.3% and 26.4%, respectively, while showing a significant increase of 16.3% and 20.4%, respectively, compared to initial values. Throughout the entire 0–40 cm soil layer, the CMV-IF exhibited the highest levels of soil active organic carbon (AOC) and active total nitrogen (ATN), followed by CMV-MIF, CMV-LIF, WF-IF, and CK. Microbial biomass C (MBC) and microbial biomass N (MBN) constituted the primary components of soil AOC and ATN, respectively. The co-incorporation of rice and CMV residues increased the ratios of soil MBC, dissolved organic C (DOC), and AOC to SOC, as well as the ratios of MBN, dissolved total N (DTN), and ATN to TN, while decreasing the MBC/MBN ratio, even under reduced chemical-N application. Therefore, the co-incorporation of rice and CMV residues, coupled with 70~80% recommended N fertilization, proves beneficial in improving soil fertility in paddy soils, demonstrating great potential for sustainable rice production in the middle and lower reaches of the Yangtze River Basin and other regions with similar environmental conditions worldwide. However, it should be emphasized that the above considerations are based on a three-year experimental study, and a more in depth and long-term evaluation of these management strategies, especially in terms of economic benefits and greenhouse gas emissions, is needed to verify this claim.
Author Contributions
Conceptualization, Y.H. and Z.S.; data curation, Y.H. and S.W.; formal analysis, Z.W. and C.G.; funding acquisition, Y.H., Z.S. and Z.W.; investigation, Y.H., S.W. and C.G.; methodology, Z.W., H.L. and S.L.; validation, C.G.; project administration, Z.S. and S.L.; resources, C.G. and H.L.; supervision, S.L. and H.L.; visualization, S.W.; writing—original draft, Y.H. and Z.W.; writing—review and editing, H.L., Z.S. and S.L. All authors have read and agreed to the published version of the manuscript.
Funding
This research was funded by the National Key Research and Development Program of China (2023 YFD1902300), National Natural Science Foundation of China (42207393), and Central Guiding Local Science and Technology Development Foundation of Hebei Province (No. 226 Z4202 G).
Data Availability Statement
The original contributions presented in the study are included in the article, further inquiries can be directed to the corresponding author.
Conflicts of Interest
Authors Shanshan Wang and Chunyang Gu were employed by the company Anhui Tianjian Yun Biotechnology Co., Ltd. The remaining authors declare that the research was conducted in the absence of any commercial or financial relationships that could be construed as a potential conflict of interest.
References
- Lal, R. Digging deeper: A holistic perspective of factors affecting soil organic carbon sequestration in agroecosystems. Glob. Change Biol. 2018, 24, 3285–3301. [Google Scholar] [CrossRef]
- Chaudhary, S.; Dheri, G.S.; Brar, B.S. Long-term effects of NPK fertilizers and organic manures on carbon stabilization and management index under rice-wheat cropping system. Soil Tillage Res. 2017, 166, 59–66. [Google Scholar] [CrossRef]
- Mortensen, E.Ø.; De Notaris, C.; Peixoto, L.; Olesen, J.E.; Rasmussen, J. Short-term cover crop carbon inputs to soil as affected by long-term cropping system management and soil fertility. Agric. Ecosyst. Environ. 2021, 311, 107339. [Google Scholar] [CrossRef]
- Neumann, D.; Heuer, A.; Hemkemeyer, M.; Martens, R.; Tebbe, C.C. Importance of soil organic matter for the diversity of microorganisms involved in the degradation of organic pollutants. ISME J. 2014, 8, 1289–1300. [Google Scholar] [CrossRef] [PubMed]
- Rumpel, C.; Amiraslani, F.; Koutika, L.S.; Smith, P.; Whitehead, D.; Wollenberg, E. Put more carbon in soils to meet Paris climate pledges. Nature 2018, 564, 32–34. [Google Scholar] [CrossRef]
- Song, H.J.; Park, S.Y.; Chae, H.G.; Kim, P.J.; Lee, J.G. Benefits of organic amendments on soil C stock may be offset by increased methane flux in rice paddy field. Agric. Ecosyst. Environ. 2024, 359, 108742. [Google Scholar] [CrossRef]
- Liu, Y.; Evans, S.E.; Friesen, M.L.; Tiemann, L.K. Root exudates shift how N mineralization and N fixation contribute to the plant-available N supply in low fertility soils. Soil Biol. Biochem. 2022, 165, 108541. [Google Scholar] [CrossRef]
- Chen, X.; Hu, Y.; Xia, Y.; Zheng, S.; Ma, C.; Rui, Y.; He, H.; Huang, D.; Zhang, Z.; Ge, T.; et al. Contrasting pathways of carbon sequestration in paddy and upland soils. Glob. Change Biol. 2021, 27, 2478–2490. [Google Scholar] [CrossRef]
- Kamran, M.; Huang, L.; Nie, J.; Geng, M.; Lu, Y.; Liao, Y.; Zhou, F.; Xu, Y. Effect of reduced mineral fertilization (NPK) combined with green manure on aggregate stability and soil organic carbon fractions in a fluvo-aquic paddy soil. Soil Tillage Res. 2021, 211, 105005. [Google Scholar] [CrossRef]
- Dannehl, T.; Leithold, G.; Brock, C. The effect of C:N ratios on the fate of carbon from straw and green manure in soil. Eur. J. Soil Sci. 2017, 68, 988–998. [Google Scholar] [CrossRef]
- Gao, S.J.; Li, S.; Zhou, G.; Cao, W. The potential of green manure to increase soil carbon sequestration and reduce the yield-scaled carbon footprint of rice production in southern China. J. Integr. Agric. 2023, 22, 2233–2247. [Google Scholar] [CrossRef]
- Qiao, J.; Zhao, D.; Zhou, W.; Yan, T.; Yang, L. Sustained rice yields and decreased N runoff in a rice-wheat cropping system by replacing wheat with Chinese milk vetch and sharply reducing fertilizer use. Environ. Pollut. 2021, 288, 117722. [Google Scholar] [CrossRef]
- Ma, J.; Wang, T.; Liu, X.; Wang, L.; Zhang, X.; Wang, W.; Kong, F.; Huang, X.; Wang, Z.; Wang, Y.; et al. Meta-analysis of yield effects and influencing factors of cover crops on main grain crops in China. Sci. Agric. Sin. 2023, 56, 1871–1880. [Google Scholar] [CrossRef]
- Fang, C.; Gao, Y.; Zhang, J.; Lu, Y.; Liao, Y.; Xie, X.; Xiao, L.; Yu, Z.; Liu, F.; Yuan, H.; et al. Combined utilization of Chinese milk vetch, rice straw, and lime reduces soil available Cd and Cd accumulation in rice grains. Agronomy 2023, 13, 910. [Google Scholar] [CrossRef]
- Wang, J.; Wang, X.; Xu, M.; Feng, G.; Zhang, W.; Lu, C. Crop yield and soil organic matter after long-term straw return to soil in China. Nutr. Cycl. Agroecosyst. 2015, 102, 371–381. [Google Scholar] [CrossRef]
- Layek, J.; Das, A.; Ghosh, P.K.; Rangappa, K.; Lal, R.; Idapuganti, R.G.; Nath, C.P.; Dey, U. Double no-till and rice straw retention in terraced sloping lands improves water content, soil health and productivity of lentil in Himalayan foothills. Soil Tillage Res. 2022, 221, 105381. [Google Scholar] [CrossRef]
- Hu, N.; Wang, B.; Gu, Z.; Tao, B.; Zhang, Z.; Hu, S.; Zhu, L.; Meng, Y. Effects of different straw returning modes on greenhouse gas emissions and crop yields in a rice–wheat rotation system. Agric. Ecosyst. Environ. 2016, 223, 115–122. [Google Scholar] [CrossRef]
- Ma, Y.; Liu, D.L.; Schwenke, G.; Yang, B. The global warming potential of straw-return can be reduced by application of straw-decomposing microbial inoculants and biochar in rice-wheat production systems. Environ. Pollut. 2019, 252, 835–845. [Google Scholar] [CrossRef]
- Sharma, A.; Singh, G.; Arya, S.K. Biofuel from rice straw. J. Clean. Prod. 2020, 277, 124101. [Google Scholar] [CrossRef]
- Huang, J.; Liu, R.; Wang, Q.; Gao, X.; Han, Z.; Gao, J.; Gao, H.; Zhang, S.; Wang, J.; Zhang, L.; et al. Climate factors affect N2O emissions by influencing the migration and transformation of nonpoint source nitrogen in an agricultural watershed. Water Res. 2022, 223, 119028. [Google Scholar] [CrossRef]
- Liao, J.; Luo, Q.; Hu, A.; Wan, W.; Tian, D.; Ma, J.; Ma, T.; Luo, H.; Lu, S. Soil moisture–atmosphere feedback dominates land N2O nitrification emissions and denitrification reduction. Glob. Change Biol. 2022, 28, 6404–6418. [Google Scholar] [CrossRef]
- Kalbitz, K.; Schwesig, D.; Schmerwitz, J.; Kaiser, K.; Haumaier, L.; Glaser, B.; Ellerbrock, R.; Leinweber, P. Changes in properties of soil-derived dissolved organic matter induced by biodegradation. Soil Biol. Biochem. 2003, 35, 1129–1142. [Google Scholar] [CrossRef]
- Li, G.; Tang, X.; Hou, Q.; Li, T.; Xie, H.; Lu, Z.; Zhang, T.; Liao, Y.; Wen, X. Response of soil organic carbon fractions to legume incorporation into cropping system and the factors affecting it: A global meta-analysis. Agric. Ecosyst. Environ. 2023, 342, 108231. [Google Scholar] [CrossRef]
- Raiesi, F. The quantity and quality of soil organic matter and humic substances following dry-farming and subsequent restoration in an upland pasture. Catena 2021, 202, 105249. [Google Scholar] [CrossRef]
- Yang, J.; Wang, J.; Li, A.; Li, G.; Zhang, F. Disturbance, carbon physicochemical structure, and soil microenvironment codetermine soil organic carbon stability in oilfields. Environ. Int. 2020, 135, 105390. [Google Scholar] [CrossRef] [PubMed]
- Leno, N.; Ajayan, A.S.; Thampatti, K.C.M.; Sudharmaidevi, C.R.; Aparna, B.; Gladis, R.; Rani, T.S.; Joseph, B.; Meera, A.V.; Nagula, S. Humification evaluation and carbon recalcitrance of a rapid thermochemical digestate fertiliser from degradable solid waste for climate change mitigation in the tropics. Sci. Total Environ. 2022, 849, 157752. [Google Scholar] [CrossRef] [PubMed]
- Gao, D.; Bai, E.; Wang, S.; Zong, S.; Liu, Z.; Fan, X.; Zhao, C.; Hagedorn, F. Three-dimensional mapping of carbon, nitrogen, and phosphorus in soil microbial biomass and their stoichiometry at the global scale. Glob. Change Biol. 2022, 28, 6728–6740. [Google Scholar] [CrossRef]
- Hou, Q.; Ni, Y.; Huang, S.; Zuo, T.; Wang, J.; Ni, W. Effects of substituting chemical fertilizers with manure on rice yield and soil labile nitrogen in paddy fields of China: A meta-analysis. Pedosphere 2023, 33, 172–184. [Google Scholar] [CrossRef]
- Yu, Q.; Hu, X.; Ma, J.; Ye, J.; Sun, W.; Wang, Q.; Lin, H. Effects of long-term organic material applications on soil carbon and nitrogen fractions in paddy fields. Soil Tillage Res. 2020, 196, 104483. [Google Scholar] [CrossRef]
- Ghosh, S.; Wilson, B.; Ghoshal, S.; Senapati, N.; Mandal, B. Organic amendments influence soil quality and carbon sequestration in the Indo-Gangetic plains of India. Agric. Ecosyst. Environ. 2012, 156, 134–141. [Google Scholar] [CrossRef]
- Laborte, A.G.; de Bie, K.C.; Smaling, E.M.; Moya, P.F.; Boling, A.A.; Van Ittersum, M.K. Rice yields and yield gaps in Southeast Asia: Past trends and future outlook. Eur. J. Agron. 2012, 36, 9–20. [Google Scholar] [CrossRef]
- Zhang, Q.; Chu, Y.; Xue, Y.; Ying, H.; Chen, X.; Zhao, Y.; Ma, W.; Ma, L.; Zhang, J.; Yin, Y.; et al. Outlook of China’s agriculture transforming from smallholder operation to sustainable production. Glob. Food Secur. 2020, 26, 100444. [Google Scholar] [CrossRef]
- Lv, J.; Zhang, X.; Sha, Z.; Li, S.; Chen, X.; Chen, Y.; Liu, X. Mitigation of reactive nitrogen loss from arable soils through microbial inoculant application: A meta-analysis. Soil Tillage Res. 2024, 235, 105883. [Google Scholar] [CrossRef]
- Chen, P.; Xu, J.; Zhang, Z.; Wang, K.; Li, T.; Wei, Q.; Li, Y. Carbon pathways in aggregates and density fractions in Mollisols under water and straw management: Evidence from 13C natural abundance. Soil Biol. Biochem. 2022, 169, 108684. [Google Scholar] [CrossRef]
- Lucas, M.; Santiago, J.P.; Chen, J.; Guber, A.; Kravchenko, A. The soil pore structure encountered by roots affects plant-derived carbon inputs and fate. New Phytol. 2023, 240, 515–528. [Google Scholar] [CrossRef]
- Li, T.; Li, G.; Lu, Z.; Zhao, D.; Li, Y.; Wang, Z.; Wen, X.; Liao, Y. Crop diversification increases soil extracellular enzyme activities under no tillage: A global meta-analysis. Soil Tillage Res. 2024, 235, 105870. [Google Scholar] [CrossRef]
- Wang, W.; Wang, W.; Wang, P.; Wang, X.; Wang, L.; Wang, C.; Zhang, C.; Huo, Z. Impact of straw return on soil temperature and water during the freeze-thaw period. Agric. Water Manag. 2023, 282, 108292. [Google Scholar] [CrossRef]
- Wang, L.; Lu, P.; Feng, S.; Hamel, C.; Sun, D.; Siddique, K.H.; Gan, G.Y. Strategies to improve soil health by optimizing the plant–soil–microbe–anthropogenic activity nexus. Agric. Ecosyst. Environ. 2024, 359, 108750. [Google Scholar] [CrossRef]
- Wang, H.; Tang, S.; Han, S.; Li, M.; Cheng, W.; Bu, R.; Cao, W.; Wu, J. Effects of long-term substitution of chemical fertilizer with Chinese milk vetch on soil phosphorus availability and leaching risk in the double rice systems of Eastern China. Field Crop. Res. 2023, 302, 109047. [Google Scholar] [CrossRef]
- Zhou, G.; Gao, S.; Chang, D.; Rees, R.M.; Cao, W. Using milk vetch (Astragalus sinicus L.) to promote rice straw decomposition by regulating enzyme activity and bacterial community. Bioresour. Technol. 2021, 319, 124215. [Google Scholar] [CrossRef]
- Li, S.; Li, X.; Zhu, W.; Chen, J.; Tian, X.; Shi, J. Does straw return strategy influence soil carbon sequestration and labile fractions? Agron. J. 2019, 111, 897–906. [Google Scholar] [CrossRef]
- Stewart, C.E.; Paustian, K.; Conant, R.T.; Plante, A.F.; Six, J. Soil carbon saturation: Implications for measurable carbon pool dynamics in long-term incubations. Soil Biol. Biochem. 2009, 41, 357–366. [Google Scholar] [CrossRef]
- Liu, J.; Qiu, T.; Peñuelas, J.; Sardans, J.; Tan, W.; Wei, X.; Cui, Y.; Cui, Q.; Wu, C.; Liu, L.; et al. Crop residue return sustains global soil ecological stoichiometry balance. Glob. Change Biol. 2023, 29, 2203–2226. [Google Scholar] [CrossRef]
- Poeplau, C.; Don, A. Carbon sequestration in agricultural soils via cultivation of cover crops—A meta-analysis. Agric. Ecosyst. Environ. 2015, 200, 33–41. [Google Scholar] [CrossRef]
- Jian, J.S.; Du, X.; Reiter, M.S.; Stewart, R.D. A meta-analysis of global cropland soil carbon changes due to cover cropping. Soil Biol. Biochem. 2020, 143, 107735. [Google Scholar] [CrossRef]
- Nascente, A.S.; Li, Y.C.; Crusciol, C.A.C. Cover crops and no-till effects on physical fractions of soil organic matter. Soil Tillage Res. 2013, 130, 52–57. [Google Scholar] [CrossRef]
- Liu, X.; Song, X.; Li, S.; Liang, G.; Wu, X. Understanding how conservation tillage promotes soil carbon accumulation: Insights into extracellular enzyme activities and carbon flows between aggregate fractions. Sci. Total Environ. 2023, 897, 165408. [Google Scholar] [CrossRef]
- Kim, N.; Zabaloy, M.C.; Guan, K.; Villamil, M.B. Do cover crops benefit soil microbiome? A meta-analysis of current research. Soil Biol. Biochem. 2020, 142, 107701. [Google Scholar] [CrossRef]
- Gao, S.; Cao, W.; Zhou, G.; Rees, R.M. Bacterial communities in paddy soils changed by milk vetch as green manure: A study conducted across six provinces in South China. Pedosphere 2021, 31, 521–530. [Google Scholar] [CrossRef]
- Zhang, J.; Nie, J.; Cao, W.; Gao, Y.; Lu, Y.; Liao, Y. Long-term green manuring to substitute partial chemical fertilizer simultaneously improving crop productivity and soil quality in a double-rice cropping system. Eur. J. Agron. 2023, 142, 126641. [Google Scholar] [CrossRef]
- Zhang, W.; Wu, Y.; Xu, F.; Qin, Y.; Chen, H.; Wang, L.; Hu, M.; Li, S. The co-incorporation of rice straw and Chinese milk vetch enhances soil carbon retention by regulating the transformation of labile organic carbon fractions in paddy fields. Eur. J. Agron. 2025, 171, 127810. [Google Scholar] [CrossRef]
- Zhang, Y.; Zhang, W.; Xu, F.; Qin, Y.; Chen, H.; Wu, Y.; Li, S. Achieving the goal of the “4‰ initiative” and agricultural sustainability by co-incorporating rice straw and Chinese milk vetch for rice production in southern China. Geoderma 2025, 458, 117333. [Google Scholar] [CrossRef]
- Berenstecher, P.; Conti, G.; Faigón, A.; Piñeiro, G. Tracing service crops’ net carbon and nitrogen rhizodeposition into soil organic matter fractions using dual isotopic brush-labeling. Soil Biol. Biochem. 2023, 184, 109096. [Google Scholar] [CrossRef]
- Ladha, J.K.; Peoples, M.B.; Reddy, P.M.; Biswas, J.C.; Bennett, A.; Jat, M.L.; Krupnik, T.J. Biological nitrogen fixation and prospects for ecological intensification in cereal-based cropping systems. Field Crop. Res. 2022, 283, 108541. [Google Scholar] [CrossRef]
- Xiang, X.; Adams, J.M.; Qiu, C.; Qin, W.; Chen, J.; Jin, L.; Xu, C.; Liu, J. Nutrient improvement and soil acidification inducing contrary effects on bacterial community structure following application of hairy vetch (Vicia villosa Roth L.) in Ultisol. Agric. Ecosyst. Environ. 2021, 312, 107348. [Google Scholar] [CrossRef]
- Clayton, J.; Lemanski, K.; Bonkowski, M. Shifts in soil microbial stoichiometry and metabolic quotient provide evidence for a critical tipping point at 1% soil organic carbon in an agricultural post-mining chronosequence. Biol. Fert. Soils 2021, 57, 435–446. [Google Scholar] [CrossRef]
- Jiang, H.M.; Jiang, J.P.; Jia, Y.; Li, F.M.; Xu, J.Z. Soil carbon pool and effects of soil fertility in seeded alfalfa fields on the semi-arid Loess Plateau in China. Soil Biol. Biochem. 2006, 38, 2350–2358. [Google Scholar] [CrossRef]
- Singh, J.S.; Gupta, V.K. Soil microbial biomass: A key soil driver in management of ecosystem functioning. Sci. Total Environ. 2018, 634, 497–500. [Google Scholar] [CrossRef] [PubMed]
Disclaimer/Publisher’s Note: The statements, opinions and data contained in all publications are solely those of the individual author(s) and contributor(s) and not of MDPI and/or the editor(s). MDPI and/or the editor(s) disclaim responsibility for any injury to people or property resulting from any ideas, methods, instructions or products referred to in the content. |
© 2025 by the authors. Licensee MDPI, Basel, Switzerland. This article is an open access article distributed under the terms and conditions of the Creative Commons Attribution (CC BY) license.