Abstract
Accurate evaluation of plant-available phosphorus (P) in flooded paddy soils requires consideration of redox dynamics and soil-specific properties. This study evaluated five soil P extraction methods, such as Truog, Bray 2, Mehlich 3, Olsen, and ascorbic acid-reduced Bray 2 (AR Bray 2), using soils collected from 20 paddy fields in a cold region of Japan that have received long-term fertilization. All four methods, except AR Bray 2, were conducted under air-dried and flooded incubation conditions. Additionally, we conducted pot experiments with the two rice cultivars to measure P uptake. Bray 2 extracted the highest amount of P (543.6–1045.4 mg P kg−1). Incubation increased extractable P by factors of 2.4–4.9 with the Mehlich 3 and Truog methods, indicating enhanced P solubility under reduced conditions. The Olsen method showed minimal sensitivity to redox changes (−31.4 mg P kg−1). Principal component and cluster analyses suggested three patterns of soil P behavior under changing redox conditions: (1) stable P extractability regardless of redox status; (2) increased P availability after incubation; and (3) P extractability depending on the extraction method used. These patterns were not explained by regional or taxonomic classifications. A comparison of soil extractions and P uptake indicated that no single method consistently predicted shoot P concentrations across all soils, suggesting that conventional P extraction methods may have limited ability in long-term fertilized paddy soils. Our findings demonstrate that soil-specific redox behavior and cultivar-specific P demand critically influence the effectiveness of standard P tests. Therefore, selecting diagnostic methods tailored to soil characteristics and crop requirements is essential for accurate P evaluation and sustainable fertilizer management in rice cultivation.
1. Introduction
Phosphorus (P) is an essential macronutrient that plays a critical role in plant physiological processes, such as nucleic acid synthesis, membrane formation, and energy metabolism, and it constitutes up to 0.2% of plant dry weight [1,2]. P deficiency is a widespread constraint on crop productivity, potentially reducing yield by 5–15% [3]. In rice, the typical deficiency symptoms include stunted growth, reduced tillering, dark green leaves, thin stems, delayed maturity, and poor grain quality [4]. For optimal growth, rice plants require between 1.8 and 4.2 kg P per ton of grain yield, with a widely cited average value of 2.8 kg P [5,6]. This wide range of optimal growth rates may be attributed to differences in cultivars, soil conditions, management, and environmental backgrounds.
This is particularly critical in regions like northern Japan, where early rice growth is frequently restricted by low temperatures, which limit P uptake and delay development [7]. Historically, large amounts of P fertilizer have been applied to mitigate this issue, especially in such regions, contributing to improved early growth and yields [8]. However, when P supply exceeds crop demand, a substantial portion of the applied P becomes fixed in the soil through interactions with iron and aluminum oxides, and organic matter, leading to its long-term accumulation rather than complete plant uptake. Consequently, rice cultivation in Japan consumes approximately 30% of the nation’s total P fertilizer input [9,10,11]. Therefore, excessive P in the soil has become a concern, with many rice fields exceeding the recommended P levels based on the Truog and Bray 2 methods, which are commonly used to evaluate available P in Japan [12,13], including Yamagata Prefecture [14]. Yamagata Prefecture was selected for this study because it is one of Japan’s major rice-producing regions and is representative of cold-climate paddy fields in northern Japan. To ensure sustainable fertilizer use, it is increasingly important to evaluate plant-available P in paddy fields and adjust inputs accordingly.
P availability in soils is governed by complex interactions between mineral phases, organic matter, and other environmental factors. Although soil solution P concentrations are typically low (0.01–3 mg L−1), plant uptake is sustained through continuous resupply from labile solid-phase P pools [15,16]. Available P, which is a plant-available fraction, is commonly evaluated using various chemical extraction methods [16,17]. However, because of the high variability in soil properties, no single method is universally applicable and multiple extractants are often used, even in a single country [18,19]. Nevertheless, in practice, extraction methods have been largely standardized around a few representative types: the Truog method, which is widely used in Japan, targets Ca- and Mg-bound P under acidic conditions [20]; the Bray 2 method targets P associated with Ca, Al, and partially Fe [21]; the Mehlich 3 method extracts Ca-, Al-, and Fe-bound P using a multicomponent solution [22]; and the Olsen method, suitable for alkaline soils, primarily extracts Ca-bound P [23,24]. These methods are not directly comparable owing to the differences in the target P fractions [25]. In other words, the amount of available P determined by each method is difficult to compare directly because each extractant targets different soil P pools. Several recent studies have further elucidated the theoretical basis and limitations of these methods under diverse conditions (e.g., calcareous, acidic, flooded), such as soil-specific competition effect, comparative evaluations in organic and flooded soils [26,27], as well as Fe-bound P mobilization dynamics influenced by redox status in flooded soils [28,29]. Our work builds on these foundations by explicitly assessing extraction method sensitivity under varying redox conditions and cultivar-specific P demand in flooded paddy soils.
In paddy fields, recent efforts to refine soil P testing have emphasized the need to integrate redox-dependent dynamics driven by microbial activity and changing water regimes, particularly in flooded systems. Under reduced conditions, iron oxides undergo reductive dissolution, releasing Fe-bound P into the soil solution and substantially increasing P availability compared to aerobic conditions. These processes are central to P dynamics in submerged soils and must be considered when evaluating plant-available [30]. Additionally, notable attempts have been made to evaluate the P release potential of paddy soils [31]. Previous studies have developed chemical extraction methods specifically for paddy soils using Fe-reducing or chelating agents to better capture P availability under submerged conditions [30]. These approaches highlight the importance of considering redox-driven processes when selecting diagnostic methods for rice systems. Standard extraction methods may not reflect the solubilization of Fe-bound P under reduced conditions, which is common in paddy soils. Incubation-based methods that simulate submergence have provided valuable insights [32] but are time-consuming and labor-intensive. As an alternative, chemically reduced methods, such as ascorbic acid-reduced Bray 2 (AR Bray 2), offer a practical approach. This method has shown strong agreement with incubation-based extractions [33] and a high correlation with P extracted using the Bray 2 method after incubation (r = 0.92), supporting the potential of AR Bray 2 as a diagnostic tool for air-dried samples under reduced conditions [25].
In this study, we collected soils from 20 paddy fields and determined plant-available P using multiple extraction methods under both air-dried and flooded incubation conditions. The flooded incubation was intended to simulate the submerged environment that occurs in rice paddy fields. In addition, pot experiments using the same soils were conducted to estimate plant P content up to the heading stage, when P demand is highest. We hypothesized that the diagnostic reliability of P extraction methods varies with redox status, and that integrating soil extraction results with plant responses would improve the evaluation of the diagnostic performance of various extraction methods in cold-climate regions such as northern Japan. Accordingly, this study focuses on method applicability boundaries under high P conditions, rather than identifying a universally optimal method. Paddy fields in this area have typically received long-term fertilization and exhibit relatively high levels of plant-available P. This study was designed to provide conceptual insights that may contribute to improved P fertilizer management in such high P conditions rather than evaluating fertilizer practices directly under field conditions. The pot experiments were intended to assess the relationship between soil P availability and plant P content under controlled conditions, without examining yield responses to different fertilizer application rates. Therefore, the implications of our findings should be interpreted as method-specific strengths and limitations within the targeted high P conditions.
2. Materials and Methods
2.1. Study Site and Tested Soil Properties
Soil samples were collected from 20 paddy fields across four major rice-producing regions in the Yamagata Prefecture, Japan: Shonai, Mogami, Murayama, and Okitama (Figure 1). In each region, five fields representing typical paddy soils were selected. Candidate sampling areas were first identified by reviewing maps to maintain spatial intervals, and in each candidate area, permission was obtained from farmers after confirming their typical cultivation practices. Soil sampling was conducted in the tilled paddy fields in September and October 2023. Surface soil samples (0–15 cm) were collected from each field at five diagonally arranged points, including the center, and then composited into a single sample for each field. According to climate data from the Japan Meteorological Agency [34], the average annual temperatures in Shonai, Mogami, Murayama, and Okitama were 12.9 °C, 11.0 °C, 12.1 °C, and 11.4 °C, respectively [34]. The average temperature in May, when rice transplanting typically occurs, was 16.0 °C in Shonai, 11.1 °C in Mogami, 16.2 °C in Murayama, and 15.6 °C in Okitama. During the rice-growing season (May to September), the mean temperatures were 21.3 °C, 20.2 °C, 21.2 °C, and 20.7 °C, respectively (Figure 2). The corresponding annual precipitation levels were 2191 mm, 2006 mm, 1207 mm, and 1445 mm, respectively. The dominant soil types at the sampling sites were classified as Fluvisols and Lixisols, based on the World Reference Base for Soil Resources [35,36]. The locations of the sampling sites are shown in Figure 1.
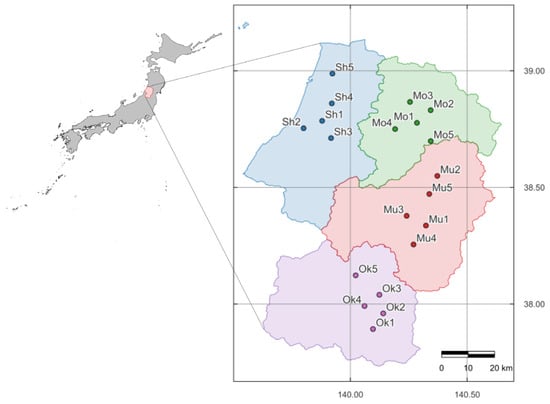
Figure 1.
Map of Japan showing the Yamagata Prefecture highlighted in white against a gray background. The inset shows an enlarged view of Yamagata Prefecture with the sampling sites indicated. Soil samples are labeled by regional codes (Sh: Shonai, Mo: Mogami, Mu: Murayama, Ok: Okitama).
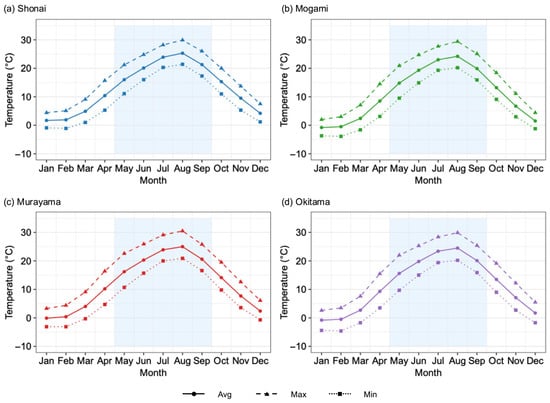
Figure 2.
Monthly trends in average, maximum, and minimum air temperatures for four regions in Yamagata Prefecture based on 30-year climatological data (1990–2020) from the Japan Meteorological Agency [34]. Ave indicates mean temperature (solid line with circles), Max indicates maximum temperature (dashed line with triangles), and Min indicates minimum temperature (dotted line with squares). The shaded area from May to September represents the rice cultivation period.
All soil samples were air-dried and passed through a 2 mm sieve. For total carbon (TC) and total nitrogen (TN) analysis, fine-ground soil samples were oven-dried at 105 °C for 24 h and analyzed using a CN analyzer (SUMIGRAPH NC-220F; Sumika Chemical Analysis Service, Osaka, Japan). For total phosphorus (TP) analysis, 5 g of air-dried fine-ground soil was digested with 1 mL of sulfuric acid, 5 mL of nitric acid, and 20 mL of perchloric acid on a hot plate at 120 °C for 3 h. After digestion, 30 mL of 1 M hydrochloric acid and 50 mL of hot water were added, and the mixture was heated immediately to below the boiling point. The supernatant was filtered, and the P concentration in the digest was determined by the vanadomolybdate method using the same spectrophotometer. Available nitrogen (N) was estimated by incubating soil samples at 30 °C for 4 weeks, extracting with 2 M KCl, and analyzing the extract colorimetrically [37]. Phosphate adsorption capacity (PAC) was determined by adding 20 mL of 2.5% ammonium phosphate solution to 10 g of air-dried soil and allowing the mixture to stand for 24 h. The suspension was filtered through a filter paper (ADVANTEC No. 5C; ADVANTEC TOYO KAISHA, Tokyo, Japan). One milliliter of the filtrate was transferred to a 50 mL volumetric flask and diluted to volume with deionized water. A 2.5 mL aliquot was used for color development using the vanadomolybdate method, and absorbance was measured with a spectrophotometer (UV-2550; Shimadzu Corporation, Kyoto, Japan). The basic soil properties are presented in Table 1.

Table 1.
Sampling site information, including geographic coordinates (latitude and longitude), soil classification, and key soil chemical properties.
2.2. Plant-Available Phosphorus Analysis
Plant-available P was determined using five extraction methods: Truog, Bray 2, Mehlich 3, Olsen, and AR Bray 2. For the Truog method, 0.001 M H2SO4 was added to air-dried soil at a 1:200 soil-to-extractant ratio, allowed to stand for 30 min, and then filtered [20]. The Bray 2 method involved adding a mixture of 0.1 M HCl and 0.03 M NH4F at a 1:20 ratio, followed by 1 min of shaking and filtration [21,38]. For the Mehlich 3 method, a mixed solution containing 0.2 M CH3COOH, 0.25 M NH4NO3, 0.015 M NH4F, 0.013 M HNO3, and 0.001 M EDTA was added at a 1:10 ratio, shaken for 5 min, and then filtered [22]. For the Olsen method, 0.5 M NaHCO3 solution (pH 8.5) was added to the soil at a 1:20 ratio, shaken for 30 min, and then filtered [23]. In the AR Bray 2 method, 10 mL of 0.057 M ascorbic acid was added to 1 g of air-dried soil, and the mixture was shaken for 16 h. Subsequently, 10 mL of double-strength Bray 2 extractant was added, and the mixture was shaken for 1 min and filtered [39]. All filtrates were analyzed for P concentration using the molybdenum blue method with a spectrophotometer (UV-2550; Shimadzu Corporation, Kyoto, Japan).
To simulate reduced conditions, soil was incubated according to a previously described method [40]. Approximately 10 g of air-dried soil was placed in an aluminum vapor-deposited pouch (LAMIZIP AL-11, 202 mm × 110 mm; Seisan Nipponsha, Tokyo, Japan) containing 100 mL of deionized water. The pouch was vacuum-sealed and incubated at 30 °C for 4 weeks. The soil incubation under flooded and vacuum-sealed conditions at 30 °C for 4 weeks is widely used as a diagnostic method for evaluating plant-available nitrogen under simulated flooded rice-growing conditions in Japan [41,42]. Additionally, previous studies have shown that soil redox potential (Eh) typically decreases to below −200 mV within several days after flooding and remains low thereafter [43,44,45,46]. Although Eh was not measured in this study, the redox status was likely shifted toward reduced conditions during incubation. After incubation, available P was extracted using the Truog, Bray 2, Mehlich 3, and Olsen methods.
2.3. Design of the Pot Experiments
Pot experiments were conducted in the experimental field of the Faculty of Agriculture, Yamagata University (38.74° N, 139.83° E), using 20 soil samples collected from four regions: Shonai, Mogami, Murayama, and Okitama. A total of 2.5 kg of air-dried soil from each site was placed in Wagner pots (1/5000 scale). Two rice cultivars were used: ‘Haenuki,’ a widely cultivated variety in Yamagata Prefecture, and ‘Tsuyahime,’ a premium-quality cultivar that has recently expanded in cultivation and is promoted under the Yamagata Prefecture certification program for reduced- or no-fertilizer cultivation [47]. Fertilization treatments followed the regional guidelines [48], except that no P was applied. Nitrogen and potassium were applied at fixed rates: 710.9 mg N and 238.6 mg K2O per pot for Haenuki, and 474.0 mg N and 159.1 mg K2O per pot for Tsuyahime. Ammonium sulfate and potassium chloride were used as sources of nitrogen and potassium, respectively. The fertilizers were mixed with air-dried soil, which was then saturated with water and thoroughly homogenized. Each treatment was replicated three times.
In both cultivars, seedlings were transplanted on 30 May 2023, and the experiments continued until the heading stage on 6 August 2023. The average air temperature during the growing period was 25.5 °C, and the average soil temperature was 24.7 °C. The average temperature in June at the experimental site was 23.4 °C, which was slightly higher than the regional averages for Shonai (20.1 °C), Mogami (19.3 °C), Murayama (20.3 °C), and Okitama (19.8 °C) (Figure 2). The pots were maintained under continuously flooded conditions, and standard practices were followed for weed and pest control. Because P uptake intensifies after root establishment and peaks around heading and flowering, this stage was considered optimal for our measurements. At this stage, the aboveground biomass was harvested, oven-dried at 75 °C for 48 h, and weighed to determine shoot dry weight (SDW).
To evaluate the P content, approximately 500 mg of dried, fine-ground plant tissue was digested. One milliliter of deionized water and 4 mL and concentrated sulfuric acid were added to a Pyrex test tube containing the sample, and the mixture was blended using a touch mixer. The tube was then heated at 250 °C for 30 min in an aluminum block. Hydrogen peroxide was added until the solution became clear, and the digest was diluted to a final volume of 100 mL [49]. The P concentration in the digest was determined using the molybdenum blue method and a spectrophotometer.
2.4. Statistical Analysis
Boxplots were generated to visualize the distribution of available P concentrations across the 20 soil samples for each extraction method. Pearson correlation coefficients were calculated to assess the relationships between the extraction methods, and the results are presented as a heatmap. Hierarchical cluster analysis was conducted to classify soils based on the available P profiles across the extraction methods, allowing for the evaluation of similarities and differences between the soils and methods. Principal component analysis (PCA) was performed using nine standardized variables representing the available P content determined by different extraction methods using air-dried and incubated soils. Loading vectors are displayed to indicate the contribution of each variable, and scores for the first two principal components are plotted to visualize the distribution of samples among the four regions (Shonai, Mogami, Murayama, and Okitama).
Two-way analysis of variance (ANOVA) was performed to evaluate the effects of soil, rice cultivars, and their interaction on SDW, shoot P concentration, and P uptake. Multiple comparisons were conducted using Tukey’s honest significant difference (HSD) test. To further examine the relationship between available P and plant response, linear regression analyses were performed between available P and shoot P concentrations for each cultivar. All statistical analyses were conducted using R version 4.5.0 [50].
3. Results
3.1. Plant-Available Phosphorus Distribution by Extraction Method
Figure 3 shows the distribution of available P determined using the five extraction methods under different conditions. The increase from air-dried soil (DS) to incubated soil (IS) indicated enhanced P solubility following incubation. The degree of change and variability differed between the extraction methods tested. Bray 2 exhibited high values and wide variation, particularly during incubation, with a mean available-P value of 543.6 and 686.3 mg P kg−1 for DS and IS, respectively. Mehlich 3 also exhibited a strong response to incubation, with available-P value increasing from 141.9 (DS) to 549.7 mg P kg−1 (IS). In contrast, Olsen showed almost no differences between DS (128.1 mg P kg−1) and IS (96.7 mg P kg−1), whereas Truog showed a significant increase in extractable P from 77.7 mg P kg−1 (DS Truog) to 346.6 mg P kg−1 (IS Truog) (p < 0.05). AR Bray 2 had the highest available-P value (1045.4 mg P kg−1). The variability and interquartile range were particularly large for AR Bray 2, suggesting a substantial variation in P extractability across soils. The soils, which were also used in the pot experiment, exhibited substantial variability in their initial nutrient status (Table 1). Based on this heterogeneity, each soil was treated as an independent sample in the statistical analyses, and comparisons among extraction methods were conducted within each soil. These results suggest that the amounts of P extracted using the different methods responded differently under reduced conditions.
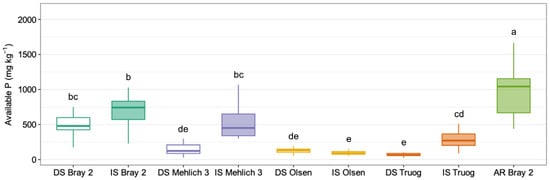
Figure 3.
Boxplots showing plant-available P determined using various extraction methods. DS indicates air-dried soils, IS denotes incubated soils, and AR Bray 2 refers to P extracted by the Bray 2 method after reduction with ascorbic acid. Different lowercase letters within each cultivar indicate significant differences among soils based on Tukey’s multiple comparison test at the 5% level.
3.2. Correlations Among Total Phosphorus, Phosphorus Adsorption Capacity, and Plant-Available P in Different Extraction Methods
The Pearson correlation coefficients among the TP, PAC, and available-P values extracted by the different methods are shown as a heatmap in Figure 4. TP was strongly positively correlated with AR Bray 2 (r = 0.89, p < 0.001), DS Bray 2 (r = 0.81, p < 0.001), and DS Olsen (r = 0.77, p < 0.001). PAC was significantly correlated with AR Bray 2 (r = 0.71, p < 0.001) and DS Bray 2 (r = 0.55, p < 0.05). IS Bray 2 and AR Bray 2 showed a moderate correlation (r = 0.38), but this was not statistically significant. These results suggest a potential relationship between P mobilized during incubation and the chemically reduced fraction extracted by the ascorbic acid treatment, although this relationship is not clearly supported by the present data. Mehlich 3 methods showed weak or negative correlations with TP and PAC, with DS Mehlich 3 having a significant negative correlation with PAC (r = −0.52, p < 0.05). IS Mehlich 3 had no significant correlation with the TP or PAC. DS Olsen showed strong correlations with TP (r = 0.77, p < 0.001), DS Bray 2 (r = 0.79, p < 0.001), and AR Bray 2 (r = 0.88, p < 0.001). In contrast, Olsen (IS) exhibited lower correlation coefficients with these variables, indicating that incubation reduced the strength of these relationships. DS Truog moderately correlated with TP (r = 0.49, p < 0.05), whereas IS Truog had no significant correlation with either TP or PAC. However, IS Truog correlated strongly with IS Mehlich 3 (r = 0.95, p < 0.001), suggesting a similarity between these two methods under incubation conditions.
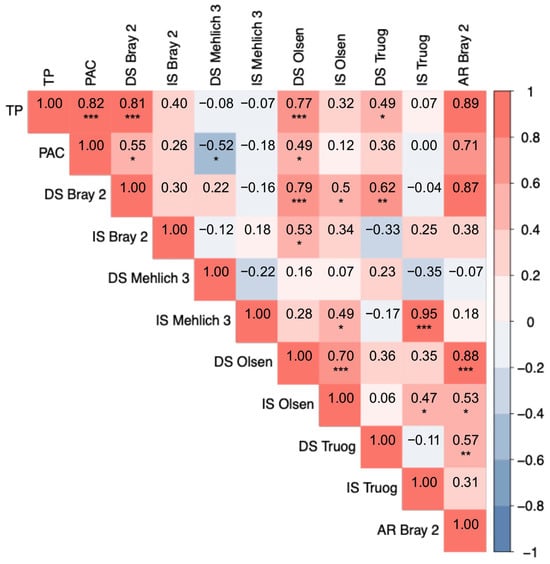
Figure 4.
Heatmap of Pearson correlation coefficients among plant-available P determined using different extraction methods. Red and blue indicate positive and negative correlations, respectively. The intensity of the color represents the strength of the correlation. TP denotes total phosphorus, PAC the phosphate absorption coefficient, DS air-dried soils, and IS incubated soils. AR Bray 2 represents P extracted using the Bray 2 method after being reduced with ascorbic acid. Numerical values represent correlation coefficients. Asterisks indicate significance levels: * p < 0.05, ** p < 0.01, *** p < 0.001.
3.3. Cluster Analysis Based on Plant-Available Phosphorus Extraction Methods
Cluster analysis of soils based on P extracted using different methods is shown in Figure 5. Contrary to expectations based on soil classification, no clear regional clustering patterns were observed. Although soils from Shonai were classified as Fluvisols and those from Mogami, Murayama, and Okitama were classified as Lixisols, clustering did not reflect these taxonomic classifications.
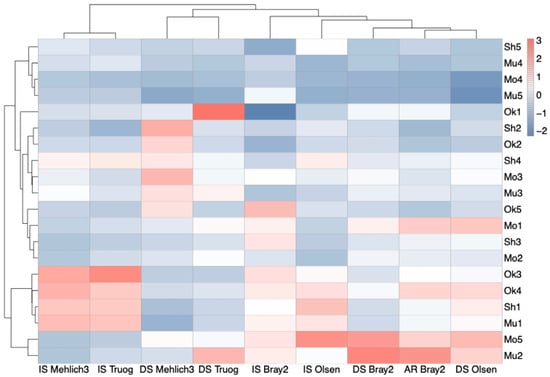
Figure 5.
Cluster heatmap of standardized plant-available P determined using various extraction methods. DS indicates air-dried soils, IS denotes incubated soils, and AR Bray 2 refers to P extracted using the Bray 2 method after reduction with ascorbic acid. Rows represent soil samples labeled by regional codes (Sh: Shonai; Mo: Mogami; Mu: Murayama; Ok: Okitama). Clustering was performed using Euclidean distance and Ward’s method. Colors represent standardized available-P values, with blue and red indicating relatively low and high values, respectively.
However, the clustering pattern was more strongly influenced by the extraction method. The Mehlich 3 and Truog methods tended to group, with IS Mehlich 3 and IS Truog forming one cluster, and DS Mehlich 3 and DS Truog forming another cluster. This suggests that these two methods extract similar P fractions under both incubated and air-dried conditions. A similar but weaker relationship was observed between the Bray 2 and the Olsen methods. AR Bray 2, including the reduced fraction extracted using ascorbic acid, was expected to be similar to IS Bray 2. However, AR Bray 2 clustered closely with DS Bray 2.
Notably, the amount of P varied considerably among soils depending on the extraction method used. For example, Sh5, Mo4, Mu4, and Mu5 consistently exhibited low available-P value across all extraction methods. In contrast, Sh1, Mu1, Ok3, and Ok4 showed high available-P value using Mehlich 3, Truog, and Bray 2 under incubated conditions but low available-P value under air-dried conditions, suggesting the influence of redox status. Meanwhile, Mo5 and Mu2 showed low available-P value with Mehlich 3 under both conditions, but higher values with DS Bray 2 and AR Bray 2.
3.4. PCA on Plant-Available Phosphorus
PCA was conducted using data obtained from all extraction methods applied to the soils collected from the 20 paddy fields. The first two principal components explained 69.2% of the total variance, with PC1 accounting for 42.4% and PC2 for 26.8%. The variable loadings are shown in Figure 6. PC1 can be interpreted as representing variation among extraction methods, with loadings generally increasing in the order of the Mehlich 3, Truog, Bray 2, and Olsen methods. In contrast, PC2 can be interpreted as representing the variation associated with the redox status, as indicated by the positive loadings for DS and negative loadings for IS. AR Bray 2 behaved similarly to Olsen and Bray 2 on PC1 and was roughly positioned between the DS and IS on PC2.
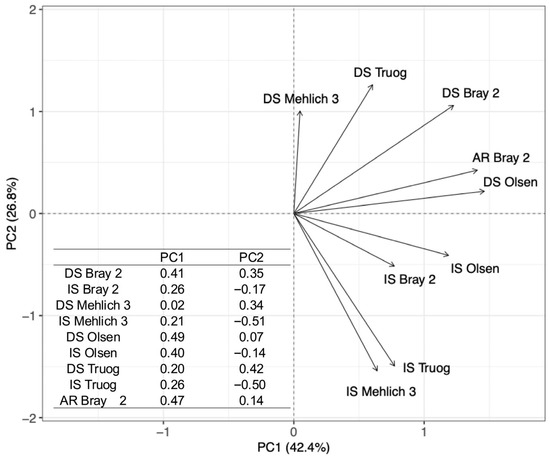
Figure 6.
PCA biplot based on PC1 and PC2, showing loading vectors for each P extraction method. DS indicates air-dried soils, IS indicates incubated soils, and AR Bray 2 refers to P extracted using Bray 2 after reduction with ascorbic acid. The inset table summarizes the PC1 and PC2 loadings for each method, indicating their contributions to the principal components.
Figure 7 illustrates the PCA scores of the soil samples from different regions across the two principal components. The Mogami soils are plotted as a narrow elliptical distribution along the DS ray 2 vector. The Shonai and Okitama soils are plotted toward the IS Mehlich 3 and IS Truog vectors, and the Murayama soils are plotted as a broader and more diffuse ellipse distribution with the centroid located similar to that of Mogami.
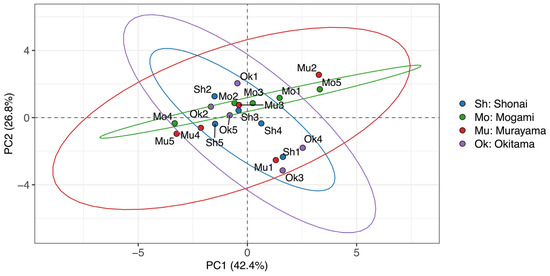
Figure 7.
PCA score plot of soil samples based on PC1 and PC2. Samples are labeled by region codes: Sh (Shonai), Mo (Mogami), Mu (Murayama), and Ok (Okitama). Each ellipse represents a 95% confidence area calculated from the multivariate normal distribution of scores within each region.
3.5. Shoot Biomass and Phosphorus Content
SDW, P concentration, and P content varied significantly among the soils, but no significant differences were observed between the two cultivars or in the cultivar × soil interactions (Table 2 and Table 3). For Haenuki, SDW varied between 22.63 g pot−1 (Sh2) and 50.41 g pot−1 (Mu5), whereas for Tsuyahime, it ranged from 20.97 g pot−1 (Sh2) to 54.52 g pot−1 (Mu5). Sh5, Mu5, and Ok4 consistently supported higher biomass production in both cultivars, whereas Sh2 had the lowest biomass. Shoot P concentrations exhibited relatively small variations. In Haenuki, P concentrations ranged from 0.31% (Ok2) to 0.44% (Sh1), whereas for Tsuyahime, they ranged from 0.29% (Ok2) to 0.41% (Ok3). No significant differences in P concentrations were observed between the two cultivars. Shoot P content represents the combined effects of biomass and P concentration. For Haenuki, P content varied between 75.03 mg pot−1 (Sh2) and 175.80 mg pot−1 (Mu5), while for Tsuyahime, it ranged from 73.60 mg pot−1 (Sh2) to 183.83 mg pot−1 (Ok4). Sh5, Mu5, and Ok4 resulted in higher P content in both cultivars.
Table 2.
Shoot dry weight, P concentration, and P content of two rice cultivars (Haenuki and Tsuyahime) grown in soils from different sampling sites.
Table 3.
Statistical significance of the effects of cultivar, soil, and their interaction on shoot dry weight, P concentration, and P content of two rice cultivars.
3.6. Relationship Between Plant-Available P and Shoot P Concentration
The SDW in rice was partly affected by available nitrogen (N), as soils with low N produced lower SDW despite sufficient N fertilizer application (Table 1 and Table 2). This suggests that the limited mineralization of soil organic N during the growing period may have restricted biomass production and indirectly restricted P uptake. To reduce the confounding effect of N limitation, we focused on the relationship between available P and shoot P concentration, rather than shoot P uptake. Figure 8a–i shows the relationship between shoot P concentration and available P determined by five different extraction methods under air-dried and incubation conditions. When plotted against available P in DS, shoot P concentration did not show a clear increase with increasing available P (Figure 8a,c,e,g). In IS, although no sharp increase was observed, a positive trend was evident, particularly for Haenuki (Figure 8b,d,f,h), where shoot P concentration tended to increase with increasing available P. Among the extraction methods, AR Bray 2 (Figure 8i) showed a broader distribution of available-P values (500–2000 mg kg−1) and a response pattern similar to that of DS Bray 2 (Figure 8a), whose values were mostly concentrated below 500 mg kg−1. This broader distribution suggests that AR Bray 2 may provide a practical advantage as a rapid method for evaluating soil P availability across a wider range of soil types; however, this indication is preliminary.
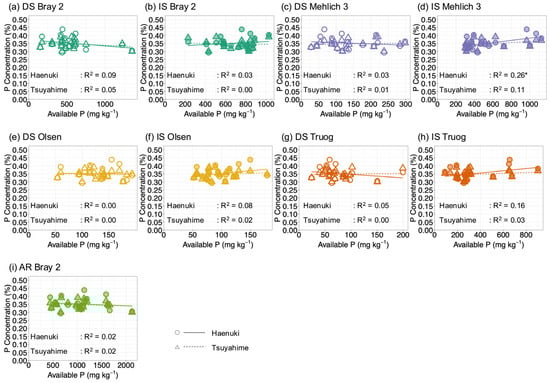
Figure 8.
Relationship between available P determined using different extraction methods and P concentration in rice plants. Panels (a–i) correspond to the following extraction methods. DS indicates air-dried soils, IS denotes incubated soils, and AR Bray 2 refers to P extracted by the Bray 2 method after reduction with ascorbic acid. Circles and triangles represent Haenuki and Tsuyahime, respectively. Solid and dashed lines indicate regression lines for Haenuki and Tsuyahime, respectively.
4. Discussion
4.1. Phosphorus Extractability and Redox Sensitivity
Under both air-dried and incubated conditions, the Bray 2 method, including AR Bray 2, consistently extracted the highest values of P among all the tested methods and exhibited the widest range of extractable P across the soils (Figure 3). This indicates that Bray 2 had higher extractability than the other methods. Bray 2 extracted seven times more P than Mehlich 3 in volcanic ash soils, highlighting the strong influence of soil type on extraction efficiency [51]. In the same study, the Mehlich 3 method extracted approximately twice as much P as the Truog method, which is consistent with our results. Regarding the Olsen method, some studies have reported similar extractability to Mehlich 3 [52], whereas others have reported that Mehlich 3 extracts nearly twice as much P as Olsen, depending on the soil characteristics [53,54,55]. The Bray 2 and Mehlich 3 methods generally extracted larger amounts of P, whereas the Olsen method extracted significantly less [56]. These findings suggest that P extractability varies considerably, depending on the extraction method and soil properties. In the present study, the Bray 2 method exhibited the highest extractability among the tested methods in paddy soils.
In the three extraction methods, Bray 2, Mehlich 3, and Truog, the amount of P extracted in IS was significantly higher than that in DS (Figure 3). This increase may result from the reductive dissolution of Fe-bound P, which is known to become more soluble under the reduced conditions typical of flooded paddy soils. However, because Eh and Fe concentrations were not measured in this study, the extent to which reduced conditions were established and whether Fe-bound P dissolution contributed remain speculative and should be verified in future research. In contrast, P associated with calcium (Ca-bound P) and aluminum (Al-bound P) minerals tends to be less sensitive to redox changes [57,58]. The Truog method primarily targets Ca-bound P [59], whereas Mehlich 3 extracts both Ca- and Fe/Al-bound P owing to the combination of acetic acid and fluoride components [60,61]. Therefore, both methods showed marked increases in extractable P under reduced conditions, likely reflecting the enhanced solubility of Fe-bound P. Bray 2, which preferentially extracts Fe-bound P, extracted a part of the Fe-bound P pool even under oxidized conditions. As a result, the increase in extractable P from air-dried and incubated conditions was smaller for Bray 2 than for Mehlich 3 or Truog. The Olsen method, which primarily targets Ca-bound P, shows little to no increase in extractable P under reduced conditions. This is consistent with previous findings that Olsen P is largely unaffected by redox conditions and does not effectively extract Fe-bound P [16,62,63]. These results collectively highlight the importance of selecting P extraction methods that reflect soil redox status. In flooded rice systems, conventional aerobic extraction methods may underestimate the availability of Fe-bound P. Therefore, the use of reducing agents such as ascorbic acid or conducting anaerobic incubations can help simulate field-relevant conditions and improve the accuracy of P availability assessments.
Although AR Bray 2 has been proposed as a potential indicator of available P under reduced conditions, owing to its agreement with values obtained after flooded incubation [33], our results showed a weak correlation between AR Bray 2 and IS Bray 2 (Figure 4). This discrepancy may be attributed to the ability of AR Bray 2 to extract not only inorganic P (Pi) but also a portion of organic P (Po) [64]. Ascorbic acid reduces Fe(III)-bound P to Fe(II)-P, which becomes more soluble under acidic conditions, thereby enhancing P release to soil solution [62]. In addition, AR Bray 2 may mobilize Po to a greater extent than the other extraction methods, although the other methods may also extract Po. These mechanisms may partially explain the discrepancy and the higher extractable-P values observed with AR Bray 2.
Po can account for 20–80% of TP, depending on soil properties [65,66]. Although Pi is the primary form of P taken up by rice, Po, especially phosphate monoesters, may also be available through enzymatic mineralization [67]. The strong correlation observed between AR Bray 2 and TP may suggest that this method mobilizes a broader range of P forms. The chemical properties of AR Bray 2—particularly its reducing and acidic characteristics—could hypothetically facilitate the release of Po alongside Pi [64]. Furthermore, the significant correlation between the AR Bray 2 and PAC suggests the influence of soil organic matter, which affects both Po accumulation and PAC [68]. However, because Po was not directly measured in this study, this interpretation remains uncertain and should be quantitatively verified in future research.
4.2. Correlations with Extraction Methods
The strong correlations of Bray 2 and AR Bray 2 with both TP and PAC indicate that these methods reflect the influence of soil P pools and adsorption capacity. This suggests that Bray 2 and AR Bray 2 are sensitive to the chemical processes governing P availability in paddy soils, rather than simply reflecting TP. In contrast, the relatively low or negative correlations for Mehlich 3 and the low correlations for Truog under certain conditions suggest that these methods may be less reliable indicators of available P in reduced environments.
In the FAO/WRB classification, Mu5 is categorized as a Luvisol. However, according to the Japanese soil classification system, it is classified as an Andosol because of its high amorphous mineral content and strong phosphate retention capacity [69]. The low TP and high PAC of Mu5 resulted in lower available P in DS. Andosols, which are widely distributed in volcanic areas and occur mainly in uplands, although a small proportion is also used in paddy fields in Japan, are characterized by strong phosphate retention owing to the abundance of amorphous minerals, particularly allophane, which has a high affinity for phosphate [70]. Although soil organic matter can limit phosphate adsorption, the low TC content in Mu5 suggests its limited ability to mitigate P fixation. More than 60% of phosphate added to such soils can become occluded and nonreactive within 6 days. The long-term application of P may eventually saturate these adsorption sites, depending on soil properties and management [71]; however, the combination of high PAC and low TP in Mu5 indicates that the adsorption capacity remains active and unsaturated. PAC, which reflects the presence of amorphous Al and Fe compounds responsible for P fixation, has been proposed as a useful indicator of the P retention potential in Andosols [72,73]. Consistent with this, the P retention capacity of non-calcareous soils is correlated with oxalate-extractable Al, oxalate-extractable Fe, and dithionite-extractable Fe [71]. Thus, the high PAC in Mu5 suggests strong, ongoing P fixation typical of Andosols, which are often P-limited owing to the abundant reactive Al and Fe phases [74,75].
These findings underscore the need to evaluate P availability using indicators that reflect soil-specific characteristics, particularly in Andosols, where strong P fixation by amorphous minerals can mask actual P availability. In such highly adsorptive soils, both TP and PAC should be considered to accurately assess plant-available P under variable redox conditions Among the tested extraction methods, AR Bray 2 showed slightly better performance than the others within our dataset; however, none of the methods demonstrated sufficiently strong correlations, indicating that further refinement and validation are needed.
4.3. Distinct Extraction Method Characteristics and Redox Responses Revealed by Cluster Analysis and PCA
Cluster analysis and PCA collectively revealed systematic differences in the P extraction methods under varying redox conditions. As described in the Results Section 3.4, PC1 can be interpreted as representing variation among the extraction methods, with scores generally increasing in the order of the Mehlich 3, Truog, Bray 2, and Olsen. PC2 represents the variation associated with redox status, as indicated by the positive loadings for DS and negative loadings for IS (Figure 6). Because the data were standardized, these components reflect relative extraction patterns across soils rather than absolute extractable P. AR Bray 2, despite extracting on average 1.9 times more P than DS Bray 2 (Figure 3), clustered closely with DS Bray 2 in both the PCA and cluster analysis. This suggests that the extraction patterns across soils were similar despite quantitative differences (Figure 5).
Mehlich 3 and Truog are chemically distinct under oxidizing conditions because of their limited capacities to extract Fe- and Al-bound P from Truog [76]. These two methods showed low correlation in DSs; however, their correlation increased markedly after incubation (IS, r = 0.95; Figure 4), and they clustered closely in IS (Figure 5). This change likely reflects the increased solubility of Fe- and Al-bound P owing to microbial reductive dissolution [77,78,79]. In contrast, the Olsen method, which targets Ca-bound P, showed minimal differences between DS and IS and did not extract Fe-bound P, which is consistent with previous studies [16,62,63]. This was evident in Sh1, Mu1, Ok3, and Ok4, which exhibited increases in P with incubation in Truog and Mehlich 3 but not in Olsen.
Our findings provide two important insights. First, the extraction methods retained distinct characteristics even under redox changes, as shown by the consistent clustering patterns. Second, unexpected similarities—such as those between IS Mehlich 3 and IS Truog, and between AR Bray 2 and DS Olsen—suggest complex interactions among soil properties, redox status, and extractant chemistry. These methods are not directly interchangeable owing to differences in the extracted P fractions [25,80]. Previous studies have emphasized that assuming a direct relationship between Fe reduction and plant P uptake oversimplifies the system; instead, P availability is shaped by a multifactorial interplay of biogeochemical processes [81]. Based on our study, at least three patterns of soil responses were identified: (1) soils that were relatively unaffected by either the extraction method or redox status, showing little variation between DS and IS; (2) soils that were highly responsive to changes in redox status, showing large increases in extractable P after incubation; and (3) soils from which highly extractable P was obtained only with specific extraction methods. Recognizing these types can inform the selection of suitable extraction methods and improve P management under diverse paddy soil conditions.
4.4. Regional Variability in Soil Phosphorus Characteristics Identified by PCA
PCA based on the P extraction results revealed region-specific trends in soil P behavior (Figure 7). The shapes and orientations of the ellipses representing each region highlight the within-region variability and dominant directions of variation. For instance, Mogami soils were characterized by a smaller and narrower elliptical area than other regions, suggesting relatively homogeneous P behavior within the region, likely resulting from similar soil-forming processes and land use. In contrast, the elliptical areas for the Shonai and Okitama soils extended in a direction roughly orthogonal to that of the Mogami soil, indicating distinct patterns of variation related to extraction methods and redox status. Murayama soils showed no clear grouping and were widely scattered, reflecting greater heterogeneity in soil mineralogy, redox sensitivity, or land-use history.
Although regional grouping was initially expected, the observed patterns indicated that P availability was not determined solely by geographic origin or soil classification. This finding is consistent with those of previous studies that have emphasized the complexity of P dynamics in paddy soils. For example, the assumed direct relationship between Fe reduction and P availability is often oversimplified because plant P uptake is influenced by multiple interacting factors such as redox status, mineral composition, and root behavior [81]. Similarly, P availability varies substantially depending on the chemical form of the soil P pool and the chosen extraction method [82]. In addition, soils in temperate regions, unlike those in tropical climates, typically contain more reactive Fe (hydroxide) oxides, which play a dominant role in P solubility under changing redox conditions [83,84].
Moreover, differences in parent materials and pedogenic processes can lead to considerable heterogeneity in P behavior, even within seemingly similar environments [85]. Our findings support this view, as multiple soil types with contrasting P extraction responses were found to coexist within individual regions. Consequently, the predictive utility of regional or taxonomic classifications is insufficient for predicting P availability. Instead, effective P management in paddy systems should rely on site-specific assessments that consider soil properties and redox responsiveness.
4.5. Phosphorus Availability and Plant Uptake
In DS, the lack of a clear correlation between any extraction method and plant P concentration (Figure 8) reflects the high P values and narrow range of available P in the studied area. Most fields can already supply sufficient P to reach the plateau in plant P response, which is consistent with previous studies when soil P levels exceeded crop requirements [86,87,88]. This limitation is a characteristic of many long-term fertilized paddy systems in northern Japan. Rice fields account for approximately 30% of national P fertilizer use [9,10,11]. Surveys indicate that about 80% of rice fields exceed available P thresholds based on Truog-P in air-dried soils [13], including those in Yamagata Prefecture [14,25]. Therefore, the soils used in this study are representative of the rice fields to which diagnostic P tests are typically applied. Accordingly, the contribution of our study is not the identification of a universally “best” method, but rather the delineation of method applicability boundaries under high P conditions. Our results demonstrate a practical constraint in identifying a single best available-P extraction method in such paddy fields. These findings support ongoing efforts to reconsider P fertilizer rates and to explore management strategies that make better use of accumulated soil P while maintaining crop productivity.
In contrast, the incubated soils showed a slightly positive relationship between plant P concentration and soil P availability, particularly in Hanenuki, which has a higher nutrient demand than Tsuyahime [47]. This suggests that extractions under flooded incubation conditions may better reflect rice P status than those from air-dried soils. However, our results show that, even under standardized flooded incubation conditions, diagnostic performance remains limited when plant P status is already near the response plateau. Despite the use of ascorbic acid as a reductant, AR Bray 2 exhibited a relationship with plant P concentration that more closely resembled the pattern observed for DS. However, AR Bray 2 was more closely associated with rice shoot biomass and with the incubated available-P values. This indicates that AR Bray 2 may be more informative for evaluating growth responses rather than excessive P uptake, which is a valuable distinction for fertilizer management in high P paddy soils. Nevertheless, the current evidence is limited, and additional work is needed before AR Bray 2 can be considered a reliable diagnostic method.
When relating the results of available-P extraction methods to crop performance under such conditions, careful interpretation is required. In this study, we used simple linear regressions to evaluate the relationship between available P and plant P concentration; however, the relationship is not necessarily linear. Our investigation was conducted near the plateau where available P has accumulated to high levels. Datasets that include other soil P conditions, such as low P paddy soils, should be evaluated using nonlinear or segmented regression models. Furthermore, several soil and management factors can affect the apparent relationship between extraction results and plant response. Initial variation in soil properties among treatments (Table 1), including non-P nutrient status, may partly account for the differences in shoot biomass and P uptake summarized in Table 2. Under flooded cultivation, available P is also influenced by temporal changes in soil redox status [89,90]: dissolved reactive P can initially increase during the dissolution of Fe(III) oxides and subsequently decline as Fe(II) minerals form and re-adsorb P [90,91]. Thus, available-P extraction methods at one incubation time capture only part of the available-P dynamics, and the timing of measurement becomes an important consideration for any diagnostic protocol under flooded incubation conditions [92]. Although plant P uptake is a useful integrative indicator for evaluating P availability in extraction methods, its interpretation in high P paddy soils requires consideration of plant physiological traits, non-P nutrient availability, soil redox dynamics, and key soil properties such as texture, organic matter, and Fe/Al oxides.
5. Conclusions
This study evaluated multiple P extraction methods under both air-dried and flooded incubation conditions to determine their ability to predict rice P uptake in cold-region paddy soils that have received long-term fertilization. The results revealed that soil-specific responses to redox status and extraction method were more influential than regional or taxonomic classification. Cluster analysis identified three patterns of soil P behavior under changing redox conditions: soils with stable extractability regardless of redox status, soils with increased P availability after incubation, and soils in which extractability was strongly dependent on the extraction method. These patterns indicate that a one-size-fits-all approach is unsuitable, and that P assessment should instead be tailored to soil-specific characteristics and redox behavior. Additionally, in the pot experiments, no clear relationship was observed between any extraction method and plant P concentration because plant P status had reached the plateau of crop response. This provides practical evidence that, under high P conditions, soil P tests can have limited capacity to predict plant P status. Although AR Bray 2 showed preliminary promise as a rapid alternative method, none of the tested methods demonstrated consistent predictive performance across all soils. This outcome emphasizes the limitation of conventional extraction methods in intensively fertilized paddy systems. The agronomic guidance value of this study lies in decision-making risks when soil P test values are interpreted as direct indicators of plant response. Future work linking plant-available P obtained using different extraction methods to key soil properties such as amorphous Fe content may clarify P mobilization mechanisms and, in the long term, contribute to more efficient and sustainable P management in flooded rice production systems.
Author Contributions
Conceptualization, R.T.; methodology, R.T.; software, H.N. and R.T.; validation, S.T., H.N. and R.T.; formal analysis, S.T. and H.N.; investigation, S.T. and H.N.; resources, H.N.; data curation, S.T. and H.N.; writing—original draft preparation, S.T. and H.N.; writing—review and editing, H.N. and R.T.; visualization, H.N.; supervision, R.T.; project administration, R.T.; funding acquisition, H.N. All authors have read and agreed to the published version of the manuscript.
Funding
This work was supported by JSPS KAKENHI (grant number 20K22575).
Data Availability Statement
The raw data supporting the conclusions of this article will be made available by the authors on request.
Acknowledgments
We extend our sincere appreciation to the local farmers who cooperated in providing the soil samples used in this research. We also thank the colleagues in the Laboratory of Crop Science at Yamagata University for their assistance and ongoing support throughout this work.
Conflicts of Interest
The authors declare no conflicts of interest.
References
- Alori, E.T.; Glick, B.R.; Babalola, O.O. Microbial phosphorus solubilization and its potential for use in sustainable agriculture. Front. Microbiol. 2017, 8, 971. [Google Scholar] [CrossRef] [PubMed]
- Hasan, M.M.; Hasan, M.M.; Teixeira da Silva, J.A.; Li, X. Regulation of phosphorus uptake and utilization: Transitioning from current knowledge to practical strategies. Cell. Mol. Biol. Lett. 2016, 21, 7. [Google Scholar] [CrossRef] [PubMed]
- Wissuwa, M. How Do plants achieve tolerance to phosphorus deficiency? Small causes with big effects. Plant Physiol. 2003, 133, 1947–1958. [Google Scholar] [CrossRef] [PubMed]
- Ajmera, I.; Charlie Hodgman, T.; Lu, C. An integrative systems perspective on plant phosphate research. Genes 2019, 10, 139. [Google Scholar] [CrossRef]
- Dobermann, A.; Fairhurst, T. Rice: Nutrient Disorders and Nutrient Management; Potash & Phosphate Institute (PPI); Potash & Phosphate Institute of Canada (PPIC); International Rice Research Institute (IRRI): Singapore, 2000. [Google Scholar]
- Dobermann, A.; Cassman, K.G.; Mamaril, C.P.; Sheehy, J.E. Management of phosphorus, potassium, and sulfur in intensive, irrigated lowland rice. Field Crops Res. 1998, 56, 113–138. [Google Scholar] [CrossRef]
- Grant, C.A.; Flaten, D.N.; Tomasiewicz, D.J.; Sheppard, S.C. The importance of early season phosphorus nutrition. Can. J. Plant Sci. 2001, 81, 211–224. [Google Scholar] [CrossRef]
- Shiga, H. Efficient level of phosphorus fertility in paddy soils. In Tropical Agriculture Research Series: Proceedings of a Symposium on Tropical Agriculture Researches; 1981; Volume 15, pp. 227–241. Available online: https://www.jircas.go.jp/sites/default/files/publication/tars/tars15-_227-241.pdf (accessed on 25 September 2025).
- Nishio, M. Recent trend of chemical fertilizer consumption in Japan. Jpn. J. Soil Sci. Plant Nutr. 2002, 73, 219–225. [Google Scholar]
- Mishima, S.; Itahashi, S.; Kimura, R.; Inoue, T. Trends of phosphate fertilizer demand and phosphate balance in farmland soils in Japan. Soil Sci. Plant Nutr. 2003, 49, 39–45. [Google Scholar] [CrossRef]
- Mishima, S.I.; Kimura, S.D.; Eguchi, S.; Shirato, Y. Changes in soil available-nutrient stores and relationships with nutrient balance and crop productivity in Japan. Soil Sci. Plant Nutr. 2013, 59, 371–379. [Google Scholar] [CrossRef]
- Goto, E.; Shu, M.; Michiko, N.; Osamu, I. The present condition of chemical properties of paddy soils in Hokkaido. Jpn. J. Soil Sci. Plant Nutr. 2003, 74, 475–483. [Google Scholar]
- Obara, H.; Nakai, M. Available phosphate of arable lands in Japan. Changes of soil characteristics in Japanese arable lands (II). Jpn. J. Soil Sci. Plant Nutr. 2004, 75, 59–67. [Google Scholar]
- Tohkairin, S. Fractionation and availabilization of phosphorus accumulated in paddy soils with application of phosphatic fertilizer in YAMAGATA Prefecture. Spec. Bull. Yamagata Prefect. Agric. Exp. Stn. 1992, 21, 1–48. [Google Scholar]
- Frossard, E.; Condron, L.M.; Oberson, A.; Sinaj, S.; Fardeau, J.C. Processes governing phosphorus availability in temperate soils. J. Environ. Qual. 2000, 29, 15–23. [Google Scholar] [CrossRef]
- Tandy, S.; Hawkins, J.M.B.; Dunham, S.J.; Hernandez-Allica, J.; Granger, S.J.; Yuan, H.; McGrath, S.P.; Blackwell, M.S.A. Investigation of the soil properties that affect Olsen P critical values in different soil types and impact on P fertiliser recommendations. Eur. J. Soil Sci. 2021, 72, 1802–1816. [Google Scholar] [CrossRef]
- Battisti, M.; Moretti, B.; Sacco, D.; Grignani, C.; Zavattaro, L. Soil Olsen P response to different phosphorus fertilization strategies in long-term experiments in NW Italy. Soil Use Manag. 2022, 38, 549–563. [Google Scholar] [CrossRef]
- Jordan-Meille, L.; Rubæk, G.H.; Ehlert, P.A.I.; Genot, V.; Hofman, G.; Goulding, K.; Recknagel, J.; Provolo, G.; Barraclough, P. An overview of fertilizer-P recommendations in Europe: Soil testing, calibration and fertilizer recommendations. Soil Use Manag. 2012, 28, 419–435. [Google Scholar] [CrossRef]
- Nawara, S.; Van Dael, T.; Merckx, R.; Amery, F.; Elsen, A.; Odeurs, W.; Vandendriessche, H.; Mcgrath, S.; Roisin, C.; Jouany, C.; et al. A comparison of soil tests for available phosphorus in long-term field experiments in Europe. Eur. J. Soil Sci. 2017, 68, 873–885. [Google Scholar] [CrossRef]
- Truog, E. The determination of the readily available phosphorus of soils 1. Agron. J. 1930, 22, 874–882. [Google Scholar] [CrossRef]
- Bray, R.H.; Kurtz, L.T. Determination of total organic and available forms of phosphorus in soils. Soil Sci. 1945, 59, 39–45. [Google Scholar] [CrossRef]
- Mehlich, A. Mehlich 3 soil test extractant: A modification of Mehlich 2 extractant. Commun. Soil Sci. Plant Anal. 1984, 15, 1409–1416. [Google Scholar] [CrossRef]
- Olsen, S.R.; Cole, C.V.; Watandbe, F.; Dean, L. Estimation of available phosphorus in soil by extraction with sodium bicarbonate. J. Chem. Inf. Model. 1954, 53, 1689–1699. [Google Scholar]
- McDowell, R.W.; Noble, A.; Pletnyakov, P.; Haygarth, P.M. A global database of soil plant available phosphorus. Sci. Data 2023, 10, 125. [Google Scholar] [CrossRef] [PubMed]
- Tsumuraya, S.; Nasukawa, H.; Tajima, R. Estimation of available phosphorus under phosphorus fertilization in paddy fields of a cold region using several extraction methods: A case study from Yamagata, Japan. Agriculture 2025, 15, 1453. [Google Scholar] [CrossRef]
- Penn, C.J.; Rutter, E.B.; Arnall, D.B.; Camberato, J.; Williams, M.; Watkins, P. A Discussion on Mehlich-3 Phosphorus Extraction from the Perspective of Governing Chemical Reactions and Phases: Impact of Soil pH. Agriculture 2018, 8, 106. [Google Scholar] [CrossRef]
- Wanke, D.J.; Heichel, J.; Zikeli, S.; Müller, T.; Hartmann, T.E. Comparison of Soil Phosphorus Extraction Methods Regarding Their Suitability for Organic Farming Systems. J. Plant Nutr. Soil Sci. 2023, 186, 599–608. [Google Scholar] [CrossRef]
- Salmi, A.; Baghdadi, M.E.; Hilali, A.; Ennaji, W.; Mosaid, H. Assessing the Relationship between Iron Behavior and Phosphorus in Hydromorphic Soils: The Day Valley Case, Tadla Plain, Morocco. Mediterr. Geosci. Rev. 2025, 7, 379–393. [Google Scholar] [CrossRef]
- Yang, X.; Liu, C.; Liang, C.; Wang, T.; Tian, J. The Phosphorus-Iron Nexus: Decoding the Nutrients Interaction in Soil and Plant. Int. J. Mol. Sci. 2024, 25, 6992. [Google Scholar] [CrossRef]
- De Mello, J.W.V.; Barrón, V.; Torrent, J. Phosphorus and Iron Mobilization in Flooded Soils from Brazil. Soil Sci. 1998, 163, 122–132. [Google Scholar] [CrossRef]
- Delgado, A.; Torrent, J. Comparison of Soil Extraction Procedures for Estimating Phosphorus Release Potential of Agricultural Soils. Commun. Soil Sci. Plant Anal. 2001, 32, 87–105. [Google Scholar] [CrossRef]
- Uwasawa, M.; Uchida, Y. Soil testing on available soil phosphorus for paddy field in cool region of Japan. Bull. Tohoku Natnl. Agric. Exp. Stn. 1982, 67, 77–95. [Google Scholar]
- Nishida, M.; Yoshida, K.; Takahashi, T. Estimation of changes in available soil phosphate under submerged conditions associated with temperature during the tillering stage of rice plant in the cool climate region of Japan. Commun. Soil Sci. Plant Anal. 2018, 49, 1695–1706. [Google Scholar] [CrossRef]
- Japan Meteorological Agency Database. Available online: http://www.data.jma.go.jp/obd/stats/etrn/index.php (accessed on 12 September 2024).
- IUSS Working Group WRB. World Reference Base for Soil Resources: International Soil Classification System for Naming Soils and Creating Legends for Soil Maps, 4th ed.; FAO: Rome, Italy, 2022. [Google Scholar]
- FAO; IIASA. Harmonized World Soil Database Version 2.0; FAO: Rome, Italy; IIASA: Laxenburg, Austria, 2023. [Google Scholar]
- Nishikawa, T.; Li, K.; Inamura, T. Nitrogen uptake by the rice plant and changes in the soil chemical properties in the paddy rice field during yearly application of anaerobically-digested manure for seven years. Plant Prod. Sci. 2014, 17, 237–244. [Google Scholar] [CrossRef]
- Corey, R.B. A Textbook of Soil Chemical Analysis; John Wiley & Sons: New York, NY, USA, 1973. [Google Scholar]
- Nanzyo, M.; Takahashi, T.; Shoji, S. Rapid method to determine available phosphorus content of paddy soils under reducing conditions using ascorbic acid. Jpn. J. Soil Sci. Plant Nutr. 1996, 67, 73–77. [Google Scholar] [CrossRef]
- Ishioka, G. Measurement of nitrogen release from soil and organic materials under flooded conditions using aluminum-deposited bags. Jpn. J. Soil Sci. Plant Nutr. 2023, 94, 115–120. [Google Scholar]
- Khem, B.; Hirai, Y.; Yamakawa, T.; Mori, Y.; Inoue, E.; Okayasu, T.; Mitsuoka, M. Effects of Different Application Methods of Fertilizer and Manure on Soil Chemical Properties and Yield in Whole Crop Rice Cultivation. Soil Sci. Plant Nutr. 2018, 64, 406–414. [Google Scholar] [CrossRef]
- Ono, S.-i. Nitrogen Mineralization from Paddy and Upland Soils under Flooded and Nonflooded Incubation. Soil Sci. Plant Nutr. 1989, 35, 417–426. [Google Scholar] [CrossRef]
- Grigg, A.R.C.; ThomasArrigo, L.K.; Schulz, K.; Rothwell, K.A.; Kaegi, R.; Kretzschmar, R. Ferrihydrite Transformations in Flooded Paddy Soils: Rates, Pathways, and Product Spatial Distributions. Environ. Sci. Process. Impacts 2022, 24, 1867–1882. [Google Scholar] [CrossRef]
- Husson, O. Redox Potential (Eh) and pH as Drivers of Soil/Plant/Microorganism Systems: A Transdisciplinary Overview Pointing to Integrative Opportunities for Agronomy. Plant Soil 2013, 362, 389–417. [Google Scholar] [CrossRef]
- Ito, K.; Kuramata, M.; Tanikawa, H.; Suda, A.; Yamaguchi, N.; Ishikawa, S. Diversity and Transcription of Genes Involved in Respiratory As(V) Reduction and As(III) Methylation in Japanese Paddy Soils. BMC Microbiol. 2024, 24, 396. [Google Scholar] [CrossRef]
- Tian, X.; Li, J.; Chai, G.; Luo, D.; Gong, Y.; Liu, H.; Xie, Q.; Li, G. Optimal Relationship Between As and Cd in Porewater of Paddy Soils with Variations in pe + pH: Insight from Trade-Off Value Analysis. Agriculture 2024, 14, 1933. [Google Scholar] [CrossRef]
- Chuba, M. Breeding of a rice cultivar ‘Tsuyahime’ with wide adaptability and superior eating quality, using a new appearance evaluation method of cooked rice. Breed. Res. 2022, 24, 52–58. [Google Scholar] [CrossRef]
- Fertilization Standards in Yamagata Prefecture. Available online: https://agrin.jp/documents/859/image1_file0119051020334431045.pdf (accessed on 12 September 2024).
- Kashiwagura, M.; Sato, Y.; Uno, T.; Tajima, R.; Ito, T.; Saito, M. Microscale digestion of plant samples with sulfuric acid and oxygen peroxide. Bull. Integr. Field Sci. Cent. 2015, 30, 1–2. [Google Scholar] [CrossRef]
- R Core Team. R: A Language and Environment for Statistical Computing, version 4.5.0; R Foundation for Statistical Computing: Vienna, Austria, 2025. Available online: https://www.R-project.org/ (accessed on 25 September 2025).
- Yanai, M.; Uwasawa, M.; Shimizu, Y. Development of a new multinutrient extraction method for macro- and micro-nutrients in arable land soil. Soil Sci. Plant Nutr. 2000, 46, 299–313. [Google Scholar] [CrossRef]
- Six, L.; Pypers, P.; Degryse, F.; Smolders, E.; Merckx, R. The performance of DGT versus conventional soil phosphorus tests in tropical soils—An isotope dilution study. Plant Soil 2012, 359, 267–279. [Google Scholar] [CrossRef]
- Iatrou, M.; Papadopoulos, A.; Papadopoulos, F.; Dichala, O.; Psoma, P.; Bountla, A. Determination of soil available phosphorus using the Olsen and Mehlich 3 methods for Greek soils having variable amounts of calcium carbonate. Commun. Soil Sci. Plant Anal. 2014, 45, 2207–2214. [Google Scholar] [CrossRef]
- Wang, Y.T.; Zhang, T.Q.; O’Halloran, I.P.; Hu, Q.C.; Tan, C.S.; Speranzini, D.; Macdonald, I.; Patterson, G. Agronomic and environmental soil phosphorus tests for predicting potential phosphorus loss from Ontario soils. Geoderma 2015, 241–242, 51–58. [Google Scholar] [CrossRef]
- Dari, B.; Rogers, C.W.; Leytem, A.B.; Schroeder, K.L. Evaluation of soil test phosphorus extractants in Idaho soils. Soil Sci. Soc. Am. J. 2019, 83, 817–824. [Google Scholar] [CrossRef]
- White, V.G.; Hardie, A.G.; Raath, P.J. Relationships between commonly-used South African and international soil phosphorus extraction tests on pristine and cultivated soils. S. Afr. J. Plant Soil 2020, 37, 265–272. [Google Scholar] [CrossRef]
- Nanzyo, M. Progress and prospect of the research on paddy soil management under various rice growing system. 1. Progress in nutrient behavior and management research on paddy soil (2) phosphorus. Jpn. J. Soil Sci. Plant Nutr. 1996, 67, 317–321. [Google Scholar]
- Yan, X.; Wei, Z.; Wang, D.; Zhang, G.; Wang, J. Phosphorus status and its sorption-associated soil properties in a paddy soil as affected by organic amendments. J. Soils Sediments 2015, 15, 1882–1888. [Google Scholar] [CrossRef]
- Ando, K.; Yamaguchi, N.; Nakamura, Y.; Kasuya, M.; Taki, K. Speciation of phosphorus accumulated in fertilized cropland of Aichi Prefecture in Japan with different soil properties by sequential chemical extraction and P K-Edge XANES. Soil Sci. Plant Nutr. 2021, 67, 150–161. [Google Scholar] [CrossRef]
- Shahandeh, H.; Hons, F.M.; Provin, T.L.; Pitt, J.L.; Waskom, J.S. Factors affecting Mehlich III soil test methodology for extractable P. Commun. Soil Sci. Plant Anal. 2017, 48, 423–438. [Google Scholar] [CrossRef]
- Wuenscher, R.; Unterfrauner, H.; Peticzka, R.; Zehetner, F. A comparison of 14 soil phosphorus extraction methods applied to 50 agricultural soils from Central Europe. Plant Soil Environ. 2015, 61, 86–96. [Google Scholar] [CrossRef]
- McDowell, R.W.; Sharpley, A.N. Phosphorus solubility and release kinetics as a function of soil test P concentration. Geoderma 2003, 112, 143–154. [Google Scholar] [CrossRef]
- Horta, M.D.C.; Torrent, J. The Olsen P method as an agronomic and environmental test for predicting phosphate release from acid soils. Nutr. Cycl. Agroecosyst 2007, 77, 283–292. [Google Scholar] [CrossRef]
- Xu, X.; Xu, Q.; Du, Z.; Gu, L.; Chen, C.; Huangfu, X.; Shi, D. Enhanced phosphorus release from waste activated sludge using ascorbic acid reduction and acid dissolution. Water Res. 2023, 229, 119476. [Google Scholar] [CrossRef]
- Blake, L.; Johnston, A.E.; Poulton, P.R.; Goulding, K.W.T. Changes in soil phosphorus fractions following positive and negative phosphorus balances for long periods. Plant Soil 2003, 254, 245–261. [Google Scholar] [CrossRef]
- Mengel, K.; Kirkby, E.A.; Kosegarten, H.; Appel, T. The soil as a plant nutrient medium. In Principles of Plant Nutrition; Springer: Dordrecht, The Netherlands, 2001. [Google Scholar]
- Turner, B.L. Organicphosphorus in Madagascan rice soils. Geoderma 2006, 136, 279–288. [Google Scholar] [CrossRef]
- Matsui, K.; Takata, Y.; Matsuura, S.; Wagai, R. Soil organic carbon was more strongly linked with soil phosphate fixing capacity than with clay content across 20,000 agricultural soils in Japan: A potential role of reactive aluminum revealed by soil database approach. Soil Sci. Plant Nutr. 2021, 67, 233–242. [Google Scholar] [CrossRef]
- Nanzyo, M. Unique properties of volcanic ash soils. Glob. J. Environ. Res. 2002, 6, 99–112. [Google Scholar]
- Siéwé, J.M.; Djoufac Woumfo, E.; Djomgoue, P.; Njopwouo, D. Activation of clay surface sites of Bambouto’s andosol (Cameroon) with phosphate ions: Application for copper fixation in aqueous solution. Appl. Clay Sci. 2015, 114, 31–39. [Google Scholar] [CrossRef]
- Borggaard, O.K.; Szilas, C.; Gimsing, A.L.; Rasmussen, L.H. Estimation of Soil Phosphate Adsorption Capacity by Means of a Pedotransfer Function. Geoderma 2004, 118, 55–61. [Google Scholar] [CrossRef]
- Takata, Y.; Ito, T.; Ohkura, T.; Obara, H.; Kohyama, K.; Shirato, Y. Phosphate adsorption coefficient can improve the validity of RothC model for andosols. Soil Sci. Plant Nutr. 2011, 57, 421–428. [Google Scholar] [CrossRef]
- Ichinose, Y.; Matsui, K.; Fukumasu, J.; Matsuura, S.; Takata, Y.; Wagai, R. How do reactive aluminum and iron phases control soil organic carbon and phosphate adsorption capacity in agricultural topsoils across Japan? Soil Sci. Plant Nutr. 2025, 71, 38–52. [Google Scholar] [CrossRef]
- Takahashi, T.; Dahlgren, R.A. Nature, properties and function of aluminum-humus complexes in volcanic soils. Geoderma 2016, 263, 110–121. [Google Scholar] [CrossRef]
- Kanda, T.; Takata, Y.; Kohyama, K.; Ohkura, T.; Maejima, Y.; Wakabayashi, S.; Obara, H. New soil maps of Japan based on the comprehensive soil classification system of Japan—First approximation and its application to the World Reference Base for Soil Resources 2006. Jpn. Agric. Res. Q. 2018, 52, 285–292. [Google Scholar] [CrossRef]
- Thibaud, G.R.; Farina, M.P.W.; Hughes, J.C.; Johnston, M.A. Assessment of phosphorus availability in soils fertilized with Langebaan rock phosphate or superphosphate. S. Afr. J. Plant Soil 1994, 11, 178–185. [Google Scholar] [CrossRef]
- Scalenghe, R.; Edwards, A.C.; Ajmone Marsan, F.; Barberis, E. The effect of reducing conditions on the solubility of phosphorus in a diverse range of European agricultural soils. Eur. J. Soil Sci. 2002, 53, 439–447. [Google Scholar] [CrossRef]
- Marschner, P. Marschner’s Mineral Nutrition of Higher Plants, 3rd ed.; Academic Press: London, UK, 2011. [Google Scholar]
- Willett, I.R.; Higgins, M.L. Phosphate sorption by reduced and reoxidized rice soils. Aust. J. Soil Res. 1978, 16, 319–326. [Google Scholar] [CrossRef]
- Nasukawa, H.; Tajima, R.; Pereira, M.C.F.; Nakamura, S.; Fukuda, M.; Naruo, K.; Egami, T.; Oya, T.; Ito, T. Comparative verification of Mehlich 3 soil analysis methods in Northern Mozambique using microwave plasma–atomic emission spectrometry. Soil Sci. Plant Nutr. 2023, 69, 327–336. [Google Scholar] [CrossRef]
- Martinengo, S.; Schiavon, M.; Santoro, V.; Said-Pullicino, D.; Romani, M.; Miniotti, E.F.; Celi, L.; Martin, M. Assessing phosphorus availability in paddy soils: The importance of integrating soil tests and plant responses. Biol. Fertil. Soils 2023, 59, 391–405. [Google Scholar] [CrossRef]
- Pierzynski, G.M.; McDowell, R.W.; Sims, J.T. Chemistry, cycling, and potential movement of inorganic phosphorus in soils. In Phosphorus: Agriculture and the Environment; American Society of Agronomy: Madison, WI, USA, 2015. [Google Scholar]
- Hinsinger, P. Bioavailability of soil inorganic P in the rhizosphere as affected by root-induced chemical changes: A review. Plant Soil 2001, 237, 173–195. [Google Scholar] [CrossRef]
- Kögel-Knabner, I.; Amelung, W.; Cao, Z.; Fiedler, S.; Frenzel, P.; Jahn, R.; Kalbitz, K.; Kölbl, A.; Schloter, M. Biogeochemistry of paddy soils. Geoderma 2010, 157, 1–14. [Google Scholar] [CrossRef]
- Moody, P.W.; Speirs, S.D.; Scott, B.J.; Mason, S.D. Soil phosphorus tests I: What soil phosphorus pools and processes do they measure? Crop Pasture Sci. 2013, 64, 461–468. [Google Scholar] [CrossRef]
- Guo, W.; Hou, Y.L.; Wang, S.G.; Zhu, Y.G. Effect of silicate on the growth and arsenate uptake by rice (Oryza sativa L.) seedlings in solution culture. Plant Soil 2005, 272, 173–181. [Google Scholar] [CrossRef]
- Panten, K.; Godlinski, F.; Schroetter, S.; Hofmeier, M. Variability of P uptake by plants. In Phosphorus in Agriculture: 100% Zero; Springer: Dordrecht, The Netherlands, 2016; pp. 155–178. ISBN 9789401776127. [Google Scholar]
- Ye, T.; Li, Y.; Zhang, J.; Hou, W.; Zhou, W.; Lu, J.; Xing, Y.; Li, X. Nitrogen, phosphorus, and potassium fertilization affects the flowering time of rice (Oryza sativa L.). Glob. Ecol. Conserv. 2019, 20, e00753. [Google Scholar] [CrossRef]
- Amarawansha, G.; Kumaragamage, D.; Flaten, D.; Zvomuya, F.; Tenuta, M. Predicting Phosphorus Release from Anaerobic, Alkaline, Flooded Soils. J. Environ. Qual. 2016, 45, 1452–1459. [Google Scholar] [CrossRef]
- Palihakkara, J.; Attanayake, C.P.; Burkitt, L.; Jeyakumar, P. Phosphorus Release and Transformations in Contrasting Tropical Paddy Soils Under Fertiliser Application. J. Soil Sci. Plant Nutr. 2025, 25, 4570–4587. [Google Scholar] [CrossRef]
- Amery, F.; Smolders, E. Unlocking Fixed Soil Phosphorus upon Waterlogging Can Be Promoted by Increasing Soil Cation Exchange Capacity. Eur. J. Soil Sci. 2012, 63, 831–838. [Google Scholar] [CrossRef]
- Saiano, F.; Scalenghe, R. Challenges in Developing Reliable Phosphorus Predictive Models: Unpredictable Release under Soil Redox Changes. Heliyon 2024, 10, e40160. [Google Scholar] [CrossRef]
Disclaimer/Publisher’s Note: The statements, opinions and data contained in all publications are solely those of the individual author(s) and contributor(s) and not of MDPI and/or the editor(s). MDPI and/or the editor(s) disclaim responsibility for any injury to people or property resulting from any ideas, methods, instructions or products referred to in the content. |
© 2025 by the authors. Licensee MDPI, Basel, Switzerland. This article is an open access article distributed under the terms and conditions of the Creative Commons Attribution (CC BY) license.