
Reducing Nitrogen Fertilization Rate in Spring Wheat–Pea Rotation Sustains Spring Wheat Yield and Quality


Abstract
1. Introduction
2. Materials and Methods
2.1. Experimental Details
2.2. Data Analysis
3. Results
3.1. Air Temperature and Precipitation
3.2. Soil Nitrate Nitrogen Content and the Amount of Nitrogen Fertilizer Applied
3.3. Plant Density
3.4. Straw Yield
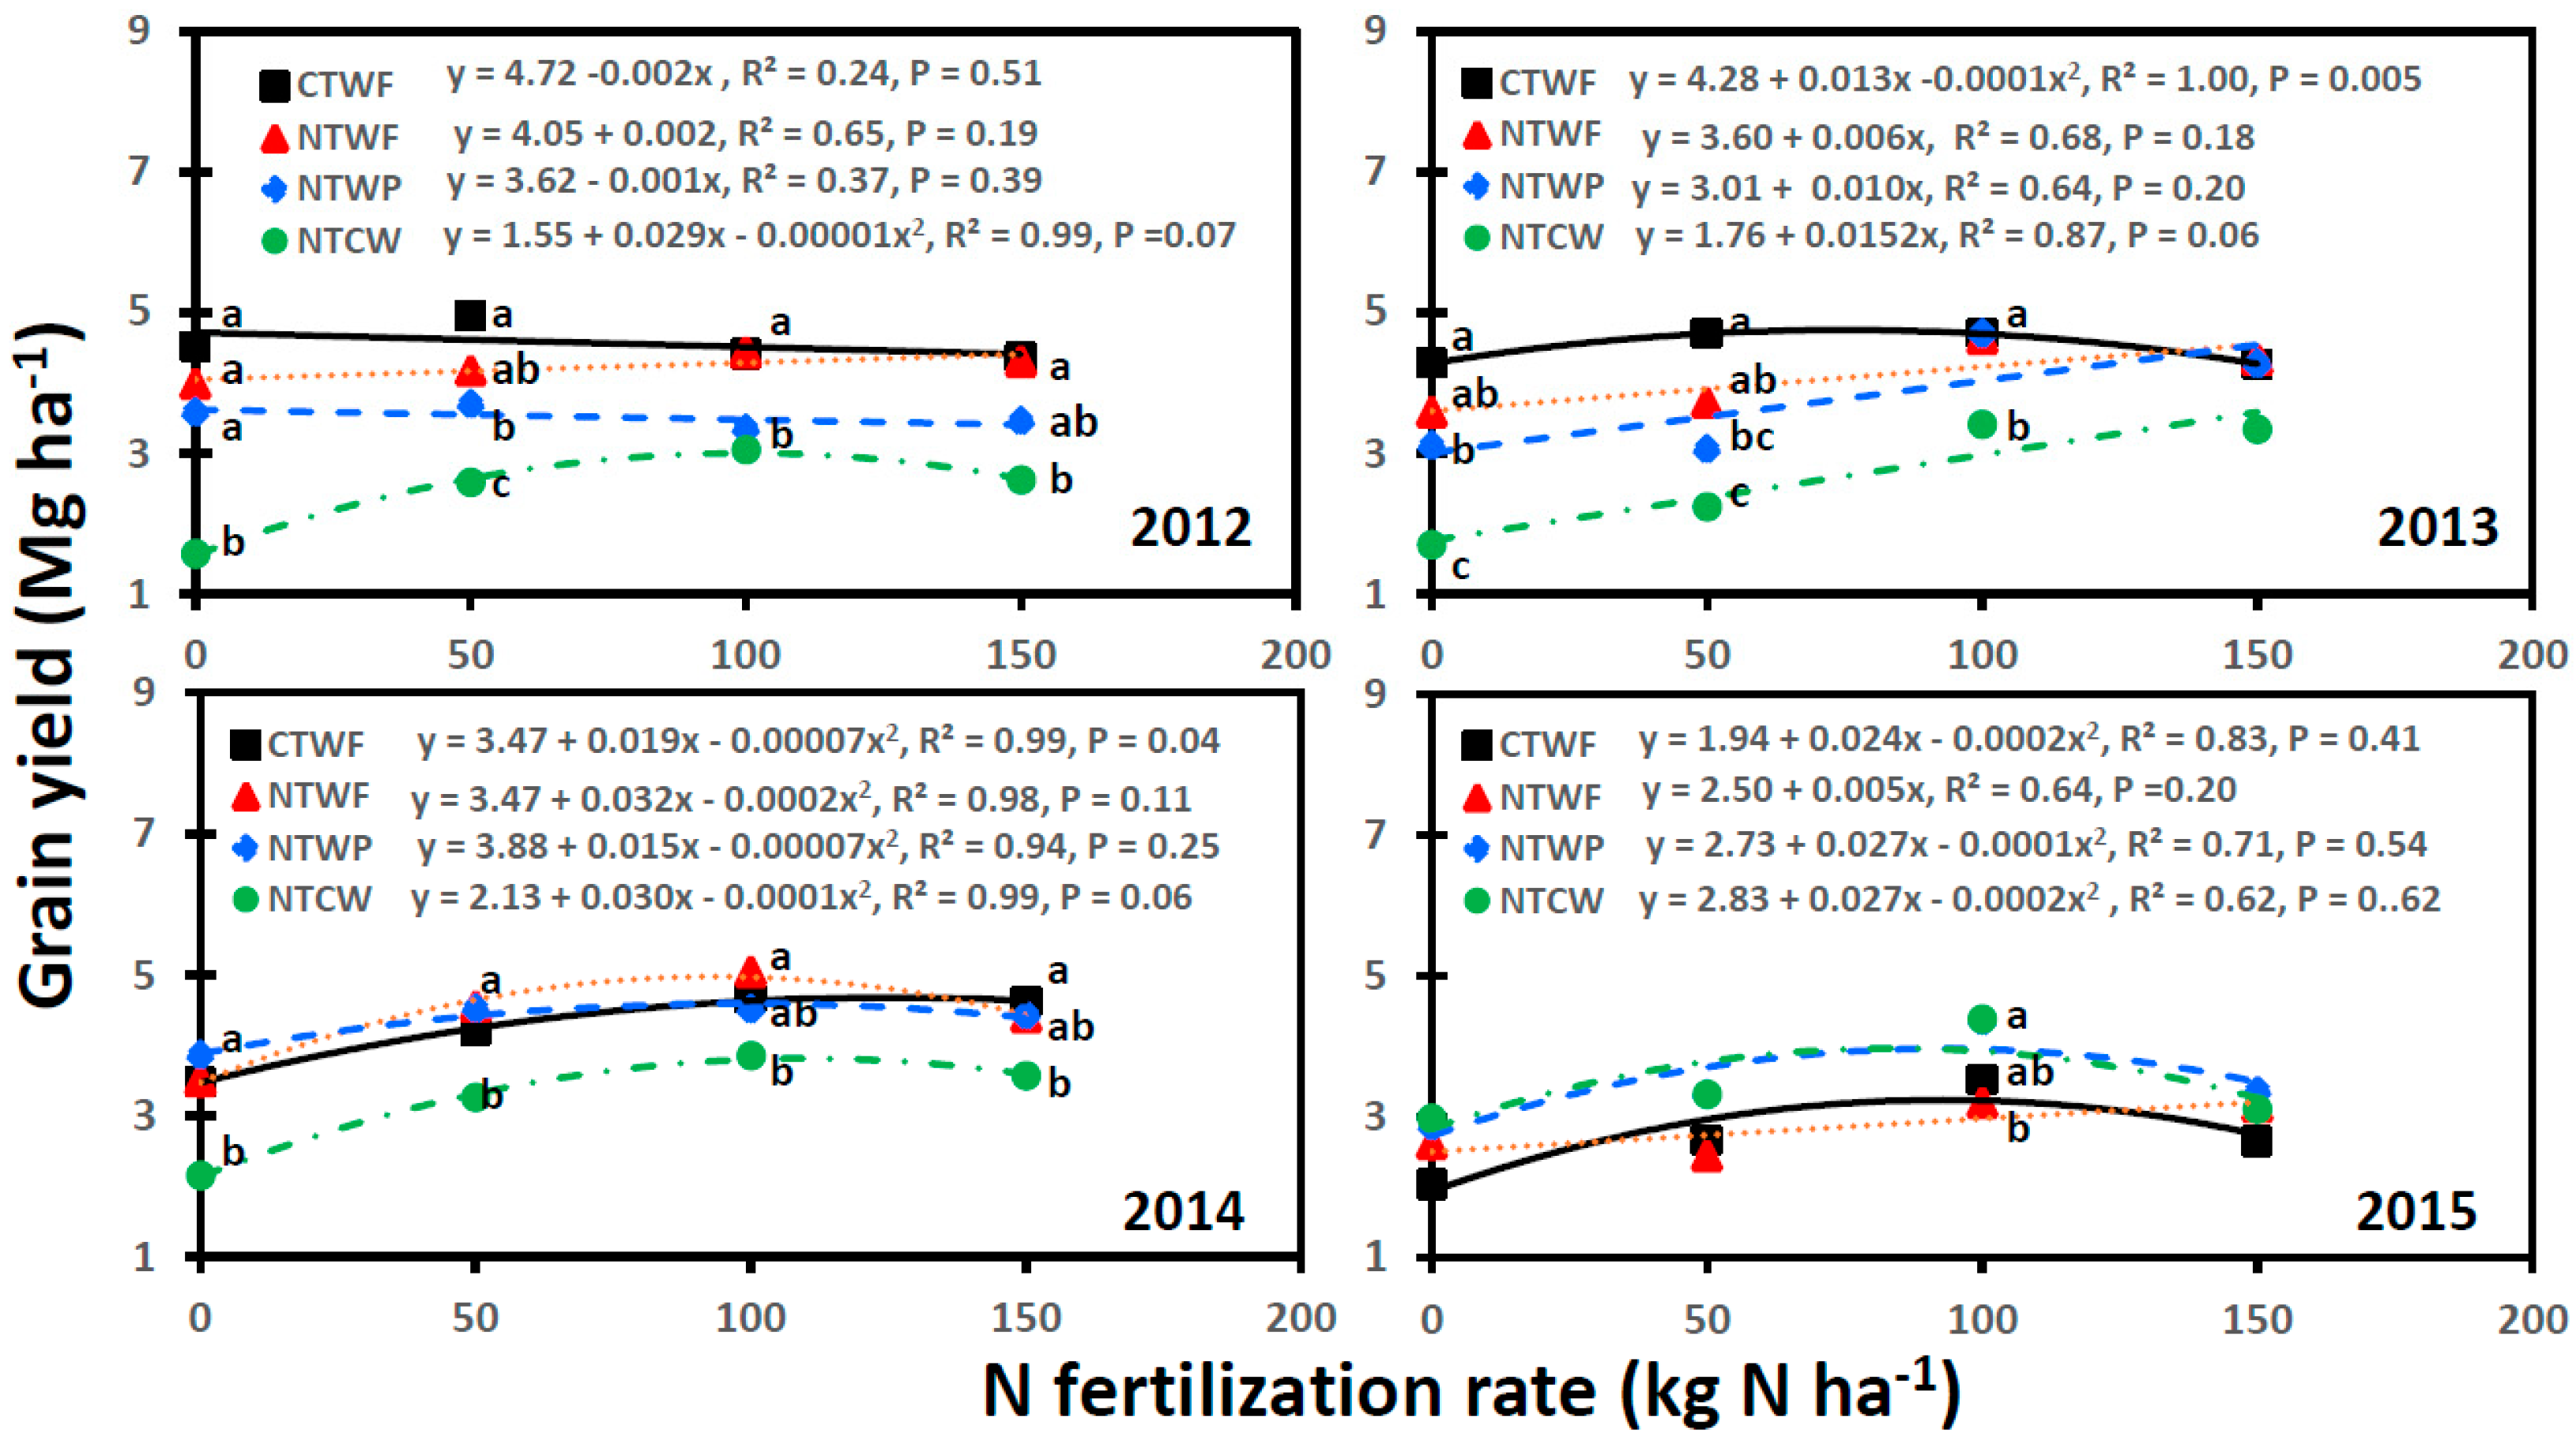
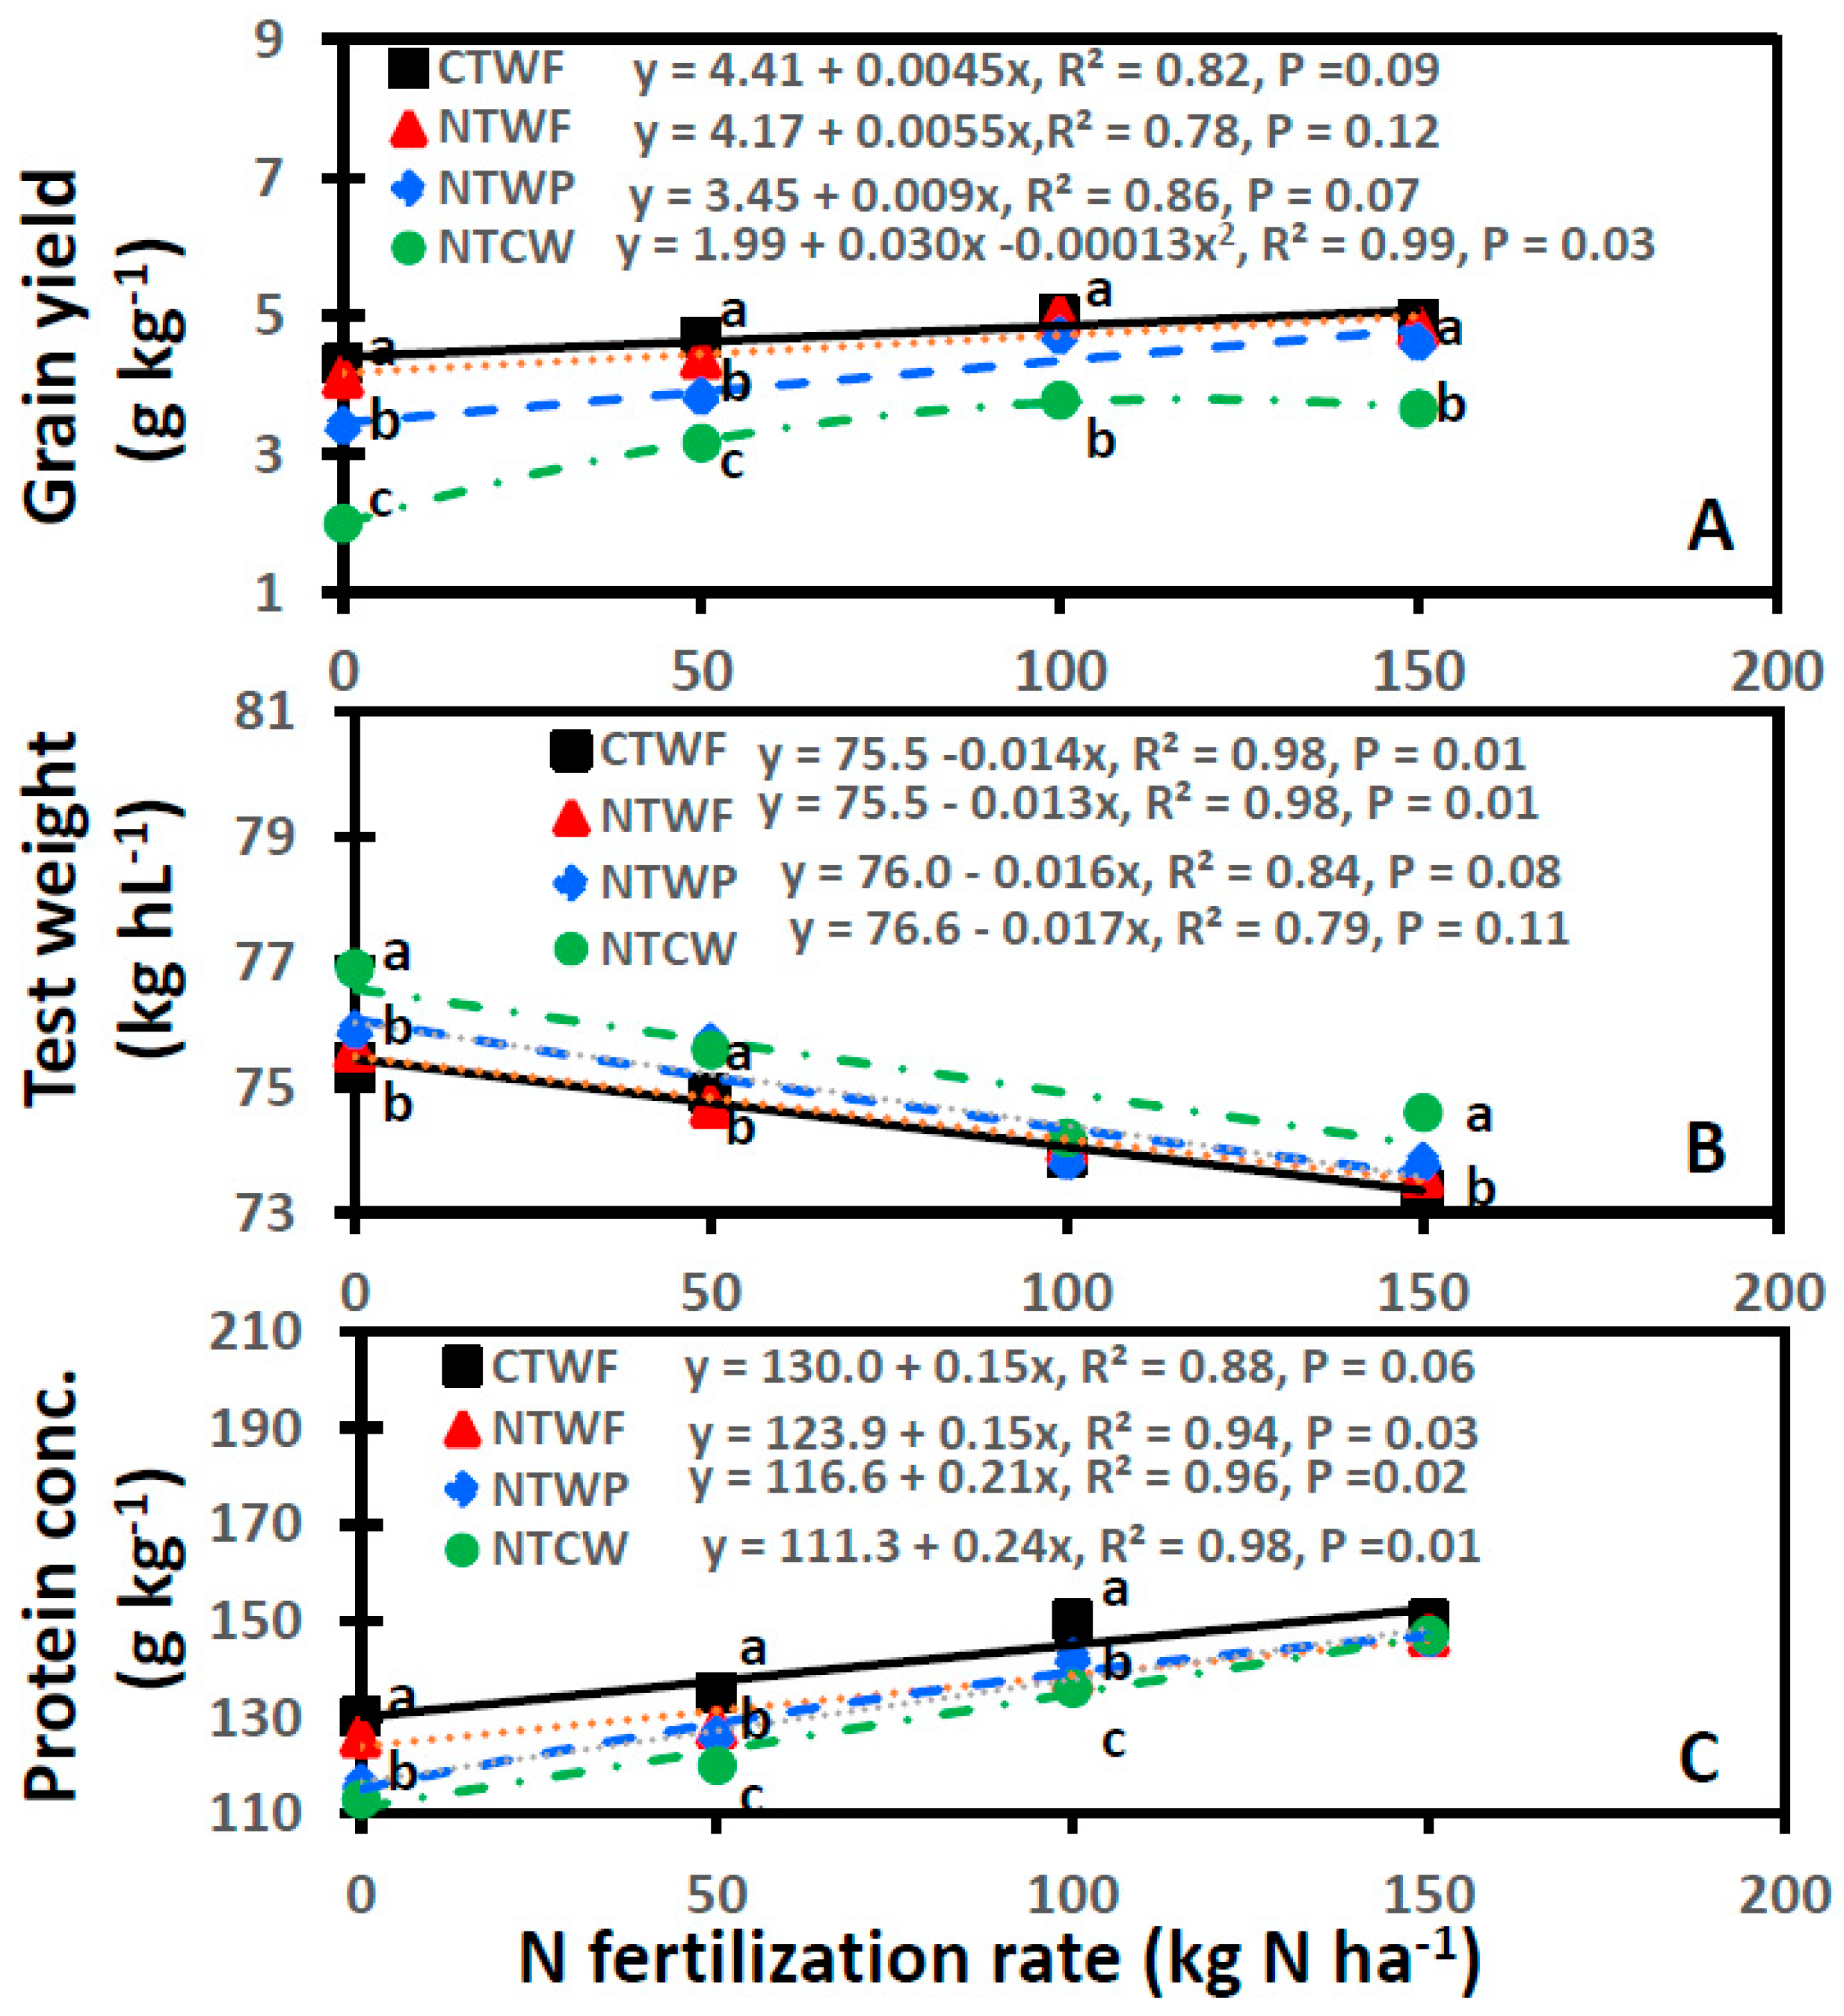
3.5. Grain Yield
3.6. Harvest Index
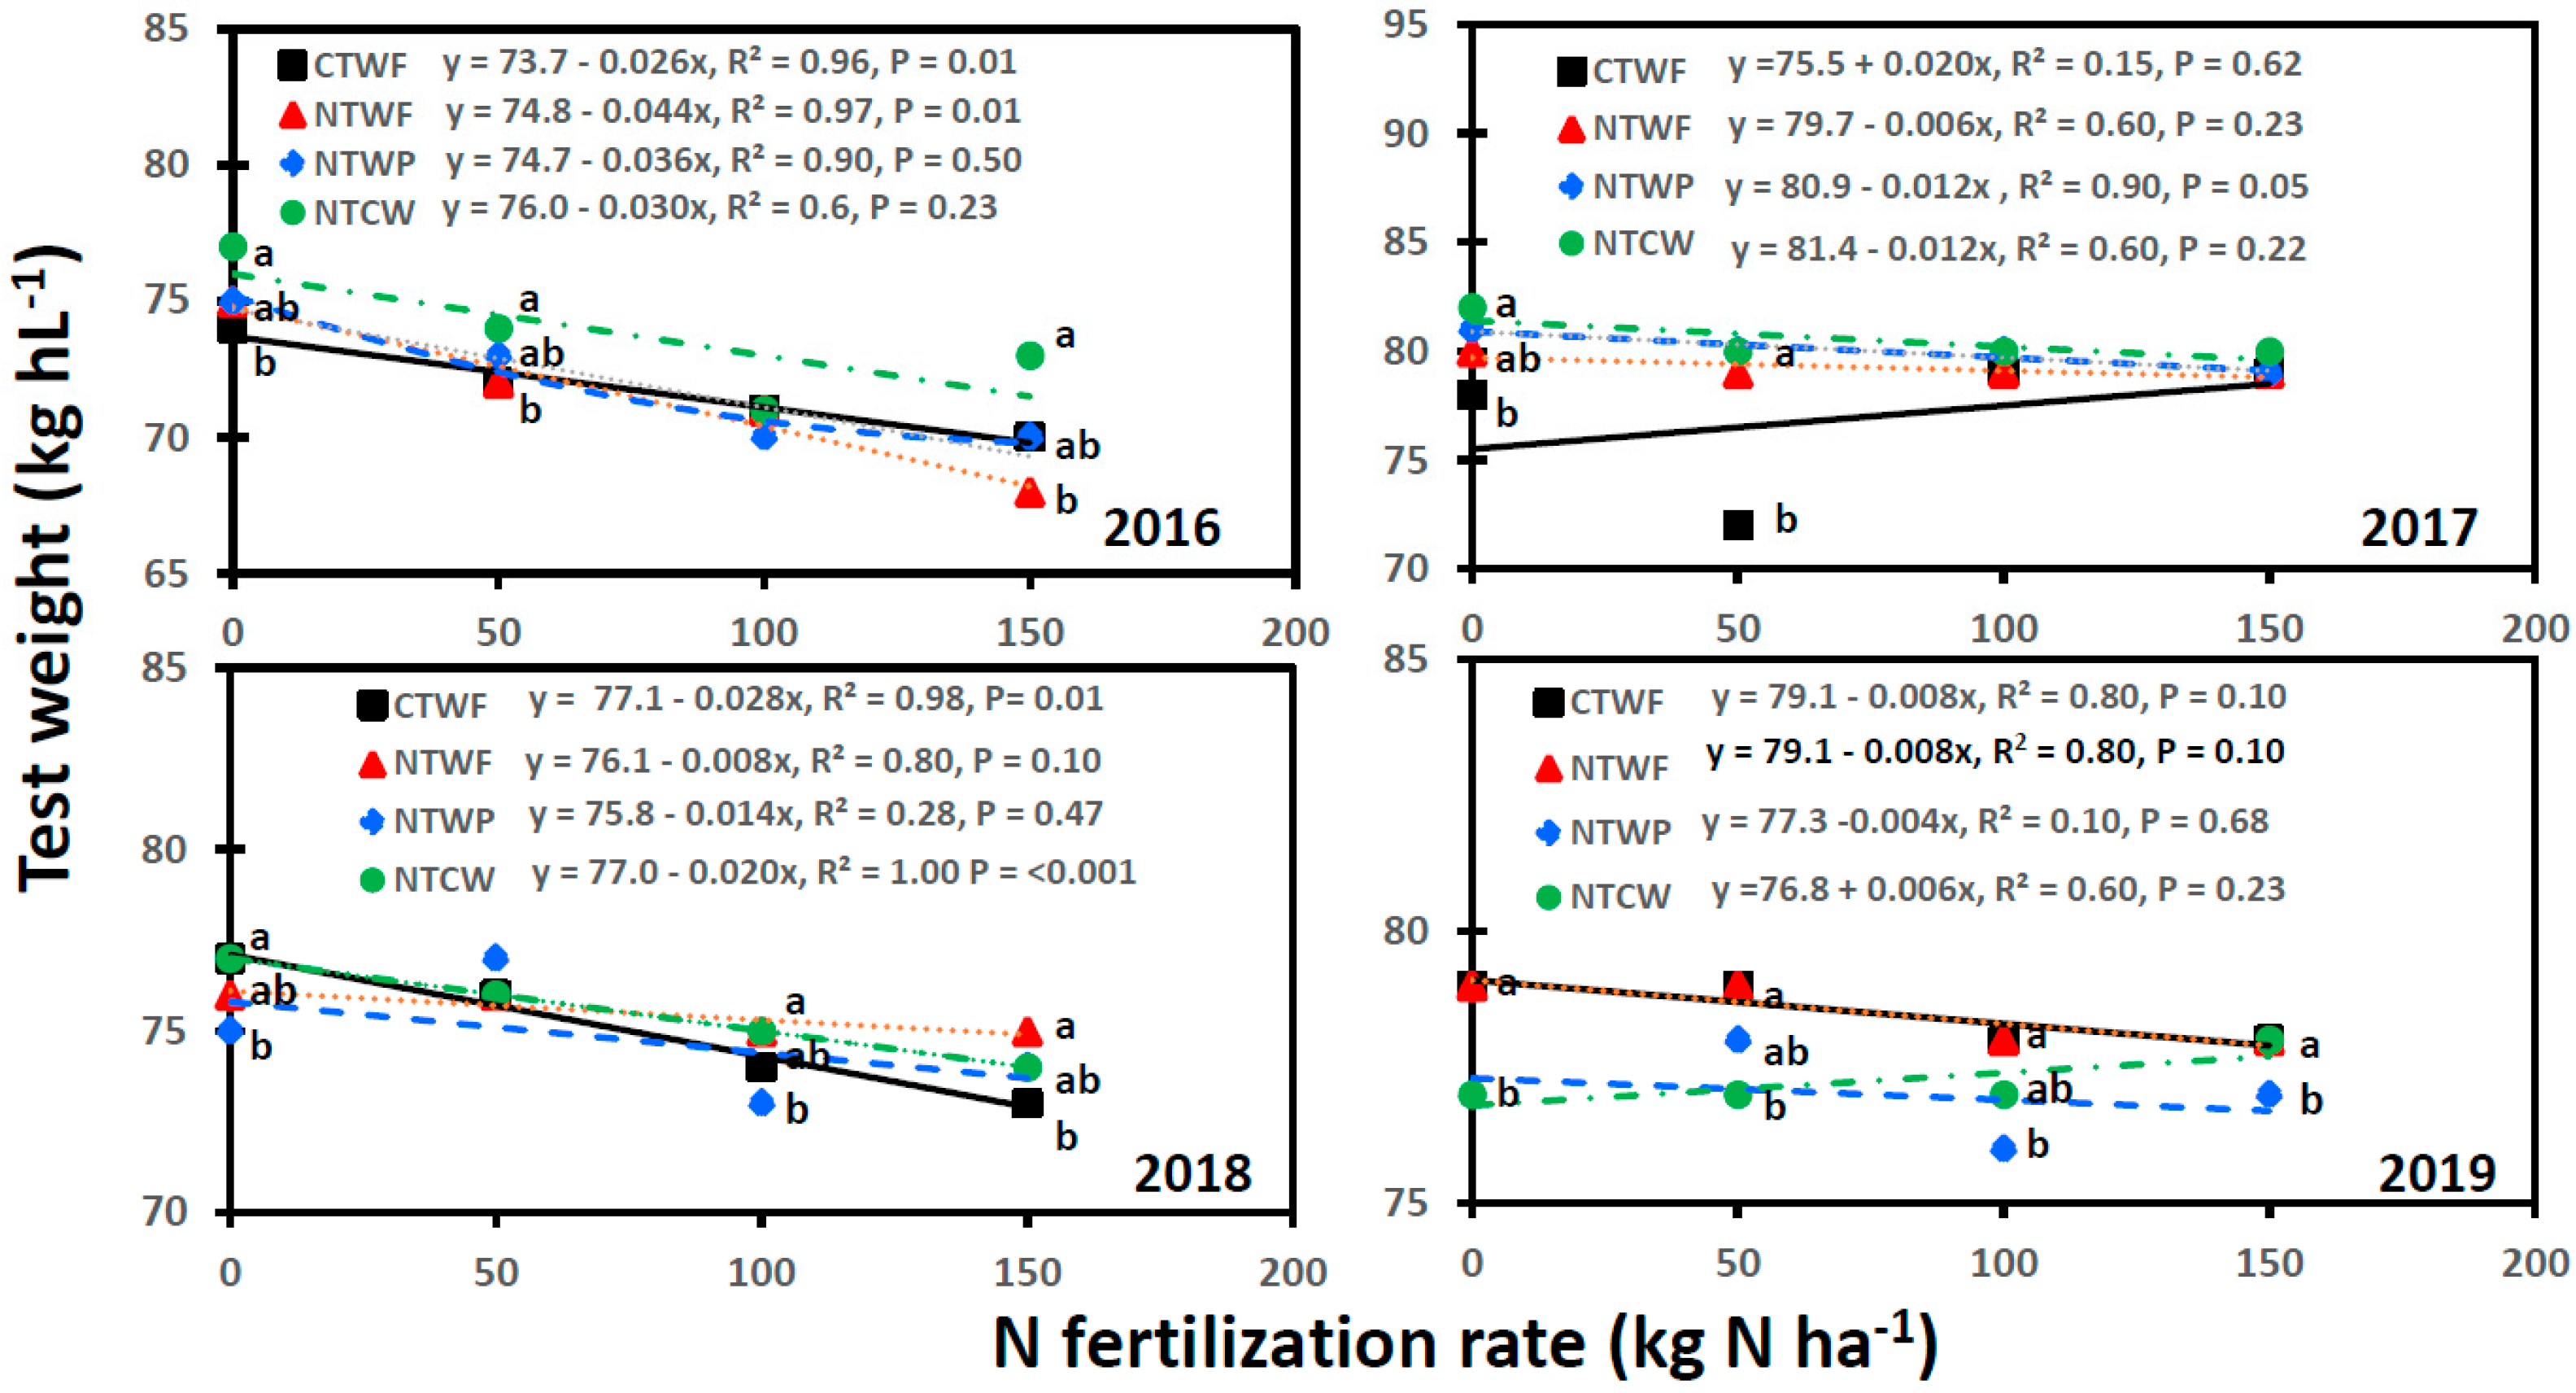
3.7. Grain Test Weight
3.8. Grain Protein Concentration
4. Discussion
4.1. Soil Nitrate Nitrogen
4.2. Plant Density
4.3. Straw Yield
4.4. Grain Yield
4.5. Harvest Index
4.6. Grain Test Weight
4.7. Grain Protein Concentration
5. Conclusions
Supplementary Materials
Author Contributions
Funding
Data Availability Statement
Acknowledgments
Conflicts of Interest
Abbreviations
References
- Alan, R.E. Wheat. In Hybridization of Crop Plants; Fehr, W.R., Hadley, H.H., Eds.; ASA, CSSA, and SSSA: Madison, WI, USA, 1980; pp. 709–720. [Google Scholar] [CrossRef]
- Lin, R.; Chen, C. Tillage, crop rotation, and nitrogen management strategies for wheat in central Montana. Agron. J. 2014, 106, 475–485. [Google Scholar] [CrossRef]
- Black, A.L.; Tanaka, D.L. A conservation tillage system study in the northern Great Plains of the United States. In Soil Organic Matter in Temperate Agroecosystems: Long Term Experiments in North America; Paul, E.A., Ed.; CRC Press: Boca Raton, FL, USA, 1997; pp. 335–342. [Google Scholar] [CrossRef]
- Aase, J.K.; Schaefer, G.M. Economics of tillage practices and spring wheat and barley crop sequence in the northern Great Plains. J. Soil Water Conserv. 1996, 51, 167–170. [Google Scholar] [CrossRef]
- Sainju, U.M.; Lenssen, A.W.; Caesar, T.; Waddell, J.T. Carbon sequestration in dryland soil and plant residue as influenced by tillage and crop rotation. J. Environ. Qual. 2006, 35, 1341–1347. [Google Scholar] [CrossRef]
- Sainju, U.M.; Wang, J.; Barsotti, J.L. Net global warming potential and greenhouse gas intensity affected by cropping sequence and nitrogen fertilization. Soil Sci. Soc. Am. J. 2013, 78, 248–261. [Google Scholar] [CrossRef]
- Farahani, J.J.; Peterson, G.A.; Westfall, D.G. Dryland cropping intensification: A fundamental solution to efficient use of precipitation. Adv. Agron. 1998, 64, 167–170. [Google Scholar] [CrossRef]
- Lenssen, A.W.; Sainju, U.M.; Jabro, J.D.; Iversen, W.M.; Allen, B.G.; Evans, R.G. Crop diversification, tillage, and management system influence spring wheat yield and water use. Agron. J. 2014, 106, 1445–1454. [Google Scholar] [CrossRef]
- Miller, P.R.; Gan, Y.; McConkey, B.G.; McDonald, C.L. Pulse crops for the northern Great Plains: I. Grain productivity and residual effects on soil water and nitrogen. Agron. J. 2003, 95, 972–979. [Google Scholar] [CrossRef]
- Sainju, U.M. The impact of no-till crop rotation on dryland soil properties and crop yields. Agron. J. 2022, 114, 2796–2810. [Google Scholar] [CrossRef]
- Carr, P.M.; Horsey, R.D.; Martin, G.B. Impact of tillage and crop rotation on grain yield of spring wheat. I. Rotation effect. Crop Manag. 2006, 5, 1–8. [Google Scholar] [CrossRef]
- Stevenson, F.C.; van Kissel, C. The nitrogen and non-nitrogen rotational benefits of pea to succeeding crops. Can. J. Plant Sci. 1996, 76, 735–745. [Google Scholar] [CrossRef]
- Carr, P.; Fordyce, S.I.; Lachowiec, J.; Bishop, S.; Fryer, H.K.; Dahlhausen, S. Replacing fallow with warm-season annual crops in dryland cropping systems. Agron. J. 2021, 113, 4142–4160. [Google Scholar] [CrossRef]
- Mohammed, Y.A.; Chen, C. Cropping system affect wheat yields, nitrogen-use efficiency, and nitrous oxide emissions. Agron. J. 2018, 110, 1147–1156. [Google Scholar] [CrossRef]
- Koeshall, S.T.; Easterly, A.C.; Werle, R.; Stepanovic, S.; Creech, C.F. Replacing fallow with pea in wheat production systems across western Nebraska. Agron. J. 2022, 114, 3329–3346. [Google Scholar] [CrossRef]
- Lafond, G.P.; May, W.E.; Holzapfel, C.B.; Lemke, R.L.; Lupwayi, N.Z. Intensification of field pea production. Impact on agronomic performance. Agron. J. 2011, 103, 396–406. [Google Scholar] [CrossRef]
- Miller, P.R.; Engel, R.E.; Holmes, J.A. Cropping sequence effect of pea and pea management on spring wheat in the northern Great Plains. Agron. J. 2006, 98, 1610–1619. [Google Scholar] [CrossRef]
- Long, D.S.; McCallum, J.D.; Reardon, C.L.; Engel, R.E. Nitrogen requirement to change protein concentration of spring wheat in semiarid Pacific Northwest. Agron. J. 2017, 107, 675–683. [Google Scholar] [CrossRef]
- Walsh, O.S. Nitrogen fertility and residue management effects on dryland no-till hard red spring wheat. Agrosyst. Geosci. Environ. 2019, 2, 1–7. [Google Scholar] [CrossRef]
- Grant, C.A.; Moulin, A.P.; Tremblay, N. Nitrogen management effects on spring wheat yield and protein concentration vary with seeding date and slope position. Agron. J. 2016, 108, 1246–1256. [Google Scholar] [CrossRef]
- Walsh, O.S.; Marshall, J.; Nambi, E.; Shafron, S.; Jayawardane, D.; Jackson, C.; Lamichhane, R.; Ansah, E.O.; McClintok, J. Spring wheat yield and grain quality response to nitrogen rate. Agron. J. 2022, 114, 2562–2572. [Google Scholar] [CrossRef]
- Halvorson, A.D.; Black, L.A.; Krupinsky, J.M.; Merrill, S.D.; Wienhold, B.J.; Tanaka, D.L. Spring wheat response to tillage and nitrogen fertilization in rotation with sunflower and winter wheat. Agron. J. 2000, 92, 136–144. [Google Scholar] [CrossRef]
- Halvorson, A.D.; Nielsen, D.C.; Reule, C.A. Nitrogen fertilization and rotation effects on no-till dryland wheat production. Agron. J. 2004, 96, 1196–1201. [Google Scholar] [CrossRef]
- Otteson, B.N.; Mergram, M.; Ransom, J.K. Seeding rate and nitrogen management effects on spring wheat yield and yield components. Agron. J. 2007, 99, 1615–1621. [Google Scholar] [CrossRef]
- Littell, R.C.; Milliken, G.A.; Stroup, W.W.; Wolfinger, R.D. SAS System for Mixed Models; SAS Institute Inc.: Cary, NC, USA, 1996. [Google Scholar]
- Heggenstaller, A.H.; Moore, K.J.; Liebman, M.; Anex, R.P. Nitrogen influences biomass and nutrient partitioning by perennial, warm-season grasses. Agron. J. 2009, 101, 1363–1371. [Google Scholar] [CrossRef]
- Rivera-Amado, C.; Trujillo-Negrellos, E.; Molero, G.; Reynolds, M.P.; Sylvester-Bradley, R.; Foulkes, M.J. Optimizing dry matter partitioning for increased spike growth, grain number, and harvest index in spring wheat. Field Crops Res. 2019, 240, 154–167. [Google Scholar] [CrossRef]
- Carr, P.M.; Martin, G.B.; Poland, W.W. Yield and quality of hard red spring wheat cultivars following fallow and wheat. Can. J. Plant Sci. 2001, 81, 399–404. [Google Scholar] [CrossRef]
- Johnston, A.M.; Larney, F.J.; Lindwell, C.W. Spring wheat and barley response to long-term fallow management. J. Prod. Agric. 1995, 8, 264–268. [Google Scholar] [CrossRef]
- Arshad, M.A.; Soon, Y.K.; Azooz, R.H. Modified no-till and crop sequence effects on spring wheat production in northern Alberta, Canada. Soil Tillage Res. 2002, 65, 29–36. [Google Scholar] [CrossRef]
- Carr, P.M.; Martin, G.B.; Horsey, R.D. Wheat grain quality response to tillage and rotation with field pea. Agron. J. 2008, 100, 1594–1599. [Google Scholar] [CrossRef]
- Campbell, C.A.; Zentner, R.P.; Selles, F.; McConkey, B.G.; Dyck, F.B. Nitrogen management for spring wheat grown annually on zero tillage. Yield and nitrogen-use efficiency. Agron. J. 1993, 85, 107–114. [Google Scholar] [CrossRef]
- Subedi, K.D.; Ma, B.L.; Xue, A.G. Planting date and nitrogen effects on grain yield and protein content of spring wheat. Crop Sci. 2007, 47, 36–44. [Google Scholar] [CrossRef]
- Farmaha, B.S.; Sims, A.L.; Wisersna, J.J. Impact of nitrogen fertility on the production and performance of four hard red spring wheat cultivars. Agron. J. 2015, 107, 864–870. [Google Scholar] [CrossRef]
- Mohammed, M.A.; Steiner, J.J.; Wright, S.D.; Bhangoo, M.S.; Millhouse, D.E. Intensive crop management practices on wheat yield and quality. Agron. J. 1990, 82, 701–707. [Google Scholar] [CrossRef]
- Xu, A.; Li, L.; Coulter, J.A.; Xie, J.; Zhang, R.; Luo, Z.; Cai, L.; Wang, L. Long-term nitrogen addition impact on agronomic traits, nitrogen uptake, and nitrogen resorption efficiency of wheat in a rainfed region. Soil Sci. Soc. Am. J. 2021, 85, 459–467. [Google Scholar] [CrossRef]
- Amato, G.; Ruisi, P.; Frenda, A.S.; Di Miceli, G.; Sala, S.; Plaia, A.; Giambalvo, D. Long-term tillage and crop sequence effects on wheat grain yield and quality. Agron. J. 2013, 105, 1317–1327. [Google Scholar] [CrossRef]
- Nyiranez, J.; Cambouris, A.N.; Zaidi, N.; Tremblay, N.; Nolin, M.C. Spring wheat yield and quality related to soil texture and nitrogen fertilization. Agron. J. 2012, 104, 589–599. [Google Scholar] [CrossRef]
- Ortiz-Monastero, J.I.R.; Penna, R.T.; Sayre, K.D.; Rajaram, S. CIMMYT’s genetic programs in wheat grain quality under four nitrogen rates. Crop Sci. 1997, 37, 892–898. [Google Scholar] [CrossRef]


| Cropping System a | N Fertilization Rate (kg N ha−1) | |||||||
|---|---|---|---|---|---|---|---|---|
| 0 | 50 | 100 | 150 | 0 | 50 | 100 | 150 | |
| Soil NO3-N content (kg N ha−1) | Amount of N fertilizer applied (kg N ha−1) | |||||||
| CTWF | 37.8a b C c | 41.6BC | 49.2abA | 52.4A | 0C | 8.4C | 50.8abB | 97.6A |
| NTWF | 43.8aB | 45.5B | 58.4aA | 61.0A | 0C | 4.5C | 41.6bB | 88.9A |
| NTWP | 39.3aB | 39.7B | 48.3bA | 57.6A | 0D | 10.3C | 51.7aB | 92.4A |
| NTCW | 23.0bC | 38.9B | 40.3bB | 58.2A | 0D | 11.1C | 59.7aB | 91.9A |
| Significance | p values | p values | ||||||
| Cropping system (CS) | 0.480 | 0.490 | ||||||
| N fertilization rate (NR) | <0.001 | <0.001 | ||||||
| CS × NR | 0.026 | 0.025 | ||||||
| Year (YR) | <0.001 | <0.001 | ||||||
| CS × YR | 0.153 | 0.164 | ||||||
| NR × YR | <0.001 | <0.001 | ||||||
| CS × NR × YR | 0.917 | 0.948 | ||||||
| 2012 | 2013 | 2014 | 2015 | 2016 | 2017 | 2018 | 2019 | 30-Year Avg. | |
|---|---|---|---|---|---|---|---|---|---|
| Precipitation (mm) | |||||||||
| April | 43 | 7 | 26 | 9 | 89 | 10 | 24 | 32 | 29 |
| May | 68 | 161 | 94 | 44 | 40 | 19 | 87 | 40 | 61 |
| June | 28 | 119 | 33 | 90 | 41 | 23 | 57 | 76 | 71 |
| July | 38 | 29 | 12 | 54 | 58 | 3 | 56 | 64 | 67 |
| August | 19 | 114 | 104 | 30 | 20 | 45 | 15 | 47 | 36 |
| Growing season a total | 197 | 430 | 268 | 227 | 247 | 100 | 239 | 258 | 264 |
| Annual total | 244 | 469 | 292 | 306 | 370 | 176 | 285 | 482 | 396 |
| Air temperature (°C) | |||||||||
| April | 8.9 | 2.2 | 4.4 | 7.8 | 7.2 | 6.7 | 2.8 | 6.7 | 8.1 |
| May | 12.8 | 13.3 | 12.8 | 11.7 | 13.9 | 13.9 | 15.6 | 10.0 | 14.2 |
| June | 18.9 | 17.2 | 16.7 | 18.9 | 19.4 | 18.9 | 18.9 | 17.2 | 19.0 |
| July | 24.4 | 20.0 | 21.1 | 22.2 | 21.7 | 25.0 | 21.7 | 20.0 | 22.3 |
| August | 21.1 | 21.1 | 20.0 | 21.1 | 21.7 | 20.0 | 20.6 | 19.4 | 22.5 |
| Growing season average | 17.2 | 14.8 | 15.0 | 16.3 | 16.8 | 16.9 | 15.9 | 14.7 | 17.2 |
| Annual average | 7.8 | 5.3 | 5.4 | 7.7 | 8.1 | 6.9 | 5.2 | 4.4 | 7.0 |
| Source | Plant Density | Straw Yield | Grain Yield | Harvest Index | Test Weight | Grain Protein Concentration |
|---|---|---|---|---|---|---|
| p values | ||||||
| CS | 0.001 | <0.001 | <0.001 | 0.886 | 0.039 | <0.001 |
| NR | 0.002 | <0.001 | <0.001 | 0.083 | <0.001 | <0.001 |
| CS × NR | 0.754 | 0.079 | <0.001 | 0.181 | 0.011 | 0.005 |
| YR | <0.001 | <0.001 | <0.001 | <0.001 | <0.001 | <0.001 |
| CS × YR | <0.001 | <0.001 | <0.001 | 0.044 | <0.001 | <0.001 |
| NR × YR | 0.677 | 0.176 | <0.001 | 0.066 | <0.001 | <0.001 |
| CS ×NR × YR | 0.469 | 0.330 | 0.038 | 0.637 | 0.017 | 0.031 |
| Cropping System a | Year | |||||||
|---|---|---|---|---|---|---|---|---|
| 2012 | 2013 | 2014 | 2015 | 2016 | 2017 | 2018 | 2019 | |
| Plant density (mil. ha−1) | ||||||||
| CTWF | 2.01a b | 0.73 | 1.09ab | 0.93 | 2.12ab | 2.35a | 1.70 | 2.19a |
| NTWF | 1.90ab | 0.69 | 1.16a | 0.98 | 2.18a | 2.20ab | 1.67 | 2.26a |
| NTWP | 1.77b | 0.72 | 1.14ab | 0.94 | 1.96b | 2.08b | 1.68 | 1.87b |
| NTCW | 1.91ab | 0.67 | 0.96b | 0.84 | 1.74c | 1.71c | 1.52 | 1.86b |
| Straw yield (Mg ha−1) | ||||||||
| CTWF | 2.73ab | 2.46a | 4.99a | 2.65 | 6.97a | 3.87a | 2.61 | 4.79a |
| NTWF | 2.98a | 2.08ab | 4.04b | 2.64 | 6.82a | 3.98a | 2.76 | 4.93a |
| NTWP | 2.26b | 2.07ab | 4.39ab | 2.81 | 6.64a | 3.10b | 2.46 | 3.77b |
| NTCW | 1.38c | 1.66b | 2.81c | 2.85 | 5.32b | 2.03c | 2.12 | 2.21c |
| Harvest index | ||||||||
| CTWF | 0.63 | 0.65ab | 0.46b | 0.52b | 0.46 | 0.57 | 0.65 | 0.57 |
| NTWF | 0.59 | 0.67a | 0.53a | 0.52b | 0.44 | 0.57 | 0.64 | 0.54 |
| NTWP | 0.61 | 0.65ab | 0.50ab | 0.55ab | 0.44 | 0.55 | 0.62 | 0.56 |
| NTCW | 0.64 | 0.61b | 0.54a | 0.59a | 0.45 | 0.55 | 0.64 | 0.52 |
| N fertilization Rate (kg N ha−1) | Plant Density (mil. ha−1) | Straw Yield (Mg ha−1) |
|---|---|---|
| 0 | 1.56a a | 2.98c |
| 50 | 1.47b | 3.34b |
| 100 | 1.56a | 3.62a |
| 150 | 1.60a | 3.79a |
Disclaimer/Publisher’s Note: The statements, opinions and data contained in all publications are solely those of the individual author(s) and contributor(s) and not of MDPI and/or the editor(s). MDPI and/or the editor(s) disclaim responsibility for any injury to people or property resulting from any ideas, methods, instructions or products referred to in the content. |
© 2025 by the authors. Licensee MDPI, Basel, Switzerland. This article is an open access article distributed under the terms and conditions of the Creative Commons Attribution (CC BY) license (https://creativecommons.org/licenses/by/4.0/).
Share and Cite
Sainju, U.M.; Pradhan, G.P. Reducing Nitrogen Fertilization Rate in Spring Wheat–Pea Rotation Sustains Spring Wheat Yield and Quality. Agronomy 2025, 15, 1806. https://doi.org/10.3390/agronomy15081806
Sainju UM, Pradhan GP. Reducing Nitrogen Fertilization Rate in Spring Wheat–Pea Rotation Sustains Spring Wheat Yield and Quality. Agronomy. 2025; 15(8):1806. https://doi.org/10.3390/agronomy15081806
Chicago/Turabian StyleSainju, Upendra M., and Gautam P. Pradhan. 2025. "Reducing Nitrogen Fertilization Rate in Spring Wheat–Pea Rotation Sustains Spring Wheat Yield and Quality" Agronomy 15, no. 8: 1806. https://doi.org/10.3390/agronomy15081806
APA StyleSainju, U. M., & Pradhan, G. P. (2025). Reducing Nitrogen Fertilization Rate in Spring Wheat–Pea Rotation Sustains Spring Wheat Yield and Quality. Agronomy, 15(8), 1806. https://doi.org/10.3390/agronomy15081806