Abstract
Peanut is a vital cash crop globally, and enhancing its seed protein content is essential for nutritional security. However, the genetic basis of seed protein content in peanut remains unclear. In this study, bulked segregant analysis combined with next-generation sequencing (BSA-Seq) was employed to isolate a candidate gene, AhSPC, associated with peanut seed protein content. Its function was then characterized in Arabidopsis thaliana through CRISPR/Cas9-mediated gene knockout and overexpression analysis. Gene editing of the homologous gene in Arabidopsis significantly reduced seed protein content in six lines, while two lines showed no obvious change. Overexpression of the AhSPC gene in Arabidopsis led to an increase in seed protein content in three transgenic lines, but some lines showed no significant change, or even a decrease. These inconsistent results might be attributed to functional redundancy, epigenetic modifications, resource competition, or feedback regulation mechanisms within the protein synthesis pathway. This study provides insights into the molecular mechanisms of peanut seed protein content regulation and offers a potential genetic target for molecular breeding.
Keywords:
groundnut; seed protein content; BSA-Seq; AhSPC; Arabidopsis thaliana; gene editing; overexpression 1. Introduction
Peanut (Arachis hypogaea L.) is a globally important widely cultivated cash crop. The seeds generally contain 22% to 26% protein, making peanut an essential source of plant-based protein for millions, particularly in developing countries [1,2,3]. Some studies have reported that in certain regions, the protein content of specific varieties or germplasm accessions may exceed 28%, and in some cases, even reach 30% [4,5], indicating significant potential for further improvement. Enhancing the protein content of peanut seeds is of considerable interest to breeders, given the increasing global demand for high-protein crops to support nutritional security.
Despite the economic and nutritional importance of seed protein content, its genetic basis in peanut remains poorly understood. The mainstream view is that seed protein content is a complex quantitative trait regulated by multiple genetic loci and influenced by environmental factors [6]. Progress in other crops—such as soybean and rice—has uncovered key regulatory genes and pathways involved in protein biosynthesis [7,8]. However, functional characterization of such genes in peanut has lagged behind [9,10,11], largely due to its complex allotetraploid genome and limited genomic resources.
In recent years, the availability of high-quality peanut reference genomes [12] has enabled the application of modern genetic mapping tools. Among them, bulked segregant analysis coupled with next-generation sequencing (BSA-Seq) offers a rapid and efficient strategy for identifying genomic regions and candidate genes linked to traits of interest. Meanwhile, the model plant Arabidopsis thaliana provides a convenient system for preliminary functional validation of candidate genes through genome editing and overexpression approaches.
In this study, we aimed to identify and functionally characterize a candidate gene associated with seed protein content in peanut. To achieve this, we applied BSA-Seq to a segregating population differing in protein content, followed by expression and functional analyses in Arabidopsis thaliana. This work aims to provide insights into the molecular mechanisms regulating seed protein content in peanut and to offer candidate genetic targets for molecular breeding efforts aimed at improving seed nutritional quality.
2. Materials and Methods
2.1. BSA-Seq and Single Marker Analysis in Peanut
The high-protein and dwarf mutant C-Za-454-2 (30.35% protein content) was generated from the peanut variety FH19 (23.15% protein content) through two rounds of 0.4% ethyl methanesulfonate (EMS) mutagenesis, each followed by near-infrared spectroscopy (NIRS) screening using a Matrix-I spectrometer (Bruker Optik GmbH, Ettlingen, Germany) [13]. The NIRS calibration model had a calibration coefficient (R2cal) of 91.45% and root mean square error of cross-validation (RMSECV) of 0.78% [13]. For accurate protein quantification, each individual seed was scanned three times, and the average was used for further analysis. This mutant was then crossed with its wild-type parent FH19 to generate F1 hybrids, and self-pollinated to produce an F2 population of 339 individuals. From this F2 population, 30 high-protein (G) and 30 low-protein (D) single seeds were selected via NIRS [13], for extreme pool construction and subsequent BSA-Seq analysis.
The BSA analysis was performed using the Euclidean distance (ED) method. Cleaned reads were mapped to the peanut reference genome (PeanutBase v2) using Sentieon software (parameters: “bwa mem -k 32 -M -R”). The alignment results were then sorted and deduplicated using Samtools. SNPs and InDels were detected using Sentieon, followed by annotation with ANNOVAR version 2023Jan05 to determine the genomic regions and mutation types of the identified variants. To reduce background noise, the calculated ED results were fitted using a sliding window approach. Candidate intervals were defined as regions exceeding the 99% confidence threshold, followed by gene annotation of mutations within these intervals. Large-effect genes were prioritized based on functional impact, including stop-loss/gain, non-synonymous, or frameshift mutations.
Sequences flanking the selected markers were extracted, and PCR primers were designed using Primer Premier 5.0. The PCR system was set up in a total volume of 25 μL, containing 12.5 μL of 2 × Taq Master mix (Tiangen, Beijing, China), 1 μL of template DNA extracted using the method reported by Yu et al. [14], and 1 μL (10 µmol/L) each of forward and reverse primers. The amplification program began with an initial denaturation step at 94 °C for 5 min. This was followed by a touchdown phase comprising 14 cycles of denaturation at 94 °C for 30 s, annealing at 65 °C with a decrement of 0.5 °C per cycle for 30 s, and extension at 72 °C for 1 min. Subsequently, a standard cycling phase was performed for 35 cycles, involving denaturation at 94 °C for 30 s, annealing at 57.5 °C for 30 s, and extension at 72 °C for 1 min. The PCR products were analyzed by agarose gel electrophoresis. These products showing a single band were then sent to Qingdao Weilai Biotechnology Co., Ltd. (Qingdao, China) for sequencing using the Sanger method.
Single marker analysis was performed on loci showing polymorphisms between the parents using the F2 population. Independent sample t-tests were conducted with SPSSau (https://spssau.com/) to evaluate the association between marker genotypes and protein content, determining whether the markers were linked to protein content.
2.2. Protein Domain Analysis, Amino Acid Conservation Analysis of the Mutation Site, RNA-Binding Residue Prediction, and Protein-Protein Interaction (PPI) Network Analysis
The Pfam protein family database was used to identify known functional domains in the protein and determine whether the mutation occurred within critical domains. The ConSurf software (Stand Alone 1.05) (https://consurf.tau.ac.il/consurf_index.php) (accessed on 3 March 2025) was employed to analyze the amino acid conservation at the mutation site. RNA-binding residues were predicted using the hybridRNAbind tool (https://www.csuligroup.com/hybridRNAbind/) (accessed on 3 March 2025). PPI analysis was conducted with STRING (https://string-db.org/) (accessed on 3 March 2025).
2.3. Relative Expression of the Candidate Gene in Peanut Seeds
The high-protein peanut mutant line C-Za-454-2 and the wild-type FH19 were sown at the Breeding Base (121°70′ E, 42°06′ N), High-Tech Zone, Liaoning Province, China. On 10 July 2023, two-centimeter-long pegs from the first and second pairs of lateral branches were marked. U-shaped metal wires were employed to facilitate peg entry to ensure consistent soil penetration timing. Sampling was conducted using six plants each of the high-protein mutant line C-Za-454-2 and the wild-type FH19. After the pegs entered the soil, pod samples were collected at 10-day intervals on the following dates: August 4 (P1), August 14 (P2), August 24 (P3), September 4 (P4), and September 14 (P5) of the same year.
RNA was extracted using the Trizol method [15], followed by cDNA synthesis using Hifair™ III 1s t Strand cDNA Synthesis SuperMix for qPCR (with gDNA digester) (Yeasen, Shanghai, China). The qPCR reaction system was prepared using 2 × HS Taq Universal SYBR Green qPCR Master Mix (Saipubio, Shenzhen, China), and real-time fluorescence quantification was performed on an FQD-96A system (Bioer, Hangzhou, China). The thermal cycling protocol was set as follows: initial denaturation at 95 °C for 5 min (1 cycle); followed by 40 cycles of amplification (95 °C for 10 s, 60 °C for 30 s); and completed with a melting curve analysis (95 °C for 15 s, 60 °C for 60 s, 95 °C for 15 s). The qPCR primers for the candidate gene were AhSPC-F (5′-cccttcctacccctatccca-3′) and AhSPC-R (5′-cacatcgttccacacctgctc-3′). β-actin (forward primer: 5′-ttggaatgggtcagaaggatgc-3′; reverse primer: 5′-agtggtgcctcagtaagaagc-3′) was used as the reference gene. Each transformant/control had 1 technical replicate and 3 biological replicates. Relative gene expression levels were calculated using the 2−ΔΔCt method [16].
2.4. Construction of Overexpression Vector and Transformation of Arabidopsis
The overexpression vector for the candidate gene was constructed using pRI101-AN (TaKaRa Biotechnology (Beijing) Co., Ltd. (Beijing, China)) (Figure 1). First, the candidate gene CDS was amplified from the plasmid template using specific primers (SPC-pRI101-F: 5′-tatgcccgtcgaccccgggatggctaccgtcgaaccaat; SPC-pRI101-R: 5′-atcggggaaattcgagctcttaaagtctgaaagaactgtagcc) and PrimeSTAR HS DNA polymerase (TaKaRa, Dalian, China). The PCR product was gel-purified and ligated into the pRI101-AN overexpression vector digested with SmaI and SacI (TaKaRa, Dalian, China). The ligation product was then transformed into DH5α competent cells (Coolaber CC501, Beijing, China).

Figure 1.
Partial map of pRI101-AN (TaKaRa). AtADH 5′-UTR: Arabidopsis thaliana Alcohol Dehydrogenase 5′ Untranslated Region. 35SPro and NOSPro: Cauliflower mosaic virus 35S promoter and nopaline synthase promoter. NOSTer: nopaline synthase terminator. RB: T-DNA right border. LB: T-DNA left border.
After plating on LB agar containing 50 μg/mL kanamycin and overnight incubation, colonies were screened by PCR using primers SPC-pRI101-F and SPC-pRI101-R. Positive clones were sent for sequencing verification at Tsingke Biotechnology (Beijing). After confirmation, the plasmid was extracted and transformed into Agrobacterium tumefaciens GV3101 competent cells (Coolaber, Beijing, China).
A single positive Agrobacterium colony was cultured to OD600 = 1.0 and used for floral dip transformation of Arabidopsis thaliana [17].
2.5. Gene Expression Analysis in Arabidopsis T2 Overexpression Lines
For gene expression analysis, RNA was extracted from leaf tissues of T2 plants, 18 days after sowing. First-strand cDNA was synthesized from total RNA with Hifair™ III Reverse Transcriptase (Yeasen, Shanghai, China). Quantitative RT-PCR was performed using gene-specific primers for the target gene AhSPC (KH-qF: 5′-ctgcgtgttccggctcatcg-3′; KH-qR: 5′-cgacagcaccatctagaacg-3′) and reference gene AtActin2 (AtActin2-F: 5′-ttcttcttaccgaggctcctc-3′; AtActin2-R: 5′-gaatccagcacaataccggttg-3′). The 20 μL reaction mixture contained 10 μL 2 × SYBR Green Master Mix, 0.6 μL each primer (10 μmol/L), 4 μL diluted cDNA, and 5.4 μL nuclease-free double distilled water. PCR conditions were 94 °C for 3 min; 40 cycles of 94 °C for 20 s, 56 °C for 20 s, and 72 °C for 20 s; followed by melt curve analysis (72 °C to 95 °C). Relative gene expression was calculated using the 2−ΔΔCt method normalized to AtActin2 [16].
2.6. Construction of Gene-Editing Vector and Transformation of Arabidopsis Thaliana
The gene-editing vector was constructed using the empty vector M2CRISPR (Pujie Bio, Shanghai, China) (Figure 2). The Arabidopsis homolog of the peanut high-protein candidate gene AhSPC (tentatively named AtSPC) was identified through sequence search (PEP RNA-binding KH domain-containing protein [Arabidopsis thaliana (thale cress)] Gene ID: 828706). Specific sgRNAs targeting AtSPC were designed based on its reference sequence, with primer pairs (6000F: 5′-atatatggtctcgattgcagattccgttgagaacaagttttagagctagaaatagc-3′; 6000R: 5′-attattggtctcgaaacctcctccgcggaatcgttccaatctcttagtcgactctac-3′) corresponding to target sites at cds13-35bp and cds176-198bp, respectively. PCR amplification yielded a 670 bp product, which was gel-purified after electrophoresis.

Figure 2.
Partial map of the M2CRISPR vector (After Pujie Bio). U26Pro, U29Pro, ECPro and 35S: promoters. HYGR: hygromycin resistance gene. RB: T-DNA right border. LB: T-DNA left border.
The purified fragment and M2CRISPR vector were digested with BsaI restriction enzyme (NEB), followed by gel extraction. The digested products were ligated using T4 DNA ligase (NEB) and transformed into E. coli. Positive clones were selected on kanamycin plates after 16 h incubation at 37 °C, verified by sequencing, and the confirmed plasmids were extracted for storage.
The subsequent Agrobacterium GV3101 and Arabidopsis transformation procedures followed the same protocol as described above.
2.7. Genotyping of CRISPR/Cas9-Induced Arabidopsis Mutants
Leaf tissue from putative positive transgenic plants was collected for genomic DNA extraction. PCR primers flanking the CRISPR target site (6000PF: 5′-catatcgaaaagcccaaacc; 6000PR: 5′-actaacgatgcgatcgggag) were designed to amplify a 120–200 bp region surrounding the edited locus.
Amplification used 2 mmol/L dNTPs, 10 pmol/μL primers, and 0.5 U KOD FX DNA Polymerase (Toyobo, Osaka, Japan) in 2 × Buffer. Cycling: Initial denaturation (94 °C, 2 min), 40 cycles of 98 °C/10 s, 61 °C/30 s, 68 °C/20 s, and final extension (68 °C, 8 min). The PCR products were separated by electrophoresis, and target bands were gel-purified. Sanger sequencing was subsequently conducted using the same PCR primers (6000PF/PR) for verification.
The sequencing results were aligned with the wild-type (WT) reference sequence of the target genomic region to identify CRISPR/Cas9-induced mutations.
2.8. Selection and Protein Analysis of Arabidopsis Homozygous Mutant Lines
Seeds from genotyped homozygous mutant lines were surface-sterilized and plated on ½ MS medium supplemented with 30 μg/mL hygromycin. After germination, healthy seedlings were selected for each line. Selected seedlings were transplanted and grown to maturity under controlled conditions. Mature seeds were harvested for protein analysis. Seed protein content was measured using the Kjeldahl method. Total protein was calculated with the conversion factor 6.25.
2.9. Statistical Analysis of Seed Protein Content of Arabidopsis
The Shapiro–Wilk test was used to assess data normality, and the Levene’s test was used to evaluate homogeneity of variance. Welch’s t-test was performed when the assumptions of normality and equal variance were not met. All these analyses were conducted with SPSSau.
3. Results
3.1. Candidate Gene Isolation and Protein Domain Analysis
The raw sequences obtained from sequencing the two extreme pools (high and low protein pools) were screened and filtered. After analysis using the ED (Euclidean distance) algorithm, a Manhattan plot (Figure 3) was generated. Peaks exceeding the threshold line were observed on chromosomes 1, 19, and 16. Significant intervals are shown in Table 1. Considering that genetic analysis demonstrated that the high-protein trait is controlled by a single gene pair, the peak with the highest value on chromosome 1 was selected, and 21 pairs of PCR primers were designed for specific loci with large effect within the mapping interval (Table 2).

Figure 3.
Manhattan plot for QTL mapping of protein content in peanut. Arrows indicate the prominent peaks exceeding the red significance threshold line.

Table 1.
Significant intervals identified by BSA-seq.

Table 2.
Primer sequence information designed for chromosome 1.
Figure 4 shows the agarose gel electrophoresis pattern of the PCR product amplified with the primer pair Chro1-17. The genotypes of the F2 individuals were obtained after sequencing the PCR products.
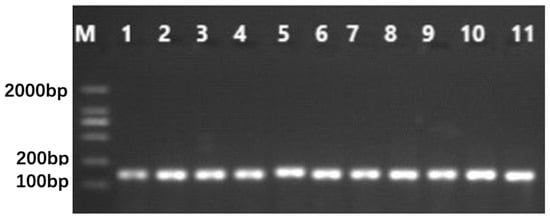
Figure 4.
Agarose gel electrophoresis of DNA amplified products with primer pair Chro1-17. M: TaKaRa DL2000 DNA Marker, 1~6: high protein F2 individuals, 7~11: low protein F2 individuals.
For single-marker analysis, an independent-sample t-test was conducted using protein content data and grouped genotypes. The primer pair Chro1-17 revealed a highly significant difference in seed protein content among F2 individuals with distinct genotypes (t = 14.6581, df = 9, p = 0.0000 < 0.01). A clear separation was observed between the two genotype groups: one group consistently exhibited high seed protein content (mean protein content was 35.65%), whereas the other showed low seed protein content (mean protein content was 23.87%). Notably, this marker accounted for 95.20% of the phenotypic variation. Figure 5 displays the partial sequence alignment of Chro1-17 amplification products from selected F2 individuals with contrasting protein content. At the position indicated by the arrow, high-protein individuals consistently exhibited an “A”, while low-protein individuals displayed a “T” (Figure 5).
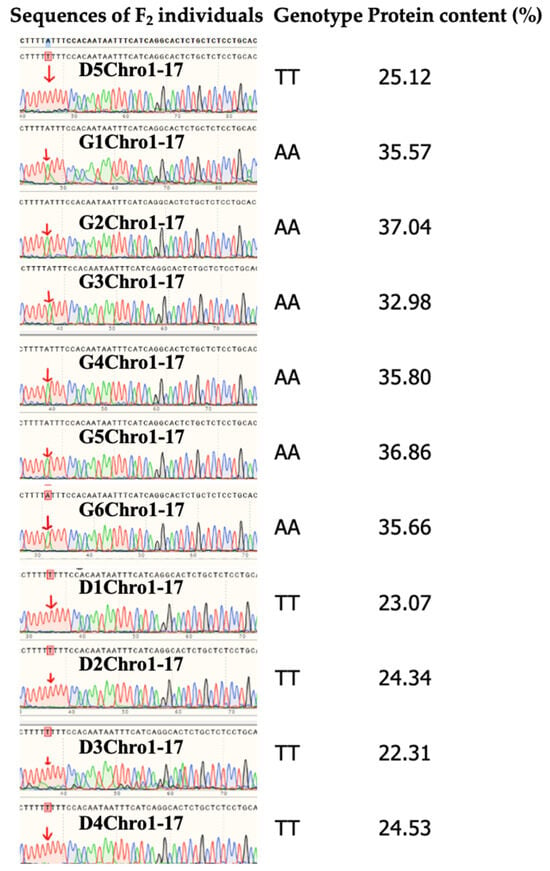
Figure 5.
Genetic and phenotypic characterization of F2 segregating population. (Left) Partial Sanger sequencing chromatograms of PCR products amplified with primer pair Chro1-17 from representative F2 individuals (The initials D or G in the F2 individual names represent low protein or high protein, respectively), with polymorphic bases indicated with arrows. (Middle) Genotypes of the F2 individuals. (Right) Seed protein content measurements for each genotyped individual.
Analysis of the mutated sequence revealed that the gene was located on its complementary strand. At nucleotide position 1229 of the CDS (coding sequence), an adenine (A) in the low-protein group was replaced by a thymine (T) in the high-protein group, resulting in a missense mutation that substitutes lysine (Lys/K) with isoleucine (Ile/I) at the 410th amino acid residue of the encoded protein.
Gene function annotation showed that this is an RNA-binding KH domain-containing protein [IPR004087 (K Homology domain); GO:0003723 (RNA binding)]. The type I KH RNA-binding domain (KH-I, K homology RNA-binding domain, type I) spanned amino acid residues 362 to 428 of the protein. Pfam analysis revealed that the wild-type (WT) protein contains three KH domains (K homology domains), located at amino acid positions 95-147 (KH1), 189-255 (KH2), and 364-426 (KH3), respectively. The lower the E-value, the more reliable the match. The KH1 and KH2 domains showed exceptionally high confidence with E-values of 8.2 × 10⁻¹⁰ and 6.9 × 10⁻⁷, confirming their authentic presence. Although the KH3 domain had a slightly lower confidence score (3.15 × 10⁻⁵), it remained statistically significant. Functionally, KH domains mediate RNA binding and regulate RNA processing, translation, and stability. These domains are responsible for specific RNA recognition in many RNA-binding proteins and may be involved in mRNA transport, splicing, or translational regulation. Notably, the amino acid mutation at position 410 occurs within the KH3 domain, which could potentially impair RNA recognition and binding capacity.
The wild-type gene can be found in GenBank (PREDICTED: Arachis hypogaea RNA-binding KH domain-containing protein PEPPER (LOC112697517), mRNA). The gene was designated as AhSPC (Arachis hypogaea seed protein content).
3.2. Evolutionary Conservation Analysis of Amino Acid Residues
The protein encoded by wild-type AhSPC gene CDS was analyzed using ConSurf software to determine whether the mutation site corresponds to an evolutionarily highly conserved amino acid. The results (Figure 6) revealed that the amino acid at position 410 was marked by a deep color, indicating that this residue is a highly conserved and buried structural amino acid.
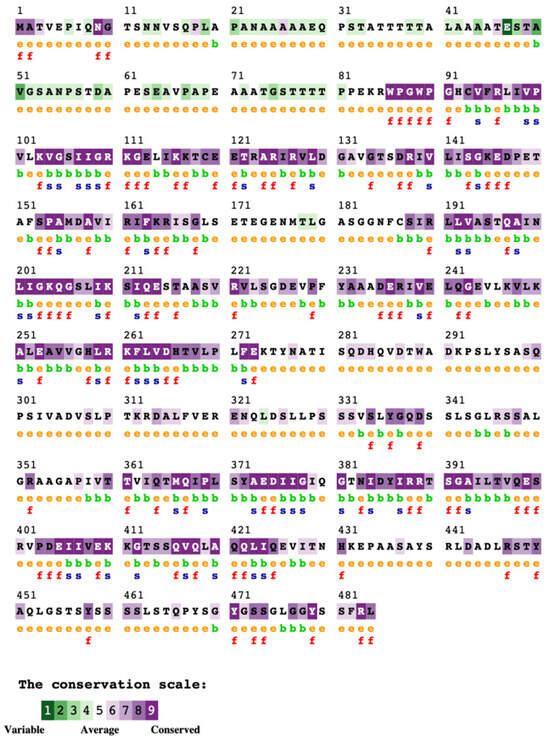
Figure 6.
Evolutionary conservation analysis of amino acid residues predicted by ConSurf. e: Exposed residue, as predicted by the neural network-based algorithm. b: Buried residue, as predicted by the neural network-based algorithm. f: Functional residue (highly conserved and exposed). s: Structural residue (highly conserved and buried). x: Insufficient data (sequence coverage <10% at this position).
3.3. Predicted RNA-Binding Residues
The RNA-binding residues predicted by hybridRNAbind are shown in Figure 7. For the amino acid K (lysine) at position 410, the prediction results were as follows: RNA_propensity was 0.004 (indicating very low binding affinity), and RNA_binary was 0 (predicted as a non-binding site). K410 itself was not predicted to be a key residue for RNA binding. Due to its inherently low binding propensity, the mutation at K410 was unlikely to significantly affect RNA-binding capability.
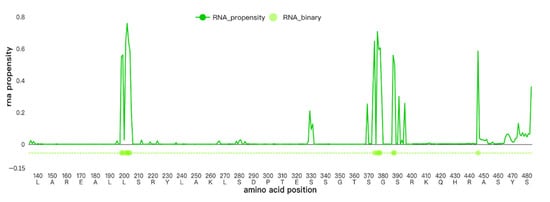
Figure 7.
RNA-binding residues predicted by hybridRNAbind.
3.4. STRING Analysis of AhSPC
The STRING analysis of AhSPC revealed a highly interconnected PPI network comprising 11 nodes and 30 edges, with an average node degree of 5.45. The statistically significant PPI enrichment (p = 0.0141) indicates that these interactions are biologically relevant rather than random. Key interacting partners are enriched in RNA-processing complexes, including the nuclear cap-binding complex and spliceosome, strongly suggesting that AhSPC functions in post-transcriptional regulation.
Functional enrichment analysis further supports this role. In biological processes, the gene is linked to ABA-activated signaling (GO:1901527, FDR = 1.04 × 10⁻¹⁰), RNA splicing (GO:0000380), and tRNA transcription (GO:0042797), all of which influence mRNA stability and translation efficiency. Molecular function annotations highlight RNA-binding activity (GO:0000399), consistent with a potential role in mRNA processing. Cellular component analysis localizes the protein to the nuclear cap-binding complex (GO:0005846, FDR = 5.71 × 10⁻¹¹), which mediates mRNA export and translation initiation. KEGG and Reactome pathways, such as the spliceosome (map03040) and mRNA surveillance (map03015), further reinforce its involvement in RNA metabolism.
3.5. Relative Expression of AhSPC in Peanut Seeds
The relative expression levels at different developing stages are shown in Figure 8. This gene exhibited relatively stable expression in wild-type seeds. However, in the high-protein mutant, its expression remained at a lower level compared to the wild type during the first four stages, then gradually increased starting from the second stage, peaking at the fifth stage. At this stage, the relative expression level of the gene was 3.73 times that of the wild type.
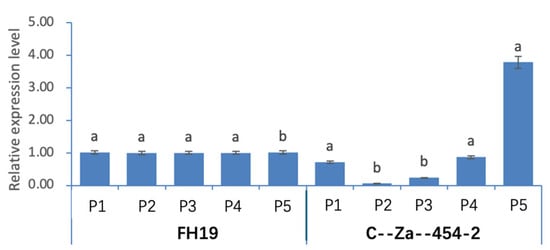
Figure 8.
Relative expression of AhSPC gene in peanut seeds of different developing stages (P1–P5). FH19: low-protein wild-type peanut cultivar, C--Za--454-2: high-protein mutant of FH19. Within each of the wild-type and mutant groups, expression levels marked with distinct lowercase letters denote statistically significant differences at the 0.01 probability level. Error bars indicate standard deviation (SD).
3.6. Functional Analysis of AtSPC in Arabidopsis Through Gene Editing
3.6.1. AtSPC Mutations in Arabidopsis CRISPRed Lines
After Agrobacterium-mediated floral dip transformation of Arabidopsis, mature T0 seeds were harvested and allowed to grow into resistant T1 seedlings. A total of 20 seedlings showed amplification bands of expected size.
Sequencing analysis of the 20 Arabidopsis seedlings resulting from our CRISPR experiment identified four AtSPC mutants (Figure 9): CR-6 (heterozygous) with overlapping peaks began at CDS 30 bp; CR-12 (homozygous) with insertion of G between CDS 29–30 bp and another G between CDS 191–192 bp; CR-13 (heterozygous) with overlapping peaks initiated at CDS 30 bp; CR-17 (homozygous) with a 162 bp deletion spanning CDS 29–190 bp.
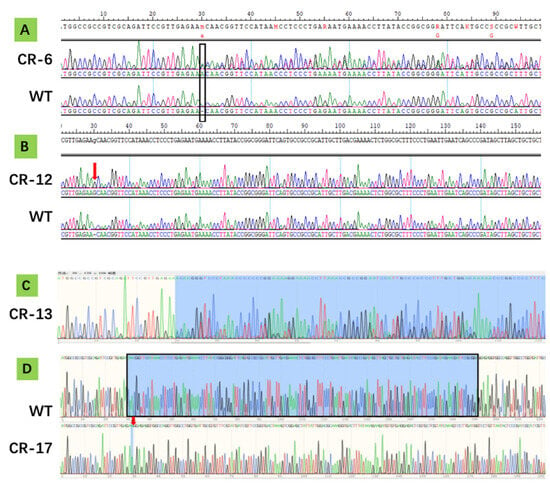
Figure 9.
Verification of CRISPR edits through AtSPC sequence alignment in four Arabidopsis lines, CR-6 (A), CR-12 (B), CR-13 (C), and CR-17 (D). Sequences of non-transgenic control (WT) are listed for comparison. (A) The rectangular box indicates the start of a series of overlapping peaks extending downstream. (B) The arrow points to the site of a G insertion. (C) The shaded area marks the region containing overlapping peaks. (D) The shaded area represents the 162 bp segment deleted in CR-17, with the arrow indicating the deletion site.
3.6.2. Protein Content in Mature Seeds of CRISPRed Arabidopsis Targeting AtSPC
Seed protein content was analyzed for CR12- and CR17-derived gene-edited T2 lines compared with non-transgenic plants (WT) (Table 3). For the seed protein content in Arabidopsis seeds, the Shapiro–Wilk test yielded p = 0.196 (>0.05), indicating that the data followed a normal distribution. However, the homogeneity of variance test showed a significant p-value of 0.025 (<0.05) for seed protein content (%), demonstrating that the data failed to meet the assumption of equal variance. Due to the relatively small sample size and heterogeneity of variance between groups, statistical analysis was performed using Welch’s t-test for independent samples. The results (Table 3) revealed a statistically significant difference in crude protein content between the WT and CRISPR/Cas9-edited groups (t = 2.691, p = 0.028), with the latter showing significantly reduced protein levels by 3.024 percent points. Furthermore, the large effect size (Cohen’s d = 1.105 ≥ 0.8) provided additional evidence for the substantial difference between groups. These findings demonstrate that targeted suppression of AtSPC gene expression through CRISPR/Cas9-mediated genome editing led to a significant reduction in seed protein content in Arabidopsis.

Table 3.
Protein content in seeds of gene-edited Arabidopsis plants and untransformed controls.
3.7. Functional Analysis of AhSPC in Arabidopsis Through Overexpression Analysis
3.7.1. Identification of Transgenic Arabidopsis Plants Overexpressing AhSPC
After floral dip transformation, mature T0 seeds were harvested and grew into nine resistant T1 seedlings. RNA was extracted from leaf tissues of T2 seedlings and subjected to gene expression analysis. The results showed that plants No. 4, 8, and 9 of the derived T2 seedlings exhibited the highest expression levels (Figure 10).
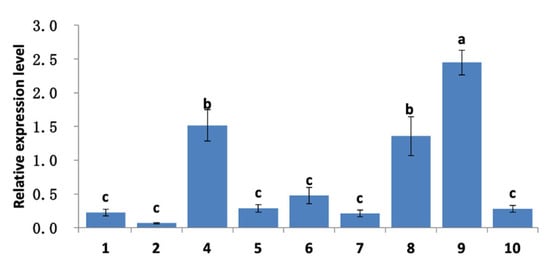
Figure 10.
Expression level of AhSPC in transgenic Arabidopsis plants. 1–2 and 4–10 are plant serial numbers. T2 seedlings marked with different lowercase letters indicate statistically significant differences in expression levels (p < 0.01). Error bars indicate SD.
3.7.2. Protein Content in Seeds of Arabidopsis Lines Overexpressing AhSPC
Based on the expression level analysis results, seeds were harvested from individual T2 plants, and 40–50 seeds per plant were used for germination resistance screening. Homozygous lines exhibiting normal growth were selected. Seeds harvested from these homozygous T2 plants were then analyzed for crude protein content. As shown in Table 4, among the selected individual lines, OE4-2, OE8-3, and OE9-6 all exhibited protein contents exceeding 23%. This indicates that the overexpression of the AhSPC gene in Arabidopsis thaliana led to increased protein content in some of the transgenic offspring.

Table 4.
Protein content in seeds of Arabidopsis lines overexpressing AhSPC.
4. Discussion
Few QTL mapping studies have focused on peanut protein content, particularly using high-protein parental materials. Recently, a major QTL was identified on chromosome B10 (equivalent to chromosome 20) using a recombinant inbred line (RIL) population derived from high- and low-protein parents, with six differentially expressed genes detected in this region [9]. However, the high-protein parent in that study (<30% protein) had lower content than ours, and the QTL was located on a different chromosome. Moreover, no transgenic validation was conducted, unlike in our study [9].
4.1. Identification and Functional Characterization of AhSPC
In the present study, we identified AhSPC as a candidate gene for peanut seed protein content using BSA-Seq and validated its function in Arabidopsis thaliana. CRISPR/Cas9 knockout of its Arabidopsis homolog (AtSPC) significantly reduced seed protein content in six edited lines, confirming its positive regulatory role. However, two knockout lines showed no phenotypic change, suggesting potential functional redundancy. Conversely, ectopic overexpression of AhSPC in Arabidopsis produced variable outcomes: three transgenic lines exhibited increased protein content, while others showed either no change or significant reduction. This phenotypic variation likely results from position effects of random T-DNA integration, metabolic trade-offs from constitutive overexpression, feedback regulation in protein biosynthesis networks, functional redundancy, or epigenetic modifications [18,19,20]. For reliable gene expression analysis, the use of multiple reference genes with specialized tools like qBase+ or REST for robust normalization is recommended.
4.2. Potential Regulatory Mechanisms of AhSPC
Although AhSPC is not directly associated with storage protein biosynthesis in protein interaction networks, its functional annotations suggest indirect regulatory roles. First, it may influence RNA processing and translation through mRNA splicing, capping, or nuclear export. Second, its enrichment in ABA-responsive pathways indicates potential hormonal control over protein deposition. Third, its involvement in tRNA transcription could affect translational capacity during seed filling. BLASTP analysis revealed high sequence conservation of AhSPC across legumes, with 85.63% identity to Stylosanthes scabra and 80.14% to Glycine max homologs. However, no prior studies have functionally linked these conserved genes to seed protein regulation.
4.3. Structural and Functional Implications of the Lys410Ile Mutation
The Lys410Ile substitution in AhSPC’s KH domain represents a significant finding with important mechanistic implications. Structural modeling predicts that this conserved residue mutation may not substantially impair RNA-binding capacity, but experimental validation remains essential. RNA immunoprecipitation (RIP) and crosslinking immunoprecipitation sequencing (CLIP-seq) could precisely characterize how this mutation affects RNA target specificity and binding affinity. Integrating transcriptomic and proteomic profiles from AhSPC-modified peanut lines will further clarify the mutation’s functional consequences. Notably, environmental factors may regulate AhSPC’s functional activity—future investigations should examine the gene’s expression patterns under varying cultivation conditions to inform development of high-protein peanut varieties with broader adaptability [21].
4.4. Translational Considerations and Future Directions
While Arabidopsis studies provide important insights, peanut-specific validation remains essential due to key biological differences. These include allotetraploid versus diploid genome organization, contrasting reproductive strategies (geocarpy versus aerial seed dispersal), and potential divergence in storage protein regulation. Future work should focus on (1) in planta validation through AhSPC knockout and overexpression in peanut; (2) multi-omics approaches including comparative transcriptomics and quantitative proteomics to elucidate regulatory networks; and (3) genome-wide association studies (GWAS) in natural peanut populations to provide additional genetic evidence for AhSPC’s role in protein content variation.
5. Conclusions
Our research identified AhSPC as a promising candidate gene regulating seed protein content in peanut. Through BSA-Seq mapping and functional characterization in Arabidopsis thaliana, we demonstrated that AhSPC likely plays a conserved and positive regulatory role in protein accumulation. Although overexpression results showed phenotypic variability, this underscores the complexity of the underlying regulatory networks and highlights the need for further investigation into gene–environment and gene–network interactions.
This study also emphasizes the limitations of heterologous systems and the necessity for native validation in peanut. Future efforts should focus on in planta gene manipulation, multi-omics integration, and detailed mechanistic studies including structural and binding analyses to fully elucidate AhSPC’s role. The evolutionary conservation of this KH-domain protein across legumes suggests its potential applicability in broader crop improvement strategies. Additionally, population-based GWAS and environmental interaction studies will be essential for establishing the gene’s practical utility in breeding programs under diverse agro-ecological conditions.
By advancing our understanding of the genetic and molecular determinants of seed protein content, this work contributes to the long-term goal of developing nutritionally enhanced peanut cultivars through molecular breeding.
Author Contributions
S.Y.: Conceptualization, methodology, software, validation, formal analysis, investigation, resources, data curation, writing—original draft preparation, visualization, and funding acquisition. Y.Z.: Methodology, resources, data curation, and writing—original draft preparation. J.D.: Methodology and writing—original draft preparation. Y.Y.: Methodology, data curation, and writing—original draft preparation. L.G.: Validation, data curation, and writing—original draft preparation. H.S.: Methodology, validation, and funding acquisition. G.Y.: Formal analysis, writing—original draft preparation, and funding acquisition. C.J.: Investigation, data curation, and writing—original draft preparation. C.W.: Conceptualization, methodology, data curation, writing—review and editing, supervision, project administration, and funding acquisition. J.Y.: Conceptualization, methodology, formal analysis, writing—review and editing, supervision, and funding acquisition. All authors have read and agreed to the published version of the manuscript.
Funding
This research was supported by the National Natural Science Foundation of China (Grant No. 32202326); Natural Science Foundation of Shandong Province (Grant No. ZR2024MC186), Liaoning Province Germplasm Innovation and Grain Storage Technology Special Program (Grant No. 2023JH1/10200002), Qingdao Natural Science Foundation (Grant No. 24-4-4-zrjj-38-jch), the Agricultural Scientific and Technological Innovation Project of Shandong Academy of Agricultural Sciences (Grant No. CXGC2025F19), and China Agricultural Research System (Grant No. CARS-13).
Data Availability Statement
Detailed data may be provided upon request.
Conflicts of Interest
The authors declare no conflicts of interest. The funders had no role in the design of the study; in the collection, analyses, or interpretation of data; in the writing of the manuscript; or in the decision to publish the results.
References
- Mallikarjuna, N.; Varshney, R.K. Genetics, Genomics and Breeding of Peanuts; Taylor & Francis Group, LLC: Abingdon, UK, 2014. [Google Scholar]
- Shah, P.; Pandey, M.; Nayak, S.N.; Chen, C.; Bera, S.; Kole, C.; Puppala, N. Next-Generation Breeding for Nutritional Traits in Peanut. In Compendium of Crop Genome Designing for Nutraceuticals; Kole, C., Ed.; Springer Nature: Singapore, 2023; pp. 1–15. ISBN 978-981-19-3627-2. [Google Scholar]
- Smartt, J. The Groundnut Crop: A Scientific Basis for Improvement; Springer: Dordrecht, The Netherlands, 1994; ISBN 978-94-010-4315-1. [Google Scholar]
- Li, L.; Lin, S.; Liao, X.; Li, S. Study on the Quality of Seed and Hybridization in Wild Species of Genus Arachis. China Oil Crops 1994, 16, 22–26. [Google Scholar]
- Jambunathan, R.; Gurtu, S.; Raghunath, K.; Kannan, S.; Sridhar, R.; Dwivedi, S.L.; Nigam, S.N. Chemical Composition and Protein Quality of Newly Released Groundnut (Arachis hypogaea L.) Cultivars. J. Sci. Food Agric. 1992, 59, 161–167. [Google Scholar] [CrossRef]
- Wang, M.L.; Tonnis, B.; Li, X.; Benke, R.; Huang, E.; Tallury, S.; Puppala, N.; Peng, Z.; Wang, J. Genotype, Environment, and Their Interaction Effects on Peanut Seed Protein, Oil, and Fatty Acid Content Variability. Agron. J. 2024, 116, 1440–1454. [Google Scholar] [CrossRef]
- Duan, Z.; Li, Q.; Wang, H.; He, X.; Zhang, M. Genetic Regulatory Networks of Soybean Seed Size, Oil and Protein Contents. Front. Plant Sci. 2023, 14, 1160418. [Google Scholar] [CrossRef] [PubMed]
- Wang, L.; O’Conner, S.; Tanvir, R.; Zheng, W.; Cothron, S.; Towery, K.; Bi, H.; Ellison, E.E.; Yang, B.; Voytas, D.F.; et al. CRISPR/Cas9-Based Editing of NF-YC4 Promoters Yields High-Protein Rice and Soybean. New Phytol. 2024, 245, 2103–2116. [Google Scholar] [CrossRef] [PubMed]
- Chen, H.; Liu, N.; Huang, L.; Huai, D.; Xu, R.; Chen, X.; Guo, S.; Chen, J.; Jiang, H. Identification of a Major QTL for Seed Protein Content in Cultivated Peanut (Arachis hypogaea L.) Using QTL-Seq. Plants 2024, 13, 2368. [Google Scholar] [CrossRef] [PubMed]
- Sun, Z.; Qi, F.; Liu, H.; Qin, L.; Xu, J.; Shi, L.; Zhang, Z.; Miao, L.; Huang, B.; Dong, W.; et al. QTL Mapping of Quality Traits in Peanut Using Whole-Genome Resequencing. Crop J. 2022, 10, 177–184. [Google Scholar] [CrossRef]
- Sarvamangala, C.; Gowda, M.V.C.; Varshney, R.K. Identification of Quantitative Trait Loci for Protein Content, Oil Content and Oil Quality for Groundnut (Arachis hypogaea L.). Field Crops Res. 2011, 122, 49–59. [Google Scholar] [CrossRef]
- Bertioli, D.J.; Jenkins, J.; Clevenger, J.; Dudchenko, O.; Gao, D.; Seijo, G.; Leal-Bertioli, S.C.M.; Ren, L.; Farmer, A.D.; Pandey, M.K.; et al. The Genome Sequence of Segmental Allotetraploid Peanut Arachis hypogaea. Nat. Genet. 2019, 51, 877–884. [Google Scholar] [CrossRef] [PubMed]
- Wang, C.T.; Wang, X.Z.; Tang, Y.Y.; Wu, Q.; Xu, J.Z.; Hu, D.Q.; Qu, B. Predicting Main Fatty Acids, Oil and Protein Content in Intact Single Seeds of Groundnut by near Infrared Reflectance Spectroscopy. Adv. Mater. Res. 2013, 860–863, 490–496. [Google Scholar] [CrossRef]
- Yu, S.T.; Wang, C.T.; Yu, S.L.; Wang, X.Z.; Tang, Y.Y.; Chen, D.X.; Zhang, J.C. Simple Method to Prepare DNA Templates from a Slice of Peanut Cotyledonary Tissue for Polymerase Chain Reaction. Electron. J. Biotechnol. 2010, 13, 9. [Google Scholar] [CrossRef]
- Simms, D.; Cizdziel, P.E.; Chomczynski, P. TRIzol: A New Reagent for Optimal Single-Step Isolation of RNA. Focus 1993, 15, 532–535. [Google Scholar]
- Kj, L.; Td, S. Analysis of Relative Gene Expression Data Using Real-Time Quantitative PCR and the 2−ΔΔCT Method. Methods 2001, 25, 402–408. [Google Scholar] [CrossRef]
- Clough, S.J.; Bent, A.F. Floral Dip: A Simplified Method for Agrobacterium-Mediated Transformation of Arabidopsis Thaliana. Plant J. 1998, 16, 735–743. [Google Scholar] [CrossRef] [PubMed]
- Costa-Neto, G.; Fritsche-Neto, R. Enviromics: Bridging Different Sources of Data, Building One Framework. Crop Breed. Appl. Biotechnol. 2021, 21, e393521S12. [Google Scholar] [CrossRef]
- Vaddepalli, P.; Fulton, L.; Schneitz, K. Asymmetric Redundancy of ZERZAUST and ZERZAUST HOMOLOG in Different Accessions of Arabidopsis thaliana. G3 Genes|Genomes|Genetics 2019, 9, 2245–2252. [Google Scholar] [CrossRef] [PubMed]
- Herman, E.M. Soybean Seed Proteome Rebalancing. Front. Plant Sci. 2014, 5, 437. [Google Scholar] [CrossRef] [PubMed]
- Thompson, R.D.; Verdier, J. Networks of Seed Storage Protein Regulation in Cereals and Legumes at the Dawn of the Omics Era. In Seed Development: OMICS Technologies toward Improvement of Seed Quality and Crop Yield: OMICS in Seed Biology; Agrawal, G.K., Rakwal, R., Eds.; Springer: Dordrecht, The Netherlands, 2012; pp. 187–210. ISBN 978-94-007-4749-4. [Google Scholar]
Disclaimer/Publisher’s Note: The statements, opinions and data contained in all publications are solely those of the individual author(s) and contributor(s) and not of MDPI and/or the editor(s). MDPI and/or the editor(s) disclaim responsibility for any injury to people or property resulting from any ideas, methods, instructions or products referred to in the content. |
© 2025 by the authors. Licensee MDPI, Basel, Switzerland. This article is an open access article distributed under the terms and conditions of the Creative Commons Attribution (CC BY) license (https://creativecommons.org/licenses/by/4.0/).
