Abstract
Sheath blight (ShB), caused by the necrotrophic fungus Rhizoctonia solani, is one of the most serious rice diseases worldwide. In this study, we successfully grafted salicylic acid (SA) onto mesoporous silica nanoparticles through an amide-bond coupling method, forming functionalized MSN-SA nanoparticles. Physicochemical characterization showed that the MSN-SA nanoparticles were spherical, with an average particle size of approximately 30 nm and an SA loading rate of around 7.21%. The assessment of ShB resistance revealed that both SA and MSN-OH treatments were capable of inducing resistance to a certain extent. When SA and MSN-OH were applied in combination, the resistance was further augmented, indicating an additive effect between them. Intriguingly, MSN-SA treatment (50% in Lemont) exhibited a higher and more durable control efficacy compared with SA + MSN-OH treatment (33%). Moreover, field experiments demonstrated that the MSN-SA was safe for rice, and under severe disease conditions, it could recover 16.7% of the yield loss, thus highlighting its substantial application value. Further transcriptome analysis and physicochemical assays suggested that MSN-SA released SA in a slow and continuous manner, thus persistently activating the immune response, and that MSN-SA integrated the effects of SA and MSN-OH, thereby enhancing the ShB resistance. Altogether, our results provide new perspectives and a novel nanomaterial-based immune elicitor for the green control of ShB.
1. Introduction
Rice is a vital staple crop, feeding over half of the world’s population and playing a significant role in global food security. However, its production is facing multiple challenges, such as infestations of diseases and pests, climate change, and excessive use of pesticides and fertilizers, which lead to slower yield growth and potential production decline. Sheath blight (ShB), caused by Rhizoctonia solani (R. solani), is one of the most destructive diseases in rice worldwide. At the early disease stage, small lesions emerge on leaf sheaths near the water surface. These lesions then expand upward along the leaf sheath, obstructing photosynthesis and nutrient transportation. In severe cases, they spread to the flag leaf, leading to plant lodging [1,2,3]. ShB typically results in an average annual yield loss ranging from 10 to 30%. Under favorable conditions, this loss can even reach as high as 50% [1,2,3]. ShB resistance is a typical quantitative trait controlled by multiple quantitative trait loci (QTLs) or genes [4]. Cultivating resistant varieties using resistant genes is the most economical and environmentally friendly strategy for controlling the disease [5]. Unfortunately, available QTLs/genes with breeding values for ShB resistance are very limited, which heavily hinders the development of resistant rice varieties [3,6]. Therefore, the traditional breeding approach has not been able to contain this disease well so far. Currently, control of ShB disease is highly dependent upon chemical fungicides like thifluzamide and validamycin. However, although chemical fungicides can effectively suppress the disease in the short term, their long-term and extensive use heavily threatens the environment and the green production of rice [7,8]. Thus, it is urgent to seek effective and safer agents to control ShB disease.
Functionalized nanomaterials are attracting growing attention in plant disease control due to their potential for enhancing the physicochemical properties of traditional agrochemicals as well as for boosting the green and eco-friendly concept of reducing agrochemical usage while increasing efficiency [9,10]. Mesoporous silica nanoparticles (MSNs), which are characterized by high stability, strong loading capacity, low toxicity, and environmental friendliness, have been extensively applied in pesticide delivery systems [11,12,13]. For instance, PC@MSNs (MSNs loaded with the active ingredient p-cymene) have shown remarkable inhibitory effects in the control of rice bacterial blight [14]. Furthermore, it is particularly noteworthy that MSNs are designed to possess highly specific responsiveness to multiple stimuli, including pH, temperature, urease, and redox conditions. This unique functionality endows them with the ability to precisely regulate the controlled release of drugs, thereby offering enhanced efficacy and targeted delivery in disease-control applications [15,16,17]. For example, a thermo-responsive copolymer was employed in smart nano valves used on the surface of MSNs to govern the release of thiamethoxam, thus forming a novel temperature-responsive controlled-release insecticide [18]. More importantly, these silica-based hybrid nanoparticles have exhibited the potential to stimulate the innate immune response in plants, thus enhancing broad-spectrum disease resistance in crops [19,20,21]. To date, no research studies have been reported regarding the utilization of MSNs in the control of rice ShB. Given that MSNs are silica-based nanoparticles and that multiple studies have demonstrated that silicon (Si) treatment can elevate resistance against ShB [22,23,24], these imply that MSNs probably have favorable effects in the management of ShB.
Salicylic acid (SA), a crucial endogenous plant hormone, plays a key role in activating plants’ defense responses against both biotic and abiotic stresses [25,26]. Some studies have made attempts to utilize nanocarriers loaded with SA to assist plants in defending against pests or salt stress [27,28]. For example, Wang et al. [27] found that foliar application of SA–chitosan nanocomposites (SCNs) demonstrated more pronounced control efficiency against S. frugiperda compared with SA and chitosan treatments applied individually. The nanopesticide EB@MSN-KH550-SA, synthesized through sequentially grafting KH550 (a coupling agent) and SA onto MSNs, enhanced the salt tolerance of cucumber plants [28]. These studies indicate that the utilization of nanoparticles loaded with SA probably represents a more efficient strategy for combating both biotic and abiotic stress in plants. Interestingly, SA has been reported to positively regulate resistance against R. solani [29,30,31]. Therefore, we speculate that grafting SA onto MSNs may enhance the ShB resistance more effectively and more strongly.
In this study, we grafted SA onto MSNs using an amide-bond coupling method to synthesize functionalized MSN-SA nanoparticles. Then, the physicochemical characteristics and the loading capacity of the MSN-SA nanoparticles were characterized. Furthermore, we comprehensively evaluated their control efficacy against ShB and their safety for rice. In addition, we conducted an in-depth analysis of the mechanisms underlying their enhancement of resistance against R. solani.
2. Materials and Methods
2.1. Synthesis of MSN-SA Nanoparticles
To prepare MSN-OH, 0.15 g of triethanolamine, 0.48 g of cetyltrimethylammonium bromide, and 40 mL of deionized water were magnetically stirred at 80 °C for 30 min. Then, 4 g of tetraethyl orthosilicate (TEOS) was slowly introduced into the surfactant solution. The resulting mixture was then vigorously agitated for 4 h. After that, the solution was aged for 8 h, and then the product was collected by centrifugation. The surfactant was removed by refluxing the product in an acidic ethanol solution (containing 2% hydrochloric acid) for 12 h. This procedure was repeated three times. Finally, the product was centrifuged, washed, and dried at 80 °C to obtain MSN-OH in powder form.
For the synthesis of MSN-NH2, 0.5 g of MSN-OH was dispersed in 100 mL of toluene. The suspension was then heated to 90 °C and continuously stirred for 3 h. Subsequently, the mixture was allowed to cool to room temperature, and 500 μL of 3-aminopropyltriethoxysilane (APTS) (0.5 mL; 2.5 mmol) was added. The mixture underwent continuous stirring at room temperature for a period of 1 h, and then it was reheated to 90 °C and refluxed under nitrogen protection for 36 h. After being cooled to room temperature again, the product was centrifuged, washed three times with toluene, and vacuum-dried.
To synthesize MSN-SA, 0.2 g of N-hydroxysuccinimide (NHS) and 0.2 g of 1-ethyl-3-(3-dimethylaminopropyl)carbodiimide (EDC) were dissolved in 10 mL of N,N-dimethylformamide (DMF) containing 0.1 g of SA under vigorous magnetic stirring. After 30 min of stirring, 0.1 g of MSN-NH2 was added to the solution. The reaction mixture was stirred at room temperature for 24 h. Finally, the MSN-SA product was obtained by centrifugation (12,000 rpm at 4 °C for 10 min) and vacuum freeze-drying, resulting in a white powder. These experiments were conducted in June 2024.
2.2. Characterization of MSN-SA Nanoparticles
The morphology and porous structure of the MSN-SA nanoparticles were characterized using an FEI Tecnai G2 F30 transmission electron microscope (FEI, Hillsboro, OR, USA). The chemical structure of MSN-SA was examined by 13C magic-angle spinning nuclear magnetic resonance (MAS NMR) on a Bruker AVANCE III 400 WB spectrometer operating at 400 MHz, with a 4 mm rotor spinning at 6.5 kHz. Thermogravimetric analysis (TGA) was performed using a Q500 Thermogravimetric Analyzer (TA Instruments, New Castle, DE, USA). The temperature range extended from room temperature to 800 °C, with a heating rate of 10 °C per min. The zeta potential of MSN-SA was measured with a Malvern Zetasizer Nano ZS90 (Malvern Panalytical, Malvern, UK) in deionized water. These experiments were conducted in June 2024.
2.3. Evaluation of ShB Resistance
The cultivation and inoculation of R. solani were conducted following the methods described by [32,33]. A highly pathogenic R. solani AG 1-IA isolate, RH-9, was employed to inoculate rice [32]. Initially, this isolate was cultured on potato dextrose agar medium supplemented with 50 μg/mL kanamycin at 28 °C for 3 days. Subsequently, fungal blocks (1.0 cm in diameter) were transferred to potato dextrose broth medium containing 0.8 mm thick and 1.0 cm long wood veneers and incubated at 28 °C until the hyphae twined around the wood veneers. These hyphae-colonized wood veneers were then used as the inoculum.
For field inoculation, during the late tillering stage, the inoculum was inserted into the third sheath from the top of each plant, and three main tillers of each plant were inoculated. According to the “0-9” disease scoring system, the disease index was recorded 30 days after heading, with more than 30 sheaths per treatment being examined. For greenhouse inoculation, the plants were cultivated in plots in a natural environment until the early booting stage. Then, two days prior to inoculation, they were relocated to a greenhouse where the relative humidity was maintained within the range of 75–85% under long-day conditions (a 14 h light period at 30 °C followed by a 10 h dark period at 24 °C). The same inoculation method as used in the field was applied to three main tillers of each plant. The lesion lengths were measured 7 or 14 days after inoculation. The rice cultivars used in this study were Lemont (a japonica cultivar from West Monroe, LA, USA), Nipponbare (NIP, a japonica cultivar from Nagoya, Aichi Prefecture, Japan), Nangeng5055 (NG5055, a japonica cultivar from Nanjing, China), Minghui63 (MH63, an indica restorer line from Sanming, China) and Xudao3 (XD3, a japonica cultivar from Xuzhou, China). These experiments were conducted from July to August 2024.
2.4. Histochemical Staining and Quantification of Fungal Biomass
For lactophenol cotton blue (LPCB) staining, inoculated leaf sheaths were prepared 48 h post inoculation (hpi). Hyphal development was observed using a light microscope (DMLS, 20-100×; Leica, Wetzlar, Germany). Three biological replicates were included. To quantify fungal biomass, inoculated leaf sheaths were sampled 48 hpi. Total RNA was extracted from the samples using the TRIzol reagent (Qiagen, Beijing, China). Briefly, samples were homogenized in TRIzol for 2 min. Then, 200 μL chloroform was added, and the mixture was vortexed for 15 s and then incubated for 3 min. Samples were centrifuged at 12,000× g for 15 min at 4 °C; the aqueous phase was transferred to a new tube. An aliquot of 500 μL isopropanol was added to the aqueous phase; this was mixed and then incubated for 10 min. Centrifugation (12,000× g; 10 min; 4 °C) yielded an RNA pellet. The pellet was washed twice with 1 mL 75% ethanol (DEPC-treated water), air-dried for 10 min, and resuspended in 50 μL RNase-free water. RT-qPCR analysis was carried out on the Light Cycler 480 system. Gene expression levels were measured with three biological replicates. The fungal biomass level was quantified based on the expression level of the 18S rRNA gene, with the expression level of the OsActin gene used as a control. These experiments were conducted in July 2024.
2.5. Field Trial for Analyzing the Rice Grain Yield and Quality
To evaluate the phytotoxicity of MSN-SA on rice plants, a field test under severe disease conditions was conducted using the japonica rice variety XD3. Treatments included MSN-SA, thifluzamide (the main pesticide for controlling ShB in production), and water spray (negative control). Rice plants were involved in the field trial for yield evaluation using a completely randomized block design. To ensure the development of severe disease, a severe-disease condition was induced through the artificial inoculation of R. solani onto 6 tillers per plant. The inoculation procedure was identical to that described above. Each treatment consisted of 6 replications/plots, with each plot measuring 2.37 m in length and 1.38 m in width. Each plot contained 10 rows, with 12 plants per row (row spacing of 11.55 cm × 23.76 cm). To minimize marginal effects, only the 6 inner rows, with 8 middle plants per row (48 plants per plot, covering approximately 1.32 m2 in the field), were rated for disease and harvested for the measurement of grain yield and quality. Subsequently, for all plot samples, the following traits were measured: grain yield per plot, seed-setting rate, 1000-grain weight, panicle number, grain number per panicle, plant height, growth period, chalkiness rate, and amylose content. These experiments were conducted from July to October 2024.
2.6. RNA-Seq and Functional Classification of DEGs
RNA-seq was employed to compare the transcriptomic profiles from leaf sheath tissues (inoculation sites) at 12 hpi with R. solani, that had been treated with Mock, SA, MSN-OH, SA + MSN-OH, or MSN-SA for 2 days prior to inoculation. RNA was obtained from the leaf sheath samples using the TRIzol reagent (Qiagen). RNA sequencing was carried out at Wuhan Bena gen Technology Co., Ltd. in Wuhan, China, by means of the Illumina Nova seq 6000 platform. The clean reads were mapped to the rice Nipponbare genome. The screening criteria for differentially expressed genes (DEGs) were defined as a fold change (FC) of at least 2 and a p-value of less than 0.05. Gene ontology (GO) analysis was conducted using DAVID Resources 6.7 (http://david.ncifcrf.gov/, accessed on 30 August 2024) [34]. Three biological replicates were included. The raw sequence data from the RNA-seq analysis have been deposited into the Genome Sequence Archive within the National Genomics Data Center, which is affiliated with the China National Center for Bioinformation/Beijing Institute of Genomics, Chinese Academy of Sciences (GSA: PRJNA835302), and are publicly accessible at https://ngdc.cncb.ac.cn/gsa (accessed on 30 August 2024). These experiments were conducted from July to September 2024.
2.7. Determination of SA Content
To measure the SA content, leaf sheath tissues (approximately 1 g) were sampled from different treatments at 12 hpi with R. solani. Sample processing and preparation were performed according to [35]. The content of SA was determined by high-performance liquid chromatography–mass spectrometry (HPLC-MS) at Ruiyuan Biotech (Nanjing, China). For HPLC, we used the Agilent poroshell 120 SB-C8 column type. The flow rate was set at 0.3 mL per min, and the column temperature was maintained at 30 °C. For MS, we used electron-spray ionization as the ionization method. The gas flow was 12 L per min. The gas temperature was 290 °C, the sheath gas flow was 11 L per min, the sheath gas temperature was 200 °C, the ion spray voltage ranged from 3000 to 5000 V, the nebulizer pressure was 40 psi, and the capillary voltage was 4000 V. The mass spectrometer was operated in the multiple-reaction monitoring mode, and the internal standard curve method was used for the quantitative analysis. The following is the regression equation for SA: y = 2320.6x + 14,256 (R2 = 0.9986), where y is the instrument response value, and x is the concentration of the SA standard. The selected reaction monitoring conditions for protonated or deprotonated plant hormones were as follows: precursor ion, 137; collision energy, 20 V; product ion, 92.9; declustering potential, 50 V. Experiments were performed with three biological repeats. Three biological replicates were included. These experiments were conducted in September 2024.
2.8. Measurement of PAL and PPO Activity
Leaf sheath tissues (approximately 1 g) were sampled from different treatments at 12 hpi with R. solani. The activity of phenylalanine ammonia-lyase (PAL) was determined colorimetrically at 290 nm, following the method detailed by Qin and Tian [36]. PAL activity was defined as the quantity of nanomoles of cinnamic acid generated per hour per milligram of protein. The protein content within the enzyme extracts was ascertained using the Bradford method [37], with bovine serum albumin serving as the standard. The activity of polyphenol oxidase (PPO) was measured colorimetrically at 398 nm, in accordance with the method described by Qin and Tian [36]. PPO activity was expressed as the change in 398 nm per minute per milligram of protein. All measurements were conducted with three biological replicates. These experiments were conducted in November 2024.
2.9. Determination of Lignin, Cellulose and Total Soluble Phenolic Content
The leaf sheath samples were dried and then ground to a fine powder for the subsequent analysis of the contents of lignin, cellulose, and total soluble phenolics. Lignin concentration was determined spectrophotometrically following the thioglycolic acid method described by Domon et al. [38]. Cellulose was quantified by means of the anthrone reagent, following the same soluble-sugar method as that reported by Baldwin et al. [39]. The concentration of total soluble phenolics was determined colorimetrically at a wavelength of 725 nm and expressed as milligrams of phenolics per kilogram of dried leaf tissue according to the method of Rodrigues et al. [40]. All measurements were carried out using three biological replicates. These experiments were conducted in November 2024.
2.10. Diterpenoid Phytoalexin Analysis
The rice samples (about 1 g, with three biological replicates), collected as described above, were ground into a fine powder in liquid nitrogen. Subsequently, they were extracted with 5 mL of 70% methanol. Cembrene (200 ng) was added to each sample as an internal reference standard to calculate the relative accumulation of diterpenoid phytoalexins. Chlorophyll was removed through petroleum ether extraction. The remaining methanol extract was concentrated by rotary evaporation until no methanol remained. The resulting water suspension was extracted with chloroform. The organic phase was concentrated by rotary evaporation and resuspended in 200 μL of dichloromethane in a GC vial for GC-MS analysis. The analysis was performed on a Shimadzu TQ4080 GC-MS instrument (Shimadzu, Kyoto, Japan) equipped with a quadrupole mass spectrometer, following the procedures described previously [41]. The carrier gas, helium, flowed at a flow rate of 1.0 mL min−1. Samples (1 μL) were injected in the split-less mode. The temperature program was as follows: the initial temperature was maintained at 70 °C for 2 min; then, it was ramped up at a rate of 20 °C per min to 120 °C, further increased at a rate of 6 °C per min to 300 °C, and finally increased at a rate of 20 °C per min to 20 °C, where it was held for 4 min. Diterpenoid accumulation was indicated by the relative peak area (PAre), as described previously [41,42,43]. The following characterized ions were used for compound recognition: momilactone A, retention time = 29.73 min; m/z = 314 (molecular ion); m/z = 271 − 199 (reference ion). Experiments were performed with three biological repeats. These experiments were conducted in December 2024.
2.11. Measurement of POD, SOD, and GST Activity
To quantify the activities of peroxidase (POD), superoxide dismutase (SOD), and glutathione-S-transferase (GST), leaf sheath tissues (approximately 1 g) were sampled at 12 hpi with R. solani and immediately immersed in liquid nitrogen. The activities of these enzymes were detected spectrophotometrically using commercial assay kits in accordance with the manufacturers’ instructions: BC0095 for POD (Solarbio, Beijing, China), A001-4 for SOD (Njjcbio, Nanjing, China), and GST-2-W for GST (Suzhou Keming Bioengineering Company, Suzhou, China). The absorbance of the final reaction mixture was measured using a 96-well microplate reader (Thermo Scientific Microplate Reader, Varioskan LUX, Waltham, MA, USA) at specific wavelengths of 470 nm for POD, 550 nm for SOD, and 340 nm for GST. The enzyme activities were then calculated according to the recommended formulas. One unit of POD activity (U/g) was calculated as a change in absorbance of 0.01 at 470 nm within the reaction system per minute per gram of fresh weight (FW) sample. For SOD, one unit of enzyme activity was defined as the ratio of absorbance change when the absorbance at 550 nm in 1 mL of reaction buffer was inhibited by 50% per gram of FW sample. GST activity was expressed as nanomoles (nmol)/min/g FW. All measurements were taken from three biological replicates. These experiments were conducted in December 2024.
2.12. Data Analysis
All statistical analyses were conducted using the SPSS 23.0 statistical analysis software (SPSS, Chicago, IL, USA). The data were analyzed by the Duncan multiple-range test (p < 0.05 or p < 0.05) and expressed as the mean ± standard deviation (SE) for all the experiments.
3. Results
3.1. Fabrication and Characterization of MSN-SA Nanoparticles
The synthesis and preparation processes of functionalized MSN-SA nanoparticles are presented in (Figure 1). MSN-OH was prepared by an alkaline catalysis method using TEOS as the silica source. Subsequently, the surface of MSN-OH was modified with amino groups to obtain MSN-NH2, which provided reaction sites for further functionalization. Finally, using NHS and EDC as catalysts, SA was grafted onto the surface of MSN-NH2 though amide-bond coupling to synthesize the SA-functionalized MSN-NH2 (MSN-SA).
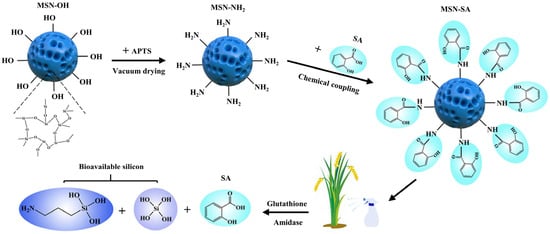
Figure 1.
Schematic diagram of the synthesis pathway of MSN-SA nanoparticles and the mechanism of their responsive release. APTS: 3-aminopropyltriethoxysilane.
The solid-state 13C MAS NMR spectrum of MSN-SA showed resonances at 42.96 parts per million (ppm), 23.89 ppm, and 11.11 ppm (Figure 2A). These resonances correspond to the -CH2 groups in the MSN-NH2, which confirms that MSN-OH has been successfully aminated. Moreover, MSN-SA presented a characteristic peak at 171.03 ppm, corresponding to the carbonyl carbon in the amide bond (Figure 2A), further validating the covalent grafting of SA onto the surface of MSN-NH2. Detection via transmission electron microscopy (TEM) revealed that MSN-NH2 displayed a distinct mesoporous structure and a relatively homogeneous spherical shape, with an average particle size of around 30 nm. Once SA was grafted onto the surface of MSN-NH2, the mesoporous channels are partially covered by the organic compound (SA), giving rise to a blurred appearance (Figure 2B). This finding validated the successful synthesis of MSN-SA.
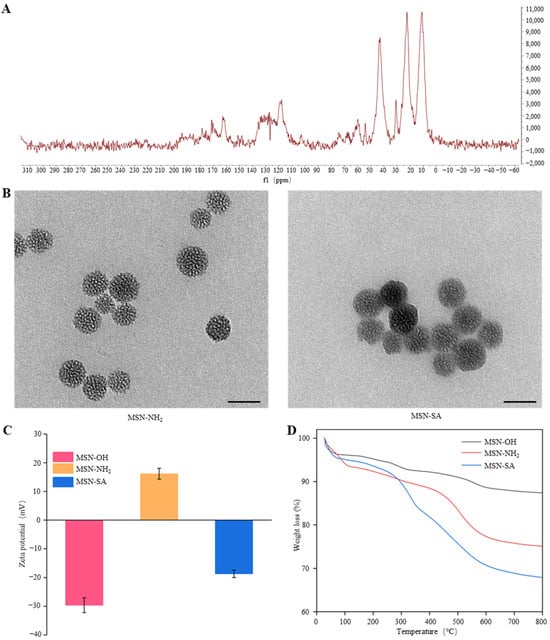
Figure 2.
The basic characteristics of MSN-SA nanoparticles. (A) 13C MAS NMR spectrum of MSN -SA. (B) TEM images of MSN-NH2 and MSN-SA. Scale bar: 50 nm. (C) Zeta potential of MSN-OH, MSN-NH2, and MSN-SA. (D) Thermogravimetric analysis (TGA) curves of MSN-OH, MSN-NH2, and MSN-SA.
As depicted in Figure 2C, the zeta potential of MSN-OH was −29.64 ± 2.61 mV, which could be ascribed to the negative charge of the Si-OH groups on the surface. After amino-functionalization to generate MSN-NH2, the zeta potential rose to +16.17 ± 1.89 mV because the Si-OH groups were replaced by NH2 groups. When SA was grafted onto MSN-NH2, the zeta potential reversed to −18.7 ± 1.32 mV, mainly owing to the shielding effect of the phenolic hydroxyl groups in SA. These groups neutralized the positive charge of the amino groups on MSN-NH2. Furthermore, quantitative analysis was carried out using TGA to evaluate the weight loss during the incorporation of SA into MSN-OH. As presented in (Figure 2D), the weight loss of MSN-OH was approximately 12.59% within the temperature range from room temperature to 800 °C. After amino-functionalization to generate MSN-NH2, this weight loss rose to 24.91%. After SA grafting, the weight loss increased to 32.12%, suggesting that the loading rate of SA was approximately 7.21%. Based on this, in MSN-SA, when the concentration of MSN-OH was 500 ppm, the concentration of SA was around 1 mM. Therefore, we used this concentration ratio for the subsequent spraying treatment experiments.
3.2. MSN-SA Induces an Excellent and Durable Resistance to ShB
To test whether MSN-SA can effectively control ShB, we sprayed the highly susceptible variety Lemont and the susceptible variety Nipponbare (NIP) with different concentrations of SA, MSN-OH, SA + MSN-OH (a mixture of SA and MSN-OH), and MSN-SA, respectively, and then inoculated these with R. solani one day after treatment. We found that on the background of Lemont, for the SA treatment, when the concentration was 0.1 mM, there was no significant difference in the lesion length (8.5 cm) at 7 dpi (day post-inoculation) compared with that of the mock inoculation (8.8 cm). However, when the concentration was increased to 1 mM, the lesion length (7.5 cm) was significantly lower than that of mock-inoculated sample (8.5 cm). When the concentration reached 4 mM (7.2 cm), the reduction in the lesion length tended to level off, indicating that SA treatment could significantly enhance the resistance to ShB and that it exhibited a certain concentration dependence (Figure 3A). For the MSN-OH treatment, at a concentration of 50 ppm, the lesion length (8.0 cm) at 7 dpi was significantly lower than that of the mock-inoculated sample (8.8 cm). When the concentration was increased to 500 ppm, the lesion length (6.9 cm) was further reduced. When the concentration reached 2000 ppm (5.9 cm), the reduction tended to plateau, indicating that MSN-OH treatment could also significantly improve the ShB resistance, showing a certain dose effect (Figure 3A).
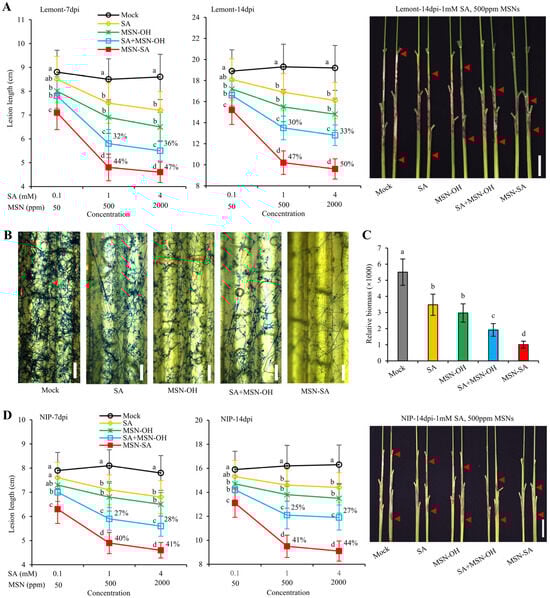
Figure 3.
MSN-SA durably enhances resistance to ShB. (A) The lesion lengths of ShB after treatment with different concentrations of SA, MSN-OH, SA + MSN-OH, and MSN-SA on the background of the highly susceptible variety Lemont. In MSN-SA, when the concentration of MSNs is 500 ppm, the concentration of SA is 1 mM. The percentages represent the control efficacy (i.e., (the lesion length of the mock sample—the lesion length of the treatment group)/the lesion length of the mock sample). (B) Lactophenol cotton blue staining revealed the hyphae of R. solani at the inoculation sites in the leaf sheaths at 48 hpi following different treatments. (C) The relative abundance of R. solani biomass in the infected leaf sheath was determined via quantitative PCR. Specific primers targeting the 18S rRNA gene of R. solani were utilized for the amplification. The OsActin gene served as the reference gene. (D) The lesion lengths of ShB after treatments with different concentrations of SA, MSN-OH, SA + MSN-OH, and MSN-SA on the background of the susceptible variety Nipponbare (NIP). The values in (A,C,D) represent the mean ± standard deviation. Different lowercase letters represent significant differences according to Duncan’s multiple-range tests (p < 0.05). Scale bar: 5 cm in (A,D); 1 mm in (B).
For the SA + MSN-OH treatment, the lesion length (5.9 cm) at 7 dpi was significantly lower than that of SA (1 mM, 7.5 cm) and MSN-OH (500 ppm, 6.9 cm) treatments alone, suggesting that SA and MSN-OH had an additive effect in enhancing the ShB resistance. Interestingly, for MSN-SA treatment, the lesion lengths under different concentrations were all significantly lower than those of SA + MSN-OH treatment, and MSN-SA exhibited a dose effect similar to that with the SA + MSN-OH treatment. In addition, at 48 hpi, lactophenol cotton blue was used to stain the inoculation sites. It was observed that that the density of hyphae after SA + MSN-OH treatment was significantly lower than that of mock-treated samples, and MSN-SA treatment showed a further reduction in hyphal density compared with SA + MSN-OH treatment (Figure 3B). The biomass of R. solani in the inoculated area was subjected to further analysis. As expected, the relative abundance of fungal biomass after MSN-SA treatment was significantly lower than that after SA + MSN-OH treatment (Figure 3C). These data confirmed that MSN-SA treatment had a more remarkable effect in enhancing the ShB resistance than SA + MSN-OH treatment.
Furthermore, we compared the data at 7 and 14 dpi and found that the control efficacy (i.e., (the lesion length of the mock sample—the lesion length of the treatment group)/the lesion length of the mock sample) of SA + MSN-OH (1 mM + 500 ppm) treatment decreased from 32% to 30%, while the control efficacy of MSN-SA treatment at the same concentration increased from 44% to 47%, indicating that MSN-SA treatment conferred rice with more durable resistance than SA + MSN-OH treatment (Figure 3A). Moreover, the trend on the background of the susceptible variety NIP was consistent with that on the background of Lemont (Figure 3D). Altogether, these results emphatically demonstrated that MSN-SA treatment exhibits excellent and long-lasting control efficacy against ShB.
3.3. The Control Efficacy of MSN-SA on Resistant Varieties Is Weakened
In subsequent experiments, we selected MSN-SA at 500 ppm and corresponding concentrations of other treatments (SA, MSN-OH, and SA + MSN-OH) for evaluation. To test the effects of MSN-SA on different rice varieties with varying resistance levels to ShB, we treated the moderately resistant variety Nangeng5055 (NG5055) and the resistant variety Minghui63 (MH63) with MSN-SA (containing 1 mM SA) (Figure 4). We found that spraying 1 mM SA could enhance the ShB resistance of the moderately resistant variety NG5055 but not that of the resistant variety MH63. Although MSN-OH and SA + MSN-OH had significant control efficacies on both types of varieties, their control efficacies decreased compared with those of the highly susceptible variety Lemont and the susceptible variety NIP. For MSN-SA, its control efficacies on the moderately resistant variety NG5055 and the resistant variety MH63 were 23% and 18%, respectively, which were significantly lower than those on Lemont (47%) and NIP (41%) (Figure 3A,D and Figure 4). These results suggested that as the resistance level of rice varieties gradually increased, the control efficacy of MSN-SA on ShB gradually weakened.
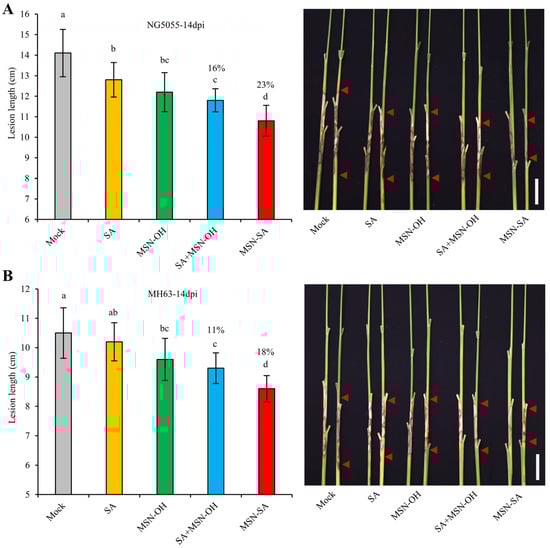
Figure 4.
The control efficacy of MSN-SA on ShB-resistant varieties. (A,B) The lesion lengths of ShB after treatments with SA, MSN-OH, SA + MSN-OH, and MSN-SA at corresponding final concentrations (MSNs: 500 ppm; SA: 1 mM) on the background of the moderately resistant variety NG5055 (A) and the resistant variety MH63 (B). The percentages represent the control efficacy ((the lesion length of the mock sample—the lesion length of the treatment group)/the lesion length of mock sample). The values represent the mean ± standard deviation. Different lowercase letters represent significant differences according to Duncan’s multiple-range tests (p < 0.05). Scale bar: 5 cm.
3.4. MSN-SA Is Safe for Rice and Can Greatly Reduce the Yield Loss Caused by ShB
To test the safety of MSN-SA for rice plants and its application value in rice production, we conducted a field test under severe-disease conditions on the background of Xudao 3 (XD3), the japonica rice variety promoted in Jiangsu Province, and took the spraying of water (mock) and thifluzamide (the main pesticide for controlling ShB in production) as controls respectively (Figure 5). We found that MSN-SA treatment showed an average ShB disease score of 5.40, which was significantly lower than that of the mock-treated samples (7.12) but higher than that of thifluzamide treatment (3.15), demonstrating a considerable control effect for MSN-SA in the field trial, albeit inferior to that of thifluzamide treatment (Figure 5A,B). Compared with thifluzamide treatment, both the grain yield and grain quality of the mock and MSN-SA treatments were significantly reduced, which is mainly attributed to the decreased seed setting rate and 1000-grain weight and to the increased chalkiness rate and amylose content (Figure 5C–G). However, MSN-SA treatment produced a significantly lower yield loss than the mock treatment; the yield of the mock-treated samples was reduced from 1415.6 g/1.32 m2 to 1068.5 g/1.32 m2 (24.5% drop), while the yield from spraying MSN-SA decreased from 1415.6 g/1.32 m2 to 1305.5 g/1.32 m2 (7.8% drop). Comparatively, MSN-SA treatment rescued 16.7% (237.1 g per 1.32 m2) of the 24.5% grain yield loss seen with mock treatment due to reduced ShB disease severity (Figure 5C). Further analysis showed that the rescued yield losses were mainly attributed to two yield components: the seed setting rate (9.2%) and the 1000-grain weight (3.7%) (Figure 5D,E). MSN-SA treatment also displayed a significantly lower loss in grain quality than that of mock treatment, including a lower chalkiness rate (from 24.32% to 20.14%; ~4.2% reduction) and amylose content (from 19.92% to 18.85%; ~1.1% reduction), suggesting that MSN-SA treatment also contributed to retaining grain quality under severe ShB disease conditions (Figure 5F,G). In addition, MSN-SA treatment showed no significant differences between mock and thifluzamide treatment in plant height, panicle number, grain number per panicle, and growth period, indicating that MSN-SA treatment has no adverse impact on rice growth and development (Figure 5H–K). Together, these results suggest that MSN-SA is safe for rice and has significant application value in the control of ShB.
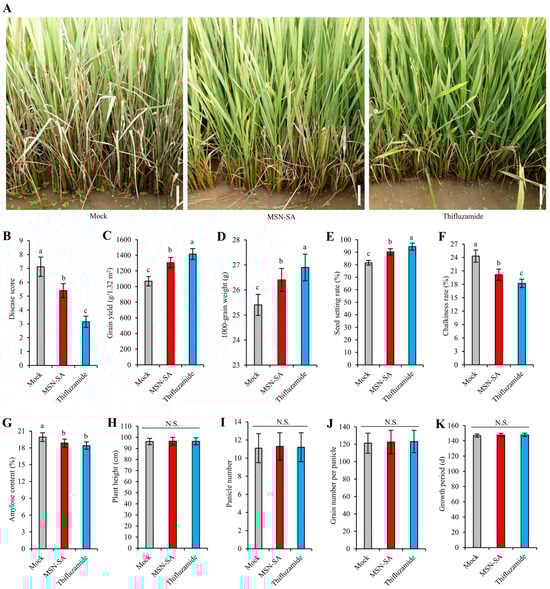
Figure 5.
MSN-SA significantly reduces the grain yield losses caused by ShB in field tests. (A) ShB phenotypes after spraying water (mock), MSN-SA, and thifluzamide under severe-disease conditions in the field. Scale bar: 10 cm. (B–K) Comparison of the disease score (B), grain yield (C), 1000-grain weight (D), seed setting rate (E), chalkiness rate (F), amylose content (G), plant height (H), panicle number (I), grain number per panicle (J), and growth period (K) after spraying water (mock), MSN-SA, and thifluzamide under severe-disease conditions in the field. The values represent mean ± standard deviation. Different letters indicate significant differences according to Duncan’s multiple-range tests (p < 0.05). N.S. indicates no significant differences.
3.5. MSN-SA, as a Delivery Carrier, Releases SA in a Slow and Continuous Manner, Thereby Persistently Triggering the Immune Response
To explore the reasons behind the stronger enhancement of ShB resistance by MSN-SA compared with SA + MSN-OH, we selected for transcriptome analysis the respective leaf sheath tissues of NIP (inoculation sites) at 12 hpi with R. solani that had been mock-treated or treated with SA, MSN-OH, SA + MSN-OH, and MSN-SA for 2 days prior to inoculation. The results showed that, compared with the mock treatment, the number of differentially expressed genes (DEGs) in SA and MSN-OH treatment was 565 and 641, respectively (Figure 6A). For SA + MSN-OH treatment, there were 1104 DEGs, of which 390 and 470 DEGs overlapped with those from SA and MSN-OH treatments, respectively, while 327 were unique DEGs, indicating that SA + MSN-OH treatment induced more gene changes compared with those caused by single SA or MSN-OH treatment. Interestingly, the number of DEGs following MSN-SA treatment was as high as 1560, which is significantly more than that from SA + MSN-OH treatment. Among these, 419, 451, and 886 DEGs overlapped with those from SA, MSN-OH, and SA + MSN-OH treatments respectively, and there were 540 unique DEGs (Figure 6A). This result implies that the genetic changes induced by MSN-SA treatment are more complex than those caused by the simple combination of SA and MSN-OH.
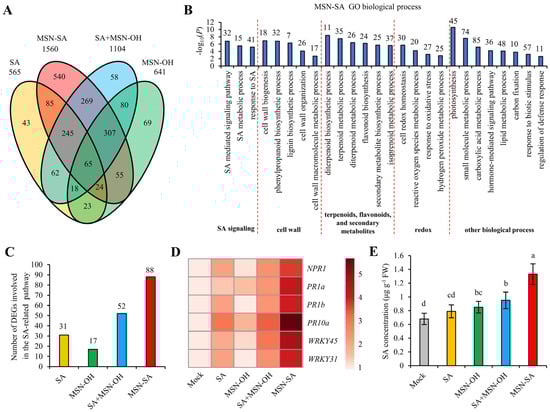
Figure 6.
MSN-SA continuously and strongly activates the SA-mediated immune response. (A) A four-way Venn diagram presenting the number of common and unique DEGs among SA, MSN-OH, SA + MSN-OH, and MSN-SA treatments. (B) GO enrichment analysis of DEGs following MSN-SA treatment. (C) Number of DEGs involved in the SA-related pathway among the different treatments. (D) Expression levels of marker genes in the SA signaling pathways among the different treatments. (E) Comparison of SA concentrations among the different treatments. The values represent the mean ± standard deviation (n = 3). Different lowercase letters represent significant differences according to Duncan’s multiple-range tests (p < 0.05).
Multiple studies show that MSNs can act as delivery carriers to slowly and continuously release the substances coupled to them [44,45]. Therefore, we hypothesized that the substantial increase in the number of DEGs in MSN-SA treatment compared with those following SA + MSN-OH treatment may be attributed to the slow and continuous release of SA by MSN-SA. To validate this hypothesis, we performed a Gene Ontology (GO) analysis on the DEGs under MSN-SA treatment (Figure 6B). The results reveal that these DEGs are involved in multiple biological processes. Specifically, three SA-related pathways were identified: pathways for SA-mediated signaling, SA metabolic processes, and the response to SA (Figure 6B). Subsequently, we compared the number of DEGs involved in the SA-related pathways among various treatments. We found that the number of such DEGs following SA, MSN-OH, and SA + MSN-OH treatments were 31, 17, and 52 respectively, whereas following MSN-SA treatment, this number reached 88, suggesting that MSN-SA treatment triggered expression alterations in a larger quantity of SA-related genes (Figure 6C). Furthermore, we compared the expression levels of multiple SA-signaling or -responsive marker genes (NPR1, PR1a, PR1b, PR10a, WRKY45, WRKY31) among the different treatments. The results showed that the expression abundances of these genes following MSN-SA treatment were significantly higher than those from the other three treatments, indicating that MSN-SA treatment elicited more intense changes in genes of the SA signaling pathway (Figure 6D). Finally, we measured the endogenous SA content following each treatment. We found that SA treatment did not increase the SA content. In contrast, both MSN-OH and SA + MSN-OH treatments resulted in a modest elevation of the SA content, indicating that MSN-OH treatment could raise the SA content. Notably, the SA content in MSN-SA treatment was significantly higher than that in MSN-OH and SA + MSN-OH treatments, indicating a greater accumulation of SA following MSN-SA treatment (Figure 6E). Collectively, these findings demonstrated that MSN-SA treatment could defend against the invasion of R. solani by slowly and continuously releasing SA, thereby persistently activating the SA-mediated defense response.
3.6. MSN-SA Integrates the Effects of SA and MSN-OH, Enhancing the ShB Resistance
To comprehensively elucidate the molecular mechanisms underlying the enhanced resistance to ShB conferred by MSN-SA treatment, we conducted a more in-depth analysis of the biological pathways uncovered in the GO analysis. Our findings revealed that in addition to the SA-related pathways, the key processes involved were those related to the cell wall; those associated with the synthesis and metabolism of terpenoids, flavonoids, and secondary metabolites; and redox-related processes (Figure 6B). Subsequently, we carried out further analysis of these three categories of processes.
For the cell-wall-related processes, we observed that the lignin synthesis genes PAL1, LAC10, LAC19, 4CL3, and 4CL5 and the cellulose synthesis genes CESA7 and CESA9 were significantly upregulated by SA treatment. Following MSN-OH treatment, with the exception of LAC19 and 4CL5, the remaining genes also exhibited upregulation, and the upregulation intensity of the three cellulose synthesis genes surpassed that from SA treatment. Following SA + MSN-OH and MSN-SA treatments, the expression levels of these genes were further elevated, and the upregulation intensity following MSN-SA treatment was notably higher than that induced by SA + MSN-OH treatment (Figure 7A). Furthermore, we measured the PAL activity, lignin content, and cellulose content following each treatment. The results revealed that the variations in PAL activity and lignin content were in accordance with the expression levels of the lignin synthesis genes. Specifically, the order of magnitude was MSN-SA > SA + MSN-OH > SA/MSN-OH (Figure 7A–C). In terms of the cellulose content, this increased in all treatments except for SA treatment, and it was comparatively high following MSN-SA and SA + MSN-OH treatments (Figure 7D). The cell wall, which acts as the primary barrier for plants in resisting pathogen invasion, plays a crucial role in plant disease resistance [46,47]. Li et al. [48] found that ZmFBL41 enhances maize resistance against R. solani by precisely regulating the expression of lignin synthesis genes, thereby strengthening the cell wall, and they also found that this mechanism is conserved in rice. Therefore, these results suggest that both SA and MSN-OH (notably MSN-OH) are capable of inducing the expression of genes associated with cell wall reinforcement. This, in turn, promotes the synthesis and accumulation of lignin and/or cellulose within the cell wall, rendering the cell wall more robust. In contrast, MSN-SA integrates the effects of SA and MSN-OH, further strengthening the cell wall, thus preventing the infection and spread of R. solani.
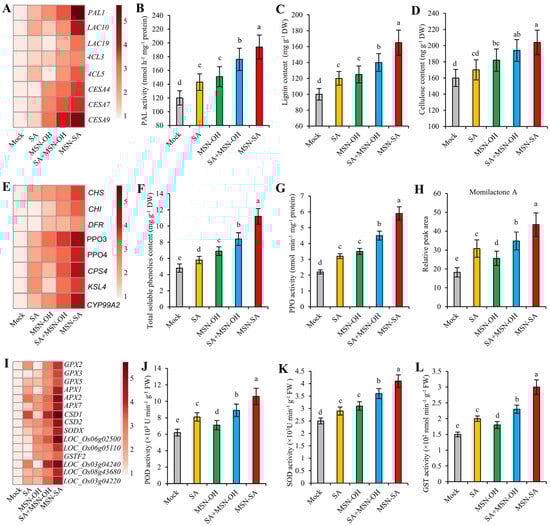
Figure 7.
MSN-SA more strongly induces the reinforcement of the cell wall and the accumulation of antimicrobial compounds and antioxidative enzymes. (A) Expression levels of some lignin and cellulose synthesis genes in SA signaling pathways among the different treatments. (B–D) Comparison of PAL activity, lignin content, and cellulose content among the different treatments. (E) Expression levels of some flavonoid synthesis, polyphenol oxidase, and phytoalexin synthesis genes among the different treatments. (F–H) Comparison of total soluble phenolics, PPO activity, and relative momilactone A content among the different treatments. (I) Expression levels of some antioxidative enzymes among the different treatments. (J–L) Comparison of POD, SOD, and GST activities among the different treatments. The values represent the mean ± standard deviation (n = 3). Different lowercase letters represent significant differences according to Duncan’s multiple-range tests (p < 0.05).
Regarding processes related to the synthesis and metabolism of terpenoids, flavonoids, and secondary metabolites, we found that the expression levels of the flavonoid synthesis gene CHS, the polyphenol oxidase genes PPO3 and PPO4, and the phytoalexin synthesis genes CPS4, KSL4, and CYP99A2 increased significantly following SA treatment. Following MSN-OH treatment, the expression levels of these genes also increased, except for KSL4. Additionally, two other flavonoid synthesis genes, CHI and DFR, were upregulated. Overall, the expression levels of flavonoid synthesis genes and polyphenol oxidase genes following MSN-OH treatment were higher than those from SA treatment, while the expression levels of phytoalexin synthesis genes were lower than those subjected to SA treatment. Following SA + MSN-OH and MSN-SA treatments, the expression levels of these genes were further increased, and the upregulation intensity from MSN-SA treatment was notably higher than that from SA + MSN-OH treatment (Figure 7E). Flavonoids are a category of phenolics. Consequently, we determined the content of total soluble phenolics and revealed that both SA and MSN-OH treatments were capable of augmenting the content of soluble phenolics. Notably, the content of soluble phenolics following MSN-OH treatment was marginally higher than that following SA treatment. Following SA + MSN-OH and MSN-SA treatments, the content of soluble phenolics experienced a further increase, with the content in MSN-SA-treated samples surpassing that in SA + MSN-OH-treated samples (Figure 7F). Furthermore, we measured the activity of PPO after each treatment and found that the variation in PPO activity was in accordance with the expression levels of PPO3 and PPO4. Specifically, the order of magnitude was MSN-SA > SA + MSN-OH > SA/MSN-OH (Figure 7G). In addition, we measured the content of phytoalexins and found that the content of momilactone A in each treatment was consistent with the changes in the expression levels of the phytoalexin synthesis genes, following the order of MSN-SA > SA + MSN-OH > SA > MSN-OH (Figure 7H). The levels of antimicrobial compounds such as phenolics and phytoalexins play an important role in combating fungal pathogens [22,23]. PPO further oxidizes phenols into quinones, which are extremely toxic to pathogens [49]. Therefore, these results indicate that both SA and MSN-OH could induce the accumulation of antimicrobial compounds, including phenolics and phytoalexins, in rice. MSN-SA further facilitates the accumulation of antimicrobial compounds though integrating the effects of SA and MSN-OH, thereby endowing rice with the ability to counteract the invasion of R. solani.
For the redox-related processes, we discovered that the POD genes GPX2, GPX3, GPX5, APX1, APX2, and APX7; SOD genes CSD1, CSD2, SODX, LOC_Os06g02500,and LOC_Os06g05110; and GST genes GSTF2, LOC_Os03g04240, LOC_Os08g43680, and LOC_Os03g04220 were mostly upregulated following either SA or MSN-OH treatments (Figure 7I). We further measured the activities of POD, SOD, and GST, and found that the activities of these enzymes were in accordance with the variations in the expression levels of their corresponding genes following each treatment. Both SA and MSN-OH treatments could enhance their activities. Subsequent to the SA + MSN-OH and MSN-SA treatments, the activities of these enzymes were further elevated. Notably, their activities following MSN-SA treatment were higher than those following SA + MSN-OH treatment (Figure 7J–L). The accumulation of antioxidants helps rice to scavenge excessive and deleterious reactive oxygen species (ROS). Multiple studies reveal that the maintenance of ROS homeostasis in rice is closely associated with the enhancement of resistance against R. solani [33,50,51,52]. Consequently, these findings demonstrate that MSN-SA more strongly elicits the accumulation of antioxidative enzymes by amalgamating the effects of SA and MSN-OH, thus mitigating the self-damage inflicted by harmful substances and facilitating rice in resisting the invasion of R. solani.
Altogether, these results demonstrated that MSN-SA more powerfully induced the reinforcement of the cell wall and the accumulation of antimicrobial compounds and antioxidative enzymes, resulting in enhanced ShB resistance.
4. Discussion
Rice stands as one of the world’s most crucial crops, serving as the primary food source for billions of people across the globe. ShB is a devastating fungal disease that affects rice yield and quality [2,3]. At present, chemical agents are the most effective means of controlling ShB in rice. Nevertheless, the use of fungicides presents a serious threat to both the ecological environment and human health. Pesticide formulations are fraught with numerous issues, including low biological activity, a short-lived efficacy period, and low utilization rates. Recently, nanotechnology has gradually emerged as a new weapon for controlling diseases. Nanoparticle controlled-release formulations can effectively solve the problems related to traditional pesticide formulations [5,6].
SA plays a positive role in activating plant defense responses against R. solani [29,30,31]. However, SA is susceptible to volatilization and oxidation, and the field environment is intricate, which restricts its application in the field. Incorporating SA into nano-carrier materials may not only prolong its effective period but also ensure its stability. The nano-carrier material for MSNs consists of silica-based hybrid nanoparticles, and Si treatment can enhance ShB resistance [22,23,24]. Hence, we intended to graft SA onto MSNs to better control rice ShB. In our study, we utilized MSN-OH as a carrier and successfully fabricated MSN-SA (Figure 1 and Figure 2). We found that both SA and MSN-OH, when used as treatments individually, could enhance the ShB resistance to a certain extent (Figure 3), which is consistent with previous reports on the positive regulation of ShB resistance by SA and silicon [22,23,24,29,30]. When SA and MSN-OH were used in combination, the resistance was further improved, indicating an additive effect between them. Notably, compared with SA + MSN-OH treatment, MSN-SA treatment exhibited a higher and more sustained control effect against ShB (Figure 3). Further investigation revealed that the reason for this phenomenon was that MSN-SA could slowly and continuously release SA (Figure 6), thereby continuously activating the SA-mediated defense response. Moreover, the results of our field experiments verified that MSN-SA treatment had no negative impacts on the growth and development of rice, and this treatment could recover 16.7% of the yield loss under severe-disease conditions (Figure 5). Therefore, our results demonstrate that the functionalized MSN-SA nanomaterial has significant application value in the control of ShB and provides new perspectives and novel nanomaterials for the green prevention and control of ShB.
The disease-resistance mechanisms mediated by SA have been intensively deciphered in plants’ response to biotrophic and hemibiotrophic pathogens, while in the context of plants’ defense against necrotrophic pathogens, such as R. solani, these mechanisms remain inadequately understood [53,54,55]. Here, our results showed that when rice is confronted with infection by R. solani, SA treatment could induce the expression of PR-related genes (PR1a, PR1b and PR10a) and promote lignin synthesis (Figure 6D and Figure 7A–C), which is consistent with previous research [29,30,31]. Furthermore, we found that SA treatment could promote the accumulation of antimicrobial compounds (soluble phenolics and momilactone A) and antioxidative enzymes (POD, SOD, and GST) (Figure 7E–L). This will deepen our understanding of the mechanisms by which SA regulates the defense against necrotrophic pathogens like R. solani. Regarding the mechanisms by which Si regulates resistance to ShB, these have been relatively well resolved. Si-based resistance to ShB is manifested in several aspects: the enhanced activity of defense-related enzymes (POD, PPO, and PAL), the increased accumulation of antimicrobial compounds (phenolics, flavonoids, and phytoalexins), and the regulation of a signaling network of hormones (ethylene, jasmonic acid, and SA) [22,23,24]. The pathways stimulated by silica-based nanomaterials revealed in our study are largely consistent with these mechanisms, further confirming the important role of Si in enhancing resistance to ShB.
In our study, we found that although the disease-resistant response pathways elicited by SA and MSN-OH treatments were similar, the expression intensity and categories of genes activated within these pathways exhibited significant differences. For example, in the redox-related pathways, the expression of APX2 and CSD1 was induced more strongly by SA than by MSN-OH; GPX3, LOC_Os06g05110, and GSTF2 were not induced by SA but were triggered by MSN-OH; while GPX2, APX1, and LOC_Os03g04240 were not induced by MSN-OH but were triggered by SA (Figure 7I). Intriguingly, the MSN-SA treatment substantially aggregated or synergistically combined the effects of SA and MSN-OH treatments. It activated the defense response far more robustly than either SA or MSN-OH treatments alone, thereby elucidating the reason why MSN-SA treatment enhanced resistance to a much greater extent. Plant immune elicitors are an emerging green control strategy, providing a sustainable and eco-friendly alternative to traditional pest management approaches. When plants are exposed to these elicitors, they rapidly activate their inherent immune defense mechanisms, thus enhancing their immunity against subsequent pathogen invasions [56,57,58]. Therefore, we believe that MSN-SA can be used as a novel immune elicitor for the control of ShB.
5. Conclusions
Here, we fabricated functionalized MSN-SA nanoparticles that could simultaneously release SA and bioavailable silicon. Our results confirmed that MSN-SA elicits excellent and durable resistance to ShB. Moreover, field assays demonstrated that MSN-SA is safe for rice and can significantly reduce yield loss under severe-disease conditions. Therefore, MSN-SA exhibits important application value in the control of ShB. In addition, further investigation suggested that MSN-SA releases SA slowly and continuously, thereby persistently activating the defense response. Moreover, MSN-SA enhances ShB resistance by integrating the effects of SA and MSN-OH. Plant immune elicitors are an emerging green control strategy, providing a sustainable alternative to traditional pest management approaches. Collectively, our results provided a novel nanomaterial-based immune elicitor for the green management of ShB.
Author Contributions
Conceptualization, Z.F., Y.L. (You Liang), and Y.L. (Yi Liu); investigation, Y.W., Y.C. and Z.C. (Ze Cheng); data curation, visualization, and writing—original draft preparation, Y.W., Y.C. and Z.C. (Ze Cheng); data acquisition, analysis, and validation, Y.W., Y.C., Z.C. (Ze Cheng), Y.Y., X.X., G.W. (Guangda Wang), Z.L., Y.S., G.W. (Gaozhao Wu) and W.X.; project administration and funding acquisition, Z.F., Y.L. (You Liang), Y.L. (Yi Liu), X.X. and S.Z.; supervision and writing—review and editing, Z.F., Y.L. (You Liang), K.H. and Z.C. (Zongxiang Chen). All authors have read and agreed to the published version of the manuscript.
Funding
This study was supported by a project of the Shanghai Municipal Commission of Science and Technology (23N11900100 to Yi Liu), a high-quality development project of the Yangzhou modern seed industry (YZZY202403 to S.Z.), the National Natural Science Foundation of China (32102293 to You Liang), a Jiangsu Province higher vocational college teacher professional leader high-end training program (2023GRFX083 to X.X.), the “Talent Cultivation Plan” Training Project of Yangzhou (2022-YZYZ-093 to X.X.), the Postgraduate Research and Practice Innovation Program of Jiangsu Province (SJCX24_2275 to Ze Cheng), and a project funded by the Priority Academic Program Development of Jiangsu Higher Education Institutions (PAPD to Z.F.).
Data Availability Statement
The data presented in this study are available on request from the corresponding authors.
Conflicts of Interest
The authors declare no conflicts of interest.
References
- Marchetti, M.A.; Bollich, C.N. Quantification of the relationship between sheath blight severity and yield loss in rice. Plant Dis. 1991, 75, 773–775. [Google Scholar]
- Rush, M.C.; Lee, F.N. Sheath blight. In Compendium of Rice Diseases; Webster, R.K., Gunnell, P.S., Eds.; The American Phytopathological Society: St. Paul, MN, USA, 1992; pp. 22–23. [Google Scholar]
- Senapati, M.; Tiwari, A.; Sharma, N.; Chandra, P.; Bashyal, B.M.; Ellur, R.K.; Bhowmick, P.K.; Bollinedi, H.; Vinod, K.K.; Singh, A.K.; et al. Rhizoctonia solani Kühn pathophysiology: Status and prospects of sheath blight disease management in rice. Front. Plant Sci. 2022, 3, 88116. [Google Scholar]
- Molla, K.A.; Karmakar, S.; Molla, J.; Bajaj, P.; Varshney, R.K.; Datta, S.K.; Datta, K. Understanding sheath blight resistance in rice: The road behind and the road ahead. Plant Biotech. J. 2020, 18, 895–915. [Google Scholar]
- Chen, Z.X.; Zhang, Y.F.; Feng, F.; Feng, M.H.; Pan, X.B.; Zuo, S.M. Improvement of japonica rice resistance to sheath blight by prramiding qSB-9TQ and qSB-7TQ. Field Crops Res. 2014, 161, 118–127. [Google Scholar]
- Wang, Y.; Sun, Q.; Zhao, J.; Liu, T.; Du, H.; Shan, W.; Wu, K.; Xue, X.; Yang, C.; Liu, J.; et al. Fine mapping and candidate gene analysis of qSB12YSB, a gene conferring major quantitative resistance to rice sheath blight. Theor. Appl. Genet. 2023, 136, 246. [Google Scholar]
- Yao, X.; Zhang, F.; Qiao, Z.; Yu, H.Y.; Sun, S.; Li, X.; Jiang, X. Toxicity of thifluzamide in earthworm (Eisenia fetida). Ecotox. Environ. Saf. 2020, 187, 109880. [Google Scholar]
- Yang, Y.; Chang, J.; Wang, D.; Ma, H.; Li, Y.; Zheng, Y. Thifluzamide exposure induced neuro-endocrine disrupting effects in zebrafish (Danio rerio). Arch. Toxicol. 2021, 95, 2033–2046. [Google Scholar]
- Fu, L.; Wang, Z.Y.; Dhankher, O.P.; Xing, B.S. Nanotechnology as a new sustainable approach for controlling crop diseases and increasing agricultural production. J. Exp. Bot. 2020, 71, 507–519. [Google Scholar]
- Zhang, Y.; Huang, C.; Xiong, R. Advanced materials for intracellular delivery of plant cells: Strategies, mechanisms and applications. Mater. Sci. 2024, 160, 100821. [Google Scholar]
- Abdelrahman, T.M.; Qin, X.; Li, D.; Senosy, I.A.; Mmby, M.; Wan, H.; Li, J.; He, S. Pectinase-responsive carriers based on mesoporous silica nanoparticles for improving the translocation and fungicidal activity of prochloraz in rice plants. Chem. Eng. 2021, 404, 126440. [Google Scholar]
- Sharma, S.; Sahu, B.K.; Cao, L.; Bindra, P.; Kaur, K.; Chandel, M.; Koratkar, N.; Huang, Q.; Shanmugam, V. Porous nanomaterials: Main vein of agricultural nanotechnology. Prog. Mater. Sci. 2021, 121, 100812. [Google Scholar]
- Yuvaraj, M.; Sathya Priya, R.; Jagathjothi, N.; Saranya, M.; Suganthi, N.; Sharmila, R.; Cyriac, J.; Anitha, R.; Subramanian, K.S. Silicon nanoparticles (SiNPs): Challenges and perspectives for sustainable agriculture. Physiol. Mol. Plant Pathol. 2023, 128, 102161. [Google Scholar]
- Li, C.; Mo, Y.; Jiao, L.; Liu, Y.; Li, X. Synthesis and characterization of mesoporous silica nanoparticles loaded with p-cymene against rice bacterial blight. Nanomaterials 2024, 14, 250. [Google Scholar] [CrossRef] [PubMed]
- Xu, Y.; Guo, D.; Li, T.; Xiao, Y.; Shen, L.; Li, R.; Xiao, Y.R.; Shen, L.G.; Li, R.J.; Jiao, Y.; et al. Manipulating the mussel-inspired co-deposition of tannic acid and amine for fabrication of nanofiltration membranes with an enhanced separation performance. J. Colloid Interface Sci. 2020, 565, 23–34. [Google Scholar] [CrossRef] [PubMed]
- Liang, Y.; Guo, M.C.; Fan, C.; Dong, H.Q.; Ding, G.L.; Zhang, W.B.; Tang, G.; Yang, J.L.; Kong, D.D.; Cao, Y.S. Development of novel urease-responsive pendimethalin microcapsules using silica-IPTS-PEI as controlled release carrier materials. ACS Sustain. Chem. Eng. 2017, 5, 4802–4810. [Google Scholar] [CrossRef]
- Liang, Y.; Gao, Y.; Wang, W.; Dong, H.; Tang, R.; Yang, J.; Niu, J.F.; Zhou, Z.Y.; Jiang, N.; Cao, Y.S. Fabrication of smart stimuli-responsive mesoporous organosilica nano-vehicles for targeted pesticide delivery. J. Hazard. Mater. 2020, 389, 122075. [Google Scholar] [CrossRef]
- Gao, Y.H.; Zhang, Y.H.; He, S.; Xiao, Y.N.; Qin, X.Y.; Zhang, Y.; Li, D.L.; Ma, H.J.; You, H.; Li, J.H. Fabrication of a hollow mesoporous silica hybrid to improve the targeting of a pesticide. Chem. Eng. J. 2019, 364, 361–369. [Google Scholar] [CrossRef]
- Buchman, J.T.; Elmer, W.H.; Ma, C.; Landy, K.M.; White, J.C.; Haynes, C.L. Chitosan-coated mesoporous silica nanoparticle treatment of Citrullus lanatus (Watermelon): Enhanced fungal disease suppression and modulated expression of stress-related genes. ACS Sustain. Chem. Eng. 2019, 7, 19649–19659. [Google Scholar] [CrossRef]
- El-Shetehy, M.; Moradi, A.; Maceroni, M.; Reinhardt, D.; Petri-Fink, A.; Rothen-Rutishauser, B.; Mauch, F.; Schwab, F. Silica nanoparticles enhance disease resistance in Arabidopsis plants. Nat. Nanotechnol. 2021, 16, 344–353. [Google Scholar] [CrossRef]
- Saberi Riseh, R.; Vatankhah, M.; Hassanisaadi, M.; Kennedy, J.F. Chitosan/silica: A hybrid formulation to mitigate phytopathogens. Int. J. Biol. Macromol. 2023, 239, 124192. [Google Scholar] [CrossRef]
- Zhang, G.; Cui, Y.; Ding, X.; Dai, Q. Stimulation of phenolic metabolism by silicon contributes to rice resistance to sheath blight. J. Plant Nutr. Soil Sci. 2013, 176, 118–124. [Google Scholar] [CrossRef]
- Sathe, A.P.; Kumar, A.; Mandlik, R.; Raturi, G.; Yadav, H.; Kumar, N.; Shivaraj, S.M.; Jaswal, R.; Kapoor, R.; Gupta, S.K.; et al. Role of silicon in elevating resistance against sheath blight and blast diseases in rice (Oryza sativa L.). Plant Physiol. Biochem. 2021, 166, 128–139. [Google Scholar]
- Hassan, A.A.; Gabr, W.E.; Kalboush, Z.A. Biogenic silica: A promoter of cell wall strengthening and induced resistance against sheath blight disease in rice via salicylic acid signaling and phenolic metabolism. Physiol. Mol. Plant Pathol. 2023, 128, 102152. [Google Scholar]
- Khan, M.R.; Fatma, M.; Per, T.S.; Anjum, N.A.; Khan, N.A. Salicylic acid-induced abiotic stress tolerance and underlying mechanisms in plants. Front. Plant Sci. 2015, 6, 00462. [Google Scholar]
- Mishra, S.; Roychowdhury, R.; Ray, S.; Hada, A.; Kumar, A.; Sarker, U.; Aftab, T.; Das, R. Salicylic acid (SA)-mediated plant immunity against biotic stresses: An insight on molecular components and signaling mechanism. Plant Stress 2024, 11, 100427. [Google Scholar]
- Wang, J.H.; Tao, M.N.; Xu, L.Q.; Fan, N.K. Chitosan nanocarriers loaded with salicylic acid for controlling fall armyworm (Spodoptera frugiperda) and alleviating oxidative stress in maize plants. Environ. Sci. Nano 2023, 10, 3295–3306. [Google Scholar]
- Zhong, X.M.; Su, G.F.; Zeng, Q.Y.; Li, G.Z.; Xu, H.; Wu, H.H.; Zhou, H.J.; Zhou, X.H. Preparation of salicylic acid-functionalized nanopesticides and their applications in enhancing salt stress resistance. ACS Appl. Mater. Interfaces 2023, 15, 43282–43293. [Google Scholar] [CrossRef]
- Kouzai, Y.; Kimura, M.; Watanabe, M.; Kusunoki, K.; Osaka, D.; Suzuki, T.; Matsui, H.; Yamamoto, M.; Ichinose, Y.; Toyoda, K.; et al. Salicylic acid-dependent immunity contributes to resistance against Rhizoctonia solani, a necrotrophic fungal agent of sheath blight, in rice and Brachypodium distachyon. New Phytol. 2018, 217, 771–783. [Google Scholar]
- Zhao, Y.D.; Zhu, X.Y.; Shi, C.M.; Xu, G.J.; Zuo, S.M.; Shi, Y.L.; Cao, W.L.; Kang, H.X.; Liu, W.D.; Wang, R.Y.; et al. OsEIL2 balances rice immune responses against (hemi)biotrophic and necrotrophic pathogens via the salicylic acid and jasmonic acid synergism. New Phytol. 2024, 243, 362–380. [Google Scholar] [CrossRef]
- Zhu, X.Y.; Zhao, Y.D.; Shi, C.M.; Xu, G.J.; Wang, N.N.; Zuo, S.M.; Ning, Y.S.; Kang, H.X.; Liu, W.D.; Wang, R.Y.; et al. Antagonistic control of rice immunity against distinct pathogens by the two transcription modules via salicylic acid and jasmonic acid pathways. Dev. Cell 2024, 59, 1609–1622. [Google Scholar]
- Zuo, S.M.; Yin, Y.J.; Pan, C.H.; Chen, Z.X.; Zhang, Y.F.; Zhu, L.H.; Pan, X.B. Fine mapping of qSB-11LE, the QTL that confers partial resistance to rice sheath blight. Theor. Appl. Genet. 2013, 126, 1257–1272. [Google Scholar]
- Cao, W.L.; Zhang, H.M.; Zhou, Y.; Zhao, J.H.; Lu, S.B.; Wang, X.Q.; Chen, X.J.; Yuan, L.M.; Guan, H.Y.; Wang, G.D.; et al. Suppressing chlorophyll degradation by silencing OsNYC3 improves rice resistance to Rhizoctonia solani, the causal agent of sheath blight. Plant Biotechnol. J. 2022, 20, 335–349. [Google Scholar] [CrossRef]
- Wei, H.; Sherman, B.; Lempicki, R. Bioinformatics enrichment tools: Paths toward the comprehensive functional analysis of large gene lists. Nucleic Acids Res. 2009, 37, 1–13. [Google Scholar]
- Camañes, G.; Pastor, V.; Cerezo, M.; García-Andrade, J.; Vicedo, B.; García Agustín, P.; Flors, V. A deletion in NRT2.1 attenuates Pseudomonas syringae-induced hormonal perturbation, resulting in primed plant defenses. Plant Physiol. 2011, 158, 1054–1066. [Google Scholar] [CrossRef]
- Qin, G.Z.; Tian, S.P. Enhancement of biocontrol activity of Cryptococcus laurentii by silicon and the possible mechanisms involved. Phytopathology 2005, 95, 69–75. [Google Scholar] [CrossRef]
- Bradford, M.M.A. Rapid and sensitive method for the quantitation of microgram quantities of protein utilizing the principle of protein-dye binding. Anal. Biochem. 1976, 72, 248–254. [Google Scholar]
- Domon, J.M.; Baldwin, L.; Acket, S.; Caudeville, E.; Arnoult, S.; Zub, H.; Gillet, F.; Lejeune-H’enaut, I.; Brancourt-Hulmel, M.; Pelloux, J.; et al. Cell wall compositional modifications of Miscanthus ecotypes in response to cold acclimation. Phytochemistry 2013, 85, 51–61. [Google Scholar]
- Baldwin, L.; Głazowska, S.; Mravec, J.; Fangel, J.; Zhang, H.; Felby, C.; Willats, W.G.; Schjoerring, J.K. External nitrogen input affects pre-and post-harvest cell wall composition but not the enzymatic saccharification of wheat straw. Biomass Bioenerg. 2017, 98, 70–79. [Google Scholar]
- Rodrigues, F.A.; Jurick, W.M.; Datnoff, L.E.; Jones, J.B.; Rollins, J.A. Silicon influences cytological and molecular events incompatible rice-Magnaporthe grisea interactions. Physiol. Mol. Plant Pathol. 2005, 66, 144–159. [Google Scholar] [CrossRef]
- Liang, J.; Shen, Q.; Wang, L.; Liu, J.; Fu, J.; Zhao, L. Rice contains a biosynthetic gene cluster associated with production of the casbane-type diterpenoid phytoalexin ent-10-oxodepressin. New Phytol. 2021, 231, 85–93. [Google Scholar]
- Kitaoka, N.; Zhang, J.; Oyagbenro, R.K.; Brown, B.; Wu, Y.; Yang, B.; Li, Z.H.; Peters, R.J. Interdependent evolution of biosynthetic gene clusters for momilactone production in rice. Plant Cell 2012, 33, 290–305. [Google Scholar]
- Lu, X.; Zhang, J.; Brown, B.; Li, R.; Rodriguez-Romero, J.; Berasategui, A.; Liu, B.; Xu, M.M.; Luo, D.P.; Pan, Z.Q.; et al. Inferring roles in defense from metabolic allocation of rice diterpenoids. Plant Cell 2018, 30, 1119–1131. [Google Scholar]
- Tang, F.; Li, L.; Chen, D. Mesoporous silica nanoparticles: Synthesis, biocompatibility and drug delivery. Adv. Mater. 2012, 24, 1504–1534. [Google Scholar]
- Budiman, A.; Wardhana, Y.W.; Ainurofiq, A.; Nugraha, Y.P.; Qaivani, R.; Hakim, S.N.; Aulifa, D.L. Drug-coformer loaded-mesoporous silica nanoparticles: A review of the preparation, characterization, and mechanism of drug release. Inter. J. Nanomed. 2024, 19, 281–305. [Google Scholar]
- Malinovsky, F.G.; Fangel, J.U.; Willats, W.G. The role of the cell wall in plant immunity. Front. Plant Sci. 2014, 5, 178. [Google Scholar]
- Bacete, L.; Melida, H.; Miedes, E.; Molina, A. Plant cell wall-mediatedimmunity: Cell wall changes trigger disease resistance responses. Plant Cell 2018, 93, 614–636. [Google Scholar]
- Li, N.; Lin, B.; Wang, H.; Li, X.; Yang, F.; Ding, X.; Yan, J.; Chu, Z. Natural variation in ZmFBL41 confers banded leaf and sheath blight resistance in maize. Nat. Genet. 2019, 51, 1540–1548. [Google Scholar]
- Li, L.; Steffens, J.C. Overexpression of polyphenol oxidase in transgenic tomato plants results in enhanced bacterial disease resistance. Planta 2002, 215, 239–247. [Google Scholar]
- Oreiro, E.; Grimares, E.; Atienza-Grande, G.; Quilod, L.; Roman-Reyna, V.; Oliva, R. Genome-wide associations and transcriptional profiling reveal ROS regulation as one underlying mechanism of sheath blight resistance in rice. Mol. Plant-Microbe Interact. 2020, 33, 212–222. [Google Scholar]
- Gao, M.; He, Y.; Yin, X.; Zhong, X.B.; Yan, B.X.; Wu, Y.; Chen, J.; Li, X.Y.; Zhai, K.; Huang, Y.F.; et al. Ca2+ sensor-mediated ROS scavenging suppresses rice immunity and is exploited by a fungal effector. Cell 2021, 184, 5391–5404. [Google Scholar]
- Wang, A.J.; Shu, X.Y.; Jing, X.; Jiao, C.Z.; Chen, L.; Zhang, J.F.; Ma, L.; Jiang, Y.Q.; Yamamoto, N.; Li, S.C.; et al. Identification of rice (Oryza sativa L.) genes involved in sheath blight resistance via a genome-wide association study. Plant Biotechnol. J. 2021, 19, 1553–1566. [Google Scholar]
- Glazebrook, J. Contrasting mechanisms of defense against biotrophic and necrotrophic pathogens. Annu. Rev. Phytopathol. 2005, 43, 205–227. [Google Scholar]
- Spoel, S.H.; Johnson, J.S.; Dong, X. Regulation of tradeoffs between plant defenses against pathogens with different lifestyles. Proc. Natl. Acad. Sci. USA 2007, 104, 18842–18847. [Google Scholar]
- Robert-Seilaniantz, A.; Grant, M.; Jones, J.D. Hormone crosstalk in plant disease and defense: More than just jasmonate-salicylate antagonism. Annu. Rev. Phytopathol. 2011, 49, 317–343. [Google Scholar]
- Wang, D.; Liu, B.; Ma, Z.; Feng, J.; Yan, H.; Reticine, A. A new potent natural elicitor: Isolation from the fruit peel of and induction of systemic resistance against tobacco mosaic virus and other plant fungal diseases. Pest Manag. Sci. 2021, 77, 354–364. [Google Scholar]
- Meena, M.; Yadav, G.; Sonigra, P.; Nagda, A.; Mehta, T.; Swapnil, P.; Harish; Marwal, A. Role of elicitors to initiate the induction of systemic resistance in plants to biotic stress. Plant Stress 2022, 5, 100103. [Google Scholar] [CrossRef]
- Zhu, F.; Cao, M.Y.; Zhang, Q.P.; Mohan, R.; Schar, J.; Mitchell, M.; Chen, H.; Liu, F.Q.; Wang, D.W.; Fu, Z.Q. Join the green team: Inducers of plant immunity in the plant disease sustainable control toolbox. Adv. Res. 2024, 57, 15–42. [Google Scholar]
Disclaimer/Publisher’s Note: The statements, opinions and data contained in all publications are solely those of the individual author(s) and contributor(s) and not of MDPI and/or the editor(s). MDPI and/or the editor(s) disclaim responsibility for any injury to people or property resulting from any ideas, methods, instructions or products referred to in the content. |
© 2025 by the authors. Licensee MDPI, Basel, Switzerland. This article is an open access article distributed under the terms and conditions of the Creative Commons Attribution (CC BY) license (https://creativecommons.org/licenses/by/4.0/).