Article

Effects of Nitrogen Fertilization on Soil CH4, CO2, and N2O Emissions and Their Global Warming Potential in Agricultural Peatlands

1
College of Engineering, Jilin Normal University, Siping 136000, China
2
Jilin Provincial Key Laboratory for Plant Resources Science and Green Production, Jilin Normal University, Siping 136000, China
3
State Environmental Protection Key Laboratory of Wetland Ecology and Vegetation Restoration, Northeast Normal University, Changchun 130024, China
4
State Key Laboratory of Desert and Oasis Ecology, Key Laboratory of Ecological Safety and Sustainable Development in Arid Lands, Xinjiang Institute of Ecology and Geography, Chinese Academy of Sciences, Urumqi 830011, China
*
Author to whom correspondence should be addressed.
Agronomy 2025, 15(1), 115; https://doi.org/10.3390/agronomy15010115
Submission received: 16 December 2024 / Revised: 30 December 2024 / Accepted: 2 January 2025 / Published: 4 January 2025
(This article belongs to the Special Issue Microbial Carbon and Its Role in Soil Carbon Sequestration)

Abstract

:
Globally, 14–20% of peatlands are affected by agricultural activities, which account for about one-third of global greenhouse gas emissions from farmlands. However, how agricultural activities such as nitrogen fertilization affect peatlands’ CH4, CO2 and N2O emission patterns and their resulting warming effects needs to be improved and complemented. Here, we elucidate the characterization of CH4, CO2 and N2O emissions from the soil surface and different depths of the soil profile during the growing season of agricultural peatlands for over 50 years and the mechanisms of their resulting global warming potential (GWP) impact through field monitoring and molecular techniques. The 100-year GWP of peatlands increased by 1200% with N fertilization of 260 kg N ha−1 yr−1. At the soil surface, N fertilization increased CO2 and N2O emissions by 111% and 2600%, respectively, although CH4 emissions decreased by 87%. In the soil profile, N fertilization had a significant effect on CO2 from 0 to 60 cm, resulting in an increase in CO2 concentrations of 14–132%, whereas the top 30 cm of soil was the zone of significant N fertilization effects, with CH4 concentrations decreasing by 49–95% and N2O concentrations increasing by 22–26%. Elevated soil pH and NH4+ were the key environmental factors influencing CH4, CO2 and N2O emissions and their resulting increase in GWP. These results suggest that agricultural N fertilization led to a change in the contributor to the GWP of peatlands from CH4 to N2O, especially in the top 30 cm of soil. This study helps to provide theoretical support for the development of effective peatland management strategies.

Graphical Abstract

1. Introduction

Peatlands, a type of wetlands, covering only 3% of the terrestrial area and storing 33% of the world’s carbon and 16% of nitrogen, play a key role in regulating the carbon and nitrogen balance. However, the carbon and nitrogen balance of peatlands can be severely disrupted due to the nitrogen fertilization resulting from the conversion of peatlands to farmlands; through changes in soil physicochemical properties [1,2,3]; and through the abundance, community and activity of nitrifying and denitrifying as well as methanogenic and methane (anaerobic) oxidizing microorganisms [4,5,6,7], which consequently influence CH4 (with a 27-fold higher warming potential than CO2), CO2 and N2O (with a 273-fold higher warming potential than CO2, ozone-depleting gasses) emission patterns and the global warming potential (GWP). Nitrogen fertilization and irrigation or drainage are the main agricultural activities contributing to large greenhouse gas (GHG) emissions from agricultural peatlands, contributing to one-third of global GHG emissions from farmlands [8]. Therefore, there is an urgent need to develop effective peatland management strategies to reduce GHG emissions and global warming potential (GWP) due to agricultural activities such as nitrogen fertilization.
Research on carbon emissions from peatlands in the context of increasing N has focused on the response of methane to N inputs, but no consistent conclusions have been drawn. Some studies have shown that N inputs promote CH4 emissions due to increases in available C and available N in soils [9], and conversely, some studies have found that N inputs reduce CH4 emissions, either by inhibiting CH4 production or promoting CH4 oxidation [10,11,12]. These contrasting results may be related to differences in the soil background available C and N content, water table, microbial abundance and community structure and the amount and type of N fertilizers across ecosystems [6]. N inputs have also been found to have no significant effect on CH4 emissions and have been attributed to the opposite and offsetting effects of N inputs on methanogenesis and methane oxidation processes [13]. These inconsistent results may hinder the accurate assessment and prediction of CH4 emissions from peatlands in the context of N inputs and the resulting warming effects.
Compared to CH4, the response of N2O emissions to N inputs is more complex, and studies on the response of peatlands’ N2O emissions to N inputs have mainly focused on surface N2O effluent, with the extent of N2O response to N inputs varying according to the amount, type and duration of N inputs. In both field and incubation experiments, most N additions of less than five years resulted in increased N2O emissions from peatlands, due to N inputs providing more available N for N2O production [13,14,15]. Conversely, N inputs (100 kg N ha−1 yr−1) of more than 10 years have no effect [16] or reduce N2O emissions from peatlands [17,18]. This may due to the anaerobic conditions of the peatland being favorable for denitrification (converts N2O to N2) or due to the increase in soil N content facilitating plant growth, which absorbs excess N and limits the growth and activity of denitrifying microorganisms, thus reducing N2O emissions [17,19]. We therefore hypothesize that N fertilization may reduce GWP in peatlands by reducing CH4 to offset increased N2O emissions.
In summary, studies of the effects of N inputs on the greenhouse gasses CH4, CO2 and N2O have been dominated by the soil surface effluxes, while relatively few studies have monitored their concentrations in the soil profile. Since the greenhouse gas CH4, CO2 and N2O effluxes only represent the net result of their production, transport and consumption, their concentrations in the soil profile provide a more detailed view of emissions at different depths. Combining CH4, CO2 and N2O efflux measurements with profile concentration measurements can help to explore their soil–atmosphere exchange mechanism; identify the hotspots of CH4, CO2 and N2O emissions in the soil profiles; and develop efficient mitigation strategies. Our aim was to explore (1) whether N-fertilized peatlands act as sinks or sources of CH4, CO2 and N2O and (2) the main soil layers for CH4, CO2 and N2O emissions and their key environmental influencing factors.

2. Materials and Methods

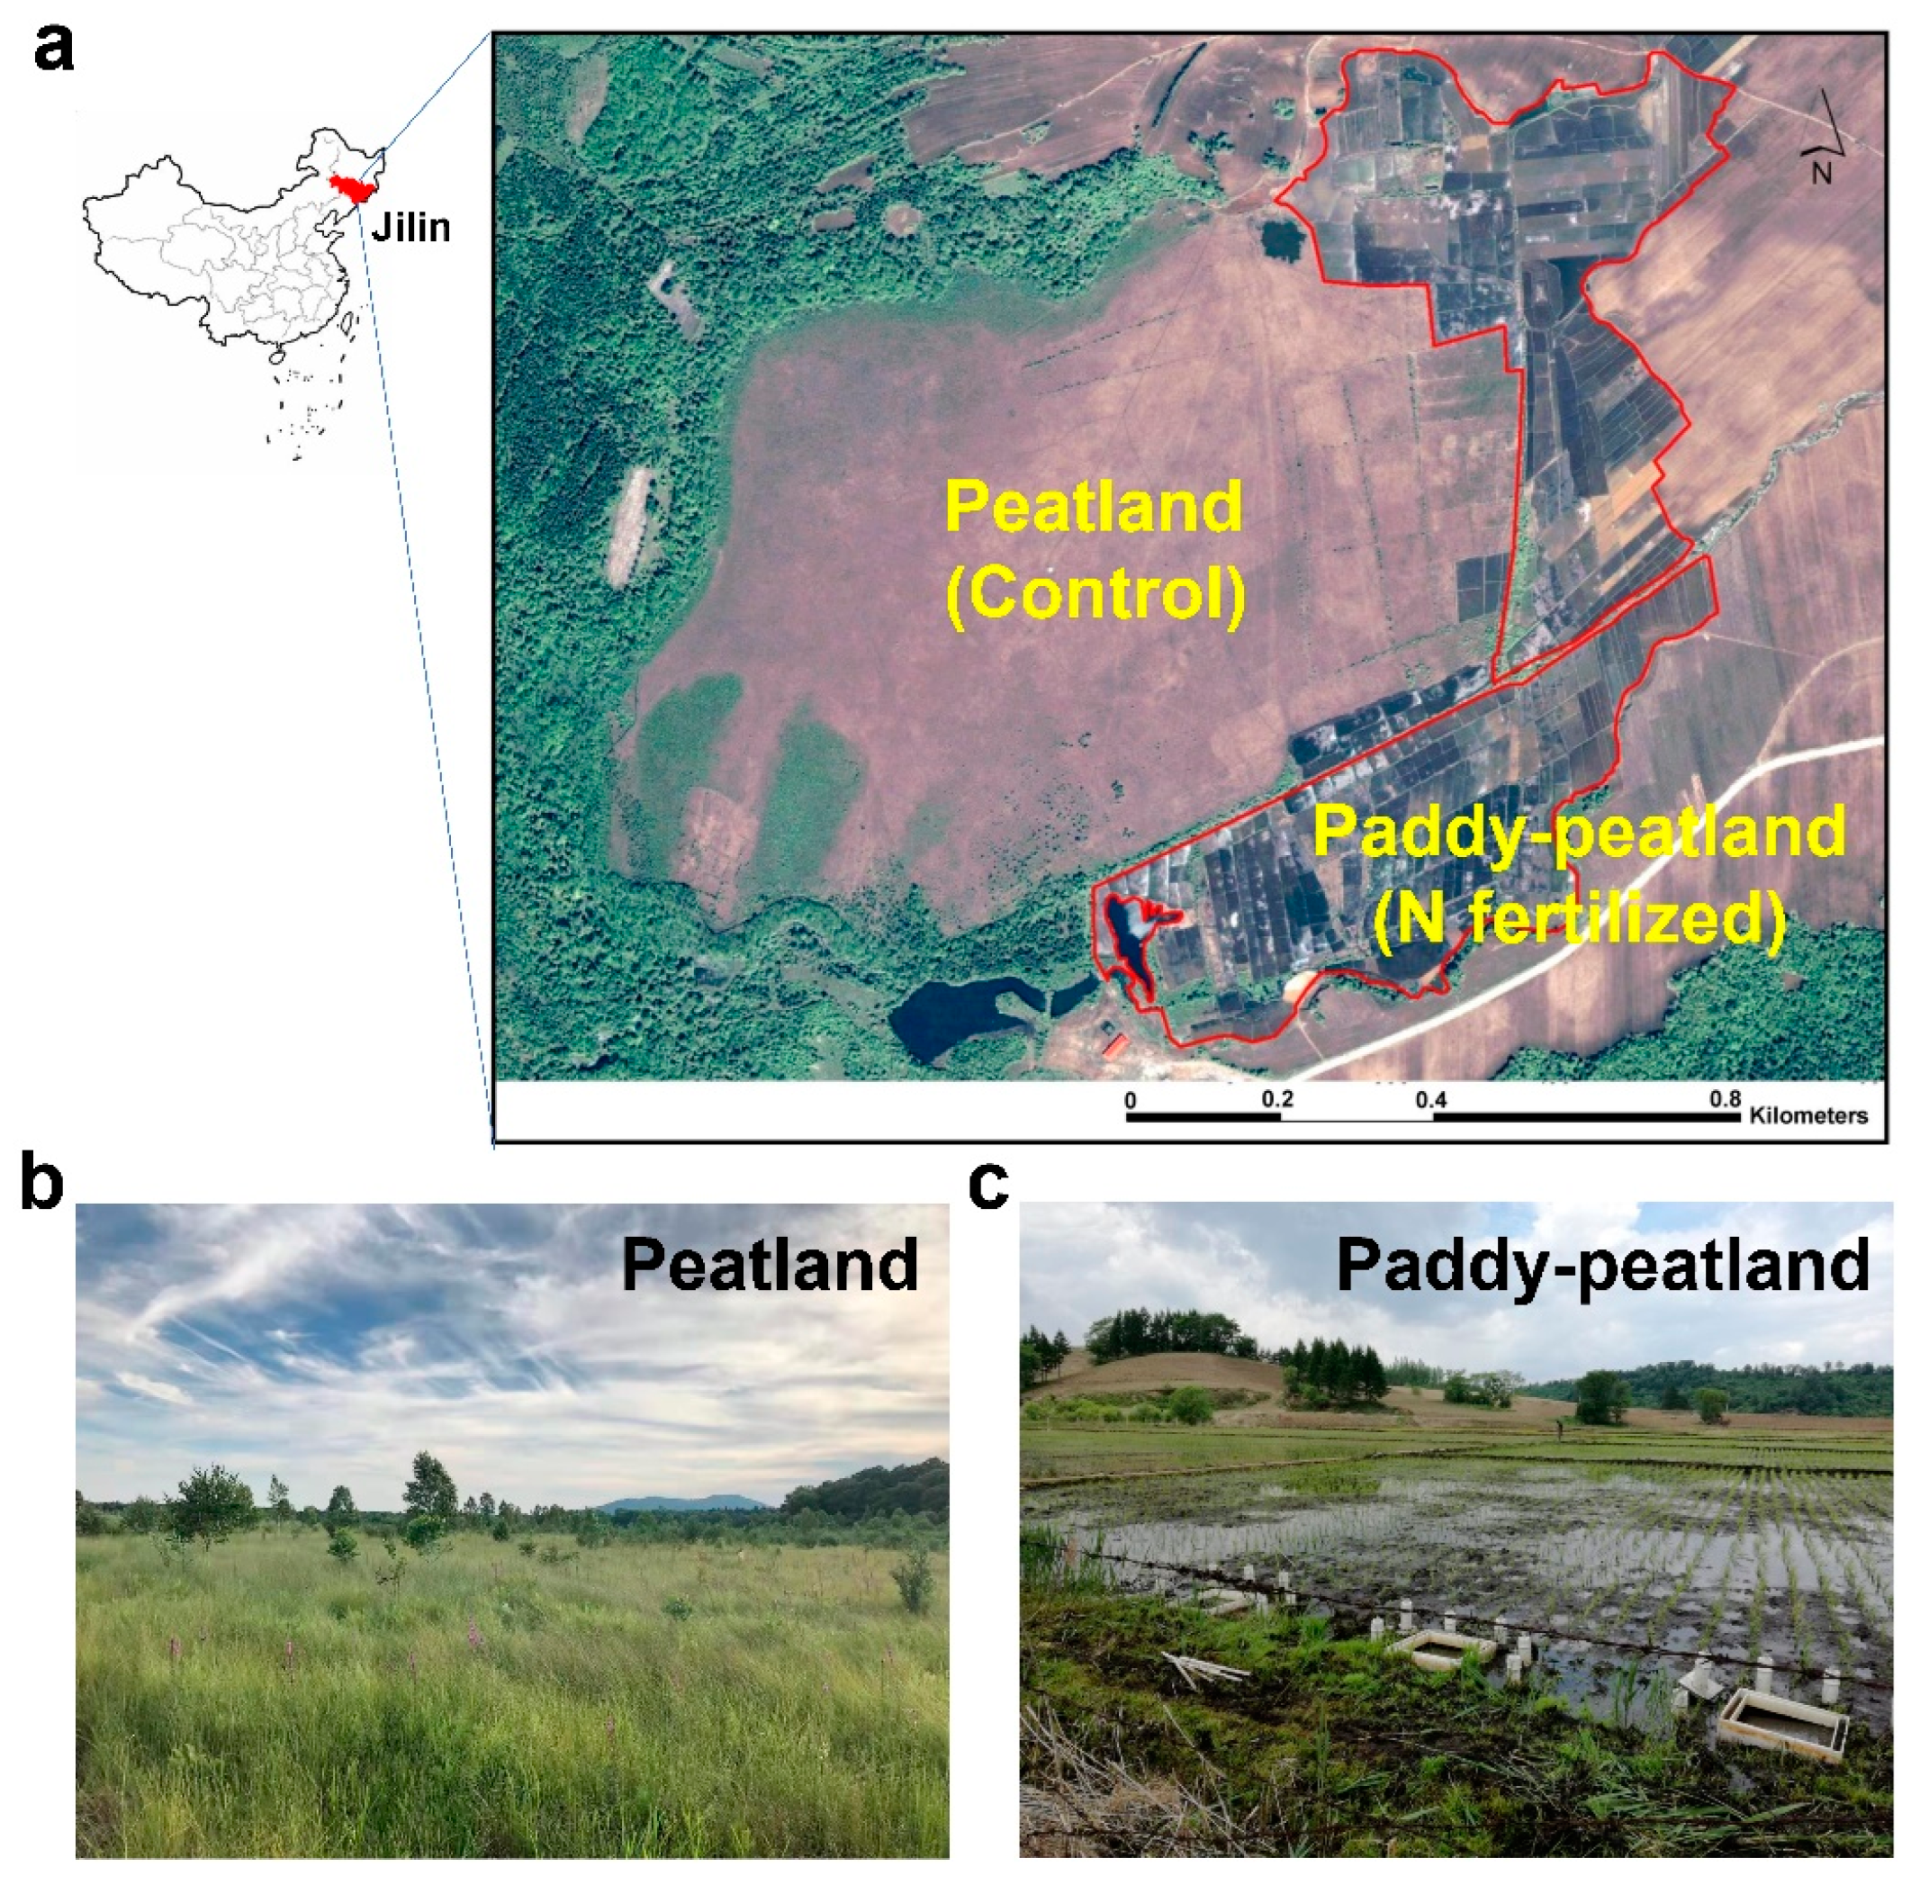
2.1. Site Description

This study was conducted in the Jinchuan peatland (42°20′56″ N, 126°22′51″ E) in the Longwan National Nature Reserve in Jilin province, northeastern China, which has a total area of 100 ha and an average thickness of 5 m. About 37 ha of the Jinchuan Peatland have been farmed continuously for over 50 years for paddy fields, named as “paddy–peatland” (N fertilization site). The total N fertilizer application rate was 260 kg N ha−1 yr−1 (farmer data) in three applications of 76 kg N ha−1 (20 May), 92 kg N ha−1 (5 June) and 92 kg N ha−1 (25 June). The climate is temperate continental monsoon with an average annual temperature of 4.1 °C and annual rainfall of 1280 mm (Figure 1) [11].

2.2. CH4, CO2 and N2O Efflux and Depths Concentrations Measurement

CH4, CO2 and N2O effluxes and the concentrations at soil depths of 0–10, 10–20, 20–30, 30–40, 40–50, and 50–60 cm were monitored monthly from May to October 2016 (growing season) in the paddy–peatland (N fertilization site) and the peatland (control). Gas samples were determined by gas chromatography (Agilent 7890A, Santa Clara, CA, USA). The detailed collection and measurement methods of gas samples are the same as we reported previously [11], as described in Supplementary Information S1.1 and Figure 2.
In a 100-yr time horizon, the global warming potential (GWP) was calculated by taking conversion factors that 1 mg of CH4 and N2O are equivalent to 27 and 273 mg CO2, respectively [19], as follows:
G W P = F C O 2 + 27 × F C H 4 + 273 × F N 2 O
where F C H 4 and F N 2 O are the values of CH4 and N2O effluxes, respectively.

2.3. Soil Collection and Measurement

Soil columns (60 cm in length) were collected in triplicate from the paddy–peatland (N fertilization site) and the peatland (control) along with the gas samples. Each soil column was divided into six layers with depths of 0–10, 10–20, 20–30, 30–40, 40–50 and 50–60 cm. For each sampling site, the six layers of soil were mixed separately. Samples were immediately stored in aluminum foil wrapped in vacuum bags and shipped back to the laboratory on ice within 4 h. Each soil sample was divided into two parts, one for physicochemical property determination and the other for DNA extraction.
The contents of NH4+, NO3 and NO2 were measured using a continuous-flow analyzer (San++, Skalar, Breda, The Netherlands) after extraction with 2 M KCl (soil/water = 1: 5). The organic matter (OM) and total nitrogen (TN) concentrations were measured using the loss-on-ignition method (550 °C, 5.5 h) and dry combustion method (Elementar Analysen System GmbH, VarioEL III Analyzer, Langenselbold, Germany), respectively. Soil pH was conducted using a pH meter (IQ150, Hach, Loveland, CO, USA) after shaking 5 g of fresh soil and 25 mL of water for 30 min. All physicochemical parameters were measured with three replicates.

2.4. DNA Extraction and Quantitative PCR

The DNA was extracted from 0.5 g fresh soil samples using the PowerSoil DNA Isolation Kit (MoBio Laboratories, Carlsbad, CA, USA) following the manufacturer’s protocol. Extracted DNA was detected by 1% agarose gel and the concentration was measured with a NanoDrop 1000 spectrophotometer (Thermo Fisher Scientific, Schwerte, Germany).
Quantification of C and N cycle-related genes was performed by SYBR-Green by an ABI 7500 real-time qPCR device (Applied Biosystems, Foster City, CA, USA), including methanogenic (mcrA, CO2 reduction and acetate fermentation → CH4) and methane anaerobic oxidation (NC10, CH4 → CO2), ammonia monooxygenase (amoA, NH4+ → NH2OH), nitrate reductase (narG, NO3 → NO2), nitrite reductase (nirK and nirS, NO2 → NO) and nitric oxide reductase (nosZ, N2O → N2). For each DNA sample, qPCR was performed in triplicate. The relevant primer information is shown in Table 1.

2.5. Statistical Analysis

Data on physicochemical properties, the CH4, CO2 and N2O effluxes and concentrations from the soil surface and profiles were analyzed by Statistical Product and Service Solutions 18.0 software (SPSS Inc., Chicago, IL, USA) using one-way ANOVA, independent samples t-test, Spearman correlation and Pearson correlation analysis. The statistical significance thresholds were defined as * p < 0.05, ** p < 0.01 and *** p < 0.001. Partial least squares structural equation modeling analysis (PLS-SEM) was performed using Smart PLS3 v.4.1.0.2. Graphs were drawn using Origin 2018. Data are expressed as mean ± standard error (S.D.).

3. Results

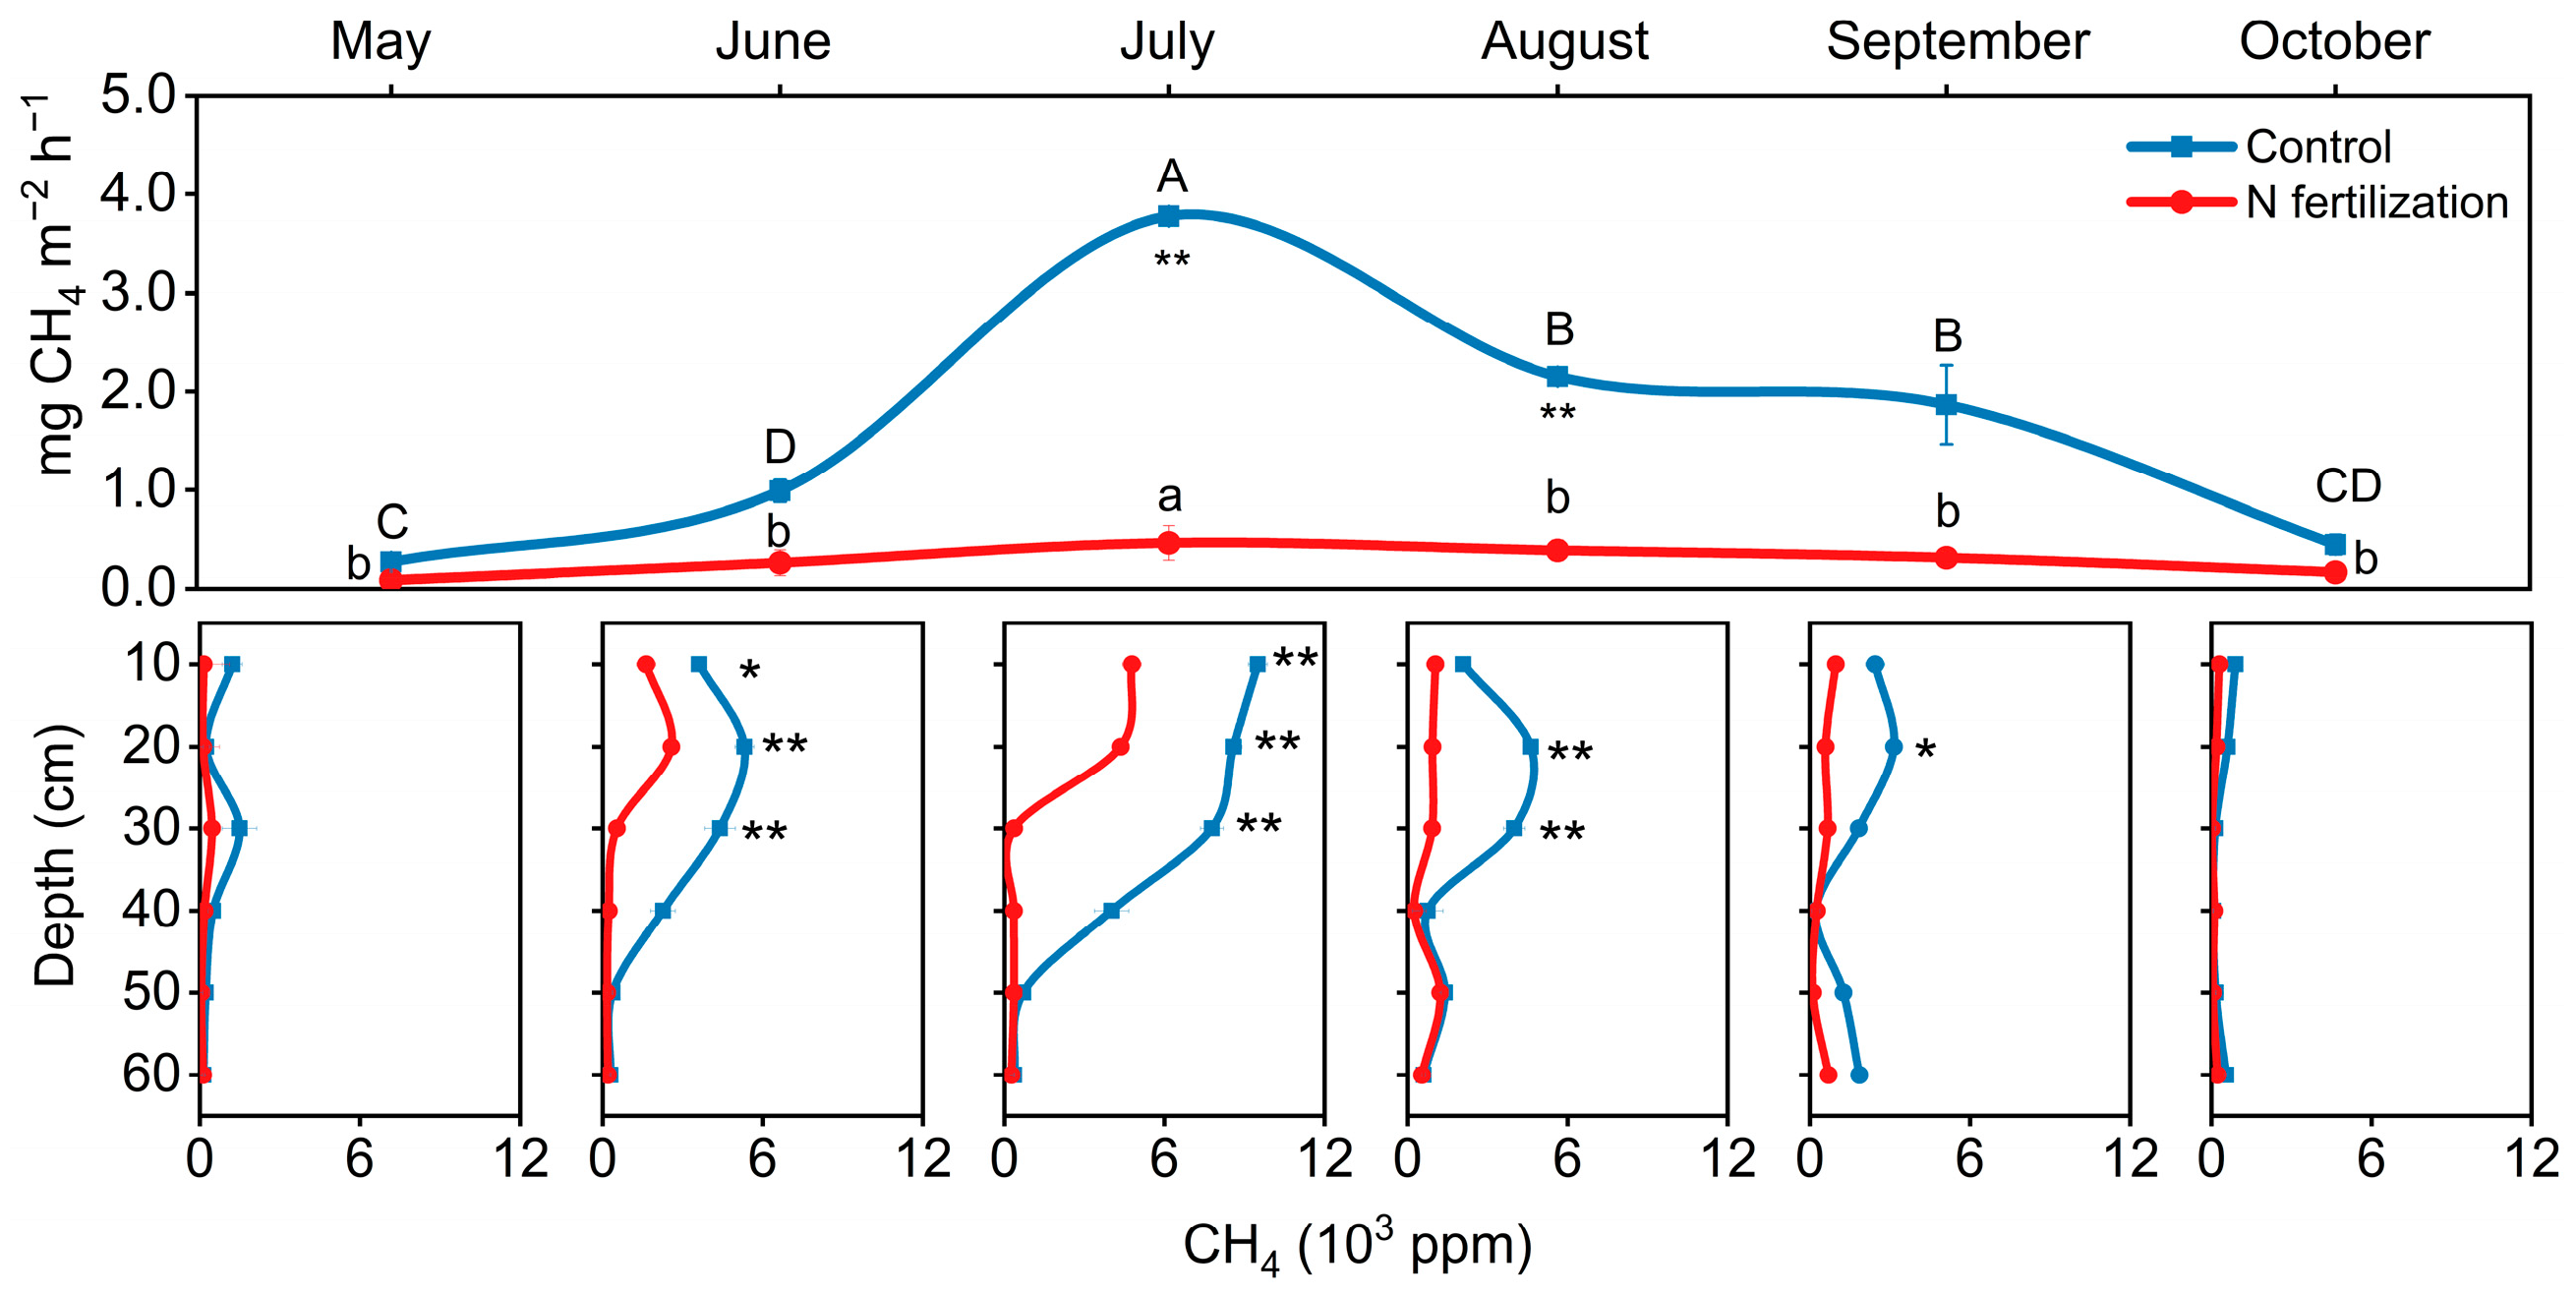
3.1. The CH4 Efflux and Concentrations in the Soil Profiles

The CH4 efflux from the surface and its concentrations in the soil profiles decreased after N fertilization, especially in July (Figure 3; p < 0.01). Compared to the control (peatland), N fertilization (paddy-peatland) reduced CH4 efflux by 87% (Figure 3; p < 0.01). At both sites, CH4 efflux reached a maximum in July at 0.5 mg m−2 h−1 (paddy–peatland) and 3.8 mg m−2 h−1 (peatland), respectively.
Consistent results were also found for N fertilization on CH4 concentrations in the soil profile, particularly in the top 30 cm of soil (Figure 3). In the N-fertilized peatland, CH4 concentrations in the top 0–30 cm (370–4800 ppb) were 49–95% lower than in the control (7800–9500 ppm) (p < 0.01). For both sites, the CH4 concentrations decreased with depth during the growing season.

3.2. The CO2 Efflux and Concentrations in the Soil Profiles

N fertilization resulted in an increase in CO2 efflux from the soil surface from July to September, while CO2 concentration in the soil profile increased throughout the growing season (May to October) (Figure 4; p < 0.05). In July, the surface CO2 efflux showed a peak with a 111% increase (4.6 mg m−2 h−1) with N fertilization (paddy–peatland) compared to the control (the peatland) without N fertilization (2.2 mg m−2 h−1) (Figure 4).
For the CO2 concentration in the soil profile, it increased by 132% to 1500 ppm in the 50–60 cm soil layer of the N-fertilized peatland in July compared to the control (p < 0.01). These results suggest that N fertilization promotes CO2 emissions and increases CO2 concentrations throughout the whole soil profile (0–60 cm).

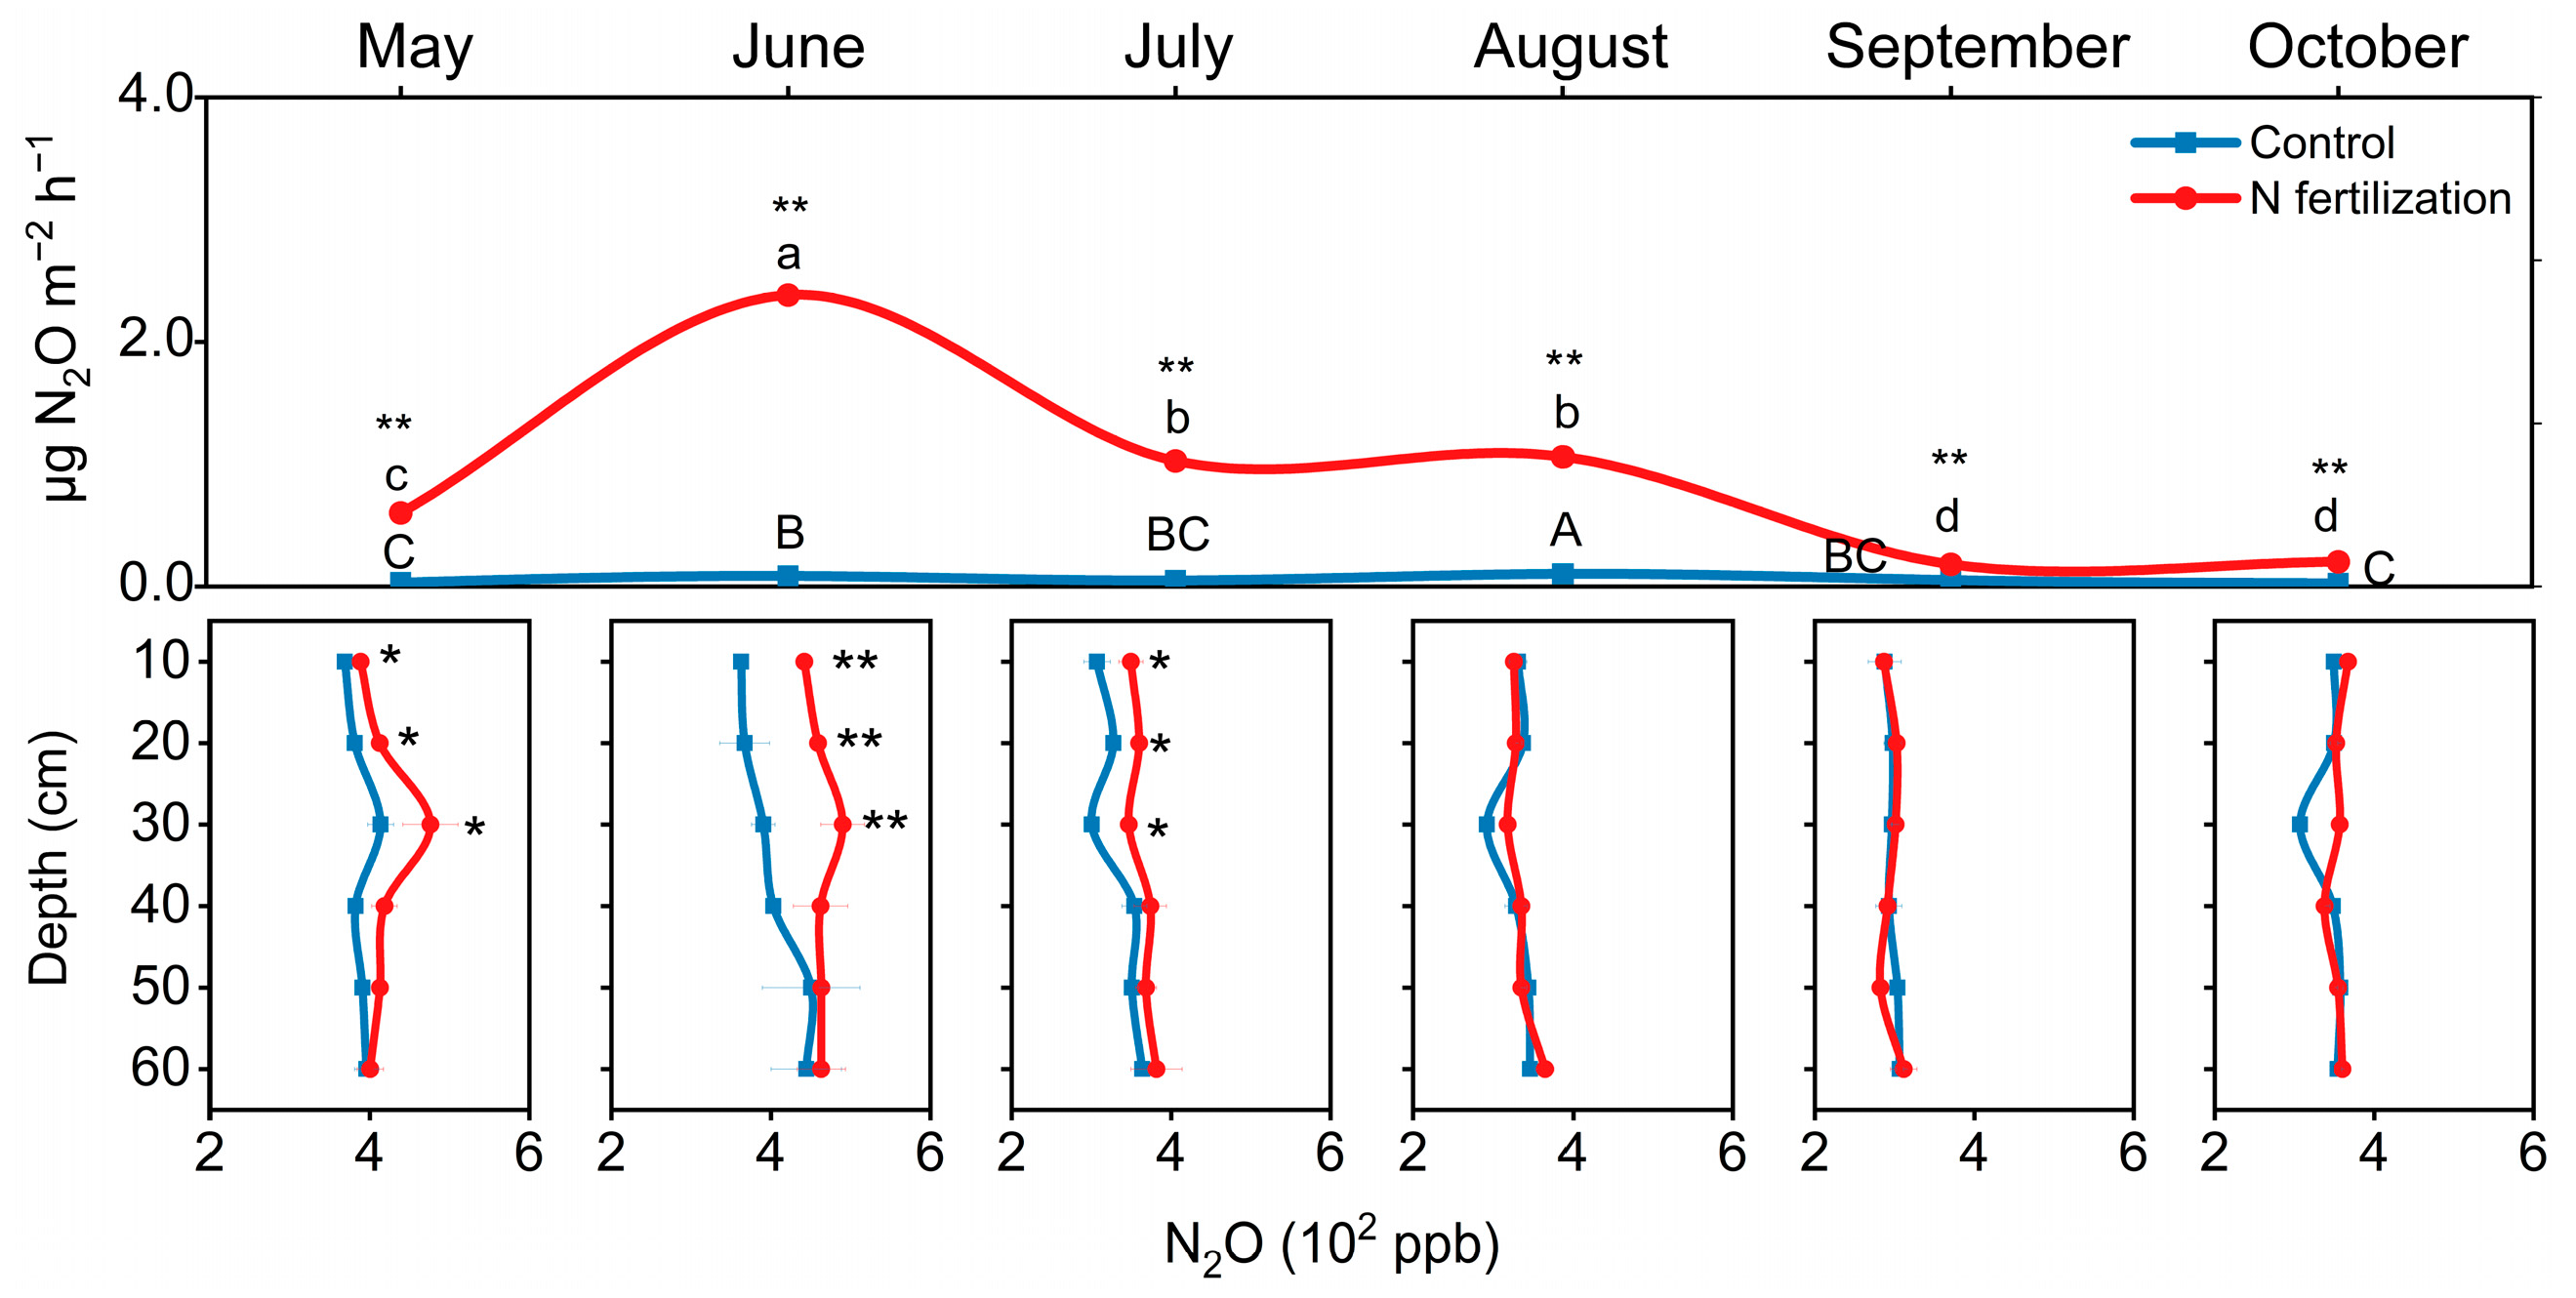
3.3. The N2O Efflux and Concentrations in the Soil Profiles

Nitrogen fertilization increased N2O efflux during the growing season (May to October) and increased N2O concentrations in topsoil (0–30 cm) from May to July (Figure 5; p < 0.01). N2O efflux from the N-fertilized peatland peaked in June (2.38 µg m−2 h−1), a 26-fold increase compared to the non-fertilized site (0.05 µg m−2 h−1) (p < 0.01).
Consistent with N2O efflux, N fertilization increased N2O concentrations in the soil profiles, especially in the top 30 cm of soil. Compared to the control (peatland), N2O concentrations in the N-fertilized site (paddy-peatland) increased by 22–26% in the top 0–30 cm in June (Figure 5; p < 0.01). The N2O concentrations ranged from 363 to 451 ppb from the control and 442–490 ppb from the N-fertilized site in the top 0–30 cm of soil.

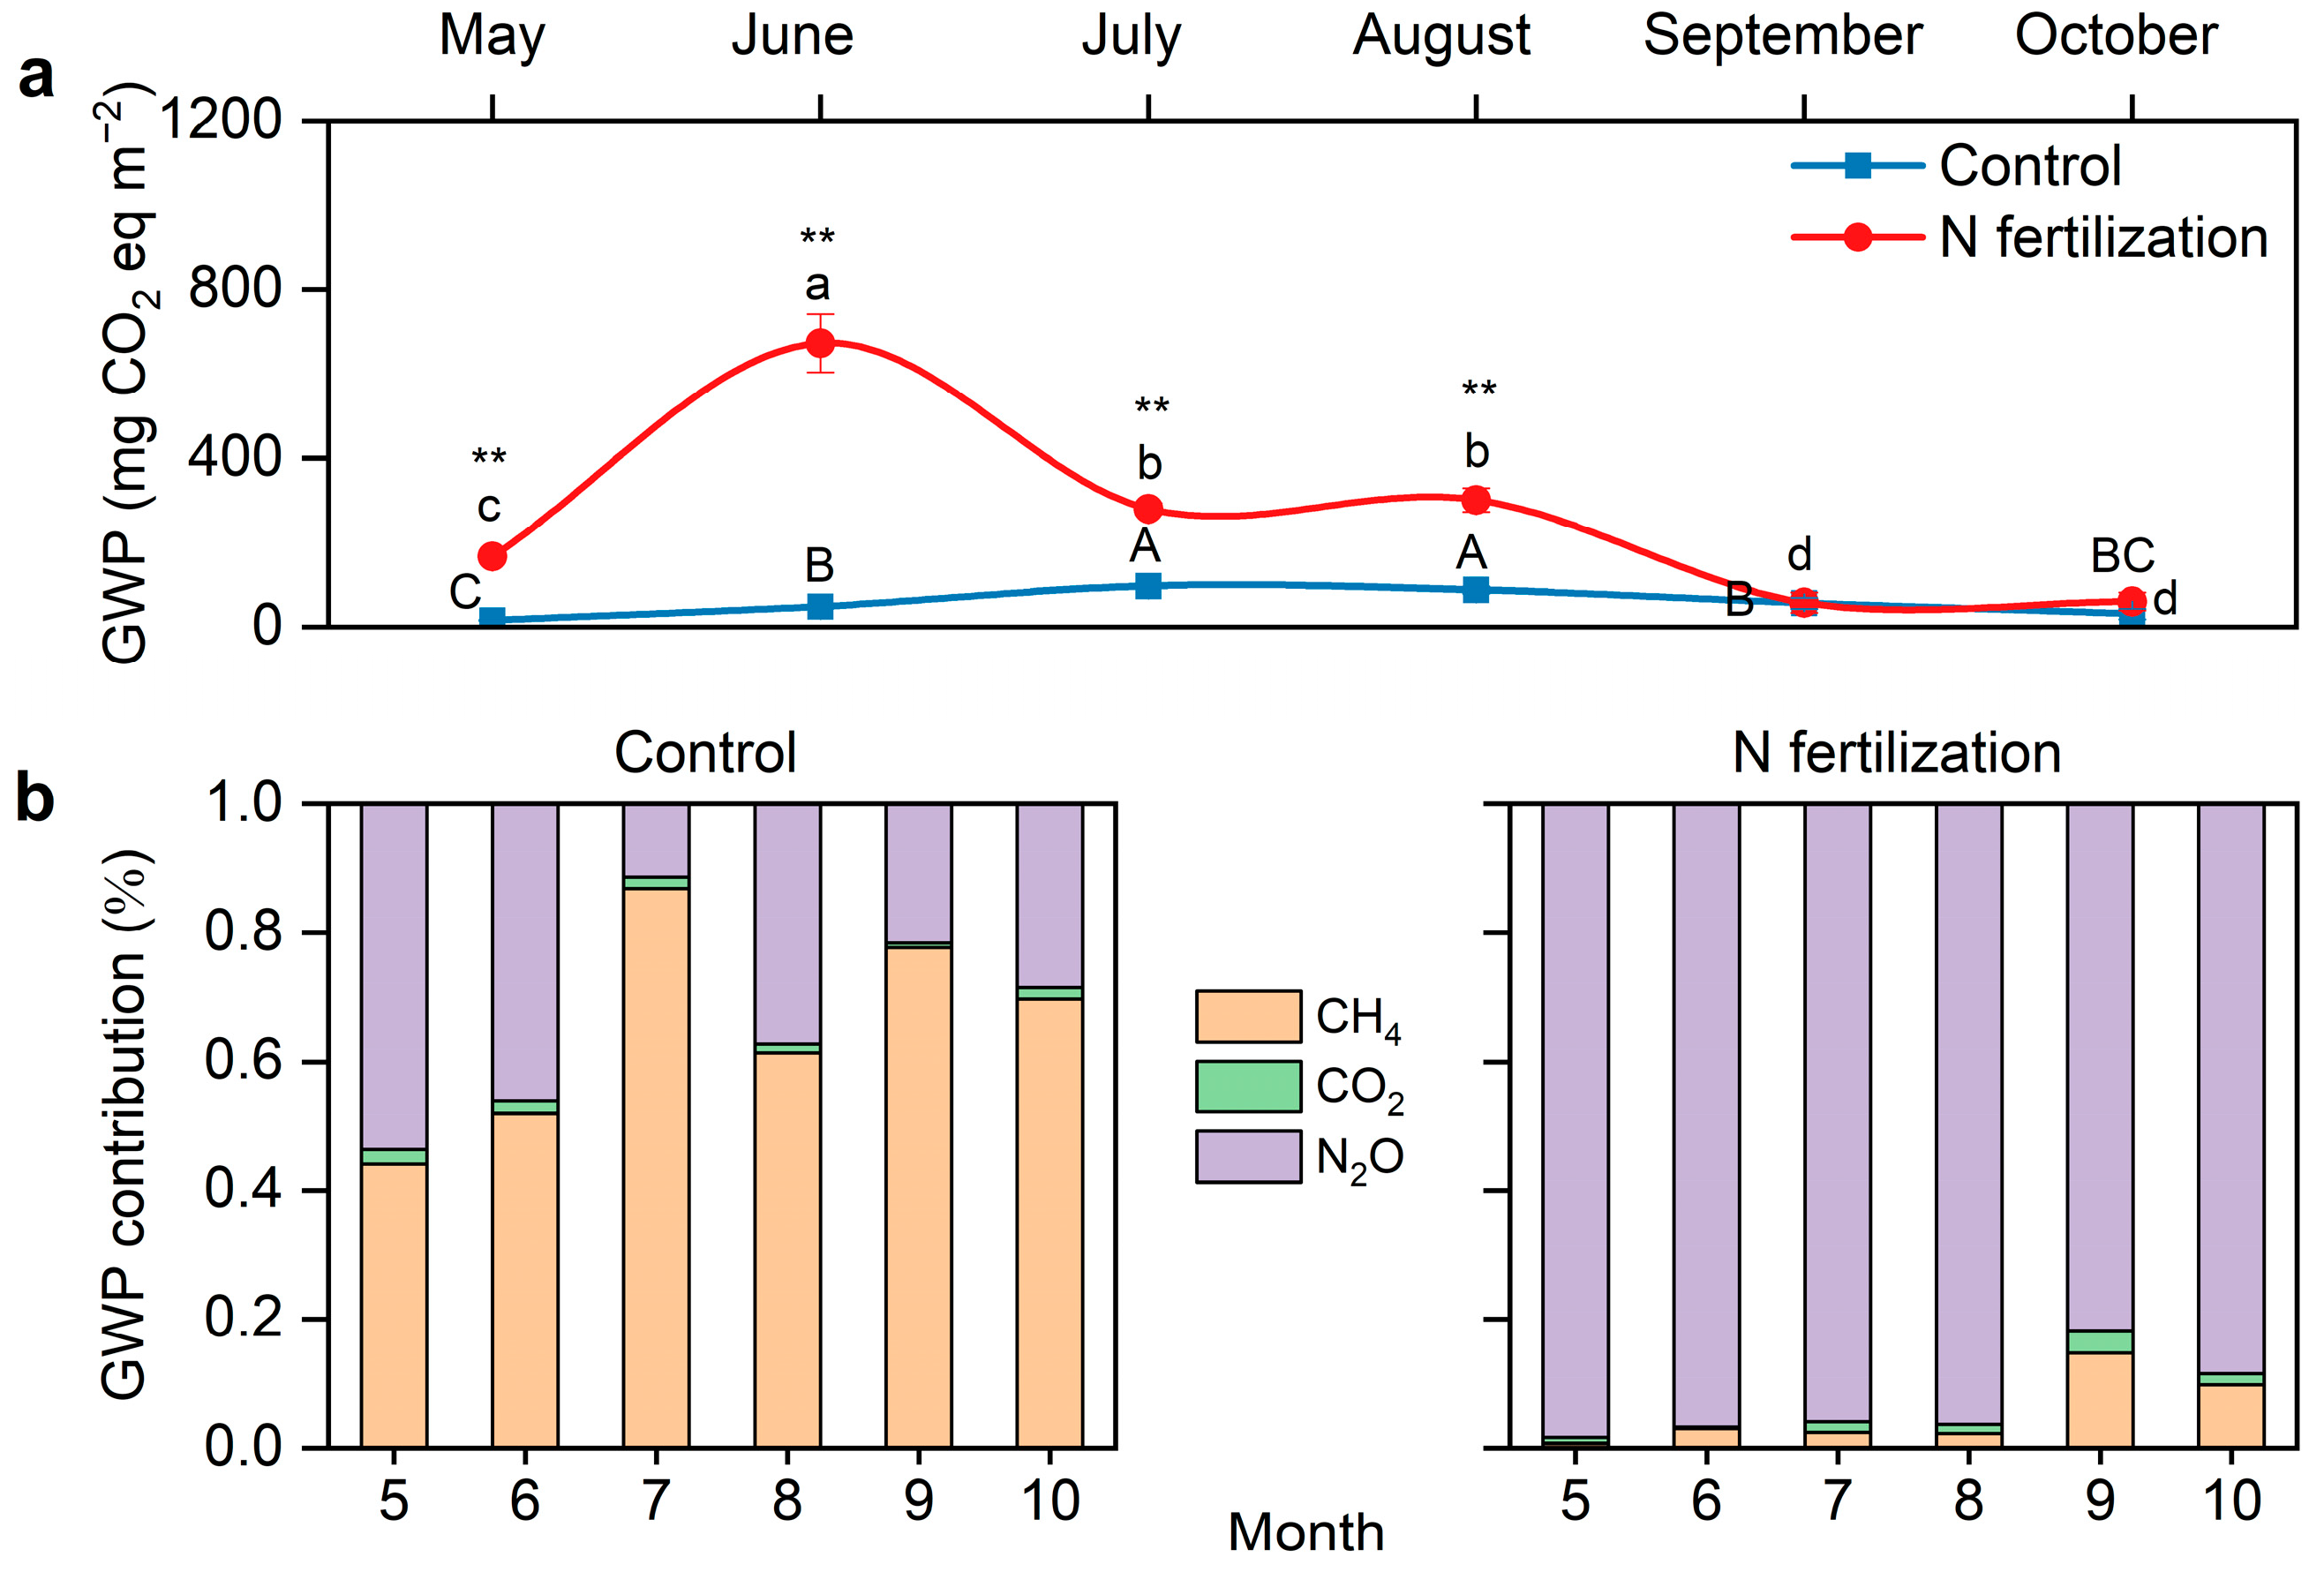
3.4. The Global Warming Potential (GWP) Response to N Fertilization

N fertilization led to an increase in the global warming potential (GWP) and peaked in June (673 mg CO2 eq m−2), at which point, the GWP increased 12-fold compared to the control (Figure 6a). The enhancement of N fertilization on GWP weakened and reached its minimum value in September (51 mg CO2 eq m−2), indicating that the marked effect of N fertilization on GWP lasted for 4 months (from May to August) and diminished over time.
N fertilization shifted the dominant contributor to GWP from CH4 (control) to N2O (N fertilization) (Figure 6b). At the peatland site (control), the relative contribution of CH4 to GWP varied from 44% (May) to 87% (July), while at the paddy–peatland site (N fertilization), the relative contribution of CH4 to GWP varied from only 1% to 15%. The relative contribution of N2O to GWP at the paddy–peatland site varied up to 82% (September) to 98% (May), with 96% in July, when the contribution of methane was the highest. This suggests that N fertilization causes a change in the dominant GWP contributor from CH4 to N2O.

3.5. Abundance of CH4- and N2O-Related Genes

Soil samples from July were selected to determine the absolute abundance of soil microorganisms associated with CH4 and N2O production and consumption processes, since all fertilization was not completed until that time.
N fertilization increased the abundance of genes related to CH4 and N2O production and consumption processes (Figure 7). Compared with the control, AOA-amoA and AOB-amoA abundance in the 0–10 cm soil layer increased 2.3 times and 1.0 time, respectively, while narG and nirK, nirS abundance increased up to 1.3~3.1 and 1.8~7.7, 3.1~23.5 times in the 0–30 cm soil layer at the N fertilization site (p < 0.05). The abundance of nosZ, the only functional gene for N2O depletion processes, did not show significant differences between the N-fertilized peatland and the control, although it increased 1.0~1.6 times (0–30 cm). N fertilization increased methanogenic (mcrA) abundance by 9.7 times (20–30 cm) (p < 0.001) and methane anaerobic oxidizing (NC10) abundance by 4.2 times (0–10 cm) (p < 0.001). These results indicate that the consumption of N2O is weaker than its production, while the consumption of CH4 is stronger than its production, which may be related to the increase in N2O emissions and the decrease in CH4 emissions.

3.6. Environmental and Microbiological Factors on CH4, CO2 and N2O

The effects of physicochemical and microbial factors on CH4, CO2 and N2O and the GWP were analyzed using partial least-squares structural equation modeling (PLS-SEM) (Figure 8). PLS-SEM showed that soil pH and NH4+ content significantly affected the abundance of NC10, nirK, nirS, nosZ and narG, as well as CH4 and N2O emissions, and CH4 and N2O emissions significantly affected GWP.

4. Discussion

Peatlands are important carbon and nitrogen reservoirs and net greenhouse gas sinks, but it is uncertain whether they still function as GHG sinks after being subjected to agricultural N fertilizer inputs [9,27]. Here, we show the greenhouse gas CH4, N2O and CO2 effluxes and concentrations from the soil surface and profiles of long-term N-fertilized peatlands and their contribution to the global warming potential (GWP), together with the distribution of associated microorganisms. Contrary to our hypothesis, N fertilization strengthened the peatland N2O source, increasing the GWP by 12 times and shifting the major contributor to GWP from CH4 to N2O. This effect is particularly pronounced in the top 30 cm of soil, where N2O concentrations increased by 22–26%. Our results provide important theoretical data for the management of peatlands in the context of increasing N and for the development of greenhouse gas mitigation strategies.
The increase in N2O emissions due to increased N fertilization is the main cause of elevated GWP in peatlands, and the top 30 cm of soil was the main layer in which N fertilization affected N2O concentration. N fertilization increased NH4+ content in the 30 cm of soil (Figure S1), as well as the abundance of ammonia-oxidizing archaea (amoA-AOA) and ammonia-oxidizing bacteria (amoA-AOB) (Figure 7). An accelerated ammonia oxidation rate has also been observed [28]. These results suggest that the micro-oxygen environment in the top 30 cm of soil is unfavorable for the reduction of N2O to N2, which leads to N2O accumulation [8]. In contrast, anaerobic conditions in the subsoil (40–60 cm) may be more favorable for denitrification, in which NO2/NO3 is directly reduced to N2 rather than N2O, resulting in lower N2O concentrations in the subsoil than in the top 30 cm of soil. Recent studies have also pointed out that oxygen concentrations are more accurate predictors of in situ soil N2O emissions than functional gene abundance [29,30]. Consistently, the hyporheic zones of small streams, which are micro-oxygen environments, were found to emit a large amount of N2O from the ammonia oxidation process [22]. The micro-oxygen environment may be an important reason for the higher N2O concentration in the top 30 cm of soil of the N-fertilized peatland than that in the subsoils. Therefore, the NH4+ content in the micro-oxygen zones of peat soils may be manipulated to reduce N2O emissions by precise fertilization and to avoid over-fertilization.
Nitrogen fertilization shifted the main contributor to GWP in the peatland from CH4 to N2O due to reduced CH4 emissions via the anaerobic oxidation of CH4. This shift was most pronounced in July, when the relative contribution of CH4 to GWP decreased from 87% (control) to 2% (N fertilization), whereas the relative contribution of N2O to GWP increased from 11% (control) to 96% (N fertilization) (Figure 6b). This may be due to the stronger CH4 anaerobic oxidation than CH4 production after N fertilization. We previously reported a 220% increase in the rate of anaerobic oxidation of CH4 following N fertilization [11]. At the same time, the rate of CH4 production may have been reduced due to the decrease in soil organic matter and DOC content, which can lead to insufficient carbon substrate for methanogenic archaeal species to utilize [31]. Although N fertilization increased mcrA abundance, a functional methanogenic gene, in the 20–30 cm soil layer, the relationship between mcrA abundance and the rate of CH4 production is so far inconclusive and remains to be explored, and N fertilization may affect the rate of methanogenesis by altering the community structure of the methanogenic archaea [21]. Our correlation analyses and PLS-SEM results also support the finding that N fertilization reduced CH4 emissions and profile methane concentrations primarily by promoting the anaerobic oxidation of CH4 rather than CH4 production. Results showed that soil NH4+ content and pH were significantly negatively correlated with CH4 concentration (Figure 8; Table S1; p < 0.01), soil DOC content was positively correlated with CH4 concentration (Table S1; p < 0.05) and mcrA abundance was significantly negatively correlated with CH4 concentration (Table S1; p < 0.05). Therefore, the acceleration of the anaerobic oxidation of CH4 may be closely related to the reduction in CH4 in N-fertilized peatlands.
Elevated soil pH and NH4+ content after N fertilizer application were the main environmental factors for the increase in N2O emissions and decrease in CH4 emissions (Figure 8; Table S1) [9]. This is consistent with existing reports that elevated soil pH promotes the metabolic activities of ammonia-oxidizing microorganisms and CH4 anaerobic-oxidizing microorganisms (NC10) [11,32]. The increase in NH4+ content provided more active substrates for ammonia-oxidizing microorganisms (AOA and AOB) and NC10 to accelerate the ammonia oxidation and anaerobic oxidation of CH4, which led to an increase in N2O emissions and a decrease in CH4 emissions [9,11,33]. Our PLS-SEM and correlation analyses showed that soil pH and NH4+ content was positively correlated with N2O concentration and negatively correlated with CH4 concentration (Figure 8). Therefore, higher soil pH and NH4+ content in N-fertilized peatlands were the main environmental influences leading to higher N2O concentrations and lower CH4 concentrations compared to unfertilized peatlands.

5. Conclusions

In conclusion, we observed that N fertilization strengthened the greenhouse gas sources in the northern agricultural peatlands with a 12-fold increase in global warming potential (GWP), especially for N2O. The N2O efflux from N-fertilized peatlands was as high as 2.38 µg m−2 h−1, which was 26 times higher than N2O efflux from the unfertilized peatlands (0.05 µg m−2 h−1). Nitrogen fertilization also resulted in a shift in the main contributor to GWP from CH4 (87%, control) to N2O (96%, N fertilization), which reduced CH4 emissions by 87% due to the promotion of methane anaerobic oxidation by N inputs. The top 30 cm of soil was the hotspot for N2O and CH4 production and consumption under N fertilization conditions, where N2O concentrations increased by 22–26% and CH4 concentrations decreased by 49–95%. Soil pH and NH4+ content were the main environmental impact factors, and they affected N2O and CH4 emissions and GWP by regulating key microorganisms (NC10, nirK, nirS, nosZ, narG), with positive effects on N2O concentrations and negative effects on CH4 concentrations.
In addition, N fertilization accelerated organic matter decomposition and weakened the carbon storage function of peatlands by facilitating the carbon and nitrogen cycle, as evidenced by reductions in soil organic matter (OM), dissolved organic carbon (DOC), and total nitrogen (TN) content and their negative correlation with N2O emissions (Table S1). Accelerating the process of anaerobic oxidation of methane may be one of the ways to stabilize the northern peatlands’ GWP in the context of N fertilization and to function as a carbon pool. However, to mitigate the elevated GWP after N fertilization, the mechanisms of CH4 and N2O production and consumption processes in response to different levels of N fertilization should also be further explored by isotope tracer experiments, and more detailed microbial information could also be provided by metagenomics and metatranscriptomes techniques. Therefore, more attention should be paid to the top 0–30 cm of soil, which is the key zone to reduce the N-fertilized peatland GHG emissions, and precise fertilization and avoiding over-fertilization can be practiced to reduce N2O emissions and control the peatlands’ GWP.

Supplementary Materials

The following supporting information can be downloaded at https://www.mdpi.com/article/10.3390/agronomy15010115/s1: Figure S1: Depth distribution of soil physicochemical properties in July. The contents of NH4+, NO3, NO2, total nitrogen (TN), organic matter (OM) and pH in the soil profiles. Error bars indicate s.e.m. (n = 3). The asterisks indicate significant differences between the N fertilization site and the control site (* p < 0.05, ** p < 0.01, *** p < 0.001); Table S1: Pearson correlation coefficients of soil physicochemical properties with the greenhouse gas concentrations and the abundance of C and N cycle-related genes (* p < 0.05, ** p < 0.01, both two-tailed).

Author Contributions

Conceptualization, Y.S. and X.Y.; methodology, Y.S.; software, Y.S.; validation, Y.S. and X.W.; formal analysis, Y.S.; investigation, Y.S.; resources, L.S.; data curation, Y.S.; writing—original draft preparation, Y.S.; writing—review and editing, Y.S. and X.Y.; visualization, Y.S.; supervision, L.S. and X.Y.; project administration, L.S.; funding acquisition, Y.S. and X.W. All authors have read and agreed to the published version of the manuscript.

Funding

This research was funded by the Education Department of Jilin Province (JJKH20230516KJ), the Natural Science Foundation of Jilin Province (YDZJ202401456ZYTS), and the Fundamental Research Funds for the Science and Technology Project of the Jilin Provincial Education Department (JJKH20240565KJ).

Data Availability Statement

Data are available upon request.

Acknowledgments

We would like to acknowledge Longwan Wetland Ecological Experiment Station of Northeast Normal University for supporting this experiment.

Conflicts of Interest

The authors declare no conflicts of interest.

References

  1. Doroski, A.A.; Helton, A.M.; Vadas, T.M. Greenhouse gas fluxes from coastal wetlands at the intersection of urban pollution and saltwater intrusion: A soil core experiment. Soil Biol. Biochem. 2019, 131, 44–53. [Google Scholar] [CrossRef]
  2. Monteux, S.; Keuper, F.; Fontaine, S.; Gavazov, K.; Hallin, S.; Juhanson, J.; Krab, E.J.; Revaillot, S.; Verbruggen, E.; Walz, J.; et al. Carbon and nitrogen cycling in Yedoma permafrost controlled by microbial functional limitations. Nat. Geosci. 2020, 13, 794–798. [Google Scholar] [CrossRef]
  3. Moore, T.R.; Knorr, K.H.; Thompson, L.; Roy, C.; Bubier, J.L. The effect of long-term fertilization on peat in an ombrotrophic bog. Geoderma 2019, 343, 176–186. [Google Scholar] [CrossRef]
  4. Aryal, B.; Gurung, R.; Camargo, A.F.; Fongaro, G.; Treichel, H.; Mainali, B.; Angove, M.J.; Ngo, H.H.; Guo, W.S.; Puadel, S.R. Nitrous oxide emission in altered nitrogen cycle and implications for climate change. Environ. Pollut. 2022, 314, 120272. [Google Scholar] [CrossRef]
  5. Dincă, L.C.; Grenni, P.; Onet, C.; Onet, A. Fertilization and Soil Microbial Community: A Review. Appl. Sci. 2022, 12, 1198. [Google Scholar] [CrossRef]
  6. Gong, Y.; Wu, J.; Vogt, J.; Ma, W. Greenhouse gas emissions from peatlands under manipulated warming, nitrogen addition, and vegetation composition change: A review and data synthesis. Environ. Rev. 2020, 28, 428–437. [Google Scholar] [CrossRef]
  7. Maslov, M.N.; Maslova, O.A. Temperate peatlands use-management effects on seasonal patterns of soil microbial activity and nitrogen availability. CATENA 2020, 190, 104548. [Google Scholar] [CrossRef]
  8. Anthony, T.L.; Silver, W.L. Hot moments drive extreme nitrous oxide and methane emissions from agricultural peatlands. Glob. Change Biol. 2021, 27, 5141–5153. [Google Scholar] [CrossRef]
  9. Chen, M.; Chang, L.; Zhang, J.; Guo, F.; Vymazal, J.; He, Q.; Chen, Y. Global nitrogen input on wetland ecosystem: The driving mechanism of soil labile carbon and nitrogen on greenhouse gas emissions. Environ. Sci. Ecotechnol. 2020, 4, 100063. [Google Scholar] [CrossRef]
  10. Legierse, A.; Struik, Q.; Smith, G.; Echeveste Medrano, M.J.; Weideveld, S.; van Dijk, G.; Smolders, A.J.P.; Jetten, M.; Veraart, A.J.; Welte, C.U.; et al. Nitrate-dependent anaerobic methane oxidation (N-DAMO) as a bioremediation strategy for waters affected by agricultural runoff. FEMS Microbiol. Lett. 2023, 370, fnad041. [Google Scholar] [CrossRef]
  11. Shi, Y.; Ma, Q.; Kuzyakov, Y.; Sheng, L.; Liu, H.; Wang, Z. Nitrite-dependent anaerobic oxidation decreases methane emissions from peatlands. Soil Biol. Biochem. 2022, 169, 108658. [Google Scholar] [CrossRef]
  12. Zhang, W.; Hu, Z.; Audet, J.; Davidson, T.A.; Kang, E.; Kang, X.; Li, Y.; Zhang, X.; Wang, J. Effects of water table level and nitrogen deposition on methane and nitrous oxide emissions in an alpine peatland. Biogeosciences 2022, 19, 5187–5197. [Google Scholar] [CrossRef]
  13. Meng, X.; Zhu, Z.; Xue, J.; Wang, C.; Sun, X. Methane and Nitrous Oxide Emissions from a Temperate Peatland under Simulated Enhanced Nitrogen Deposition. Sustainability 2023, 15, 1010. [Google Scholar] [CrossRef]
  14. Sihi, D.; Inglett, P.W.; Gerber, S.; Inglett, K.S. Rate of warming affects temperature sensitivity of anaerobic peat decomposition and greenhouse gas production. Glob. Change Biol. 2018, 24, e259–e274. [Google Scholar] [CrossRef]
  15. Munir, T.M.; Khadka, B.; Xu, B.; Strack, M. Mineral nitrogen and phosphorus pools affected by water table lowering and warming in a boreal forested peatland. Ecohydrology 2017, 10, e1893. [Google Scholar] [CrossRef]
  16. Daly, E.J.; Hernandez-Ramirez, G.; Congreves, K.A.; Clough, T.; Voigt, C.; Harris, E.; Ruser, R. Soil organic nitrogen priming to nitrous oxide: A synthesis. Soil Biol. Biochem. 2024, 189, 109254. [Google Scholar] [CrossRef]
  17. Leeson, S.R.; Levy, P.E.; van Dijk, N.; Drewer, J.; Robinson, S.; Jones, M.R.; Kentisbeer, J.; lan, W.; Sutton, M.A.; Sheppard, L.J. Nitrous oxide emissions from a peatbog after 13 years of experimental nitrogen deposition. Biogeosciences 2017, 14, 5753–5764. [Google Scholar] [CrossRef]
  18. Yi, B.; Lu, F.; Bu, Z.J. Nitrogen addition turns a temperate peatland from a near-zero source into a strong sink of nitrous oxide. Plant Soil Environ. 2022, 68, 49–58. [Google Scholar] [CrossRef]
  19. Nabuurs, G.J.; Mrabet, R.; Hatab, A.A.; Bustamante, M.; Clark, H.; Havlík, P.; House, J.I.; Mbow, C.; Ninan, K.N.; Popp, A.; et al. Agriculture, Forestry and Other Land Uses (AFOLU). In Climate Change 2022: Mitigation of Climate Change; Shukla, P.R., Skea, J., Slade, R., Al Khourdajie, A., van Diemen, R., McCollum, D., Pathak, M., Some, S., Vyas, P., Fradera, R., et al., Eds.; Cambridge University Press: Cambridge, UK; New York, NY, USA, 2023. [Google Scholar] [CrossRef]
  20. Ettwig, K.F.; Van Alen, T.; van de Pas-Schoonen, K.T.; Jetten, M.S.; Strous, M. Enrichment and molecular detection of denitrifying methanotrophic bacteria of the NC10 phylum. Appl. Environ. Microbiol. 2009, 75, 3656–3662. [Google Scholar] [CrossRef]
  21. Vaksmaa, A.; Van Alen, T.A.; Ettwig, K.F.; Lupotto, E.; Valè, G.; Jetten, M.S.; Lüke, C. Stratification of diversity and activity of methanogenic and methanotrophic microorganisms in a nitrogen-fertilized Italian paddy soil. Front. Microbiol. 2017, 8, 2127. [Google Scholar] [CrossRef]
  22. Wang, S.; Lan, B.; Yu, L.; Xiao, M.; Jiang, L.; Qin, Y.; Jin, Y.; Zhou, Y.; Armanbek, G.; Ma, J.; et al. Ammonium-derived nitrous oxide is a global source in streams. Nat. Commun. 2024, 15, 4085. [Google Scholar] [CrossRef]
  23. Hallin, S.; Jones, C.M.; Schloter, M.; Philippot, L. Relationship between N-cycling communities and ecosystem functioning in a 50-year-old fertilization experiment. ISME J. 2009, 3, 597–605. [Google Scholar] [CrossRef] [PubMed]
  24. Michotey, V.; Mejean, V.; Bonin, P. Comparison of methods for quantification of cytochrome cd 1-denitrifying bacteria in environmental marine samples. Appl. Environ. Microbiol. 2000, 66, 1564–1571. [Google Scholar] [CrossRef]
  25. Henry, S.; Bru, D.; Stres, B.; Hallet, S.; Philippot, L. Quantitative detection of the nosZ gene, encoding nitrous oxide reductase, and comparison of the abundances of 16S rRNA, narG, nirK, and nosZ genes in soils. Appl. Environ. Microbiol. 2006, 72, 5181–5189. [Google Scholar] [CrossRef] [PubMed]
  26. Bru, D.; Sarr, A.; Philippot, L. Relative abundances of proteobacterial membrane-bound and periplasmic nitrate reductases in selected environments. Appl. Environ. Microbiol. 2007, 73, 5971–5974. [Google Scholar] [CrossRef]
  27. Zhao, J.; Weldon, S.; Barthelmes, A.; Swails, E.; Hergoualc’h, K.; Mander, Ü.; Qin, C.; Connolly, J.; Silver, W.L.; Campbell, D.I. Global observation gaps of peatland greenhouse gas balances: Needs and obstacles. Biogeochemistry 2024, 167, 427–442. [Google Scholar] [CrossRef]
  28. Shi, Y.; Zhang, X.; Wang, Z.; Xu, Z.; He, C.; Sheng, L.; Liu, H.; Wang, Z. Shift in nitrogen transformation in peatland soil by nitrogen inputs. Sci. Total Environ. 2021, 764, 142924. [Google Scholar] [CrossRef]
  29. Wei, H.; Song, X.; Liu, Y.; Wang, R.; Zheng, X.; Butterbach-Bahl, K.; Venterea, R.T.; Wu, D.; Ju, X. In Situ 15N-N2O site preference and O2 concentration dynamics disclose the complexity of N2O production processes in agricultural soil. Glob. Change Biol. 2023, 29, 4910–4923. [Google Scholar] [CrossRef]
  30. Zhang, Y.; Chen, J.; Cheng, X. Revisiting the relationships between soil nitrous oxide emissions and microbial functional gene abundances. Glob. Change Biol. 2023, 29, 4697–4699. [Google Scholar] [CrossRef]
  31. Lee, J.; Oh, Y.; Lee, S.T.; Seo, Y.O.; Yun, J.; Yang, Y.; Kim, J.; Zhuang, Q.; Kang, H. Soil organic carbon is a key determinant of CH4 sink in global forest soils. Nat. Commun. 2023, 14, 3110. [Google Scholar] [CrossRef]
  32. Yang, L.; Zhu, G.; Ju, X.; Liu, R. How nitrification-related N2O is associated with soil ammonia oxidizers in two contrasting soils in China? Sci. Total Environ. 2021, 770, 143212. [Google Scholar] [CrossRef] [PubMed]
  33. Abalos, D.; Liang, Z.; Dörsch, P.; Elsgaard, L. Trade-offs in greenhouse gas emissions across a liming-induced gradient of soil pH: Role of microbial structure and functioning. Soil Biol. Biochem. 2020, 150, 108006. [Google Scholar] [CrossRef]
Figure 1. Sampling sites for this study. (a) Location of the peatland (control) and paddy–peatland (nitrogen fertilized) in Jinchuan peatland. (b) View of the peatland (control) and (c) the paddy–peatland (nitrogen fertilized).
Agronomy 15 00115 g001
Figure 2. CH4, CO2 and N2O efflux and depth concentration measurement. (a) Static chamber for the determination of gas effluxes from the soil surface. (b) Position of the base of the static chamber with the soil profile gas measurement device. (c) Gas collection outlet for soil profile gas measurement device. (d) Schematic diagram of the device for measuring gas concentrations at different depths in the soil profile.
Agronomy 15 00115 g002
Figure 3. The CH4 surface efflux and soil profile concentrations. Error bars indicate s.e.m. (n = 3). The asterisks indicate significant differences between the N fertilization site and the control site (* p < 0.05, ** p < 0.01).
Agronomy 15 00115 g003
Figure 4. The CO2 surface efflux and soil profile concentrations. Error bars indicate s.e.m. (n = 3). The asterisks indicate significant differences between the N fertilization site and the control site (* p < 0.05, ** p < 0.01).
Agronomy 15 00115 g004
Figure 5. The N2O surface efflux and soil profile concentrations. Error bars indicate s.e.m. (n = 3). The asterisks indicate significant differences between the N fertilization site and the control site (** p < 0.01).
Agronomy 15 00115 g005
Figure 6. The effect of N inputs on the global warming potential (GWP). (a) Dynamics of the GWP during the growing season. (b) The relative contributions of CH4, CO2 and N2O to the GWP. The asterisks indicate significant differences between the N fertilization site and the control site (** p < 0.01). Different uppercase letters indicate significant differences between months for the control site and different lowercase letters indicate significant differences between months for the N fertilization site.
Agronomy 15 00115 g006
Figure 7. Profile distribution characteristics of CH4 and N2O-related genes. Error bars indicate s.e.m. (n = 3). The asterisks indicate significant differences between the N fertilization site and the control site (* p < 0.05, ** p < 0.01, *** p < 0.001).
Agronomy 15 00115 g007
Figure 8. Factors influencing CH4, CO2 and N2O emissions and the global warming potential (GWP). Numbers on arrows indicate path coefficients. Paths with significance less than 0.05 are indicated by blue and red arrows. Paths with significance greater than 0.05 are indicated by gray arrows (** p < 0.01, *** p < 0.001).
Agronomy 15 00115 g008
Table 1. The primers used in this study.
SpecificityPrimerSequence (5’-3’)Thermal Profiles
NC10p1FGGGCTTGACATCCCACGAACCTG3 min at 95 °C, 40 cycles of 30 s at 95 °C, 30 s at 63 °C and 30 s at 72 °C [20]
p1RCGCCTTCCTCCAGCTTGACGC
p2FGGGGAACTGCCAGCGTCAAG3 min at 95 °C, 40 cycles of 30 s at 95 °C, 30 s at 63 °C and 30 s at 72 °C [20]
p2RCTCAGCGACTTCGAGTACAG
mcrA159FAAAGTGCGGAGCAGCAATCACC5 min at 96 °C, 45 cycles of 30 s at 96 °C, 30 s at 57 °C and 30 s 72 °C [21]
345RTCGTCCCATTCCTGCTGCATTGC
AOA-amoAarchea-amoAFSTAATGGTCTGGCTTAGACG5 min at 95 °C, 35 cycles of 45 s at 94 °C, 1 min at 53 °C and 1 min at 72 °C [22]
archea-amoARGCGGCCATCCATCTGTATGT
AOB-amoAamoA-1FGGGGTTTCTACTGGTGGT5 min at 95 °C, 35 cycles of 30 s at 94 °C, 30 s at 55 °C and 1 min at 72 °C [22]
amoA-2RCCCCTCKGSAAAGCCTTCTTC
nirKFlaCuATCATGGTSCTGCCGCG2 min at 95 °C, 40 cycles of 20 s at 95 °C, 30 s at 63 °C, 30 s at 73 °C and 15 s at 85 °C [23]
R3CuTTGGTGTTRGACTAGCTCCG
nirScd3aFGTSAACGTSAAGGARACSGG3 min at 95 °C, 35 cycles of 30 s at 95 °C, 30 s at 59 °C and 1 min at 72 °C [24]
R3cdGASTTCGGRTGSGTCTTGA
nosZnosZ2FCGCRACGGCAASAAG GTSMSSGT5 min at 95 °C, 40 cycles of 30 s at 95 °C, 30 s at 54 °C, 40 s at 72 °C [25]
nosZ2RCAKRTGCAKSGCRTGGCAGAA
narGnarGfTCGCCSATYCCGGCSATGTC3 min at 95 °C, 35 cycles of 30 s at 94 °C, 30 s at 57 °C and 30 s at 72 °C [26]
narGrGAGTTGTACCAGTCRGCSGAYTCSG
Note: S = C or G; Y = C or T; K = G or T; R = A or G; D = A, G or T; V = A, C or G; B = C, G or T; N = A, C, T or G.
Disclaimer/Publisher’s Note: The statements, opinions and data contained in all publications are solely those of the individual author(s) and contributor(s) and not of MDPI and/or the editor(s). MDPI and/or the editor(s) disclaim responsibility for any injury to people or property resulting from any ideas, methods, instructions or products referred to in the content.

