
Stability Evaluation for Main Quality Traits of Soybean in the Northeast and Huang-Huai-Hai Regions

 ,
, 
Abstract
1. Introduction
2. Materials and Methods
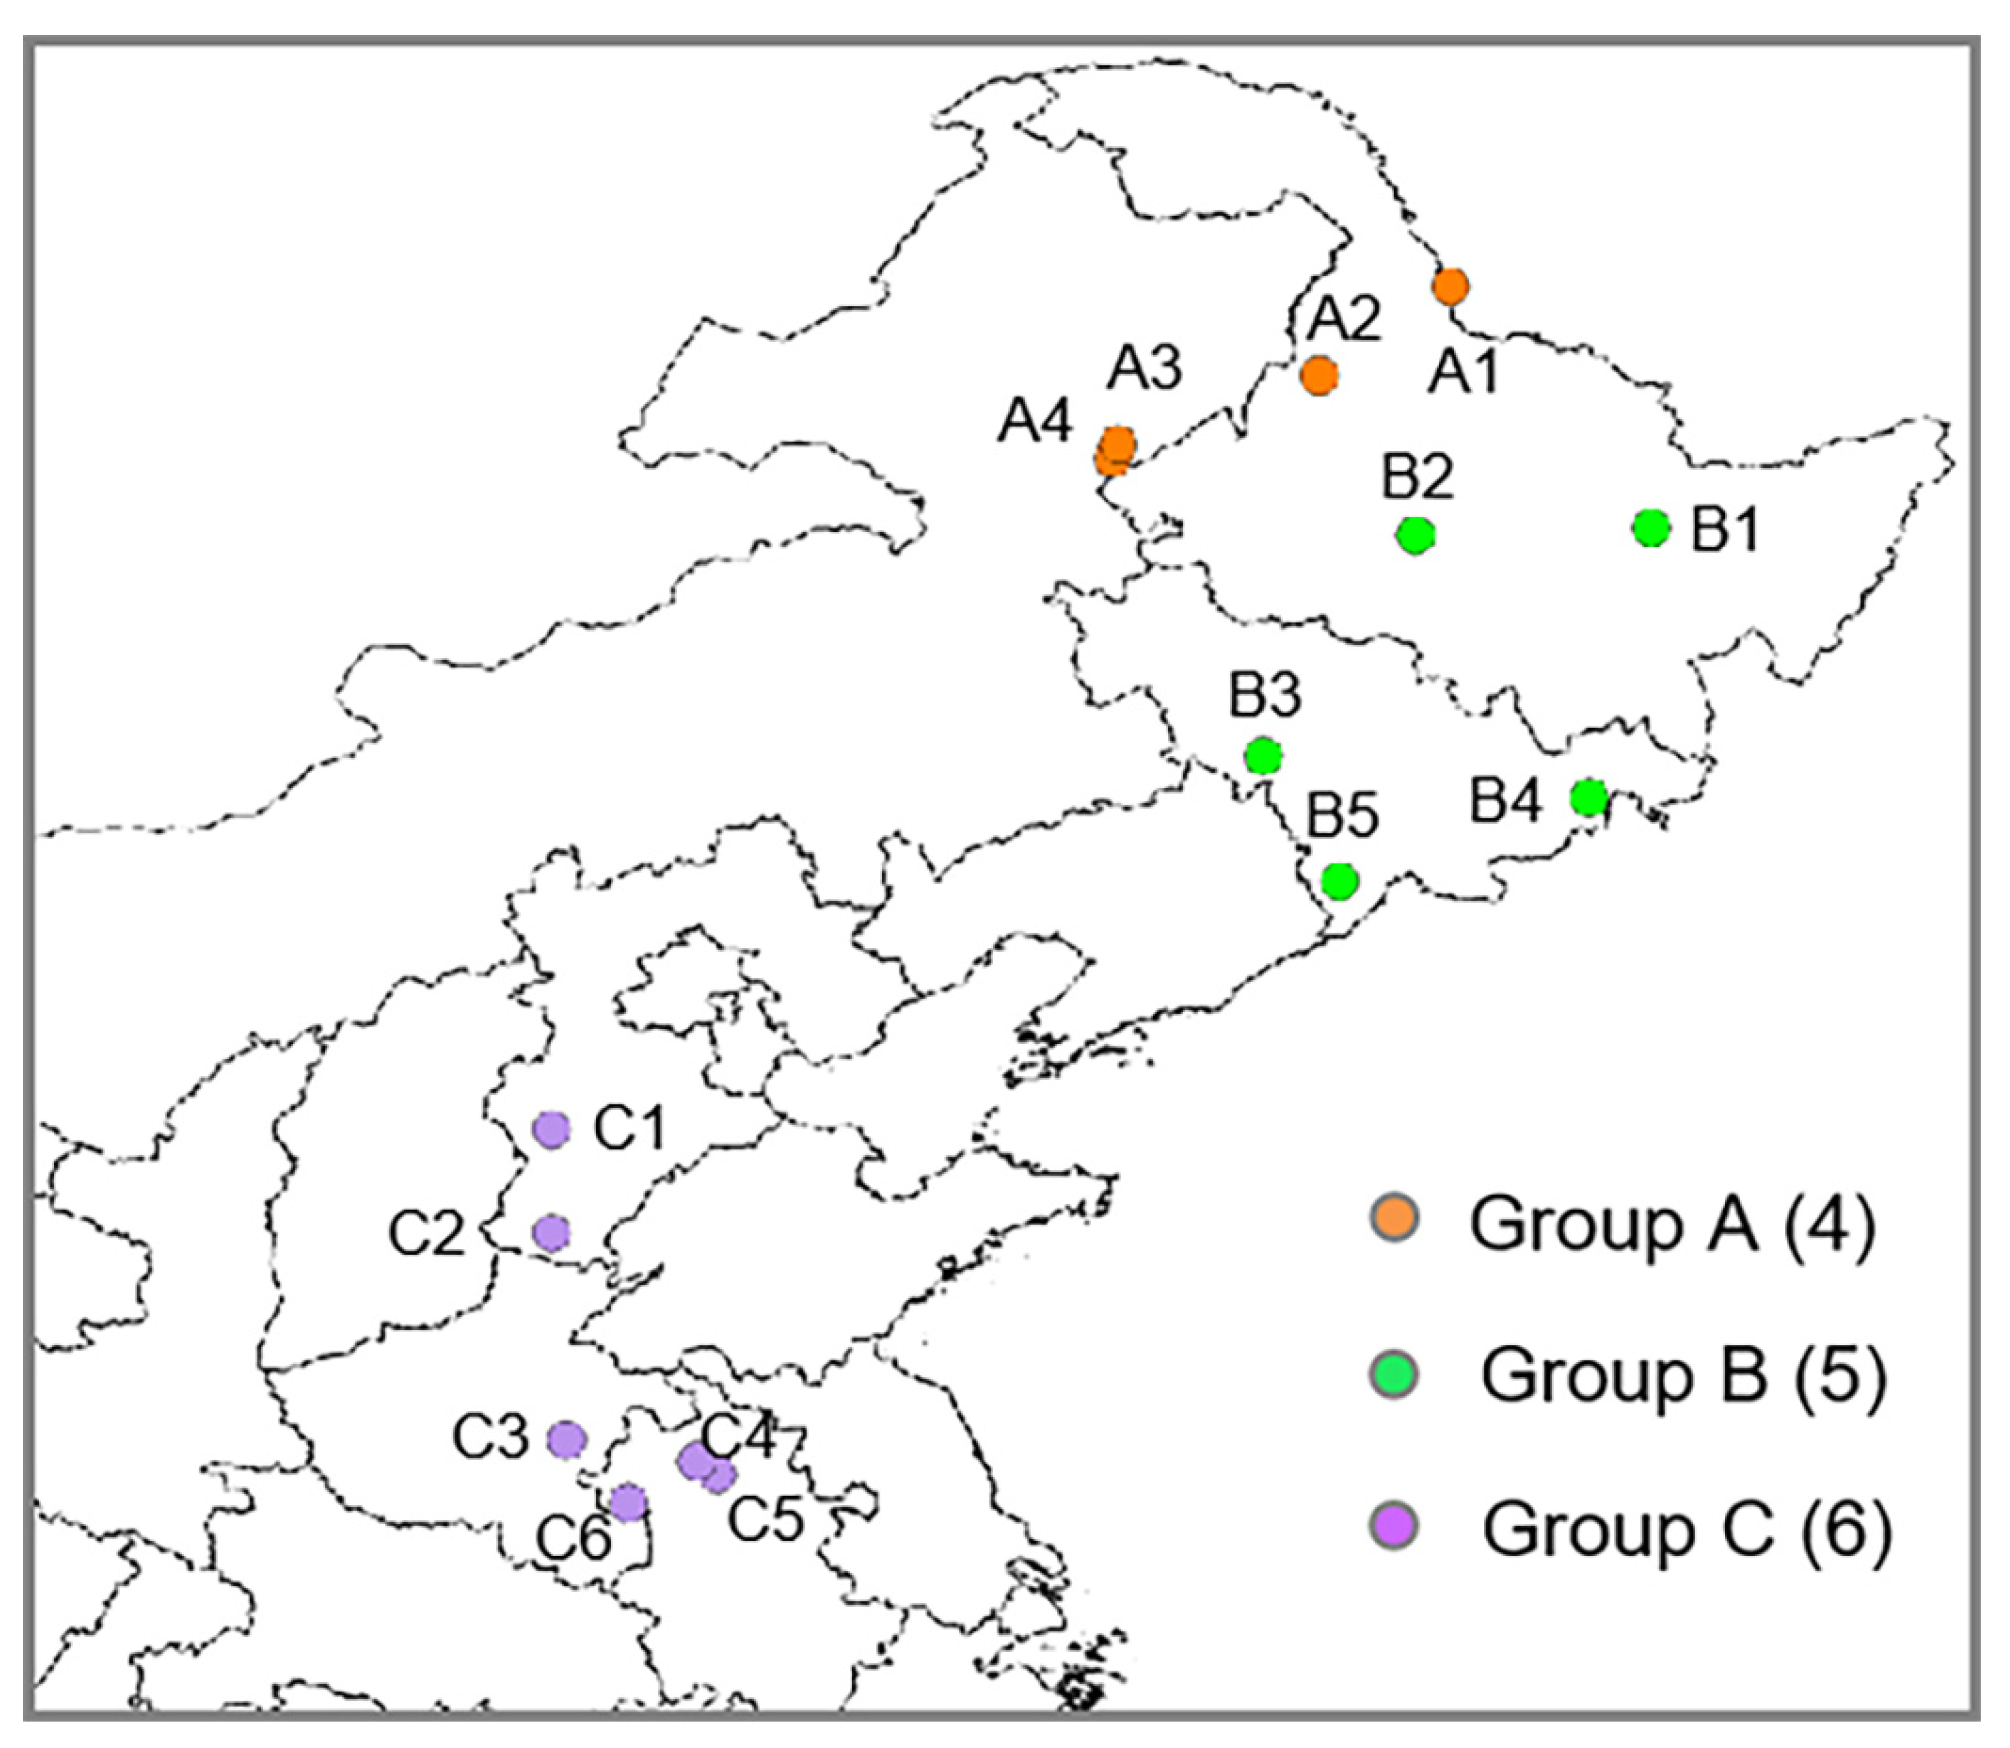
2.1. Experimental Material
2.2. Analytical Methods
3. Results
3.1. Comparison of Quality Traits in Soybean Germplasms across Different Decades
3.2. Correlation Analysis of Quality Traits among Different Regions
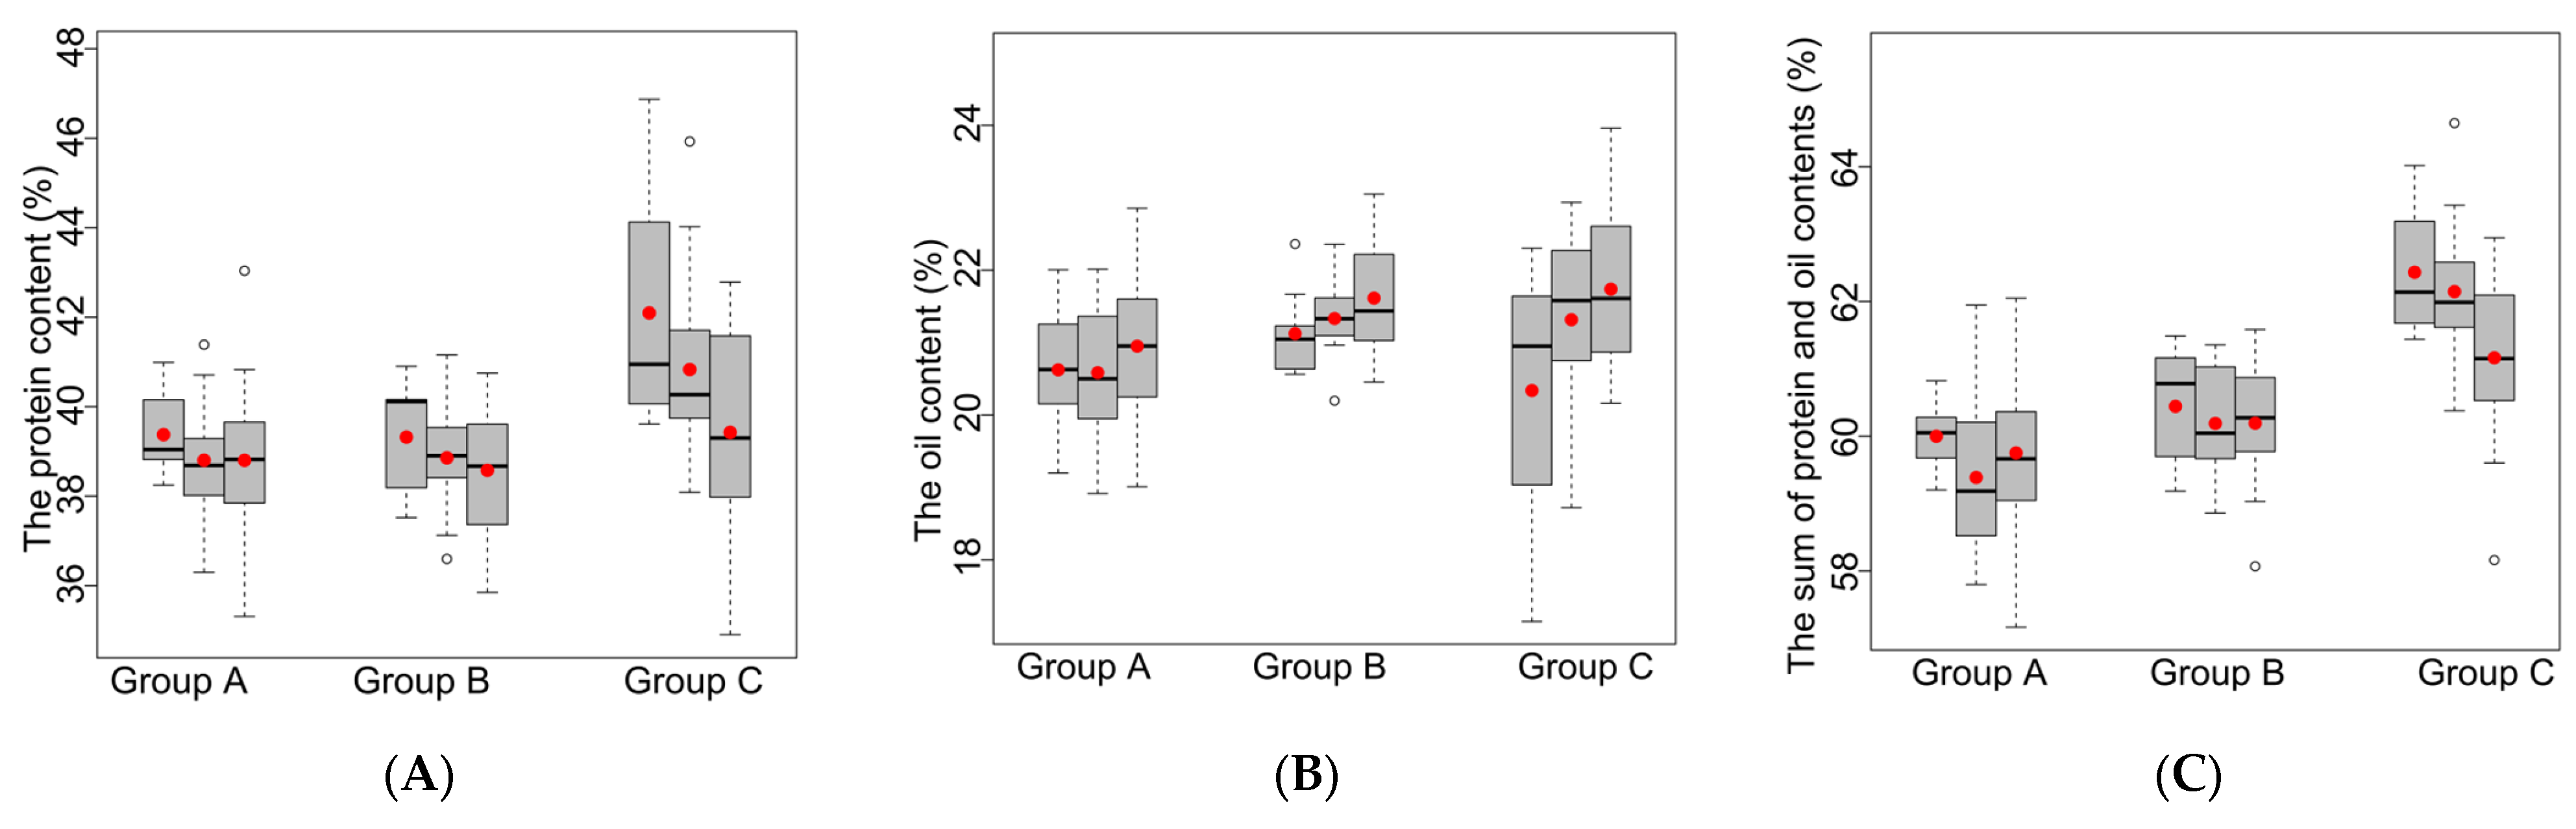
3.3. Analysis of Soybean Germplasm Quality Traits in Three Regions
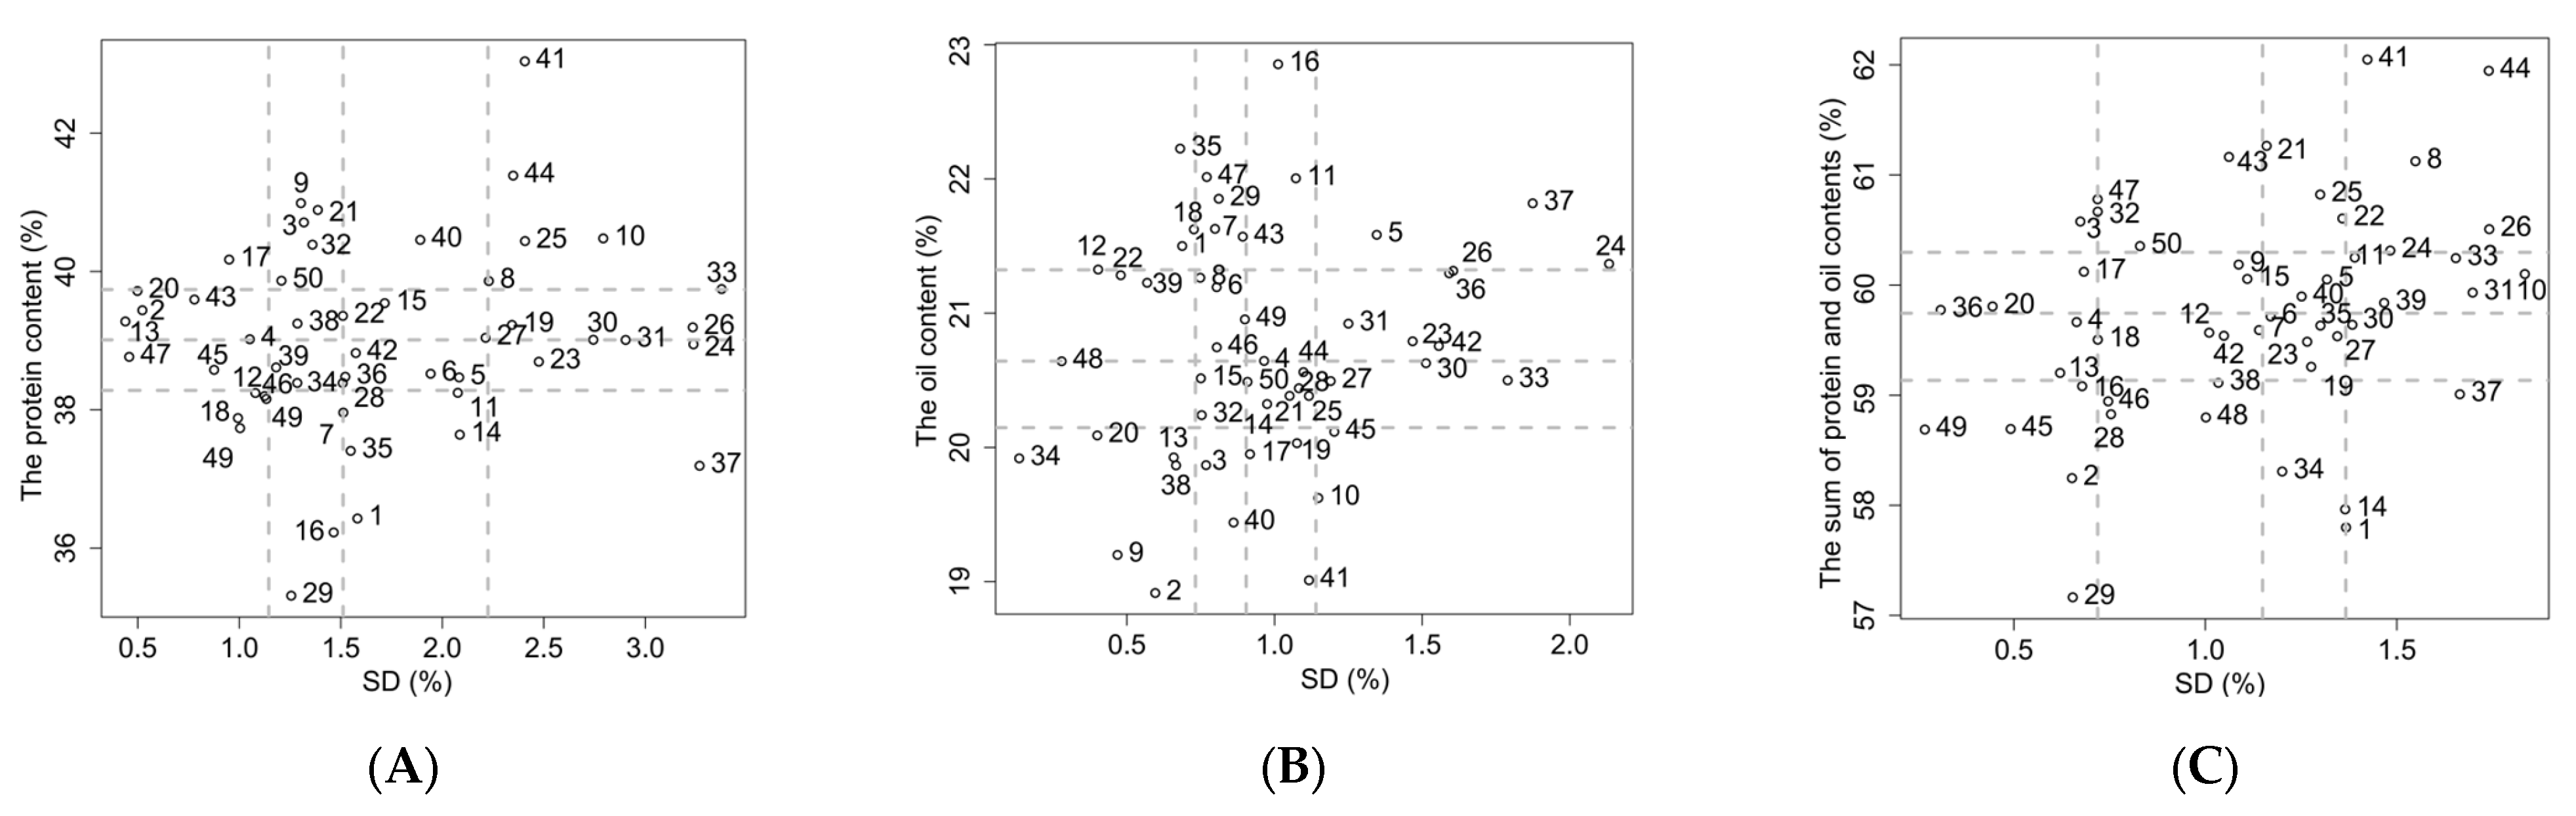
3.4. Stability Analysis of Quality Traits in Soybean Germplasms from Three Regions
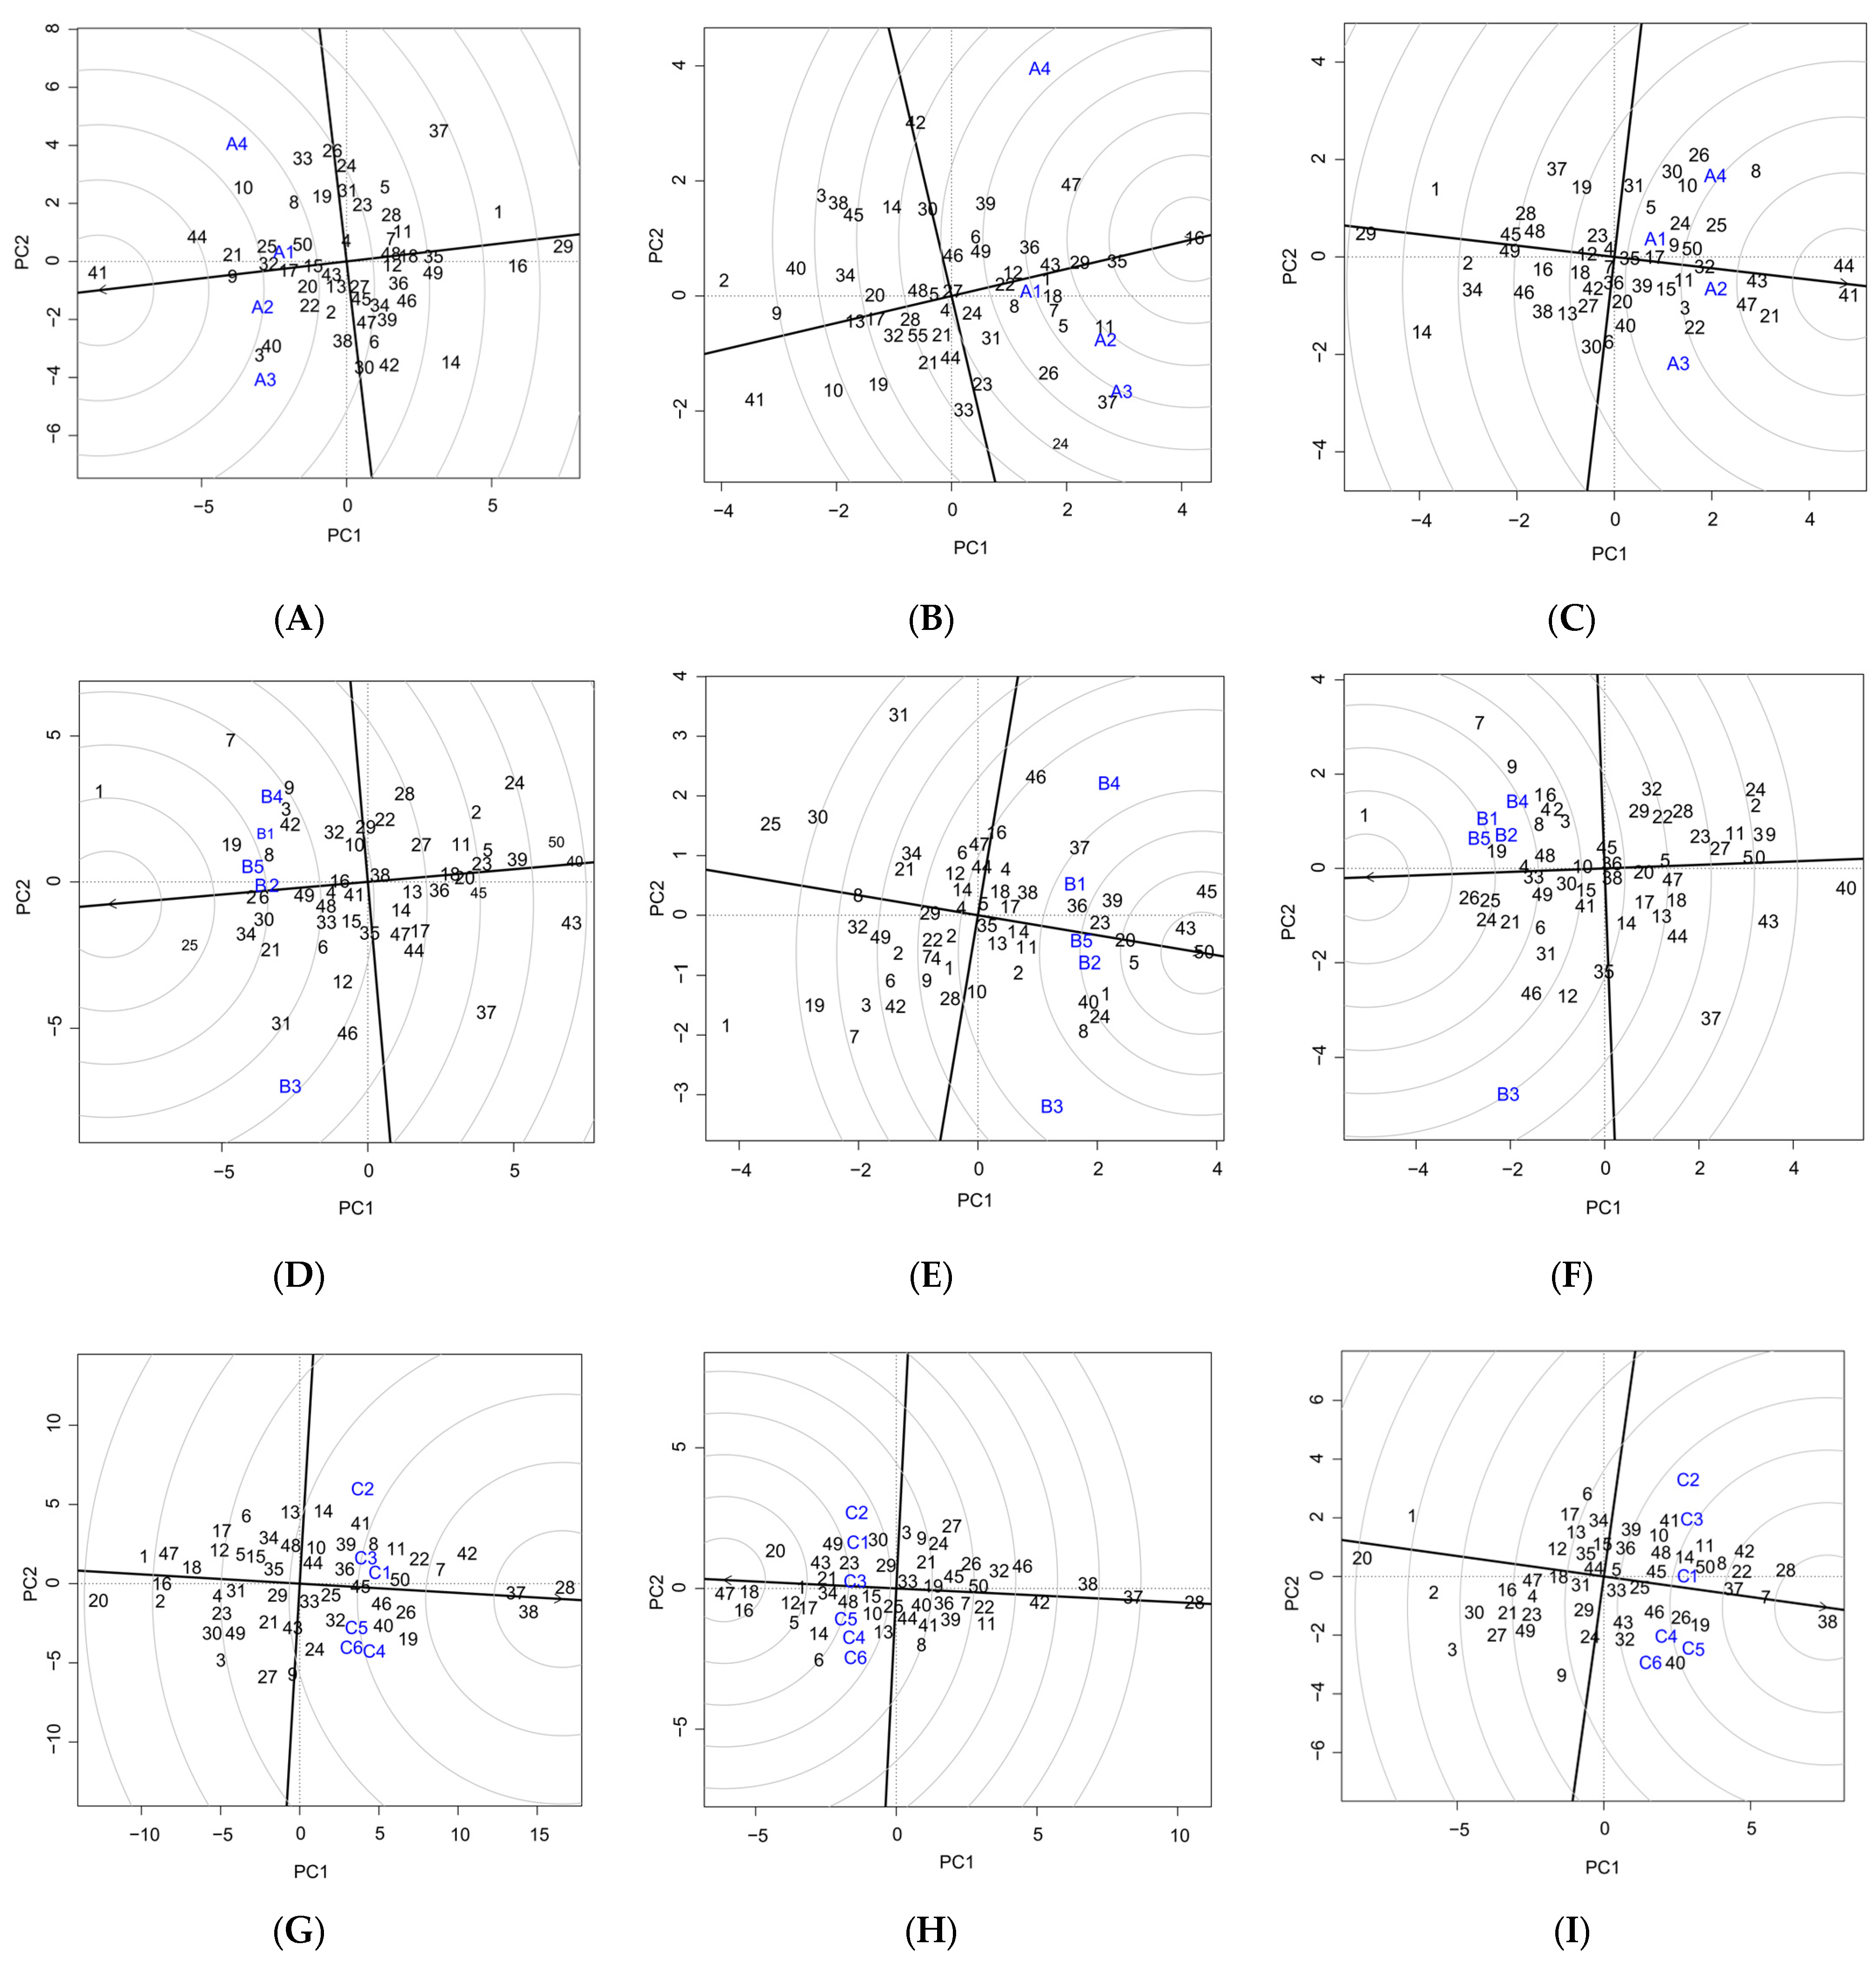
3.5. Adaptation Analysis of Germplasm Quality Traits Based on the GGE Model
4. Discussion
4.1. Excellent Quality Traits of Varieties
4.2. Changes in Soybean Variety Quality Traits in the Huang-Huai-Hai and Northeast Regions during Different Periods
5. Conclusions
Author Contributions
Funding
Data Availability Statement
Conflicts of Interest
References
- Chaudhary, J.; Patil, G.B.; Sonah, H. Expanding omics resources for improvement of soybean seed composition traits. Front. Plant Sci. 2015, 6, 163916. [Google Scholar] [CrossRef] [PubMed]
- Clemente, T.E.; Cahoon, E.B. Soybean oil: Genetic approaches for modification of functionality and total content. Plant Physiol. 2009, 151, 1030–1040. [Google Scholar] [CrossRef] [PubMed]
- Zhang, Y.H.; Liu, M.F.; He, J.B. Marker-assisted breeding for transgressive seed protein content in soybean [Glycine max (L.) Merr.]. Theor. Appl. Genet. 2015, 128, 1061–1072. [Google Scholar] [CrossRef] [PubMed]
- Leamy, L.J.; Zhang, H.; Li, C. A genome-wide association study of seed composition traits in wild soybean (Glycine soja). BMC Genom. 2017, 18, 18. [Google Scholar] [CrossRef] [PubMed]
- Kudełka, W.; Kowalska, M.; Popis, M. Quality of soybean products in terms of essential amino acids composition. Molecules 2021, 26, 5071. [Google Scholar] [CrossRef] [PubMed]
- Boerma, H.R.; Specht, J.E. Soybeans: Improvement, production and uses. Am. Soc. Agron. 2004, 16, 621–677. [Google Scholar]
- Stevenson, S.E.; Woods, C.A.; Hong, B. Environmental effects on allergen levels in commercially grown non-genetically modified soybeans: Assessing variation across North America. Front. Plant Sci. 2012, 3, 196. [Google Scholar] [CrossRef] [PubMed]
- Rotundo, J.L.; Westgate, M.E. Meta-analysis of environmental effects on soybean seed composition. Field Crops Res. 2009, 110, 147–156. [Google Scholar] [CrossRef]
- Rotundo, J.L.; Miller-Garvin, J.E.; Naeve, S.L. Regional and temporal variation in soybean seed protein and oil across the United States. Crop Sci. 2016, 56, 797–808. [Google Scholar] [CrossRef]
- Jin, H.; Yang, X.; Zhao, H. Genetic analysis of protein content and oil content in soybean by genome-wide association study. Front. Plant Sci. 2023, 14, 1182771. [Google Scholar] [CrossRef]
- Song, W.; Sun, S.; Wu, T. Geographic distributions and the regionalization of soybean seed compositions across China. Food Res. Int. 2023, 164, 112364. [Google Scholar] [CrossRef] [PubMed]
- Qu, J.; Hai, Y.; Pang, J.; Gu, C. The effect of meteorological factors on the fat content of summer soybean in Huang-Huai-Hai region. Agric. Sci. Henan 2008, 1, 44–46. (In Chinese) [Google Scholar]
- Wang, H.; Tang, H.; Niu, D.; Lv, M. Research on the meteorological forecasting method for key quality components of soybean. Soy Sci. 2021, 40, 112–121. (In Chinese) [Google Scholar]
- Bosaz, L.B.; Gerde, J.A.; Borrás, L. Management and environmental factors explaining soybean seed protein variability in central Argentina. Field Crop Res. 2019, 240, 34–43. [Google Scholar] [CrossRef]
- Vital, R.G.; Müller, C.; Freire, F.B.S. Metabolic, physiological and anatomical responses of soybean plants under water deficit and high temperature condition. Sci. Rep. 2022, 12, 16467. [Google Scholar] [CrossRef] [PubMed]
- Carrera, C.; Martínez, M.J.; Dardanelli, J. Environmental variation and correlation of seed components in nontransgenic soybeans: Protein, oil, unsaturated fatty acids, tocopherols, and isoflavones. Crop Sci. 2011, 51, 800–809. [Google Scholar] [CrossRef]
- Zhang, Y.; Gao, Z.; Shi, P.; Han, Z. Adaptability analysis based on agronomic traits and quality traits of different soybean varieties. J. Agric. Sci. Technol. 2020, 22, 25–32. (In Chinese) [Google Scholar]
- Yin, R.; Feng, X.; Zhange, Z. Changes in soybean planting area and production outlook in Northeast China and Huang-Huai Region in 2017. Agric. Outlook 2017, 13, 42–47. (In Chinese) [Google Scholar]
- Obua, T.; Sserumaga, J.P.; Awio, B. Multi-Environmental Evaluation of Protein Content and Yield Stability among Tropical Soybean Genotypes Using GGE Biplot Analysis. Agron. J. 2021, 11, 1265. [Google Scholar] [CrossRef]
- Zhu, Q.; Wang, F.; Yi, Q. Modeling soybean cultivation suitability in China and its future trends in climate change scenarios. J. Environ. Manag. 2023, 345, 118934. [Google Scholar] [CrossRef]
- Xu, R.; Hu, W.; Zhou, Y. Use of near-infrared spectroscopy for the rapid evaluation of soybean [Glycine max (L.) Merri.] water soluble protein content. Spectrochim. Acta. Part A 2020, 224, 117400. [Google Scholar] [CrossRef] [PubMed]
- Silva, M.F.; Soares, J.M.; Martins, M.S. Artificial aging for predicting the storability of soybean seeds via GGE biplot. J. Seed Sci. 2024, 46, e202446001. [Google Scholar] [CrossRef]
- Whaley, R.; Eskandari, M. Genotypic main effect and genotype-by-environment interaction effect on seed protein concentration and yield in food-grade soybeans (Glycine max (L.) Merrill). Euphytica 2019, 215, 33. [Google Scholar] [CrossRef]
- Zhang, M.; Liu, S.; Wang, Z. Progress in soybean functional genomics over the past decade. Plant Biotechnol. J. 2022, 20, 256–282. [Google Scholar] [CrossRef] [PubMed]
- Liu, K.S.; Liu, K.S. Chemistry and nutritional value of soybean components. Soybeans 1997, 25–113. [Google Scholar] [CrossRef]
- Cunicelli, M.; Olukolu, B.A.; Sams, C. Map and identification of QTL in 5601T× U99-310255 RIL population using SNP genoty: Soybean seed quality traits. Mol. Biol. Rep. 2022, 49, 6623–6632. [Google Scholar] [CrossRef] [PubMed]
- Collard, B.C.Y.; Jahufer, M.Z.Z.; Brouwer, J.B. An introduction to markers, quantitative trait loci (QTL) map and marker-assisted selection for crop improvement: The basic concepts. Euphytica 2005, 142, 169–196. [Google Scholar] [CrossRef]
- Petereit, J.; Marsh, J.I.; Bayer, P.E. Genetic and genomic resources for soybean breeding research. Plants 2022, 11, 1181. [Google Scholar] [CrossRef]
- Shi, D.; Hang, J.; Neufeld, J. Effects of genotype, environment and their interaction on protein and amino acid contents in soybeans. Plant Sci. 2023, 337, 111891. [Google Scholar] [CrossRef]
- Ahmed, M.A.; Hassan, T.H.A.; Zahran, H.A. Heterosis for seed, oil yield and quality of some different hybrids sunflower. OCL 2021, 28, 25. [Google Scholar] [CrossRef]
- Joseph, B. Genomic Analysis of a Major Seed Protein/Oil QTL Region on Soybean Linkage Group I; Iowa State University: Ames, IA, USA, 2009. [Google Scholar]
- Azam, M.; Zhang, S.; Qi, J. Profiling and associations of seed nutritional characteristics in Chinese and USA soybean cultivars. J. Food Compos. Anal. 2021, 98, 103803. [Google Scholar] [CrossRef]
- Bai, Z.; Chen, X.; Zheng, A.; Zhang, L.; Zou, J.; Zhang, D.; Chen, F.; Yin, X. Temporal and spatial variation characteristics of agronomic and quality traits of soybean regional trial varieties (lines) in the United States from 1991 to 2019. Crop J. 2023, 49, 177–187. (In Chinese) [Google Scholar]
- Qin, X.; Feng, F.; Li, D. Changes in yield and agronomic traits of soybean cultivars released in China in the last 60 years. Crop Pasture Sci. 2017, 68, 973–984. [Google Scholar] [CrossRef]
- Wilcox, J.R. Sixty years of improvement in publicly developedelite gation and soil water-deficit. Field Crops Res. 1991, 27, 71–82. [Google Scholar]
- Huang, W.; Hou, J.; Hu, Q. Pedigree-based genetic dissection of quantitative loci for seed quality and yield characters in improved soybean. Mol. Breed. 2021, 41, 14. [Google Scholar] [CrossRef] [PubMed]
- Grieshop, C.M.; Fahey, G.C. Comparison of quality characteristics of soybeans from Brazil, China, and the United States. J. Agric. Food. Chem. 2001, 49, 2669–2673. [Google Scholar] [CrossRef]
- Prenger, E.M.; Ostezan, A.; Mian, M.A.R. Identification and characterization of a fast-neutron-induced mutant with elevated seed protein content in soybean. Theor. Appl. Genet. 2019, 132, 2965–2983. [Google Scholar] [CrossRef]
- Zhang, Q.; Sun, T.; Wang, J.; Fei, J. Genome-wide association study and high-quality gene mining related to soybean protein and fat. BMC Genom. 2023, 24, 596. [Google Scholar] [CrossRef]


| Number | Material Name | Year of Approval | Number | Material Name | Year of Approval | Number | Material Name | Year of Approval |
|---|---|---|---|---|---|---|---|---|
| 1 | Fengshou 1 | 1958 | 1 | Fengshou 12 | 1969 | 1 | Shuilizhan | 1956 |
| 2 | Fengshou 10 | 1966 | 2 | Suinong 4 | 1981 | 2 | Yudou 1 | 1985 |
| 3 | Heihe 3 | 1966 | 3 | Dongnong 34 | 1982 | 3 | Ludou 8 | 1988 |
| 4 | Heihe 54 | 1967 | 4 | Fengshou 19 | 1985 | 4 | Zaoshou 17 | 1989 |
| 5 | Beihudou | 1972 | 5 | Jilin 20 | 1985 | 5 | Zhonghuang 3 | 1990 |
| 6 | Fengshou 18 | 1981 | 6 | Hefeng 27 | 1986 | 6 | Yudou 12 | 1992 |
| 7 | Heihe 4 | 1982 | 7 | Heinong 30 | 1987 | 7 | Ludou 10 | 1993 |
| 8 | Beifeng 2 | 1983 | 8 | Nenfeng 13 | 1987 | 8 | Yudou 15 | 1993 |
| 9 | Heihe 5 | 1986 | 9 | Jiufeng 4 | 1988 | 9 | Zhongpin 661 | 1994 |
| 10 | Jiufeng 3 | 1986 | 10 | Heinong 35 | 1990 | 10 | Ludou 11 | 1995 |
| 11 | Jiufeng 1 | 1987 | 11 | Hongfeng 8 | 1993 | 11 | Yudou 19 | 1995 |
| 12 | Hefeng 30 | 1988 | 12 | Heihe 11 | 1994 | 12 | Yudou 20 | 1995 |
| 13 | Heihe 7 | 1988 | 13 | Suinong 10 | 1994 | 13 | Nannong 217 | 1996 |
| 14 | Kennong 2 | 1988 | 14 | Bainong 6 | 1995 | 14 | Tiefeng 28 | 1996 |
| 15 | Suinong 8 | 1989 | 15 | Jilin 33 | 1995 | 15 | Xudou 8 | 1996 |
| 16 | Heinong 38 | 1992 | 16 | Heihe 18 | 1998 | 16 | Jindou 22 | 1998 |
| 17 | Baofeng 7 | 1994 | 17 | Hongfeng 11 | 1998 | 17 | Handou 3 | 1999 |
| 18 | Hefeng 35 | 1994 | 18 | Suinong 15 | 1998 | 18 | Huayou 542 | 1999 |
| 19 | Neidou 4 | 1994 | 19 | Dongnong 43 | 1999 | 19 | Kexin 5 | 2000 |
| 20 | Baofeng 8 | 1995 | 20 | Jilin 47 | 1999 | 20 | Jidou 12 | 2001 |
| 21 | Beifeng 11 | 1995 | 21 | Jiyuanyin 3 | 1999 | 21 | Jindou 26 | 2001 |
| 22 | Suinong 11 | 1995 | 22 | Hefeng 39 | 2000 | 22 | Tiefeng 31 | 2001 |
| 23 | Suinong 14 | 1996 | 23 | Jikedou 1 | 2001 | 23 | Wuxing 1 | 2001 |
| 24 | Heihe 18 | 1998 | 24 | Jiyu 54 | 2001 | 24 | Zheng 9007 | 2001 |
| 25 | Heihe 19 | 1998 | 25 | Kennong 17 | 2001 | 25 | Zhonghuang 13 | 2001 |
| 26 | Kennong 16 | 1998 | 26 | Kennong 18 | 2001 | 26 | Zhonghuang 20 | 2001 |
| 27 | Kenjiandou 4 | 1999 | 27 | Kennong 7 | 2001 | 27 | Qichadou 2 | 2002 |
| 28 | Dongnong 44 | 2000 | 28 | Kenfeng 9 | 2002 | 28 | Xudou 11 | 2002 |
| 29 | Hefeng 40 | 2000 | 29 | Kennong 19 | 2002 | 29 | Zhongpin 662 | 2002 |
| 30 | Heihe 23 | 2000 | 30 | Dongnong 46 | 2003 | 30 | Jinda 70 | 2003 |
| 31 | Jiyu 58 | 2001 | 31 | Dongsheng 1 | 2003 | 31 | Liaodou 14 | 2003 |
| 32 | Nenfeng 16 | 2001 | 32 | Hefeng 44 | 2003 | 32 | Zhonghuang 19 | 2003 |
| 33 | Beifeng 16 | 2002 | 33 | Heihe 28 | 2003 | 33 | Handou 5 | 2004 |
| 34 | Hefeng 42 | 2002 | 34 | Heihe 30 | 2003 | 34 | Jinda 74 | 2004 |
| 35 | Hefeng 45 | 2002 | 35 | Heinong 46 | 2003 | 35 | Jindou 28 | 2004 |
| 36 | Mengdou 11 | 2002 | 36 | Hongfeng 12 | 2003 | 36 | Jindou 29 | 2004 |
| 37 | Suinong 18 | 2002 | 37 | Jiyu 70 | 2003 | 37 | Wuxing 2 | 2004 |
| 38 | Dongda 1 | 2003 | 38 | Kenfeng 10 | 2003 | 38 | Dongdou 1 | 2005 |
| 39 | Heihe 29 | 2003 | 39 | Changnong 17 | 2003 | 39 | Liaoshou 2 | 2005 |
| 40 | Kenfeng 11 | 2003 | 40 | Heinong 48 | 2004 | 40 | 84-51 | NA |
| 41 | Kenjiandou 25 | 2003 | 41 | Kenjiandou 33 | 2004 | 41 | GR8836 | NA |
| 42 | Kenjiandou 26 | 2003 | 42 | Nenfeng 17 | 2004 | 42 | Gaofeng 1 | NA |
| 43 | Kenjiandou 27 | 2003 | 43 | Suinong 21 | 2004 | 43 | Heyin 1 | NA |
| 44 | Mengdou 13 | 2003 | 44 | Fengshou 14 | NA | 44 | Heyin 2 | NA |
| 45 | Heihe 34 | 2004 | 45 | Fengshou 8 | NA | 45 | Hedou 13 | NA |
| 46 | Mengdou 14 | 2004 | 46 | Jihuang 60 | NA | 46 | Jinyi 30 | NA |
| 47 | Fengshou 9 | NA | 47 | Jilinxiaolidou 4 | NA | 47 | Qingpipingdingxiang | NA |
| 48 | Jiufeng 6 | NA | 48 | Kangxiandou 5 | NA | 48 | Tiegan 1 | NA |
| 49 | Jiufeng 7 | NA | 49 | Nenfeng 10 | NA | 49 | Wenfeng 1 | NA |
| 50 | Nenliang 7 | NA | 50 | Kato, Proto | NA | 50 | Yangyanjingdou | NA |
| Correlation Coefficient | Significance | |
|---|---|---|
| The protein and oil contents in Group A | −0.76 | 7.22 × 10−39 |
| The protein and oil contents in Group B | −0.82 | 8.64 × 10−61 |
| The protein and oil contents in Group C | −0.93 | 1.38 × 10−133 |
| The oil contents and sum of protein and oil in Group A | −0.25 | 0.000406 |
| The oil contents and sum of protein and oil in Group B | −0.48 | 6.21 × 10⁻¹⁶ |
| The oil contents and sum of protein and oil in Group C | −0.77 | 2.54 × 10−61 |
| The protein content and sum of protein and oil in Group A | 0.82 | 0 |
| The protein content and sum of protein and oil in Group B | 0.9 | 0 |
| The protein content and sum of protein and oil in Group C | 0.95 | 0 |
| Property | Group | Mean | Max | Min | Coefficient of Variation | Significance of Difference | Significance p ≤ 0.01 |
|---|---|---|---|---|---|---|---|
| The protein content | Group A | 39 | 43.04 | 35.31 | 0.035 | A:B—0.94 | a |
| Group B | 38.98 | 42.95 | 35.85 | 0.04 | B:C—7.98 × 10⁻³ | a | |
| Group C | 40.11 | 46.87 | 34.91 | 0.063 | C:A—7.17 × 10⁻³ | b | |
| The oil content | Group A | 20.74 | 22.85 | 18.92 | 0.041 | A:B 0.000484 | a |
| Group B | 21.34 | 23.05 | 19.62 | 0.037 | B:C 0.62 | b | |
| Group C | 21.45 | 23.96 | 17.15 | 0.065 | C:A 0.00276 | b | |
| The sum of protein and oil | Group A | 59.75 | 62.05 | 57.16 | 0.017 | A:B 0.00308 | a |
| Group B | 60.32 | 62.57 | 58.07 | 0.015 | B:C 0.000000309 | b | |
| Group C | 61.56 | 64.65 | 58.16 | 0.022 | C:A 8.08 × 10⁻¹² | c |
| Rank | The Protein Content | The Oil Content | The Sum of Protein and Oil Contents | |||||||
|---|---|---|---|---|---|---|---|---|---|---|
| Variety | Mean | Coefficient of Variation (%) | Variety | Mean | Coefficient of Variation (%) | Variety | Mean | Coefficient of Variation (%) | ||
| Mean | 1 | Mengdou 11 | 43 | 5.59 | Hefeng 42 | 22.9 | 5.59 | Mengdou 11 | 62 | 2.29 |
| 2 | Neidou 4 | 41.4 | 5.68 | Kenjianbean 25 | 22.2 | 5.68 | Neidou 4 | 61.9 | 2.81 | |
| 3 | Fengshou 1 | 41 | 3.18 | Suinong 11 | 22 | 3.18 | Heihe 29 | 61.2 | 1.89 | |
| 4 | Heihe 29 | 40.8 | 3.40 | Fengshou 18 | 22 | 3.40 | Mengdou 14 | 61.2 | 1.74 | |
| 5 | Beifeng 11 | 40.7 | 3.24 | Jiyu 58 | 21.9 | 3.24 | Dongnong 44 | 61.1 | 2.53 | |
| 6 | Fengshou 10 | 40.5 | 6.90 | Kenjiandou 27 | 21.8 | 6.90 | Heihe 54 | 60.8 | 2.14 | |
| 7 | Kennong 2 | 40.5 | 4.67 | Dongda 1 | 21.6 | 4.67 | Suinong 11 | 60.8 | 1.18 | |
| 8 | Heihe 54 | 40.4 | 5.95 | Heihe 18 | 21.6 | 5.95 | Jiufeng 6 | 60.6 | 1.19 | |
| 9 | Jiufeng 6 | 40.4 | 3.37 | Beifeng 2 | 21.6 | 3.37 | Heihe 34 | 60.6 | 2.24 | |
| 10 | Hefeng 45 | 40.2 | 2.36 | Mengdou 14 | 21.6 | 2.36 | Beifeng 11 | 60.6 | 1.11 | |
| Coefficient of Variation | 1 | Hefeng 30 | 39.3 | 1.12 | Kenfeng 11 | 19.9 | 1.12 | Suinong 18 | 58.7 | 0.46 |
| 2 | Suinong 11 | 38.8 | 1.18 | Suinong 14 | 20.6 | 1.18 | Kenjiandou 26 | 59.8 | 0.52 | |
| 3 | Heihe 23 | 39.8 | 1.27 | Fengshou 9 | 21.3 | 1.27 | Heihe 23 | 59.8 | 0.81 | |
| 4 | Baofeng 8 | 39.3 | 1.33 | Heihe 23 | 20.1 | 1.33 | Nenfeng 16 | 58.7 | 0.84 | |
| 5 | Mengdou 14 | 39.6 | 1.97 | Heihe 34 | 21.2 | 1.97 | Hefeng 30 | 59.2 | 1.05 | |
| 6 | Nenfeng 16 | 38.6 | 2.27 | Fengshou 1 | 19.2 | 2.27 | Beifeng 11 | 60.6 | 1.11 | |
| 7 | Hefeng 45 | 40.2 | 2.36 | Kennong 16 | 21.2 | 2.36 | Beifeng 16 | 59.7 | 1.11 | |
| 8 | Heihe 18 | 37.9 | 2.62 | Kenjiandou 25 | 22.2 | 2.62 | Baofeng 8 | 58.2 | 1.12 | |
| 9 | Suinong 18 | 37.7 | 2.66 | Baofeng 8 | 18.9 | 2.66 | Hefeng 45 | 60.1 | 1.14 | |
| 10 | Beifeng 16 | 39 | 2.70 | Baofeng 7 | 21.5 | 2.70 | Jiyu 58 | 57.2 | 1.14 | |
| Rank | The Protein Content | The Oil Content | The Sum of Protein and Oil Contents | |||||||
|---|---|---|---|---|---|---|---|---|---|---|
| Variety | Mean | Coefficient of Variation (%) | Variety | Mean | Coefficient of Variation (%) | Variety | Mean | Coefficient of Variation (%) | ||
| Mean | 1 | Kato, Proto | 42.9 | 5.78 | Changnong 17 | 23.1 | 2.35 | Kato, Proto | 62.6 | 1.97 |
| 2 | Jihuang 60 | 41.8 | 5.55 | Nenfeng 17 | 23 | 3.87 | Jikedou 1 | 61.6 | 2.32 | |
| 3 | Heinong 35 | 41.2 | 5.92 | Nenfeng 10 | 22.8 | 4.54 | Jiufeng 4 | 61.5 | 2.48 | |
| 4 | Fengshou 12 | 40.9 | 6.91 | Dongnong 46 | 22.5 | 2.39 | Fengshou 12 | 61.5 | 1.97 | |
| 5 | Jikedou 1 | 40.8 | 4.36 | Heinong 46 | 22.4 | 2.76 | Jihuang 60 | 61.5 | 2.94 | |
| 6 | Jiufeng 4 | 40.7 | 4.31 | Heinong 30 | 22.4 | 5.40 | Heinong 35 | 61.4 | 2.03 | |
| 7 | Fengshou 14 | 40.6 | 3.38 | Hongfeng 8 | 22.4 | 5.58 | Heinong 48 | 61.2 | 2.31 | |
| 8 | Jilinxiaolidou 4 | 40.6 | 2.26 | Kennong 17 | 22.3 | 2.05 | Dongnong 43 | 61.2 | 2.11 | |
| 9 | Jiyu 54 | 40.5 | 6.23 | Kennong 18 | 22.2 | 5.36 | Fengshou 19 | 61.2 | 2.11 | |
| 10 | Heinong 48 | 40.5 | 3.78 | Hongfeng 12 | 22.2 | 3.23 | Suinong 10 | 61.1 | 3.07 | |
| Coefficient of Variation | 1 | Heihe 28 | 39.6 | 1.13 | Suinong 21 | 21.2 | 1.38 | Jilin 47 | 60 | 0.78 |
| 2 | Heihe 30 | 38.4 | 2.25 | Jiufeng 4 | 20.8 | 1.45 | Heihe 28 | 61 | 0.95 | |
| 3 | Jilinxiaolidou 4 | 40.6 | 2.26 | Jilinxiaolidou 4 | 20 | 1.47 | Hefeng 27 | 59.2 | 1.15 | |
| 4 | Heihe 11 | 38.5 | 2.54 | Heihe 28 | 21.4 | 1.98 | Kennong 7 | 60.9 | 1.15 | |
| 5 | Suinong 21 | 39.6 | 2.63 | Kennong 17 | 22.3 | 2.05 | Hongfeng 12 | 59.4 | 1.17 | |
| 6 | Hefeng 27 | 37.5 | 2.68 | Heinong 48 | 20.8 | 2.12 | Jiyu 70 | 59.9 | 1.22 | |
| 7 | Jilin 47 | 39 | 2.89 | Suinong 15 | 21.3 | 2.23 | Hongfeng 8 | 59 | 1.27 | |
| 8 | Suinong 15 | 38.6 | 2.93 | Jiyuan Yin 3 | 21.4 | 2.33 | Suinong 21 | 60.8 | 1.46 | |
| 9 | Jiyuan Yin 3 | 39.6 | 3.19 | Changnong 17 | 23.1 | 2.35 | Heihe 30 | 59.9 | 1.62 | |
| 10 | Dongnong 46 | 37.2 | 3.37 | Dongnong 46 | 22.5 | 2.39 | Suinong 15 | 59.9 | 1.62 | |
| Rank | The Protein Content | The Oil Content | The Sum of Protein and Oil Contents | |||||||
|---|---|---|---|---|---|---|---|---|---|---|
| Variety | Mean | Coefficient of Variation (%) | Variety | Mean | Coefficient of Variation (%) | Variety | Mean | Coefficient of Variation (%) | ||
| Mean | 1 | Shuilizhan | 46.9 | 6.78 | Zhonghuang 20 | 24 | 5.48 | Yudou 12 | 64.6 | 2.82 |
| 2 | Yudou 12 | 45.9 | 6.29 | Jindou 28 | 23.7 | 6.12 | Shuilizhan | 64 | 3.29 | |
| 3 | Yangyanjingdou | 45.2 | 6.98 | Jinyi 30 | 23.7 | 5.57 | Heyin 1 | 63.8 | 2.44 | |
| 4 | Yudou 20 | 44 | 8.51 | Liaodou 14 | 23.3 | 2.52 | Yudou 20 | 63.4 | 4.00 | |
| 5 | Heyin 1 | 43.4 | 6.86 | Jinda 70 | 23 | 5.94 | Ludou 10 | 63.3 | 3.83 | |
| 6 | Ludou 10 | 42.9 | 9.01 | Jindou 29 | 23 | 6.33 | Yangyanjingdou | 63.3 | 3.32 | |
| 7 | Jidou 12 | 42.8 | 7.06 | Handou 3 | 22.9 | 6.86 | Heyin 2 | 63 | 3.24 | |
| 8 | Zhongpin 662 | 42.4 | 7.37 | 84-51 | 22.8 | 5.95 | Jidou 12 | 62.9 | 2.76 | |
| 9 | Qichadou 2 | 42.1 | 7.73 | GR8836 | 22.7 | 4.12 | Zhongpin 662 | 62.8 | 3.22 | |
| 10 | Zhonghuang 19 | 42 | 5.19 | Tiegan 1 | 22.7 | 4.74 | Kexin 5 | 62.7 | 2.86 | |
| Coefficient of Variation | 1 | Liaoshou 2 | 39.3 | 3.69 | Dongdou 1 | 21.4 | 2.48 | Yudou 19 | 62.6 | 0.94 |
| 2 | Ludou 8 | 40.5 | 3.85 | Liaodou 14 | 23.3 | 2.52 | Qingpipingdingxiang | 60.2 | 1.31 | |
| 3 | Qingpipingdingxiang | 39.4 | 3.92 | Ludou 8 | 20.9 | 2.77 | GR8836 | 59.2 | 1.57 | |
| 4 | Dongdou 1 | 38.2 | 4.34 | Liaoshou 2 | 21 | 2.83 | Ludou 8 | 61.4 | 1.69 | |
| 5 | Zhongpin 661 | 38.1 | 4.35 | Tiefeng 31 | 21.9 | 2.92 | Liaoshou 2 | 60.3 | 1.70 | |
| 6 | Yudou 19 | 41.7 | 4.47 | Ludou 11 | 22.3 | 3.05 | Jindou 28 | 60.2 | 1.90 | |
| 7 | Tiefeng 31 | 37.9 | 4.48 | Zhongpin 661 | 22.4 | 3.24 | Tiefeng 31 | 59.8 | 1.95 | |
| 8 | Zaoshou 17 | 39.6 | 4.81 | Zaoshou 17 | 22.3 | 3.62 | Dongdou 1 | 59.6 | 1.99 | |
| 9 | GR8836 | 36.5 | 4.97 | Qingpipingdingxiang | 20.7 | 4.07 | Zhonghuang 19 | 62.2 | 2.04 | |
| 10 | Zhonghuang 19 | 42 | 5.19 | GR8836 | 22.7 | 4.12 | Zaoshou 17 | 61.9 | 2.04 | |
| Group | Rank | Variety | The ProteinContent (%) | Variety | The Oil Content (%) | Variety | The Sum of Protein and Oil Contents (%) |
|---|---|---|---|---|---|---|---|
| A | 1 | Mengdou 11 | 43 | Hefeng 42 | 22.9 | Mengdou 11 | 62 |
| 2 | Neidou 4 | 41.4 | Kenjiandou 25 | 22.2 | Neidou 4 | 61.9 | |
| 3 | Fengshou 1 | 41 | Jiyu 58 | 21.9 | Mengdou 14 | 61.2 | |
| 4 | Heihe 29 | 40.4 | Fengshou 18 | 22 | Heihe 29 | 61.2 | |
| 5 | Jiufeng 6 | 40.4 | Suinong 11 | 22 | Suinong 11 | 60.8 | |
| B | 1 | Jihuang 60 | 41.8 | Changnong 17 | 23.1 | Kato, Proto | 62.6 |
| 2 | Kato, Proto | 42.9 | Nenfeng 10 | 22.8 | Jikedou 1 | 61.6 | |
| 3 | Heinong 35 | 41.2 | Nenfeng 17 | 23 | Jihuang 60 | 61.5 | |
| 4 | Jikedou 1 | 40.8 | Dongnong 46 | 22.5 | Jiufeng 4 | 61.5 | |
| 5 | Jiufeng 4 | 40.7 | Heinong 46 | 22.4 | Heinong 35 | 61.4 | |
| C | 1 | Shuilizhan | 46.9 | Zhonghuang 20 | 24 | Yudou 12 | 64.6 |
| 2 | Yudou 12 | 45.9 | Jindou 28 | 23.7 | Shuilizhan | 64 | |
| 3 | Yangyanjingdou | 45.2 | Jinyi 30 | 23.7 | Heyin 1 | 63.8 | |
| 4 | Yudou 20 | 44 | Liaodou 14 | 23.3 | Yudou 20 | 63.4 | |
| 5 | Heyin 1 | 43.4 | Jinda 70 | 23 | Ludou 10 | 63.3 |
Disclaimer/Publisher’s Note: The statements, opinions and data contained in all publications are solely those of the individual author(s) and contributor(s) and not of MDPI and/or the editor(s). MDPI and/or the editor(s) disclaim responsibility for any injury to people or property resulting from any ideas, methods, instructions or products referred to in the content. |
© 2024 by the authors. Licensee MDPI, Basel, Switzerland. This article is an open access article distributed under the terms and conditions of the Creative Commons Attribution (CC BY) license (https://creativecommons.org/licenses/by/4.0/).
Share and Cite
Wang, J.; Hong, H.; Yan, X.; Nan, J.; Lu, Q.; Gu, Y.; Qiu, L. Stability Evaluation for Main Quality Traits of Soybean in the Northeast and Huang-Huai-Hai Regions. Agronomy 2024, 14, 872. https://doi.org/10.3390/agronomy14040872
Wang J, Hong H, Yan X, Nan J, Lu Q, Gu Y, Qiu L. Stability Evaluation for Main Quality Traits of Soybean in the Northeast and Huang-Huai-Hai Regions. Agronomy. 2024; 14(4):872. https://doi.org/10.3390/agronomy14040872
Chicago/Turabian StyleWang, Jiajia, Huilong Hong, Xiaojuan Yan, Jing Nan, Qian Lu, Yongzhe Gu, and Lijuan Qiu. 2024. "Stability Evaluation for Main Quality Traits of Soybean in the Northeast and Huang-Huai-Hai Regions" Agronomy 14, no. 4: 872. https://doi.org/10.3390/agronomy14040872
APA StyleWang, J., Hong, H., Yan, X., Nan, J., Lu, Q., Gu, Y., & Qiu, L. (2024). Stability Evaluation for Main Quality Traits of Soybean in the Northeast and Huang-Huai-Hai Regions. Agronomy, 14(4), 872. https://doi.org/10.3390/agronomy14040872