Abstract
This research provides a comprehensive analysis of the spatiotemporal evolution of the regional cropping structure and its influencing factors. Using Landsat satellite images, field surveys, and yearbook data, we developed a planting structure extraction model employing the classification regression tree algorithm to obtain data on the major crop cultivation and structural characteristics of Alar reclamation from 1990 to 2023. A dynamic model and transfer matrix were used to analyze temporal changes, and a centroid migration model was used to study spatial changes in the cropping structure. Nonparametric mutation tests and through-traffic coefficient analysis were utilized to quantify the main driving factors influencing the cropping structure. During the period of 1990–2023, the cotton area in the Alar reclamation region expanded by 722.08 km2, while the jujube exhibited an initial increase followed by a decrease in the same period. The primary reasons are linked to the cost of purchase, agricultural mechanization, and crop compatibility. In the Alar reclamation area, cotton, chili, and jujube are the primary cultivated crops. Cotton is mainly grown on the southern side of the Tarim River, while chili cultivation is concentrated on the northern bank of the river. Over the years, there has been a noticeable spatial complementarity in the distribution and density of rice and cotton crops in this region. In the Alar reclamation, the main factors influencing the change in cultivated land area are cotton price, agricultural machinery gross power, and population. Consequently, implementing measures such as providing planting subsidies and other policy incentives to enhance planting income can effectively stimulate farmers’ willingness to engage in planting activities.
1. Introduction
Crop planting structure (CPS) characterizes the spatial area composition and temporal structural development of crops in the region and is an important element in studying the rationalization of the regional agricultural planting structure and the sustainable development of agriculture [1,2]. In recent decades, the frequency of global climate extremes [3], the scarcity of freshwater resources [4], and the rapid degradation of cropland [5,6] have become increasingly clear. Structural changes in food supply and demand have threatened global food security [7], and restructuring regional CPS is a first step in promoting high-quality and sustainable agricultural development. As the Food and Agriculture Organization of the United Nations reported, nearly 12% of the world’s population experienced severe food insecurity in 2020 [8]. This percentage is likely to increase in the coming decades [9]. Therefore, the research and implementation of appropriate CPS guidelines is necessary to ensure food security. Studying the rationalization of regional CPS contributes to optimizing crop yields, developing the local economy, and achieving food security [10].
Southern Xinjiang is an arid plain with high evaporation and severe weather such as dust storms and frost that occur more frequently between April and May. Water resources are extremely scarce in these areas, while groundwater levels are higher and soil salinization is more severe [11]. Alar reclamation has reclaimed much of the wasteland at the desert–oasis interface over the last half century, guided by Chinese politics, and large-scale clearing and water resource development have led to a significant increase in the cropland area [12]. Crops such as cotton, chili, pears, and jujube provide greater economic benefits [13], while wheat, rice, and maize ensure local food security. Thus, timely and accurate information about the changing characteristics of the CPS and cultivation in the Alar reclamation contributes to the development of the local economy, ensures food security, and optimizes the allocation of local cropland resources.
Analyzing the development of the CPS is one of the foundations of optimizing the industrial structure of crops [14] and realizing the modernization of China’s agriculture. Scientists mostly take administrative districts as research units and study the spatial and temporal development and pattern of crop cultivation in terms of the cultivation area, type of cultivation structure, etc. It has been that there are significant differences in regional structural types and that the cultivation structure of the main grain-growing areas is gradually diversifying [15,16,17,18]. In China, the irregular development of the CPS has become an important factor hindering national food security and regulating the structure of the agricultural industry [19], and the main contradiction in Chinese agriculture has shifted from a lack of overall production to structural contradictions [20]. This is mainly due to China’s market economy (political factors) and natural environmental disturbances (natural factors) [21]. In order to resolve the irrational status quo of the CPS, the Chinese government has adopted relevant policies nationwide to resolve this contradiction [22,23]. Therefore, the study of the development of regional CPS plays a very important role in managing the macro-control of the structure of the agricultural industry and mastering the dynamics of market conditions for agricultural products, which provides an important geographical basis for formulating such policies [24].
Surveys, statistics, and remote-sensing image interpretation are the three primary methods for obtaining CPS information [25]. Surveys on the CPS provide more accurate information, but it is not possible to obtain long time series [26], and at the same time, they do not reflect the full spatial differences and changes in the district area. Official statistics are more reliable and provide a more complete time series of data but lack diversity, personalization, and the ability to intuitively perceive regional spatial differences [27]. At present, the continuous development of remote sensing technology makes it possible to obtain high-resolution regional image data with long time series [28]. Furthermore, remote-sensing technology has the advantages of small-scale spatial crop information and cost-effectiveness [29,30]. Remote-sensing image processing and interpretation can quickly provide regional-scale spatial change data of crops with long time series [31]. Currently, remote-sensing images used to interpret the regional CPS mainly include high-spatial-resolution remote-sensing images represented by SPOT, medium-spatial-resolution remote-sensing images represented by Landsat, and low-spatial-resolution remote-sensing images represented by MODIS [32]. Although high-spatial-resolution remote-sensing images such as SPOT are extremely accurate in capturing and interpreting spatial information about crops, they have a longer recovery time because of lower temporal resolution, and the decryption process requires longer access cycles and more work [33,34]. Using medium-spatial-resolution remote-sensing images from the Landsat, the regional CPS can be identified quickly and accurately. With high resolution, the retrieval time is shorter, image acquisition is simpler and cheaper, and the image identification method of plant information is more mature, which is the best choice for obtaining the plant cultivation structure [35,36] in the Alar region. Although low-spatial-resolution remote-sensing images such as MODIS can provide greater image coverage and higher temporal resolution, the accuracy of plant detection is low, and the precision of the results is difficult to guarantee [37,38]. At present, the relevant Landsat CPS studies mainly use methods such as dynamic simulation, analysis of changes in trends, the spatial autocorrelation model, and the centroid migration model to investigate and reveal the spatial and temporal sequence [39,40] changes in the regional CPS to record distribution patterns and summarize the characteristics of the spatial and temporal development of the CPS.
Scientists have analyzed the interaction between the CPS and driving factors from various aspects. The study of the development of the CPS and interactions between the CPS and other components involves several disciplines [41,42], including geography [43], hydrology [44], economics [45], ecology [46], and climatology [47]. Scholars have conducted research primarily in geography. Scientists have focused on the interaction between the CPS and latitude, population density, and geographical location, primarily using administrative districts [48,49] as the unit of analysis. There has also been and in-depth analysis of the correlation between water resources and ecosystems based on the study of spatial patterns of the CPS. The drivers of change have also been studied, including but not limited to, societal needs, political direction, environmental development, and climate change [50,51,52,53,54]. Currently, there is a lack of research analyzing the evolution of the CPS in Xinjiang, the main cotton-growing region of China, especially in the Alar reclamation. In addition, most of these studies have focused on changes in cropland and cotton cultivation [55,56,57] in the Alar reclamation, and very few of them included a long-term analysis of changes in the CPS of several crop species. In terms of analyzing factors affecting the CPS in Xinjiang, most studies have focused on qualitative expressions [58], and there are few studies that quantify the weight of the driving factors. For these reasons, it is necessary to study the development of the CPS and the interaction between the CPS and the driving factors in the Alar reclamation.
Therefore, this study selected the Alar reclamation as an example and aimed to summarize the geographical characteristics of the spatiotemporal dynamics of the CPS and the driving factors affecting CPS changes from 1990 to 2023. Specifically, the objectives of this study are: (1) The extraction of the cultivated area and the spatial distribution in the Alar reclamation based on Landsat satellite images from 1990 to 2023; (2) analysis of the characteristics of temporal changes in the area and the distribution of crops and cropland; (3) analysis of the spatial dynamics of crop distribution; (4) studying the interaction between the CPS and drivers with regard to human and natural factors to investigate the extent to which drivers influence the CPS. The goal is to provide a scientific basis for farmland information monitoring, rational use, and formulation of crop purchase price in the Alar reclamation.
2. Materials and Methods
2.1. Study Area
The study area was the Alar reclamation (Figure 1) (80°30′–81°58′ E and 40°22′–40°57′ N), located in the southern Tianshan Mountains of Central Asia and the northern margin of the Taklimakan desert, within the upper reaches of the Tarim River. The Alar reclamation contains ten regiments (towns) and villages, with an alluvial plain with an average elevation of 1012 m and gentle slopes from northwest to southeast [59]. The region has a typical continental arid desert climate with an average annual temperature of 10.7 °C. Rainfall is low but evaporation is high. The average annual precipitation is less than 50 mm, but the annual potential evaporation exceeds 2000 mm in this area [60]. The study area is a county-level city governed by the Xinjiang Production and Construction Corps, which includes 10 regiments (towns) and townships, encompassing a total area of approximately 3900 km2. Over the past three decades, farmland has been the main land use type, cotton is the main crop, and it is the main irrigated agricultural, forestry, and pastoral area in the southern Xinjiang region, as well as an important national-level cotton production base.
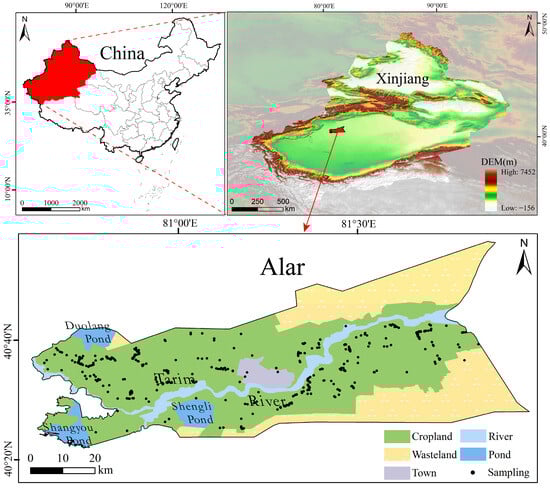
Figure 1.
Geographic sketch map of Alar.
2.2. Data Resources and Process
2.2.1. Measured Data
The measured data were collected using the internal center of the cropland in the Alar reclamation as the coordinate point, and the area with more intense plant growth was selected as the study area for the sampling points. The primary criteria for choosing ground survey points included having the same type of crop, consistent crop growth, and a single crop planting area of at least 50 m × 50 m [61]. The field surveys in the Alar reclamation comprised three separate sampling periods. During the surveys, detailed information such as crop species, growth conditions, and phenological periods was recorded. Additionally, latitude and longitude data for the sampling points were captured using a handheld mobile RTK (real-time kinematic) with a horizontal positioning accuracy of 1 cm ± 1 ppm. A total of 64, 86, and 317 sampling points were collected during the February, May, and August 2023 surveys, respectively. These points included seven common crops found in the reclamation area: cotton, chili, jujube, fruit trees (pear and apple trees), maize, wheat, and rice. The sampling points were then categorized into training and validation samples for further analysis (Table 1).

Table 1.
The distribution of samples used for training and validation.
2.2.2. Remote-Sensing Image Data
Data from multiple sources were utilized, including images from Landsat 5 TM (https://glovis.usgs.gov/, accessed on 9 January 2024) and Landsat7 ETM+ (https://engine-aiearth.aliyun.com/, accessed on 9 January 2024) from 1990, 1995, 2000, 2005, 2010, and 2015, as well as Landsat8 OLI (https://www.gscloud.cn/, accessed on 9 January 2024) from 2020, 2023. At least five images were collected each year, all with minimal cloud cover of less than 20% and no concentrated areas affecting the study. Additionally, 12.5 m resolution DEM data (https://www.gscloud.cn/, accessed on 9 January 2024) of the Alar reclamation were obtained, and this data were utilized to produce maps and correct the geometric refinements of remote-sensing images. The original remote-sensing images were then sequentially pre-processed with radiometric calibration, atmospheric correction, geometric refinement correction, and image enhancement. In cases where Landsat7 ETM+ data strips were lost after 31 May 2003, the Landsat_gapfill tool in ENVI 5.6 was used to address the gaps.
2.2.3. Statistical Data
The relationship between changes in typical crop area and cropland area in the Alar reclamation and the influence of natural and anthropogenic drivers was investigated. Data from the “Statistical Yearbook of the Xinjiang Production and Construction Corps” (1990–2021) [62] on total mechanical power, surface water diversion, irrigated area, gross domestic product (GDP), and non-farming population, as well as population data, were collected as representatives of the anthropogenic drivers. Additionally, the average annual temperature and average annual precipitation of the Alar reclamation (area number 51730) were taken from the Monthly Statement of Surface Meteorological Records. Data on underground water resources from the Statistical Yearbook of Xinjiang Production and Construction Corps (1990–2021) were gathered to represent the natural factors.
2.3. Methods
2.3.1. Crop Classification
The spectral characterization and vegetation index analysis of major features is crucial in remote sensing, as images reflect the electromagnetic wave radiation energy of the region’s features with distinct physical meanings [25]. Variations in spectral values are primarily due to changes in feature types, forming the basis for feature identification [63]. Vegetation possesses unique spectral characteristics, enabling its effective differentiation from other features [64] in remote-sensing images. In this study, a range of remote-sensing images including TM, ETM+, and OLI from sensors were utilized, spanning the period of 1990–2023. Software tools such as ENVI 5.6 and ArcGIS 10.2 were employed for crop classification. The initial step involved geometric correction of the remote-sensing images, utilizing DEM with a 12.5 m resolution in the Alar reclamation. Subsequently, radiometric calibration, atmospheric correction using the FLAASH module [65,66], as well as geometric alignment and image enhancement were performed. Alar remote-sensing images based on the 2023 imagery and the Alar Statistical Yearbook were used for analysis, and 2023 marks the peak year for cropland in the study period. Cropping masks based on the 2023 remote-sensing images and Alar Cropland Vector Data were applied to the images. Utilizing the S-G filtering technique, Landsat OLI time-series remote-sensing data were smoothed, and NDVI data from March to September 2023 were utilized to establish the time-series curves of major crops. The average NDVI value of each sample point represented its NDVI value, from which the classification and regression tree (CART) [67,68] was applied to construct the crop acreage extraction model in the Alar reclamation.
The classification and regression tree (CART) is a type of decision tree algorithm [69] that automatically explores all input features, selecting only the most suitable ones to separate the training data in order to construct the model [70]. This enables the algorithm to efficiently process and compute large amounts of data and extract the feature set. The algorithm consists of nodes and sliced leaves, which are used to determine the best combination of features for the model by selecting appropriate feature parameters and thresholds and recursively dividing the training data set into two groups [69]. The purpose of this approach is to minimize impurities in the data by finding nodes that divide the data set into two groups. Currently, the classification regression tree algorithm realizes the deviation D of node t through Equation (1) [71]:
where ntc represents the number of elements of class c in node t, and πc|t is the conditional likelihood that an element of class c occurs in node t. In case of using the maximum likelihood estimate, πc|t can be estimated by dividing the number of samples of class c in node t by the total elements of the node:
In the Alar reclamation, a crop identification model for the CPS was established for seven crops: cotton, chili, rice, maize, fruit, jujube, and wheat. The model was developed based on the combination of the time-series characteristics of crops, farming information, and fieldwork sampling points. The mentioned crops were chosen based on their time-series characteristics, tillage information, and fieldwork sampling points. The model was established using NDVI multi-featured variable data and the CART decision tree algorithm. Figure 2 displays the simplified CART decision tree model covering the period from March to September in 2023. This approach allowed for the reasonable selection of crop feature sequences based on their time-series characteristics, enabling the accurate differentiation of target crops from others within the region. The verification results for the accuracy of the classifications are presented in Table 2.
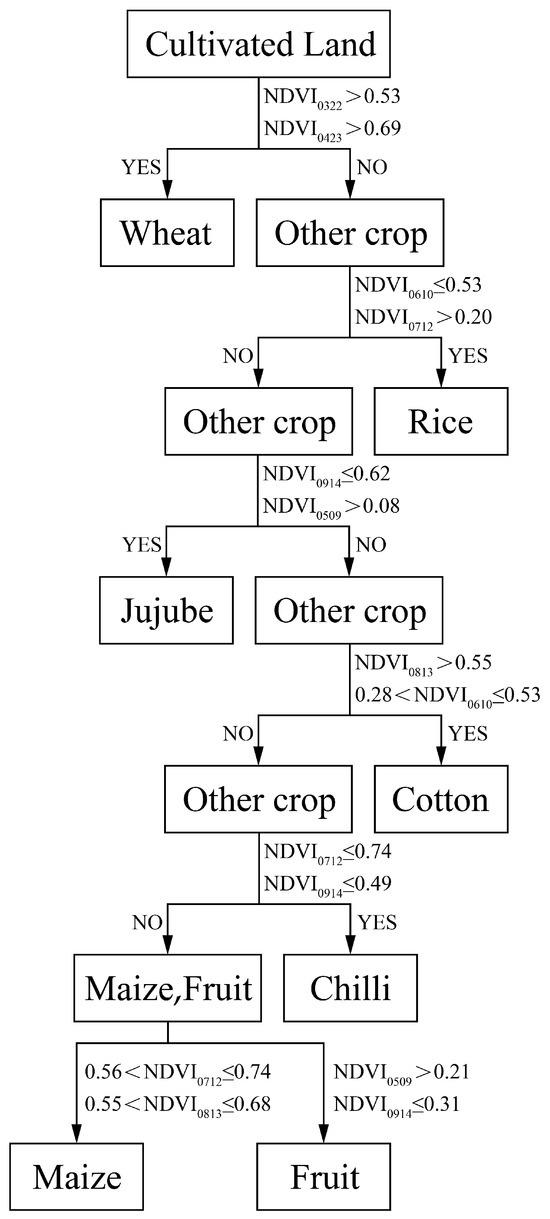
Figure 2.
Crop classification decision tree.
Table 2.
Accuracies of CART-based classification.
The information and results of the CPS change distribution in the Alar reclamation from 1990 to 2023 were obtained using the CART decision tree algorithm. Subsequently, the crop classification results of the model were validated against the validation point data. The validation process generated four metrics, namely the producer accuracy (PA), the user accuracy (UA), the overall accuracy (OA), and the Kappa coefficients. The validation results indicated that the producer accuracy (PA) accuracy of cotton, chili pepper, rice, maize, fruit, jujube, and winter wheat was 97.79%, 96.56%, 95.44%, 93.17%, 96.13%, 92.65%, and 95.81%, respectively. Furthermore, the overall validation accuracy was determined to be 95.75%, with a Kappa coefficient of 0.94. In conclusion, the overall accuracy of the model met the stipulated requirements for the extraction of the CPS [72].
2.3.2. Temporal Dynamics of Crops
This section revealed the area dynamics trend [73] of crop acreage changes in the Alar reclamation through the dynamic degree model. The 30 m × 30 m gridded land use data and its dynamic data inputs were used to ensure spatial and area accuracy for the dynamic areas of the CPS, eliminating the scale effect of spatial data [74]. The land use and land conversion in the Alar reclamation were analyzed by dividing it into a vector network of 30 m cells. This analysis involved the calculation of land use in each raster. To investigate the change characteristics of crop area, a land use dynamic model was employed. This model facilitated the quantification of the crop area’s rate of change, referred to as the average annual growth rate. The calculation for the average annual growth rate is represented by Equation (3):
where K is the dynamic degree of the crop area during the study period, Ua and Ub represent the crop area at the beginning and end of the study, respectively, and T is the time interval of the study.
2.3.3. Spatial Dynamics of Crops
In this study, the centroid migration model [75] was introduced to analyze the spatial aggregation and spatial dynamics of the CPS. The model aims to capture the inter-annual spatial change trend of the elements. Specifically, this research focuses on examining the centroid and centroid migration trajectories of discrete vector data representing different crop types, which are independently distributed in space under varying weights. The simulation method of centroid migration [76] was employed to illustrate the change in CPS in the Alar reclamation from 1990 to 2023. The calculation of the centroid is a crucial aspect of this analysis:
where xj and yj are the geographic coordinates of centroid P (xj,yj) of the crop in year j. xj is the longitude of centroid P in year j, yj is the latitude of centroid P in year j, and Qij is the weight for calculating the centroid. xk+m and xk denote the latitudinal position of centroid P in year k+m and year k, respectively. Combining the position and movement distance of centroid P yields the trajectory of centroid migration of the crop CPS between the years.
2.3.4. Driver Analysis
The outlined study aims to investigate the reciprocal influence driving relationship between anthropogenic factors (including GDP, primary industry (PI), agricultural machinery gross power (AMGP), population (Pop), non-farm population (NFP), surface water resources (SWR), groundwater resources (GR), irrigation area (IA), and cotton price (CP)) and natural factors (temperature (Tem) and precipitation (Pre)) on the cropland and the area of various crops in the Alar reclamation. To achieve this, the Mann–Kendall (M-K) [77,78] nonparametric mutation test was employed. The M-K offers the advantage of objectivity by not being influenced by individual outliers and reflecting the mutation of driving factors [79] on the area change over the time series. In this analysis, the intersection of UFk and UBk curves between the critical lines signifies the commencement of mutation, with a significance level of α = 0.05 set for this study. Furthermore, the correlation between natural and anthropogenic drivers on the area of cropland and crops in the Alar reclamation was assessed through a heatmap visualization using Origin 2022.
Path analysis, originally proposed by Sewall Wright [80], aims to deconstruct the correlation coefficient into direct and indirect effects, thereby highlighting the relative significance of each factor in shaping the outcome [81]. The fundamental concept of path analysis is differentiating the direct and indirect impacts of the independent variable on the dependent variable through the computation of the through-path coefficient while mitigating the influence of the unit of measure and the degree of variation of the independent variable. By employing pass-through analysis, particularly in situations where multiple independent variables impact the dependent variable within the sample and the likelihood of covariance is heightened, it becomes feasible to eliminate the covariance between highly correlated independent variables. This process allows for the elucidation of interactions between distinct independent variables and their direct and indirect effects on the dependent variable. Moreover, it facilitates the determination of the magnitude of influence exerted by each independent variable on the resulting outcomes through the decision coefficient.
The regression Equation (6) the linear relationship between a dependent variable y and n independent variables xi = (i = 1, 2, 3, …, n) in the interrelated system.
By using the least-squares method to substitute the actual observations into Equation (6), the through-traffic coefficient Pyxi can be obtained. Matrix equations can be established using mathematical transformations in Equation (7):
The throughput coefficient pyxi can be determined by solving Equation (7), where rxiy represents the simple correlation coefficient of xi and yi, and rxiyi represents the simple correlation coefficient of xi and y.
where bi is the y-biased regression coefficient on xi; σxi, σy are the standard deviations of x and y, respectively, and pyxi is the xi direct pass-through coefficient on y. In this study, multiple regression analysis of SPSS 12.0 was used for the path analysis of natural and anthropogenic drivers in the Alar reclamation, and eight main drivers were screened out to analyze the magnitude of the influence of the main drivers on the changes of crops and cropland by comparing the absolute value of direct path analysis coefficients.
3. Results
3.1. NDVI Time Series Analysis and Accuracy Verification
The NDVI data from March to September 2023 were used as the data source, and the average NDVI value of each type of sample point was taken as its representative NDVI value to establish the time series curve of the main crops as shown in the figure (Figure 3). Winter wheat grows vigorously from March to April in the Alar reclamation area, and the NDVI values are much higher than those of other crops, which is the best time to separate winter wheat from other crops. Rice irrigation started from late April to late May, and the irrigation of paddy fields had basically ended on June 10, at which time the NDVI value of paddy fields was much smaller than that of other crops, and it was the best period to separate rice from other crops. Corn crops in the Alar reclamation area entered the filling period from late July to early August, when the NDVI value was much higher than that of the other crops, and it was an important period to categorize corn and other crops. Cotton crop ushers in the first balling stage in August, which is the most intense period of cotton reproduction, growth, and development, and its plant growth is excellent for reaching the highest peak, so it is also the main period for distinguishing cotton from other crops.
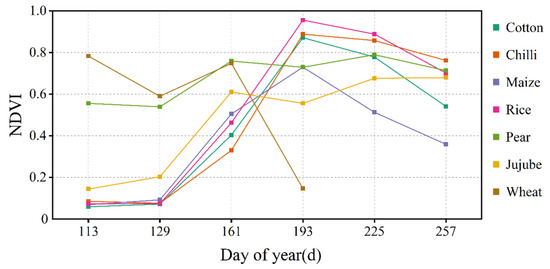
Figure 3.
NDVI time series curves of the major crops.
The CART was used to collect information and results on CPS changes in the Alar reclamation from 1990 to 2023, and the extracted data were mapped using ArcMap 10.2 to show the spatial distribution of different crops in the study area (Figure 4).
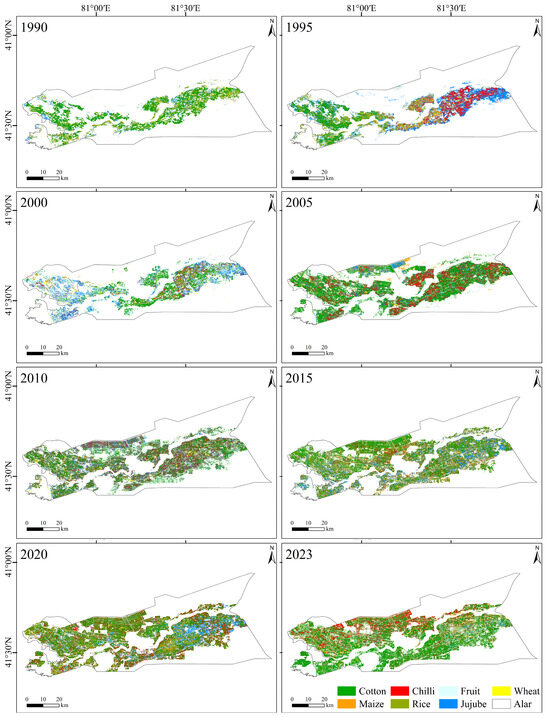
Figure 4.
The change of land types in Alar from 1990 to 2023.
3.2. Analysis of Spatial and Temporal Changes in CPS
3.2.1. Characteristics of Spatial Changes in CPS
In general, the distribution range and aggregation characteristics of the CPS in the Alar reclamation are significantly different during 1990–2023. As shown in Figure 4, cotton had the highest proportion of planting, the highest distribution range, and the widest range, with significant aggregation characteristics.
In 1990, cotton was the primary economic crop in the Alar reclamation with a large planting area. The majority of cotton was concentrated in the south along the Tarim River basin, and a small amount was distributed in the northwestern part of the Alar reclamation. By 1995, there was a shift in crop patterns in the eastern sector of the Alar reclamation, where chili and jujube trees replaced cotton. Cotton became more concentrated in the northern bank of the Tarim River in the western region. By 2000, the land was undergoing forced crop rotation due to the accumulation of salt from cotton farming. Fruit trees and rice became the predominant crop types in the western Alar reclamation, with cotton fields being increasingly intermixed with chili and jujube trees. The year 2005 marked the gradual formation of vast, contiguous cotton fields expanding from the east to the northwest of the region. In the central Alar reclamation, chili became concentrated and accounted for a significant portion of agricultural activity. Moving forward to 2010, patches of cotton fields in the west of the Alar reclamation were lost, some of which were converted to rice and other grain crops. Cotton fields in the north were replaced by capsicum and fruit trees, while there was a slight expansion of cotton fields in the west. By 2015, a well-defined pattern of sparse cotton fields in the east and west emerged in the Alar reclamation. The scale of cotton in the central Alar area decreased rapidly due to urbanization, which continued to encroach on cultivated land. In 2020, the transformation of some fruit trees and chili into cotton fields was observed in the western and northern parts of the region. Cotton fields appeared sporadically on the northern bank of the Tahe River in the east, gradually taking shape. In the southeast, cotton fields began to extend into the Taklimakan Desert. In the central area, cotton fields reached saturation, while in the eastern sector, they transitioned into jujube and chili fields. The growth of urban areas led to further reduction of cultivated land in the eastern and central regions. By 2023, cotton was predominantly situated on the southern bank of the Tarim River, while the CPS on the northern bank of the Tahe River shifted towards a more diversified pattern: cotton–chili–grain crops.
During 1990–2023, the CPS of the Alar reclamation was predominantly focused on cotton. Initially, the planting area of cotton expanded on both sides of the Tarim River. By around 1995, a shift occurred in the eastern part of the Alar reclamation, where cotton fields were replaced with chili, jujube trees, and grain crops. Subsequently, around 2000, a similar transformation took place in the western part of the region as cotton fields gave way to fruit trees. However, after 2005, there was a notable acceleration in the expansion of cotton areas. Throughout the period of 2010–2023, the proportion of cotton remained relatively stable, indicating a dynamic balance in production. The spatial distribution of crops in the Alar reclamation is intricately linked to various factors such as local natural resources, climatic conditions, regional agricultural population, and fluctuations in agricultural product prices.
3.2.2. Spatial and Temporal Evolution of the Centroid of the CPS
In this study, the dynamic spatial trends of cotton, chili, rice, grain crops (winter wheat and maize), jujube trees, and fruit crops (pear and apple trees) within the irrigation area of the First Agricultural Division of Alar from 1990 to 2023 were examined. The centroid migration model was utilized to analyze the migration patterns of these crops (Figure 5) and ascertain the migration directions and distances in different time periods (Table 3). Through this approach, the study delved into the spatial and temporal dynamics of fruit trees and cotton, chili, and grain crops in the Alar reclamation.
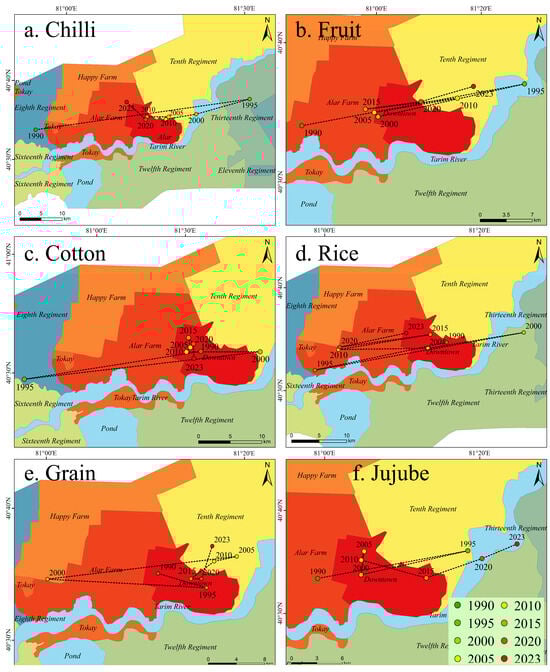
Figure 5.
Crop centroid migration map: (a) chili, (b) fruit, (c) cotton, (d) rice, (e) grain, (f) jujube.
Table 3.
Direction and distance of crop migration.
The centroid of cotton in the Alar reclamation underwent distinct changes over time. Prior to 2000, there was considerable migration, with an average distance of 6.57 km/a. However, after 2000, the centroid largely stabilized within the Alar City reclamation, with an average annual distance of 0.78 km/a. Notably, from 1990 to 1995, the centroid shifted southwest by 28.21 km, coinciding with a significant decrease in the cotton area in the eastern part of the Alar reclamation by 1995. Subsequently, between 1995 and 2000, the centroid shifted northeast by 37.51 km, indicating a decrease in the western planting area and an increase in the east in 2000. In the years 2005–2023, the change in the centroid of cotton in the Alar reclamation was marginal, suggesting a trend towards stabilization in the distribution of cotton planting areas after 2005.
From 1990 to 1995, the centroid of the chili area in the Alar reclamation shifted rapidly to the east, covering an average distance of 10.24 km/a. Remarkably, during this period, the centroid moved 51.2 km to the northeast. Subsequently, between 1995 and 2023, the migration of the center decelerated, heading west at an average rate of 1.19 km/a. The findings revealed a dynamic agricultural landscape, characterized by a significant decrease in chili in the western regions of the Alar reclamation and a corresponding growth in the eastern areas. Between 1995 and 2020, the overall migration trajectory veered towards the southwest at an average rate of 1.09 km/a, eventually converging towards the downtown region of Alar. This period signified a trend towards an equilibrium in the distribution of chili planting areas within the reclamation. However, in the subsequent span from 2020 to 2023, the center of the chili planting area began moving northwest, covering a distance of 6.11 km. This shift was primarily driven by a substantial expansion in pepper cultivation within the Happy Farm area of the Alar reclamation.
The change in the centroid of the rice planting area in the Alar reclamation is marked by a consistent migration direction and substantial migration distance. From 1990 to 2023, the average migration distance of the rice centroid was recorded at 4.32 km per year. This figure significantly surpassed the migration distances seen in the cases of cotton, chili, and other crops. The main reason is that the purpose of rice in the Alar Nongyi Division area is for the salt suppression of the cotton, and the distribution of high salinity in cotton fields in different years affects the distribution of the rice area. During 1990–2000, the centroid of the rice area in the Alar reclamation had a larger migration distance, firstly migrating to the southwest and then to the northeast, with an average migration distance of 6.29 km/a. During the period of 2000–2023, the centroid of the rice area in the Alar reclamation had a larger migration distance, firstly migrating to the southwest and then to the northeast, with an average migration distance of 6.29 km/a. In the period of 2000–2023, the centroid migration of the rice-planted area decreased significantly, but it was still higher than that of cotton and chili, with an average migration distance of 3.47 km/a during this period.
The planting area of grain crops in the Alar reclamation experienced a notable shift in its centroid, with a distinct trend towards the northeast. The average migration rate of this center was 2.14 km/a. This movement can be delineated into two main periods. From 1990 to 2005, the centroid exhibited a more rapid migration rate, peaking at 3.79 km/a. Subsequently, in the period spanning from 2005 to 2023, the rate of migration slowed down significantly, indicating a stabilization in the planting area of grain crops. Specifically, during this latter period, the migration rate decreased to 0.92 km/a, reflecting a relative stasis in the movement of the centroid.
The centroid of the planted area of fruit trees and jujube in the Alar reclamation mi-grated to the northeast during 1990–2023, with an average migration rate of 2.54 km/a. The migration distance was more significant during the period of 1990–1995, which amounted to 30.4 km, and the direction of migration was to the northeast. During the period of 2015–2023, fruit trees and jujube in the Alar reclamation continuously migrated to the east with a migration rate of 1.86 km/a.
In general, cotton, pepper and fruit crops migrated overall to the eastern part of the Alar reclamation before 2000 and gradually spread evenly across the Alar reclamation after 2000. During 1990–2000, the migration route of the rice centroid in the Alar reclamation displayed a notable shift, predominantly moving towards the east. This shift can be attributed to specific factors such as the rapid expansion of cultivated land [82], particularly with the conversion of significant portions of wasteland in the eastern regions into cultivated land. The cultivation of crops such as cotton, chili, and fruit trees has been extensively practiced in the Alar reclamation, with a considerable portion of newly cultivated land dedicated to these crops. In practice, rice plays a crucial role in balancing soil salinity in areas where cotton prevails. Over time, the accumulation of salinity due to continuous cotton necessitates the introduction of rice to restore soil health. Consequently, the migration of the rice centroid in the Alar City reclamation aligns with the rotation areas designated for cotton, showcasing a cyclical pattern aimed at maintaining soil fertility and sustainability.
3.2.3. Characterization of Temporal Changes in CPS
Changes in the cultivated area of different crops in the Alar reclamation during 1990–2023 are shown in Figure 6. During the period of 33a, the cultivated area in the Alar reclamation was increasing, and the usable wasteland area was gradually reclaimed as cultivated land. The results show that the cultivated area in the Alar reclamation has grown from 747.78 km2 in 1990 to 1750.44 km2 in 2023, with an average annual growth rate of 30.38 km2/a. According to the growth rate change of the cultivated area, the changes of the cultivated area in the Alar reclamation are divided into two stages: the first stage is the rapid growth period from 1990 to 2005, when the cultivated area grew from 747.78 km2 to 1535.79 km2 with an average growth rate of 52.53 km2/a. During this period, the cultivated land area in the Alar reclamation expanded rapidly, and the wasteland was transformed into usable cultivated land over a large area with an influx of a working population. The second stage is the stabilization period from 2005 to 2023, where the cultivated land area changed from 1539.79 km2 in 2005 to 1750.44 km2 in 2023, with an average growth rate of 11.70 km2/a. During this period, most of the available wasteland in the Alar reclamation was developed into cultivated land in the earlier years. At the same time, the change of related direction motivated pioneering movement and the growth of cultivated land area slowed down.
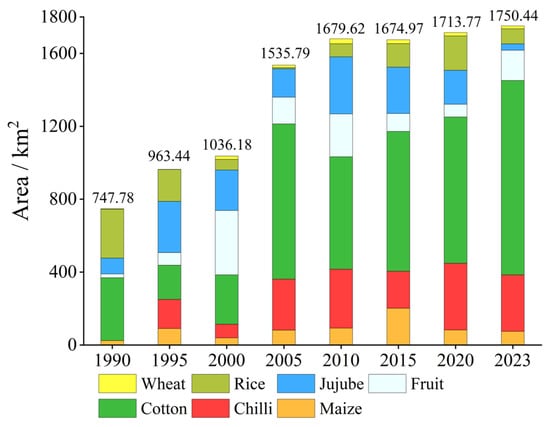
Figure 6.
The area of each land type in the Alar reclamation area from 1990 to 2023.
In terms of the characteristics of the time change of the planting structure of individual crops. Cotton in the Alar reclamation increased from 344.24 km2 in 1990 to 851.47 km2 in 2005, with an average annual growth of 33.82 km2/a. The proportion of cotton planting changed from 46.04% to 55.44%. The main reason is that cotton is the main crop grown in the Alar reclamation. During the same period, the wasteland was reclaimed as cultivated land in a large area during this period, which is the main reason for the rapid growth of the cotton planting area. In the period of 2005–2023, the cotton planting area increased from 851.47 km2 to 1066.32 km2, and planting proportion from 55.44% to 60.92%. The growth rate of cotton slowed down in this time period, mainly due to the slowdown in the growth rate of cultivated land area. The cotton planting area and the proportion of planting then had a small increase.
The average annual growth rates of maize, chili, cotton, rice, wheat, fruit trees (apple and pear trees), grain crops (maize + wheat), and wasteland area in the Alar reclamation for the period 1990–2023 are shown in Figure 7. The rate of change in the area of major crops in different periods was different. The most significant change was for rice, mainly because rice in the Alar reclamation is grown for the purpose of salt pressure on the cotton plantation. The demand for different areas of salt pressure in each period of time made the rice plantation area change more drastically. The Alar reclamation’s cotton plantation salt pressure behavior is concentrated in one year, and the rest of the year does not require salt pressure to continue growing cotton. In the case of cotton in the Alar reclamation, the highest growth rate was recorded in the period of 2000–2005. The average annual growth rate of the cultivated area was also significantly higher in the same period.
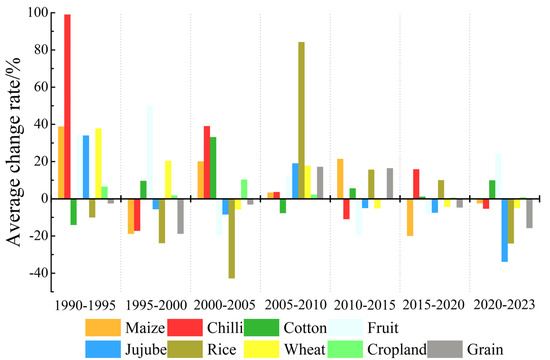
Figure 7.
The average change rate of each land area in the Alar reclamation area from 1990 to 2023.
3.3. Analysis of Factors Driving CPS
3.3.1. Drivers Analysis
This study analyzed the correlation between each driver and the area of cultivated land, cotton, chili, rice, and grain, and calculated the interrelationships within each driver. The purpose was to explore the main drivers, the path of action, and the intensity of action of the dependent variable area change. The data were analyzed after dimensionless standardization, and a correlation coefficient matrix was calculated for artificial driving factors, natural driving factors, and dependent variables. A heat map (Figure 8) was then created to visualize the relationships. The correlation increased as the number of the two factors increased.
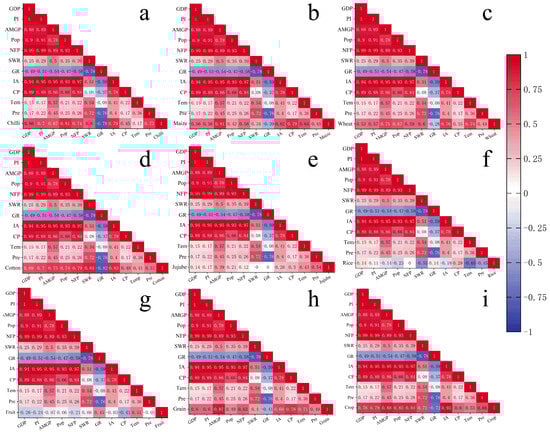
Figure 8.
Variable correlation heat maps of the driving force of farmland change: (a) chili, (b) maize, (c) wheat, (d) cotton, (e) jujube, (f) rice, (g) fruit, (h) grain, (i) crop.
The climatic conditions in the Alar reclamation determine the natural endowment of cultivated land and crop cultivation [83] and provide suitable conditions for crop growth and development. It was found that the correlation coefficients between temperature and precipitation and cropland in the Alar reclamation were 0.53 and 0.66, respectively, indicating that temperature and precipitation had a certain correlation with cropland in Alar. The effect of precipitation on cropland was greater than that of temperature. In terms of significance, the correlation of temperature on grain crop reached 0.71, the correlation of precipitation on chili area reached 0.73, and the correlation of temperature on rice area reached −0.65. The correlations of temperature and precipitation on cotton crop area were 0.41 and 0.51 and not significant, mainly due to the fact that the cultivated land area of cotton in the Alar reclamation is affected by the current year’s crop price. The cotton cultivation area in the Alar reclamation was significantly affected by this year’s cotton price and population.
Gross national product (GNP) responds to the level of economic development of the reclamation, and population size responds to the number of laborers and the consumer market in the region. By analyzing the correlation between the anthropogenic drivers and the dependent variables and investigating the drivers and strengths of the economy, the labor force, and irrigation strategy on cultivated land and crop area, it was found that the human-driven factors had a certain correlation with the cultivated area. The correlation between irrigated area and cultivated area was the highest, with a correlation coefficient of 0.93. The correlation between the total mechanical power and cultivated land area was the second, with a correlation coefficient of 0.88. The correlation coefficient between population and cultivated area was 0.85, which was a high correlation. This shows that the degree of agricultural mechanization in Alar is high. The reclamation economy is dominated by agricultural production. The resident population of the reclamation also uses agricultural production as the main source of livelihood.
In the Alar reclamation, the correlation between crop type and human driving factors demonstrated notable patterns. Specifically, the high correlation coefficient of 0.87 between agricultural machinery gross power and the planting area of grain crops indicated a substantial level of agricultural machinery gross power in grain crop production. Moreover, the correlation of 0.81 between cultivated land area and population suggested significant human involvement in the cultivation of chili. This was supported by the observation that as the labor force in the Alar reclamation increased, so did the production of chili. Additionally, the correlation coefficient of 0.84 between cotton planting area and surface water resources highlighted a strong relationship, indicating that cotton in the Alar primarily relies on surface water for irrigation.
3.3.2. Path Analysis of Drivers
After conducting the correlation analysis of the M-T nonparametric mutation test, six anthropogenic drivers were noted, namely GDP, agricultural machinery gross power, population, surface water resources, groundwater resources, and cotton price. Two natural drivers, namely temperature and precipitation, were identified as the main drivers affecting the changes of crops and cropland area through multivariate regression analysis. A table of the direct coefficients between the main drivers and the cultivated land of cotton, chili, rice, fruit trees, jujubes, wheat, maize, grain crops (maize and wheat), and cultivated land was obtained by means of the through-transfer coefficients analysis and absolutes value of the path drivers (Table 4). The higher the relative significance of each factor, the greater the path coefficient of the driving factor [84].
Table 4.
The path coefficient of driving factors of cultivated land area.
By comparing the absolute value of the direct pathway coefficient, the main driving factors affecting the cotton planting area in the Alar reclamation were CP (1.236) > SWR (1.080) > GR (1.013). Among these, cotton production (CP) had the most significant influence on the incentive for farmers to plant cotton in the region. CP not only affected the planting area but also regulated the use of sustainable water resources (SWR) and groundwater resources (GR) through unified scheduling and distribution. This interaction between population factors, resource allocation, and price control highlights the complex dynamics that shape agricultural practices in the Alar reclamation.
The area for chili cultivation was mainly driven by population (0.80), the amount of GR (0.76), and AMGP (0.71). Among these factors, population had the most significant positive effect on the cultivation of chili. Natural factors had a predominant role in date palm cultivation, as indicated by the main driving factors Pre (1.44) and Tem (0.76), while the rest of the influencing factors were lower than 0.4. In contrast, for rice cultivation, the primary driving factors were SWR (1.128), GR (1.072), and Tem (0.623). Meanwhile, fruit trees were mainly influenced by the amount of GR (1.60), GDP (0.80), and AMGP (0.78). The importance of natural factors in crop cultivation is underscored by the significant role of water resources, especially in the irrigated agriculture predominant in the Alar reclamation area. This demonstrates the varying influences of different factors on crop cultivation, with natural elements playing a critical role across different types of crops in the agricultural context.
By comparing the table of direct path coefficients, we found that the main driving factor affecting the change of cultivated area was CP (0.822) > AMGP (0.681) > Pop (0.603). These three factors are all human-driven factors, which indicates that human-driven factors were the main ones affecting the change of cultivated area in the Alar reclamation, among which the price of cotton had the greatest influence on the cultivated area, mainly because in Xinjiang, 50% of the population engaged in cotton, and cotton industry revenue accounted for one-third of the farmers’ income [85]. The cotton planting area in the region accounted for 60% of the cultivated area, and the price of cotton also became the main factor dominating the cultivated area in the Alar reclamation. The growth of cultivated area in Alar also led to the growth of regional machinery power and population. Xinjiang agricultural mechanization was leading in the whole country, while machine tillage, machine seeding, and machine harvest levels were just 92nd [86]. Cotton planting was the main business with more labor costs, with a lot of regular farm work in the year and most of the time spent in cotton planting [86]. The main economic income of the Alar reclamation is agriculture, and the main planting structure is cotton planting structure. The increase of cultivated area impacted the growth of regional machinery power and population.
The main driving factors affecting the change in cultivated land area in the Alar region were investigated by comparing the direct path coefficient table. The high influence of cotton price could be attributed to the significant proportion of land dedicated to cotton cultivation, which constituted 60% of the total cultivated land in the area. The expansion of cultivated land in Alar not only facilitated agricultural mechanization but also acted as a pull factor for migrants looking to settle in the region, considering that agriculture is the main economic driver in the region. These factors are all human-driven, underscoring the predominant role of human-related factors in driving changes in the CPS. The rise in cultivated land area correlated with an increase in total agricultural output value, underpinning the continuous expansion of cultivated land over the past 33 years in Alar.
4. Discussion
During the study period, the Alar reclamation, a typical irrigated agricultural area, encountered serious land salinization in some areas, rendering the overall cultivated land unsuitable for general crop growth. Despite these challenges, the dominant crop planted in the area was cotton, with its planting area showing a year-on-year increase. This shift towards cotton cultivation was closely aligned with the specific requirements for successful cotton planting, the growing emphasis on mechanization in agriculture, and the favorable economic returns associated with cotton cultivation. The evolution of the CPS in the Alar reclamation area was significantly influenced by various factors such as the natural environment, economic considerations, and societal needs [87,88,89].
CPS changes in the Alar reclamation are influenced by several key factors, namely crop price, agricultural machinery gross power, and population. The increased prevalence of cotton can be attributed to factors such as the high planting efficiency of cotton, the widespread adoption of mechanization techniques, and the rising availability of labor force in the region [90,91,92]. Notably, cotton and jujube are the predominant crops cultivated in this area. Since 2005, the price of cotton has exhibited a consistent upward trend, leading to an increased willingness among farmers to cultivate this crop. As a result, the proportion of cotton area in the reclamation now exceeds 50% of the total cultivated area. In contrast, jujube area, which accounted for 20–40% of the total cultivated area from 2005 to 2020, has shown a fluctuating trend over time, with peak cultivation in 2010 at 40%. However, due to oversupply in the jujube market after 2013, prices plummeted, prompting a shift in cultivation towards cotton, chili, and wheat in some areas. According to this study, crop price emerges as the primary determinant influencing CPS changes in the Alar reclamation. This perspective is consistent with Angus’ findings [93], who also identified crop price as the principal driver of CPS changes in a region. In contrast, Lee’s study suggested that climate acts as the primary factor shaping CPS changes [94], highlighting differing conclusions. This disparity can be attributed to the distinct climate conditions between the Alar reclamation, situated in the inland northwest, and the regions analyzed by Lee.
Since 2005, the population of the Alar reclamation has seen a sharp increase, leading to a significant expansion of cultivated land in the region. This expansion is largely due to the transformation of wasteland into cultivated land in the northern areas of the Alar reclamation on an annual basis. The influx of a local migrant agricultural population has played a crucial role in this process, as discussed in Zhang’s thesis [95]. The Alar reclamation area is characterized by a typical inland extreme arid climate, marked by scarce precipitation and high evaporation rates. The rapid increase in cultivated land has further strained the already limited water resources in the region. Additionally, advancements in agricultural mechanization have been notable since 2005. The implementation of cotton drip irrigation under membrane water-fertilizer integration technology on a large scale has revolutionized local farming practices. This technology enables seamless operations such as planting, pipe laying, mulch film application, and mechanized harvesting for cotton. Consequently, the scale of cotton in the area has continued to grow steadily.
Since the first division resident moved to Alar in 2012, the city scale of Alar and the population have grown rapidly. The population engaged in agriculture accounts for a relatively large proportion of the total population. The rapid population growth spurred the reclamation of wasteland in the designated area, leading to a rapid expansion of cultivated land. Analyzing the spatial change trend of the CPS in the Alar reclamation (Figure 4) revealed that between 2000 and 2010, the wasteland on the northern bank of the Tarim River underwent extensive reclamation. This resulted in a rapid expansion of the cultivated land, aligning with the trend of population growth.
This study explored how artificial and natural driving factors impacted the CPS in the Alar Sea region, considering both temporal and spatial dimensions. It acknowledges that the current analysis is limited by constraints in data collection and precision, preventing a more comprehensive examination of the CPS in Alar reclamation. In future studies, the authors intend to undertake a more detailed and extensive analysis of the spatial and temporal characteristics of the CPS, along with the driving factors influencing it. This recognition underscores that the spatial and temporal evolution of the CPS is not only influenced by artificial driving factors but also plays a crucial role in determining the crop planting area. The ultimate objective of the research is to provide comprehensive optimization recommendations for crop cultivation in the Alar reclamation area.
5. Conclusions
This research extracted the dynamic spatial and temporal distribution characteristics of the CPS in the Alar reclamation based on remote-sensing image data from 1990 to 2023, supplemented by field survey data and yearbook statistics. Furthermore, the research analyzed the driving factors affecting the CPS, and the main findings are as follows:
(1) Temporal characterization: From 1990 to 2023, the Alar reclamation for cotton has significantly expanded, with the planting area growing by 722.08 km2. This increase can be attributed to various factors, including the rising selling price of cotton, rapid advancements in mechanization techniques, and the suitability of the saline soil for cultivating cotton on newly cultivated lands. In contrast, the cultivation of jujube has shown a fluctuating pattern of growth followed by decline. The primary determinant affecting the planting area of jujube is the market purchase price of jujube, indicating a strong correlation between market conditions and agricultural trends.
(2) Spatial characteristics: The primary crops in the Alar reclamation include cotton, chili, and jujube. Cotton held the largest share, surpassing 50% after2005. Cotton is predominantly located on the southern side of the Tarim River. Chili is primarily located on the northern bank of the Tarim River. The spatial distribution and density of rice and cotton have shown a clear pattern of spatial complementarity over different years.
(3) Driver characteristics: An examination of the CPS in the Alar reclamation from 1990 to 2023 through path analysis indicated that the primary factors driving changes in the area’s CPS are artificial factors. The dominant influencing artificial factors are crop price, agricultural machinery gross power, and population, with coefficients of 0.822, 0.681, and 0.603, respectively.
Author Contributions
Conceptualization, S.J. and J.Y.; methodology, S.J. and J.Y.; validation, S.J. and J.Y.; investigation, S.J., J.Y., S.L. and G.Y.; writing—original draft preparation, S.J. and J.Y.; writing—review and editing, S.J., J.Y., S.L., G.W., J.W., N.S. and J.L. All authors have read and agreed to the published version of the manuscript.
Funding
This research was funded by the National Key R&D Program of China (no. 2022YFD1900502).
Data Availability Statement
The links to the foundational data required for this study can be found within the article. In addition, the data presented in this study are available on request from the corresponding author.
Acknowledgments
The authors sincerely thank the anonymous editors and reviewers for their valuable comments and suggestions that helped improve the quality of this manuscript.
Conflicts of Interest
The authors declare no conflicts of interest.
References
- Jules, P.; Benton, T.G.; Pervez, B.Z.; Dick, L.V.; Flora, C.; Godfray, H.C.J.; Goulson, D.; Hartley, S.; Lanmpkin, N.; Morris, C.; et al. Global assessment of agricultural system redesign for sustainable intensification. Nat. Sustain. 2018, 1, 441–446. [Google Scholar] [CrossRef]
- Simelton, E. Food self-sufficiency and natural hazards in China. Food Secur. 2011, 3, 35–52. [Google Scholar] [CrossRef]
- Liu, J.; Si, Z.; Li, S.; Hamani, A.K.M.; Zhang, Y.; Wu, L.; Gao, Y.; Duan, A. Variations in water sources used by winter wheat across distinct rainfall years in the North China Plain. J. Hydrol. 2023, 618, 129186. [Google Scholar] [CrossRef]
- Liu, W.B.; Sun, F.B. Increased adversely- affected population from water shortage below normal conditions in China with anthropogenic warming. Sci. Bull. 2019, 64, 567–569. [Google Scholar] [CrossRef] [PubMed]
- Wu, J.; Zhang, Q.; Li, A.; Liang, C. Historical landscape dynamics of Inner Mongolia: Patterns, drivers, and impacts. Landsc. Ecol. 2015, 30, 1579–1598. [Google Scholar] [CrossRef]
- Barrio, G.D.; Gao, Z.H.; Martínez- Valderrama, J.; Li, X.S.; Sanjuan, M.E.; Sun, B.; Ruiz, A.; Wang, B.; Juan, P. Comparing land degradation and regeneration trends in China drylands. J. Geod. Geoinf. Sci. 2020, 3, 89–97. [Google Scholar] [CrossRef]
- Wiseman, S.A.; Dötsch-Klerk, M.; Neufingerl, N.; Martins, F.O. Future food: Sustainable diets for healthy people and a healthy planet. Int. J. Nutrology 2019, 12, 23–28. [Google Scholar] [CrossRef]
- Davis, B.; Lipper, L.; Winters, P. Do not transform food systems on the backs of the rural poor. Food Secur. 2022, 14, 729–740. [Google Scholar] [CrossRef]
- Noort, M.W.J.; Renzetti, S.; Linderhof, V.; Rand, G.E.; Pienaar, N.J.M.M.; Kock, H.L.; Magano, N.; Taylor, J.R.N. Towards sustainable shifts to healthy diets and food security in sub-saharan Africa with climate-resilient crops in bread-type products: A food system analysis. Foods 2022, 11, 135. [Google Scholar] [CrossRef]
- Liu, Z.; Yang, P.; Wu, W.; You, L.Z. Spatiotemporal changes of cropping structure in China during 1980–2011. J. Geogr. Sci. 2018, 28, 1659–1671. [Google Scholar] [CrossRef]
- Zhong, R.; Tian, F.; Yang, P.; Yi, Q.X. Planting and irrigation methods for cotton in southern Xinjiang, China. Irrig. Drain. 2016, 65, 461–468. [Google Scholar] [CrossRef]
- Gong, L.; He, G.; Liu, W. Long-term cropping effects on agricultural sustainability in Alar oasis of Xinjiang, China. Sustainability 2016, 8, 61. [Google Scholar] [CrossRef]
- Aziz, I.; Mahmood, T.; Islam, K.R. Effect of long term no-till and conventional tillage practices on soil quality. Soil Tillage Res. 2013, 131, 28–35. [Google Scholar] [CrossRef]
- Liu, J.; Liu, M.; Tian, H.; Zhuang, D.F.; Zhang, Z.X.; Zhang, W.; Tang, X.M.; Deng, X.Z. Spatial and temporal patterns of China’s cropland during 1990–2000: An analysis based on Landsat TM data. Remote Sens. Environ. 2005, 98, 442–456. [Google Scholar] [CrossRef]
- Suramaythangkoor, T.; Li, Z. Energy policy tools for agricultural residues utilization for heat and power generation: A case study of sugarcane trash in Thailand. Renew. Sustain. Energy Rev. 2012, 16, 4343–4351. [Google Scholar] [CrossRef]
- Canisius, F.; Turral, H.; Molden, D. Fourier analysis of historical NOAA time series data to estimate bimodal agriculture. Int. J. Remote Sens. 2007, 28, 5503–5522. [Google Scholar] [CrossRef]
- He, Y.; Zhou, G.; Tang, C.; Fan, s.g.; Guo, X.S. The spatial organization pattern of urban-rural integration in urban agglomerations in China: An agglomeration-diffusion analysis of the population and firms. Habitat Int. 2019, 87, 54–65. [Google Scholar] [CrossRef]
- Li, Q.; Liu, W.; Du, G.; Faye, B.; Wang, H.Y.; Li, Y.K.; Wang, L.; Qu, S.J. Spatiotemporal Evolution of Crop Planting Structure in the Black Soil Region of Northeast China: A Case Study in Hailun County. Land 2022, 11, 785. [Google Scholar] [CrossRef]
- Song, G.; Zhang, H. Cultivated land use layout adjustment based on crop planting suitability: A case study of typical counties in Northeast China. Land 2021, 10, 107. [Google Scholar] [CrossRef]
- Jiang, Y.; Yang, L.; Xiaolei, Z. Analysis of the characteristics of connotation evolution of agricultural modernization with Chinese characteristics in the 70 years since the founding of New China. China Political Econ. 2020, 3, 57–74. [Google Scholar] [CrossRef]
- Shi, Y.; Osewe, M.; Anastacia, C.; Liu, A.J.; Wang, S.T.; Latif, A. Agricultural Supply-Side Structural Reform and Path Optimization: Evidence from China. Int. J. Environ. Res. Public Health 2022, 20, 113. [Google Scholar] [CrossRef] [PubMed]
- Guo, Y.; Liu, Y. Poverty alleviation through land assetization and its implications for rural revitalization in China. Land Use Policy 2021, 105, 105418. [Google Scholar] [CrossRef]
- Huang, J.; Yang, J.; Zhigang, X.U.; Scott, R.; Ninghui, L. Agricultural trade liberalization and poverty in China. China Econ. Rev. 2007, 18, 244–265. [Google Scholar] [CrossRef]
- Hijmans, R.J.; Choe, H.; Perlman, J. Spatiotemporal patterns of field crop diversity in the United States, 1870–2012. Agric. Environ. Lett. 2016, 1, 160022. [Google Scholar] [CrossRef]
- Du, G.; Yao, L.; Hou, D. The spatio-temporal changes of cropping patterns in the black soil area of China: Lessons from Wangkui County. Front. Environ. Sci. 2022, 10, 981721. [Google Scholar] [CrossRef]
- Goodwin, B.K.; Mishra, A.K. Another look at decoupling: Additional evidence on the production effects of direct payments. Am. J. Agric. Econ. 2005, 87, 1200–1210. [Google Scholar] [CrossRef]
- Tan, M.; Zheng, L. Increase in economic efficiency of water use caused by crop structure adjustment in arid areas. J. Environ. Manag. 2019, 230, 386–391. [Google Scholar] [CrossRef]
- Chen, Y.; Guerschman, J.P.; Cheng, Z.; Guo, L.Z. Remote sensing for vegetation monitoring in carbon capture storage regions: A review. Appl. Energy 2019, 240, 312–326. [Google Scholar] [CrossRef]
- Yang, Y.; Huang, Q.; Wu, W.; Luo, J.; Gao, L.; Dong, W.; Wu, T.; Hu, X. Geo-parcel based crop identification by integrating high spatial-temporal resolution imagery from multi-source satellite data. Remote Sens. 2017, 9, 1298. [Google Scholar] [CrossRef]
- Zhang, Y.; Sui, B.; Shen, H.; Wang, Z. Estimating temporal changes in soil pH in the black soil region of Northeast China using remote sensing. Comput. Electron. Agric. 2018, 154, 204–212. [Google Scholar] [CrossRef]
- Zhang, W.; Brandt, M.; Prishchepov, A.V.; Li, Z.F.; Lyu, C.G.; Fensholt, R. Mapping the Dynamics of Winter Wheat in the North China Plain from Dense Landsat Time Series (1999 to 2019). Remote Sens. 2021, 13, 1170. [Google Scholar] [CrossRef]
- Ma, D.; Jiang, S.; Tan, X.; Yang, M.; Jiao, Q.; Xu, L. Spatiotemporal Conflict Analysis and Prediction of Long Time Series Land Cover Changes in the Black Soil Region of Northeast China Using Remote Sensing and GIS. ISPRS Int. J. Geo-Inf. 2023, 12, 271. [Google Scholar] [CrossRef]
- Yang, C.; Everitt, J.H.; Bradford, J.M. Evaluating high resolution SPOT 5 satellite imagery to estimate crop yield. Precis. Agric. 2009, 10, 292–303. [Google Scholar] [CrossRef]
- Yang, C.; Everitt, J.H.; Murden, D. Evaluating high resolution SPOT 5 satellite imagery for crop identification. Comput. Electron. Agric. 2011, 75, 347–354. [Google Scholar] [CrossRef]
- Cao, J.; Cai, X.; Tan, J.; Cui, Y.; Xie, W.; Liu, F.; Yang, L.; Luo, Y. Mapping paddy rice using Landsat time series data in the Ganfu Plain irrigation system, Southern China, from 1988−2017. Int. J. Remote Sens. 2021, 42, 1556–1576. [Google Scholar] [CrossRef]
- Sonobe, R.; Tani, H.; Wang, X. An experimental comparison between KELM and CART for crop classification using Landsat-8 OLI data. Geocarto Int. 2017, 32, 128–138. [Google Scholar] [CrossRef]
- Chen, Y.; Lu, D.; Moran, E.; Batistlla, M.; Dutra, L.V.; Sanches, I.D.; Silva, R.F.B.; Huang, J.F.; Luiz, A.J.B.; Oliveria, M.A.F. Mapping croplands, cropping patterns, and crop types using MODIS time-series data. Int. J. Appl. Earth Obs. Geoinf. 2018, 69, 133–147. [Google Scholar] [CrossRef]
- Wardlow, B.D.; Egbert, S.L.; Kastens, J.H. Analysis of time-series MODIS 250 m vegetation index data for crop classification in the US Central Great Plains. Remote Sens. Environ. 2007, 108, 290–310. [Google Scholar] [CrossRef]
- Xu, W.; Jin, X.; Liu, J.; Zhou, Y. Impact of cultivated land fragmentation on spatial heterogeneity of agricultural agglomeration in China. J. Geogr. Sci. 2020, 30, 1571–1589. [Google Scholar] [CrossRef]
- Yang, B.; Wang, J.; Li, S.; Huang, X. Identifying the Spatio-Temporal Change in Winter Wheat–Summer Maize Planting Structure in the North China Plain between 2001 and 2020. Agronomy 2023, 13, 2712. [Google Scholar] [CrossRef]
- Fiorillo, E.; Di Giuseppe, E.; Fontanelli, G.; Maselli, F. Lowland rice mapping in Sédhiou Region (Senegal) using sentinel 1 and sentinel 2 data and random forest. Remote Sens. 2020, 12, 3403. [Google Scholar] [CrossRef]
- Zhao, R.; Li, J.; Wu, K.; Kang, L. Cultivated land use zoning based on soil function evaluation from the perspective of black soil protection. Land 2021, 10, 605. [Google Scholar] [CrossRef]
- Zhao, H.L.; Cui, J.Y.; Zhou, R.L.; Zhang, T.H.; Zhao, X.Y.; Drake, S. Soil properties, crop productivity and irrigation effects on five croplands of Inner Mongolia. Soil Tillage Res. 2007, 93, 346–355. [Google Scholar] [CrossRef]
- Davis, K.F.; Rulli, M.C.; Seveso, A.; Dodorico, P. Increased food production and reduced water use through optimized crop distribution. Nat. Geosci. 2017, 10, 919–924. [Google Scholar] [CrossRef]
- Rulli, M.C.; Bellomi, D.; Cazzoli, A.; Decarolis, G.; Dodorico, P. The water-land-food nexus of first-generation biofuels. Sci. Rep. 2016, 6, 22521. [Google Scholar] [CrossRef] [PubMed]
- Wang, Z.; Zhang, J.; Zhang, L. Reducing the carbon footprint per unit of economic benefit is a new method to accomplish low-carbon agriculture. A case study: Adjustment of the planting structure in Zhangbei County, China. J. Sci. Food Agric. 2019, 99, 4889–4897. [Google Scholar] [CrossRef] [PubMed]
- Dong, Z.; Pan, Z.; Wang, S.; An, P.; Zhang, J.; Zhang, J.; Pan, Y.; Huang, L.; Zhao, H.; Han, G.; et al. Effective crop structure adjustment under climate change. Ecol. Indic. 2016, 69, 571–577. [Google Scholar] [CrossRef]
- Johnson, D.M. Using the Landsat archive to map crop cover history across the United States. Remote Sens. Environ. 2019, 232, 111286. [Google Scholar] [CrossRef]
- Hijmans, R.J. Global distribution of the potato crop. Am. J. Potato Res. 2001, 78, 403–412. [Google Scholar] [CrossRef]
- Han, X.; Wei, Z.; Zhang, B.; Han, C.; Song, J. Effects of crop planting structure adjustment on water use efficiency in the irrigation area of Hei River Basin. Water 2018, 10, 1305. [Google Scholar] [CrossRef]
- Wang, S.; Fu, G.; Ma, X.; Xu, L.; Yang, F. Exploring the optimal crop planting structure to balance water saving, food security and incomes under the spatiotemporal heterogeneity of the agricultural climate. J. Environ. Manag. 2021, 295, 113130. [Google Scholar] [CrossRef] [PubMed]
- Liu, J.; Sun, B.; Shen, H.; Ding, P.; Ning, D.; Zhang, J.; Qiu, X. Crop Water Requirement and Utilization Efficiency-Based Planting Structure Optimization in the Southern Huang-Huai-Hai Plain. Agronomy 2022, 12, 2219. [Google Scholar] [CrossRef]
- Wu, L.; Tian, J.; Liu, Y.; Jiang, Z. Multi-Objective Crop Planting Structure Optimisation Based on Game Theory. Water 2022, 14, 2125. [Google Scholar] [CrossRef]
- Huang, J.; Hao, H.F. Effects of climate change and crop planting structure on the abundance of cotton bollworm, Helicoverpa armigera (Hübner)(Lepidoptera: Noctuidae). Ecol. Evol. 2020, 10, 1324–1338. [Google Scholar] [CrossRef]
- Tian, G.; Duan, J.; Yang, L. Spatio-temporal pattern and driving mechanisms of cropland circulation in China. Land Use Policy 2021, 100, 105118. [Google Scholar] [CrossRef]
- Kang, M.; Wang, Y.; Zhu, Y.; He, F.; Jiang, S.; Yang, M.; Bacenetti, J. Optimizing the structure of food production in China to improve the sustainability of water resources. Sci. Total Environ. 2023, 900, 165750. [Google Scholar] [CrossRef] [PubMed]
- Wang, X.; Dong, X.; Liu, H.; Wei, H.; Fan, W.; Lu, N.; Xu, Z.; Ren, J.; Xing, K. Linking land use change, ecosystem services and human well-being: A case study of the Manas River Basin of Xinjiang, China. Ecosyst. Serv. 2017, 27, 113–123. [Google Scholar] [CrossRef]
- Ding, X.; Zhang, B.; Zhang, X.; Yang, X.; Zhang, X. Effects of tillage and crop rotation on soil microbial residues in a rainfed agroecosystem of northeast China. Soil Tillage Res. 2011, 114, 43–49. [Google Scholar] [CrossRef]
- Chen, Y.-H.; Wang, H.-Y.; Zhou, J.-M.; Xing, L.; Zhu, B.-S.; Zhao, Y.; Chen, X. Minimum data set for assessing soil quality in farmland of northeast China. Pedosphere 2013, 23, 564–576. [Google Scholar] [CrossRef]
- Cai, T.; Zhang, X.; Xia, F.; Lu, D. Function Evolution of Oasis Cultivated Land and Its Trade-Off and Synergy Relationship in Xinjiang, China. Land 2022, 11, 1399. [Google Scholar] [CrossRef]
- Lee, E.; Kastens, J.H.; Egbert, S.L. Investigating collection 4 versus collection 5 MODIS 250 m NDVI time-series data for crop separability in Kansas, USA. Int. J. Remote Sens. 2016, 37, 341–355. [Google Scholar] [CrossRef]
- Xinjiang Production and Construction Corps Statistical Yearbook Editing Committee; Statistics Bureau of Xinjiang Production and Construction Corps. Statistical Yearbook of Xinjiang Production and Construction Corp; China Statistics Press: Beijing, China, 2021. [Google Scholar]
- Jimenez, L.O.; Landgrebe, D.A. Hyperspectral data analysis and supervised feature reduction via projection pursuit. IEEE Trans. Geosci. Remote Sens. 1999, 37, 2653–2667. [Google Scholar] [CrossRef]
- Collis, R.T.H.; Creasey, D.J.; Grasty, R.L.; Hartl, P.H.; Loor, G.P.; Russell, P.B.; Salerno, A.E.; Schanda, E.; Schaper, P.W. Remote Sensing for Environmental Sciences; Springer Science & Business Media: Berlin/Heidelberg, Germany, 2012. [Google Scholar] [CrossRef]
- Morfitt, R.; Barsi, J.; Levy, R.; Markham, B.; Micijevic, E.; Ong, L.; Scaramuzza, P.; Vanderwerff, K. Landsat-8 Operational Land Imager (OLI) radiometric performance on-orbit. Remote Sens. 2015, 7, 2208–2237. [Google Scholar] [CrossRef]
- Chaves, E.D.M.; Picoli, C.A.M.; Sanches, D.I. Recent applications of Landsat 8/OLI and Sentinel-2/MSI for land use and land cover mapping: A systematic review. Remote Sens. 2020, 12, 3062. [Google Scholar] [CrossRef]
- Chipman, H.A.; George, E.I.; McCulloch, R.E. Bayesian CART model search. J. Am. Stat. Assoc. 1998, 93, 935–948. [Google Scholar] [CrossRef]
- Anh, D.T.; Pandey, M.; Mishra, V.N.; Singh, K.; Ahmadi, K.; Janizadeh, S.; Tran, T.; Linh, N.; Dang, N. Assessment of groundwater potential modeling using support vector machine optimization based on Bayesian multi-objective hyperparameter algorithm. Appl. Soft Comput. 2023, 132, 109848. [Google Scholar] [CrossRef]
- Ozdogan, M.; Gutman, G. A new methodology to map irrigated areas using multi-temporal MODIS and ancillary data: An application example in the continental US. Remote Sens. Environ. 2008, 112, 3520–3537. [Google Scholar] [CrossRef]
- Friedl, M.A.; Brodley, C.E. Decision tree classification of land cover from remotely sensed data. Remote Sens. Environ. 1997, 61, 399–409. [Google Scholar] [CrossRef]
- Bezdek, J.C. On the relationship between neural networks, pattern recognition and intelligence. Int. J. Approx. Reason. 1992, 6, 85–107. [Google Scholar] [CrossRef]
- Conrad, C.; Colditz, R.R.; Dech, S.; Klein, D.; Vlek, P. Temporal segmentation of MODIS time series for improving crop classification in Central Asian irrigation systems. Int. J. Remote Sens. 2011, 32, 8763–8778. [Google Scholar] [CrossRef]
- Li, R.; You, K.; Cai, W.; Wang, J.; Liu, Y.; Yu, Y. Will the southward center of gravity migration of population, floor area, and building energy consumption facilitate building carbon emission reduction in China? Build. Environ. 2023, 242, 110576. [Google Scholar] [CrossRef]
- Liu, J.; Kuang, W.; Zhang, Z.; Xu, X.; Qin, Y.; Ning, J.; Zhou, W.; Zhang, S.; Li, R.; Yan, C.; et al. Spatiotemporal characteristics, patterns, and causes of land-use changes in China since the late 1980s. J. Geogr. Sci. 2014, 24, 195–210. [Google Scholar] [CrossRef]
- Herrick, J.E.; Urama, K.C.; Karl, J.W.; Boos, J.; Johnson, M.; Shepherd, K.; Hempel, J.; Bestlmeyer, B.; Davies, J.; Guerra, J.; et al. The global Land-Potential Knowledge System (LandPKS): Supporting evidence-based, site-specific land use and management through cloud computing, mobile applications, and crowdsourcing. J. Soil Water Conserv. 2013, 68, 5A–12A. [Google Scholar] [CrossRef]
- Ling, M.; Han, H.; Wei, X.; Lv, C. Temporal and spatial distributions of precipitation on the Huang-Huai-Hai Plain during 1960–2019, China. J. Water Clim. Chang. 2021, 12, 2232–2244. [Google Scholar] [CrossRef]
- Van Belle, G.; Hughes, J.P. Nonparametric tests for trend in water quality. Water Resour. Res. 1984, 20, 127–136. [Google Scholar] [CrossRef]
- Kendall, M.G. A new measure of rank correlation. Biometrika 1938, 30, 81–93. [Google Scholar] [CrossRef]
- Hamed, K.H.; Rao, A.R. A modified Mann-Kendall trend test for autocorrelated data. J. Hydrol. 1998, 204, 182–196. [Google Scholar] [CrossRef]
- Wright, S. The method of path coefficients. Ann. Math. Stat. 1934, 5, 161–215. [Google Scholar] [CrossRef]
- Cheng, M.; Jiao, X.; Jin, X.; Li, B.; Liu, K.; Shi, L. Satellite time series data reveal interannual and seasonal spatiotemporal evapotranspiration patterns in China in response to effect factors. Agric. Water Manag. 2021, 255, 107046. [Google Scholar] [CrossRef]
- Jia, B.; Zhang, Z.; Ci, L.; Ren, Y.; Pan, B.; Zhang, Z. Oasis land-use dynamics and its influence on the oasis environment in Xinjiang, China. J. Arid. Environ. 2004, 56, 11–26. [Google Scholar] [CrossRef]
- Li, L.; Xiang, Y.; Fan, X.; Wang, Q.; Wei, Y. Spatiotemporal Characteristics of Agricultural Production Efficiency in Sichuan Province from the Perspective of “Water–Land–Energy–Carbon” Coupling. Sustainability 2023, 15, 15264. [Google Scholar] [CrossRef]
- Li, J.; Fei, L.; Li, S.; Xue, C.; Shi, X.; Hinkelmann, R. Development of “water-suitable” agriculture based on a statistical analysis of factors affecting irrigation water demand. Sci. Total Environ. 2020, 744, 140986. [Google Scholar] [CrossRef] [PubMed]
- Li, X.; Xu, Y.; Ma, Q. Study of Cotton Costs Income and Subsidy Policy in Xinjiang. In Proceedings of the 4th International Conference on Management Science, Education Technology, Arts, Social Science and Economics 2016, Jinan, China, 15–16 October 2016; Atlantis Press: Amsterdam, The Netherlands, 2016; pp. 1873–1876. [Google Scholar]
- Sheng, L.; Xiaoling, Z. Analysis on the Influencing Factors of Population Agglomeration under the Background of Urbanization: A Case Study of Xinjiang Production and Construction Corps (XPCC). In Proceedings of the 2018 International Conference on Economics, Politics and Business Management (ICEPBM 2018), Nanjing, China, 23–25 January 2018. [Google Scholar]
- Wen, Z.; Wei, C.; Tao, W.; Zhang, T. The win-win interaction between integrated blue and green space on urban cooling. Sci. Total Environ. 2022, 863, 160712. [Google Scholar]
- Chen, Q.; Caiyao, X.; Fanbin, K. Spatio-Temporal Pattern of Green Agricultural Science and Technology Progress: A Case Study in Yangtze River Delta of China. Int. J. Environ. Res. Public Health 2022, 19, 8702. [Google Scholar]
- Chen, M.; Luo, Y.; Shen, Y.; Han, Z.; Cui, Y. Driving force analysis of irrigation water consumption using principal component regression analysis. Agric. Water Manag. 2020, 234, 106089. [Google Scholar] [CrossRef]
- Liu, X.; Shi, L.; Qian, H.; Sun, S.; Wu, P.; Zhao, X.; Engel, B.; Wang, Y. New problems of food security in Northwest China: A sustainability perspective. Land Degrad. Dev. 2020, 31, 975–989. [Google Scholar] [CrossRef]
- Agrawal, S.; Kumar, V.; Kumar, S.; Shahi, S. Plant development and crop protection using phytonanotechnology: A new window for sustainable agriculture. Chemosphere 2022, 299, 134465. [Google Scholar] [CrossRef]
- Chen, X.; Huang, Q.; Xiong, Y.; Yang, Q.; Li, H.; Hou, Z.; Huang, J. Tracking the spatio-temporal change of the main food CPS in the Yellow River Basin over 2001–2020. Comput. Electron. Agric. 2023, 212, 108102. [Google Scholar] [CrossRef]
- Angus, A.; Burgess, P.J.; Morris, J.; Lingard, J. Agriculture and land use: Demand for and supply of agricultural commodities, characteristics of the farming and food industries, and implications for land use in the UK. Land Use Policy 2009, 26, S230–S242. [Google Scholar] [CrossRef]
- Lee, D.R.; Edmeades, S.; De Nys, E.; McDonald, A.; Janssen, W. Developing local adaptation strategies for climate change in agriculture: A priority-setting approach with application to Latin America. Glob. Environ. Chang. 2014, 29, 78–91. [Google Scholar] [CrossRef]
- Zhang, Y.; Ma, Y. Spatio-temporal changes analysis of vegetation coverage in Alar City in 1992–2019 years. Grassl. Turf. 2022, 42, 62–72. [Google Scholar]
Disclaimer/Publisher’s Note: The statements, opinions and data contained in all publications are solely those of the individual author(s) and contributor(s) and not of MDPI and/or the editor(s). MDPI and/or the editor(s) disclaim responsibility for any injury to people or property resulting from any ideas, methods, instructions or products referred to in the content. |
© 2024 by the authors. Licensee MDPI, Basel, Switzerland. This article is an open access article distributed under the terms and conditions of the Creative Commons Attribution (CC BY) license (https://creativecommons.org/licenses/by/4.0/).