Abstract
Biochar amendment and substituting chemical fertilizers with organic manure (organic substitution) have been widely reported to improve intensive vegetable production. However, considering its high potential for reducing carbon and reactive nitrogen (Nr) footprints, very few comprehensive evaluations have been performed on the environmental and economic aspects of biochar amendment or organic substitution. In this study, the comprehensive environmental damage costs from carbon and Nr footprints, measured using the life cycle assessment (LCA) methodology, followed a cradle-to-gate approach, and the carbon storage benefits were incorporated into the newly constructed net ecosystem economic benefit (NEEB) assessment frame in addition to the conventional product income–input cost-benefit methods. One kilogram of harvested vegetables for carbon/Nr footprints and one hectare of cultivated land per crop for cost and benefit were adopted as functional units considering the multi-cropping characteristics for intensive vegetable production. Five fertilization treatments were included: no fertilizer (CK); synthetic fertilizer application (SN); biochar amendment (NB); organic substitution (NM); and a combination of biochar and organic substitution (NMB). These were investigated for five consecutive years of vegetable crop rotations in a typically intensified vegetable production region in China. Adopting the revised NEEB methodology, NB significantly reduced carbon footprint by 73.0% compared to no biochar addition treatment. Meanwhile, NB significantly increased the total benefits by 9.7% and reduced the environmental damages by 52.7% compared to NM, generating the highest NEEB, making it the most effective fertilization strategy among all treatments. It was 4.3% higher compared to NM, which was not significant, but significantly higher than SN and NMB, by 23.0% and 13.6%, respectively. This finding highlights the importance of considering carbon storage benefit for properly assessing NEEB, which is important for developing effective agricultural management strategies and promoting intensive vegetable production with a more sustainable approach.
1. Introduction
The incorporation of sustainable production methods into intensive vegetable farming represents a pivotal advancement in contemporary agriculture. This endeavor seeks to achieve a delicate equilibrium between the escalating need for food and the imperative of environmental preservation []. Conventional intensive farming practices, although proficient in bolstering crop yields, frequently engender severe environmental degradation. This degradation encompasses emissions of greenhouse gases (GHGs), nitrogen (N) runoff culminating in eutrophication, the depletion of natural resources, and soil acidification and degradation []. In pursuit of agricultural methodologies that bolster food security while curtailing ecological footprints, organic alternatives and the application of biochar emerge as prominent candidates. Their potential to enhance soil quality and alleviate environmental challenges underscores their significance [,].
The organic substitution strategy is widely regarded as one of the most effective methods for mitigating negative environmental impacts. Not only does it enhance the environmental quality of ecosystems, but it also bolsters product competitiveness in intensive vegetable production []. While organic substitution garners attention, there is growing acknowledgment of the indispensable role of biochar application in mitigating the environmental impact of agriculture []. Biochar is a stabilized form of carbon produced by the pyrolysis of biomass, and its high porosity and large surface area improves soil structure, water retention, and nutrient availability, in addition to its ability to enhance crop resistance, and thus crop yields, by boosting the concentration of available cations [,]. The inherent resistance of biochar to decomposition renders it a potent vehicle for carbon storage, thereby contributing to diminished atmospheric carbon dioxide levels []. Moreover, biochar augments soil N fixation capacity, thereby curbing N loss and GHG emissions [].
The primary objectives of agricultural production are to achieve the lowest environmental damage costs (EDCs) and the highest net economic benefits (NEBs). NEB indicates crop production avenues minus the purchase cost of agrochemical inputs. EDC refers to the costs associated with the reduced quality of environmental service functions due to Nr losses, including N footprints and GHGs from natural or anthropogenic activities []. From a life cycle assessment perspective, in addition to the significant emissions from on-farm applications, the production and transportation of agrochemical inputs, as well as the associated energy consumption, indirectly generate Nr and GHGs [,]. Net ecosystem economic benefit (NEEB), defined as the difference between NEB and EDC from crop production, has thus become widely used to assess the sustainability of agricultural practices [].
However, the comprehensive assessment of the impact of organic substitution and biochar addition on NEEBs on the ecosystem, integrating production costs, crop yields, and environmental damages in intensive vegetable production, remains relatively unexplored. Our previous preliminary 5-year field observations and empirical modeling results indicated that organic substitution and biochar addition increased NEEB by increasing crop yields and reducing reactive N losses compared to synthetic N fertilizer alone [].
In view of the role of biochar in carbon storage, particularly its capacity to sequester organic carbon over long time, this presents a significant opportunity for climate change mitigation and the enhancement of soil fertility and structure []. While existing studies have demonstrated the environmental and economic benefits of biochar in agricultural production, the reassessment of the quantitative NEEB of carbon storage benefits is still deficient. The long-term contribution of carbon sequestration has not been adequately considered in the calculation of NEEB, which may underestimate the role of biochar in agricultural sustainability []. In addition, biochar application costs should be considered for the term of its lifespan, even for a one-time application. Recognizing these unique characteristics of biochar, our current research is dedicated to reassessing the carbon footprint and NEEB of intensive vegetable production systems adopting our constructed NEEB frames, by introducing the dual benefits of biochar-improving agricultural productivity and sequestration gains through carbon sequestration on the one hand, and reducing the cost of environmental damage by lowering GHG emissions on the other. Based on this approach, the sustainability of vegetable production can be more thoroughly evaluated and explored. Therefore, we hypothesize that biochar application may be superior to organic substitution in terms of NEEB by incorporating new components for carbon storage benefit for vegetable production.
2. Materials and Methods
2.1. Experimental Site and Treatments
The field experiment was conducted in a long-term experimental vegetable field in Nanjing, Jiangsu Province, China (32°01′ N, 118°52′ E), with an average annual temperature and precipitation of 17.5 °C and 1107 mm, respectively. The test soil pH was 7.9, the bulk density was 1.3 g cm−3, the organic carbon was 18.8 g C kg−1, the total nitrogen was 2.3 g N kg−1, the cation exchange capacity (CEC) was 25.3 cmol kg−1, and it contained 3.1% of clay particles, 66.4% of silt particles, and 30.5% of sand particles. Soil physicochemical properties were measured using the methods described in a previous study [].
Five experimental treatments were established, which were no fertilizer or biochar addition (CK); synthetic fertilizer application (SN); SN plus 20 t ha−1 biochar amendment (NB); substituting 50% of chemical N fertilizer with organic manure (NM); and NM plus 20 t ha−1 biochar amendment (NMB). The N application rate was 240 kg N ha−1 crop−1 as urea; the phosphate (P) application rate was 120 kg P ha−1 crop−1 as superphosphate; the potassium (K) application rate was 240 kg K ha−1 crop−1 as potassium chloride. The organic manure was applied at 120 kg N ha−1 crop−1 containing 1.1% TN, 0.13% P, 0.83% K and 28.3% organic matter. The organic manure purchased from Nanjing Mingzhu Fertilizer Co., Ltd. (Nanjing, China). Biochar purchased from Henan Sanli New Energy Co. (Shangqiu, China), which was produced by pyrolyzing wheat straw at 500 °C under a continuous carbonization furnace for 4 h. Usually, biochar produced at low temperatures (e.g., 400 °C) is more appropriate for agricultural soil improvement, while at high temperatures (e.g., 600 °C), it is more suitable for the remediation of organic and inorganic polluted environments []. Therefore, choosing 500 °C as the pyrolysis temperature can take into account the product characteristics and application needs. The usually recommended pyrolysis time for biochar is 2–6 h. Choosing 4 h as the pyrolysis time can ensure that the biomass is fully decomposed, and, at the same time, avoid the degradation of product quality that may be caused by pyrolysis for too long. The properties were as follows: carbon content 467 g C kg−1; nitrogen content 5.9 g N kg−1; pH 9.4, CEC 24.1 cmol kg−1; and ash content 20.8%. Crop rotations, species, tillage, and pest controls followed local practices.
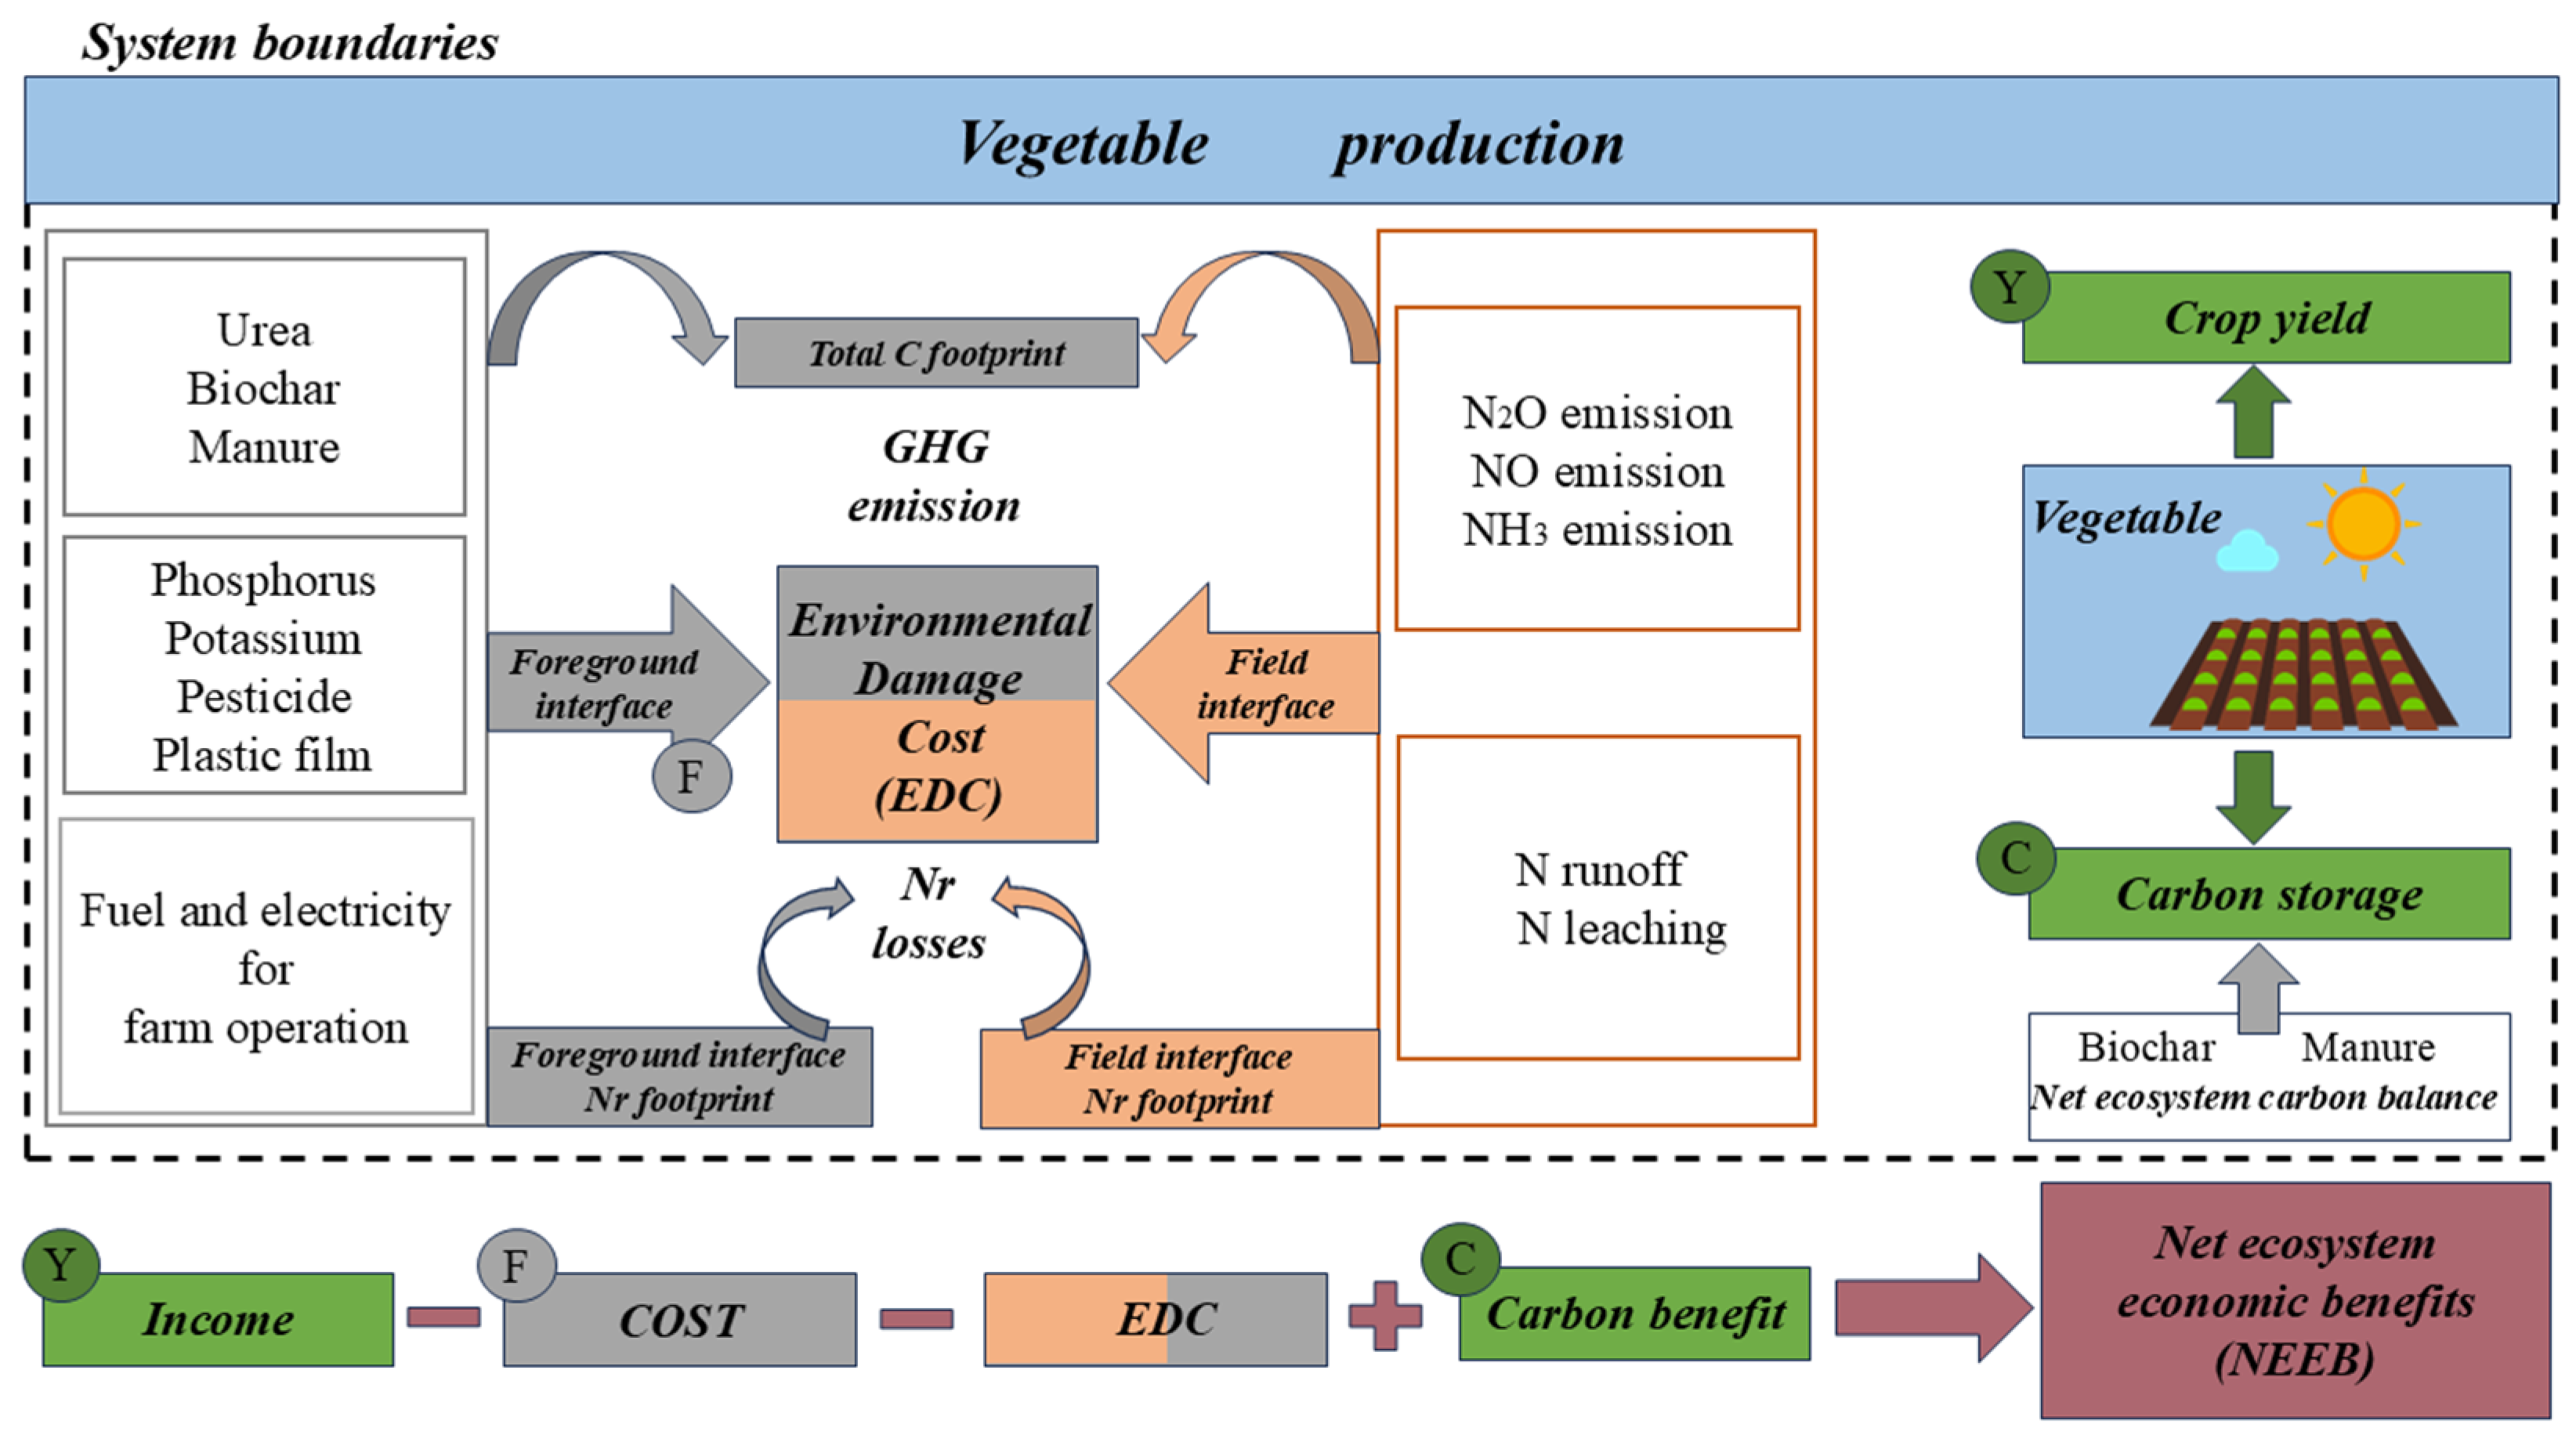
2.2. System Boundaries
In this study, we estimated the reactive N (Nr) and carbon footprints of intensive vegetable production under different fertilizer treatments using the life cycle assessment (LCA) method. The system boundary (Figure 1) extends from the production of intensive vegetables to the required energy for producing input agrochemicals, and the harvesting, and can therefore be divided into the foreground and field interfaces. The Nr footprint includes nitrous oxide (N2O), NOX emissions, N runoff and leaching, and ammonia (NH3) volatilization losses released at the field interface after planting, as well as those released at the foreground interfaces. The carbon footprint consists of GHG emissions at the foreground interface and soil N2O emissions and organic carbon fixation at the field interface. In this study, we did not consider the emissions of carbon dioxide (CO2) and methane (CH4) from straw handling, transportation, and production during the biochar production process due to its negligible amounts. In addition, the CO2 absorbed by biomass during growth is theoretically balanced with that released when it is burned or decomposed, and therefore can be considered carbon neutral according to the IPCC definition [,].
Figure 1.
System boundaries for the life cycle assessment of the C footprint, Nr footprint and the net ecosystem economic benefit (NEEB) of intensive vegetable production.
2.3. Soil Organic Carbon Fixation Rate and NECB
The accumulation and transformation of organic carbon in soil is a long-term and slow process, which can be determined by measuring changes in soil organic carbon (SOC) for long-term experiments. However, for short-term experiments, it cannot be measured directly, and so the net ecosystem carbon balance (NECB) or model predictions are often used to estimate it indirectly []. Based on the short experimental period in this study, this method of estimating the NECB was used to determine the δSOC. If the value of NECB is positive, it indicates net organic carbon accumulation in the ecosystem, and, vice versa, a negative value indicates net organic carbon loss in the ecosystem []. The relationship between δSOC and NECB was converted from the coefficient of 0.21 as reported in previous studies [] and 1.00 under biochar amendment, since biochar decomposition and associated CO2 emissions were ignored due to its relative stability [,]. δSOC and NECB were calculated as follows:
where GPP (gross primary production) denotes gross primary productivity, which is estimated from net primary productivity (NPP) []. In this study, all the crops were leafy vegetables, so NPPharvest refers to the sum of the carbon content of the harvested part of the vegetable crop, NPPresidue refers to the sum of the carbon content of the above-ground part and the root system left in the field after harvesting, and as the vegetables were harvested once, including the root system, which was all removed, the value was 0. NPPexudate refers to the sum of the carbon content of the root secretion, which was estimated to account for 7% of the total biological carbon content []. Ecosystem respiration (Re) refers to the cumulative CO2 emissions from the ecosystem as measured by the static dark box method, while H refers to the amount of carbon taken away by the harvested vegetables, which was determined to be 393 and 354 mg kg−1 dry weight for baby bok choy and spinach, respectively. The specific results are shown in Table 1.
NPP = NPPharvest + NPPresidue + NPPexudate
GPP = NPP/0.52
NECB = GPP − Re − H − CH4 + Manure-C
δSOC = 0.21 × NECB + 1.00 × Biochar-C
Table 1.
Components of NECB and δSOC (t C ha−1 crop−1) under different strategies in intensive vegetable production.
The carbon footprint of vegetable production (kg CO2-eq kg−1 vegetable) for each treatment was calculated using the following equation []:
where CF represents the carbon footprint; FIiCO2 denotes the GHGs emitted at the foreground interface, which is obtained by multiplying their respective dosages by their carbon emission factors (Table 2); N2O (kg N ha−1) and soil organic carbon storage (δSOC) (kg C ha −1 crop−1) represent the N2O emission and soil organic carbon storage of each treatment at the field interface, respectively. Y denotes the total vegetable yield (kg ha−1) of each treatment.
Table 2.
Carbon emissions (kg CO2-eq ha−1 crop−1) and coefficients (kg CO2-eq unit−1 input) under different strategies in intensive vegetable production.
2.4. EDC and NEEB
The carbon and Nr footprints were assessed along with the EDC, NEB and NEEB of each treatment. The EDC caused from Nr and GHGs was calculated as follows []:
where Nri A (kg N ha−1) denotes the total emission of Nr “i”; Pi (¥ kg−1 N) denotes the EDC per unit mass of Nr “i”; CO2 A (t CO2-eq ha−1) represents the total emission of GHGs; and PCO2 (¥ t−1 CO2-eq) represents the greenhouse effect caused by the CO2 emission (expressed by the international carbon trading price). The specific EDC are shown in Table 3, where the updated EDC per unit of GHG emissions is 103.7 ¥ t−1 CO2-eq.
EDC = NriA × Pi + CO2A × PCO2
NEEB = NEB + Carbon benefit − EDC
Table 3.
Components of NEB (×103 CNY ha−1 crop−1) and EDC (×103 CNY ha−1 crop−1) under different strategies in intensive vegetable production.
The NEB is the difference between the vegetable yield benefit and the cost of agrochemical inputs, where Ya (kg ha−1) and Pa (¥ kg−1) represent the yield of vegetable and the market price of the vegetable, respectively; Rm (kg ha−1) and Pm (kg−1) represent the use and the actual purchase prices of agrochemical inputs and energy, respectively. The detailed price is shown in Table 3. The redefined NEEB is the difference between the NEB, carbon benefit and EDC as mentioned above and in Figure 1. Carbon benefit refers to carbon storage, as expressed by the international carbon trading price similar to CO2 emission, and the updated price is 103.7 ¥ t−1 CO2-eq.
2.5. Statistical Analyses
The data were calculated and graphed using Microsoft Excel software (2013) and Origin software (Version 9.0, Northampton, MA, USA), and the test of the significance of the differences between treatments was analyzed using SPSS 20.0 software (Chicago, IL, USA) (p < 0.05), and multiple comparisons were made using the Duncan method.
3. Results
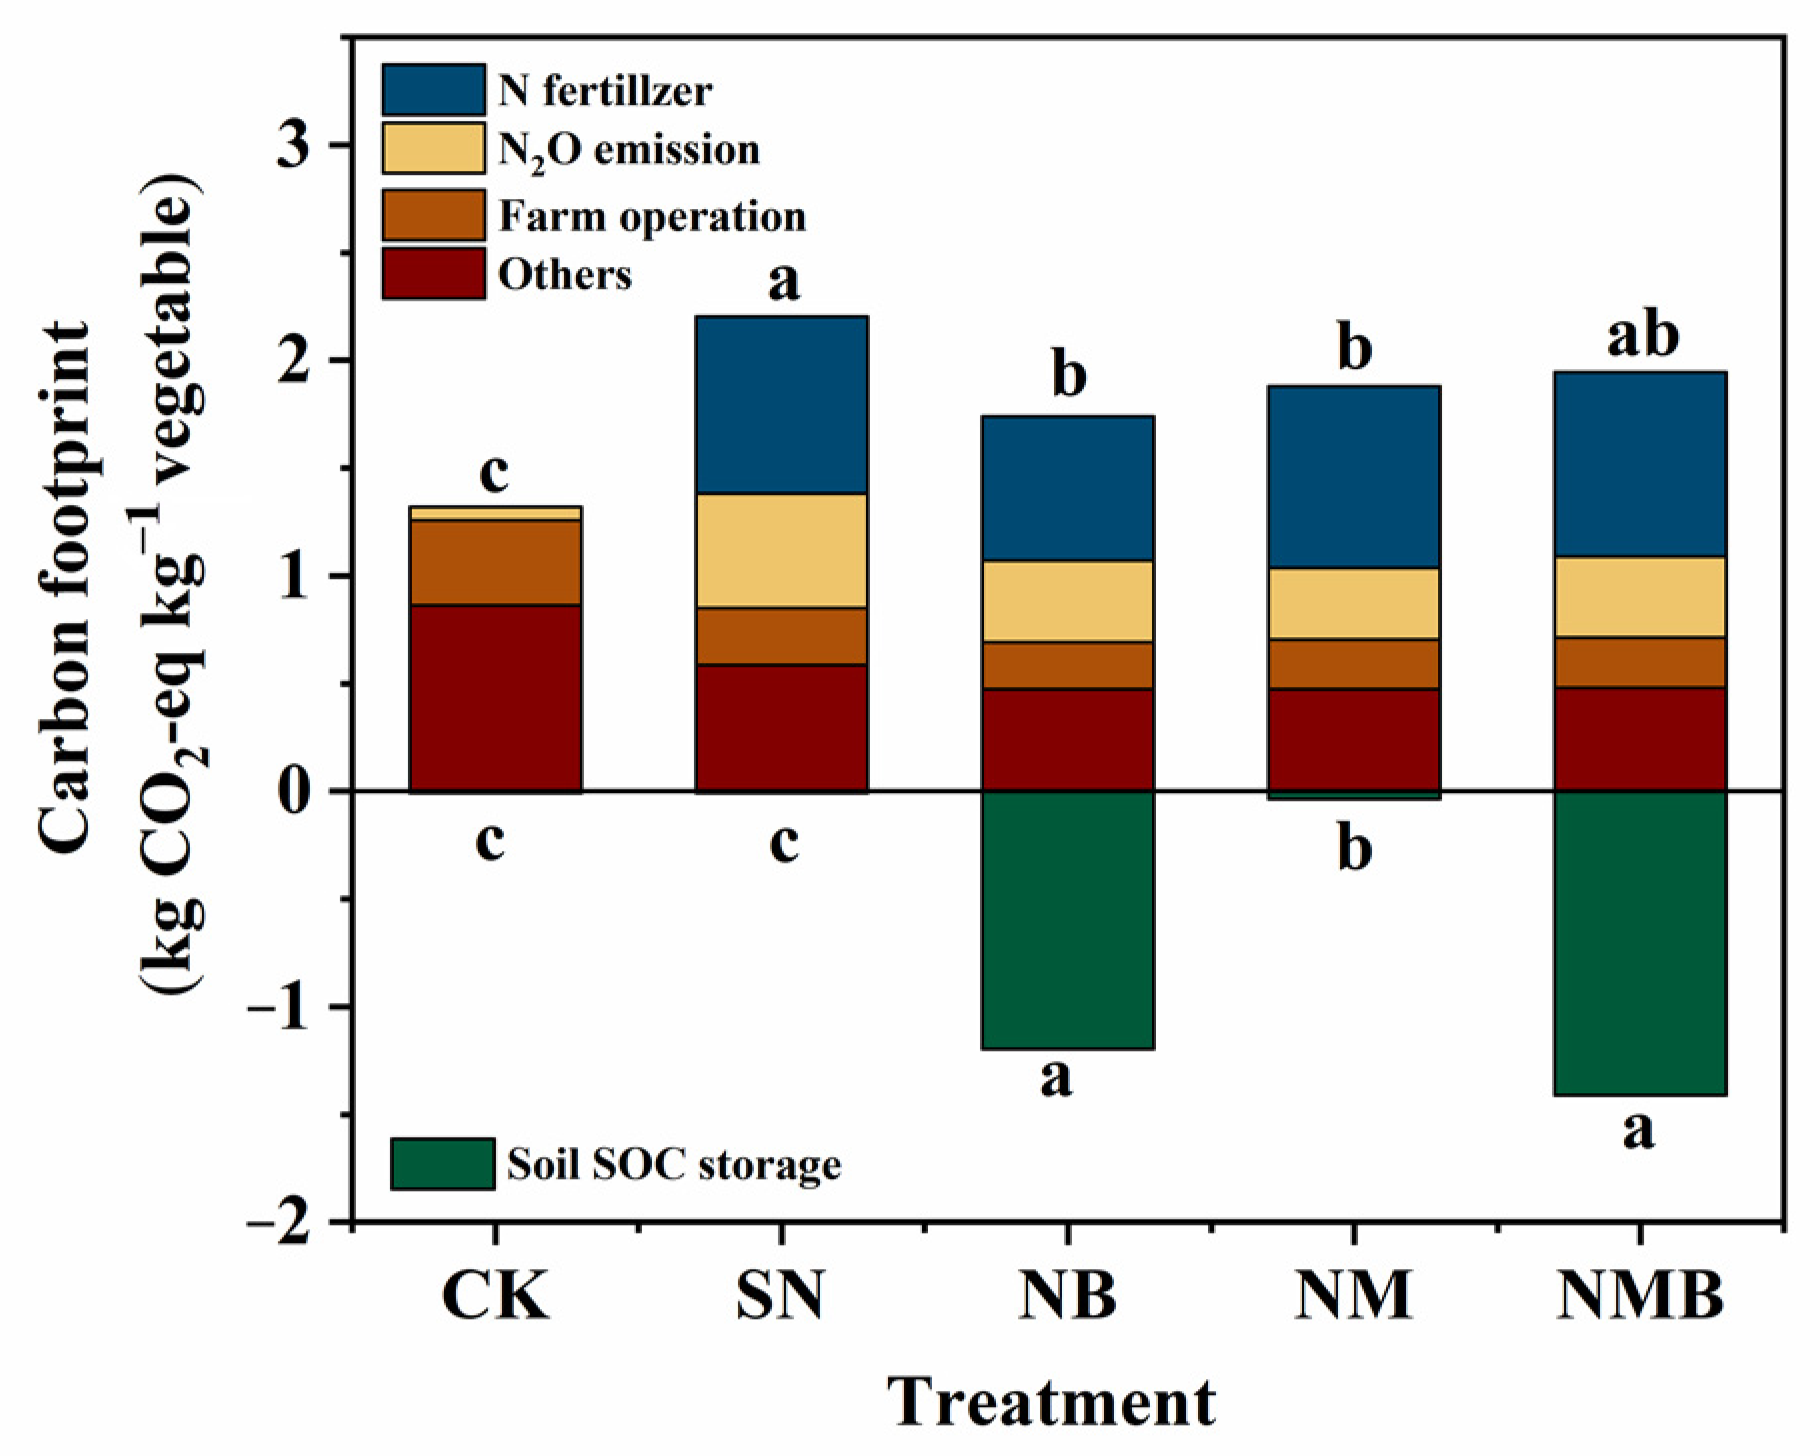
3.1. Carbon Footprints of Biochar Amendment and Organic Substitutions
In the present study, the range of NECB for each treatment was 0.77–52.95 t C ha−1 (Table 1), which showed a net accumulation. The range of δSOC for each treatment during the experimental period was 0.16–52.95 t C ha−1 (Table 1). The δSOC was significantly higher in the biochar addition treatments (NB and NMB), by 33.37–166.09% and 36.41–180.83%, respectively, compared to the NM and SN, and the difference between the biochar addition treatments was not significant.
Carbon footprint, which is the ratio of net GHG emissions to vegetable yield, ranged from 1.32–2.21 kg CO2-eq kg−1 vegetable for all treatments except organic carbon fixation during the experimental period. The SN treatment had the highest carbon footprint and the CK treatment had the lowest (Figure 2), as the production of N fertilizers was the primary carbon emission factor, accounting for 37.38–44.85% of the carbon footprint range, excluding organic carbon fixation. Biochar addition and organic substitution alone reduced carbon footprint by 21.09%, 10.61%,14.74%, and 3.41% compared to SN and NMB treatments, respectively, but there was no significant difference between the two treatments. Notably, the total carbon footprint considering the soil carbon pool ranges from 0.53–2.20 kg CO2-eq kg−1 per vegetable. Biochar addition significantly increased the soil carbon pool, which ultimately reduced the total carbon footprint of NB and NMB treatments by 75.33%, 70.60% and 75.67%, 71.00% (p < 0.05) compared to SN and NM treatments, respectively.
Figure 2.
Carbon footprint of different fertilization treatments in intensive vegetable production. N fertilizer refers to the manufacture and transport of inorganic and organic fertilizers. Farm operations refer to fuel and electrical energy consumption. Other refers to the manufacture and transport of potassium, phosphorus, pesticides, and plastic film. The lowercase letters represent significant differences according to Tukey’s multiple range test (p < 0.05). CK: no fertilizer or biochar addition; SN: synthetic fertilizer application; NB: SN plus 20 t ha−1 biochar amendment; NM: substituting 50% of chemical N fertilizer with organic manure; NMB: NM plus 20 t ha−1 biochar amendment.
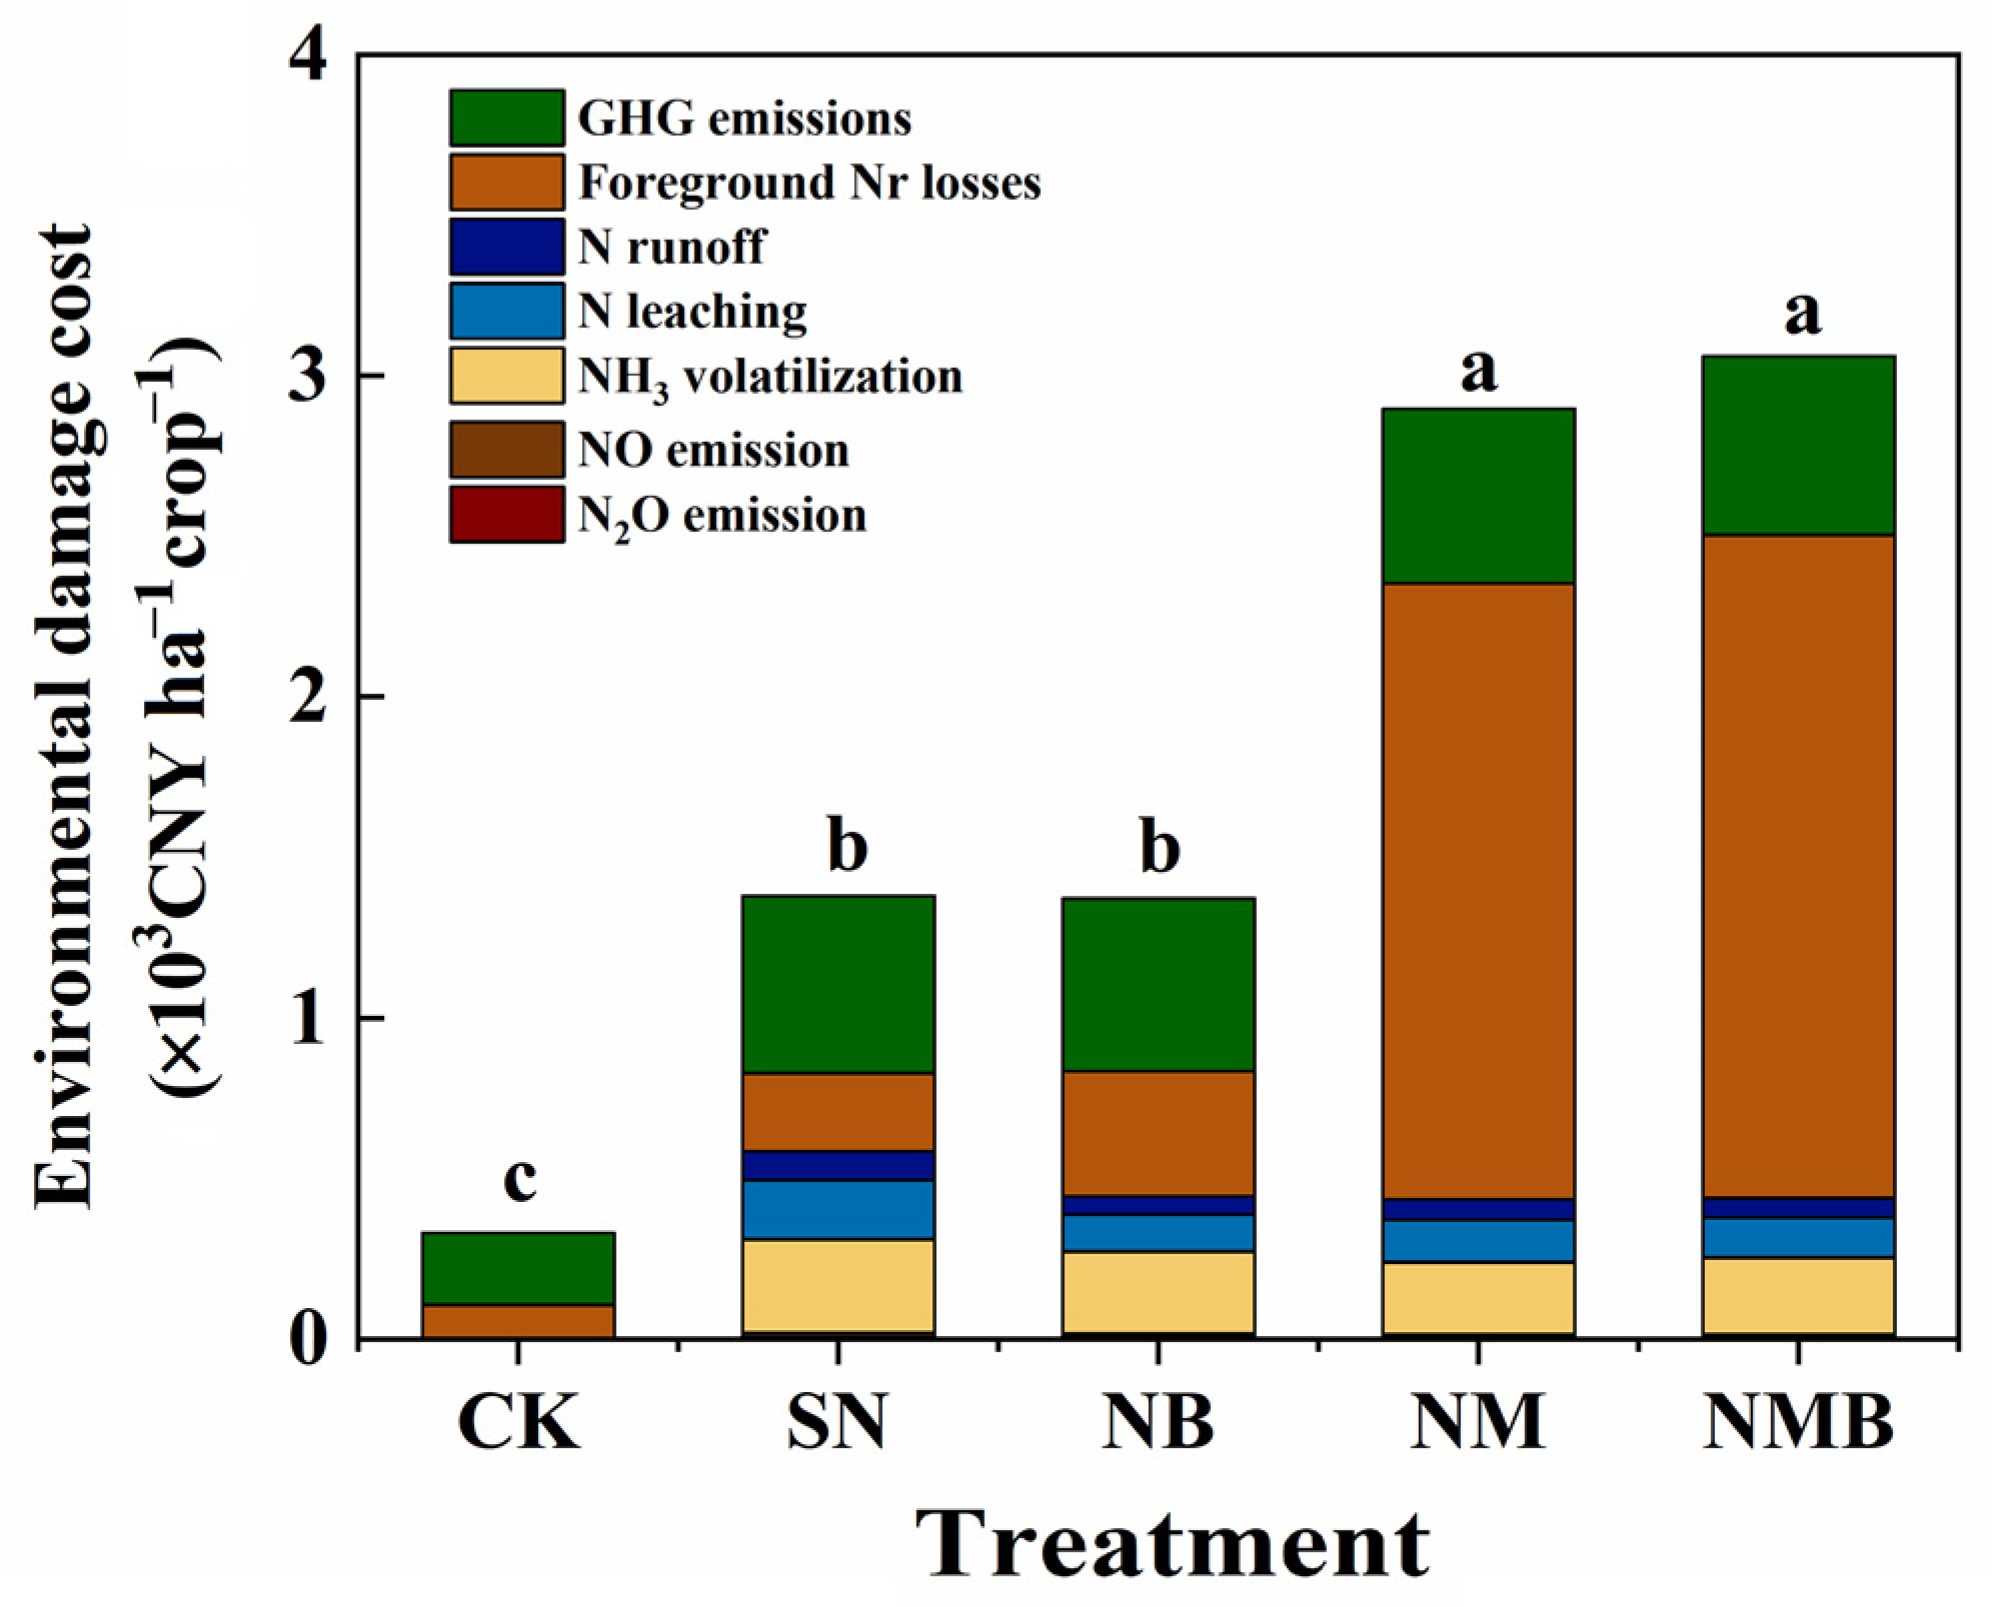
3.2. EDC of Biochar Amendment and Organic Substitutions
Based on actual measurements and empirical model estimates, we present Nr losses at the foreground and field interfaces separately (Table 4), where the foreground includes the production of fertilizers (synthetic fertilizers, manure, and biochar), pesticide and plastic film production, agrochemical transport, and energy consumption. To avoid repetition of the results, the field interface is the total Nr losses (N2O, NO, NH3, N leaching, N runoff), using specific data from a previous study [], which showed that organic substitution significantly reduced N2O and NO emissions by 18.9–27.4% and 35.9–39.5%, respectively, compared with SN. NB increased NH3 volatilization by 13.3% and 6.3%, but decreased N leaching and N runoff by 5.9–11.2% compared to organic substitution. Based on the above results and with reference to the respective EDC factors reported in the literature, the list of EDC for each treatment is presented in Table 3. The EDC ranged from 0.33–3.06 thousand CNY in all treatments. In the treatments where organic fertilizers was applied, foreground interface Nr loss was the main contributor to the EDC, with an average percentage of 66.87%, in addition to which GHG emissions were the main contributor, with percentages ranging from 39.23–67.92% (Figure 3). Thus, organic substitution significantly worsened the EDC. However, the NB showed no difference in EDC with the SN treatments, though greater than CK. Among the losses of each Nr at the field interface, although N leaching was the hotpot emission link of Nr, ammonia volatilization exceeded the environmental damage caused by N leaching due to the highest cost of environmental damage, which accounted for more than the environmental damage caused by ammonia volatilization in the EDC of all treatments.
Table 4.
Nr losses (kg N ha−1 crop−1) at the foreground and field interfaces under different strategies in intensive vegetable production.
Figure 3.
Contributions of different sources to environmental damage costs (EDC) under different treatments in intensive vegetable production. The lowercase letters represent significant differences according to Tukey’s multiple range test (p < 0.05). CK: no fertilizer or biochar addition; SN: synthetic fertilizer application); NB: SN plus 20 t ha−1 biochar amendment; NM: substituting 50% of chemical N fertilizer with organic manure; NMB: NM plus 20 t ha−1 biochar amendment.
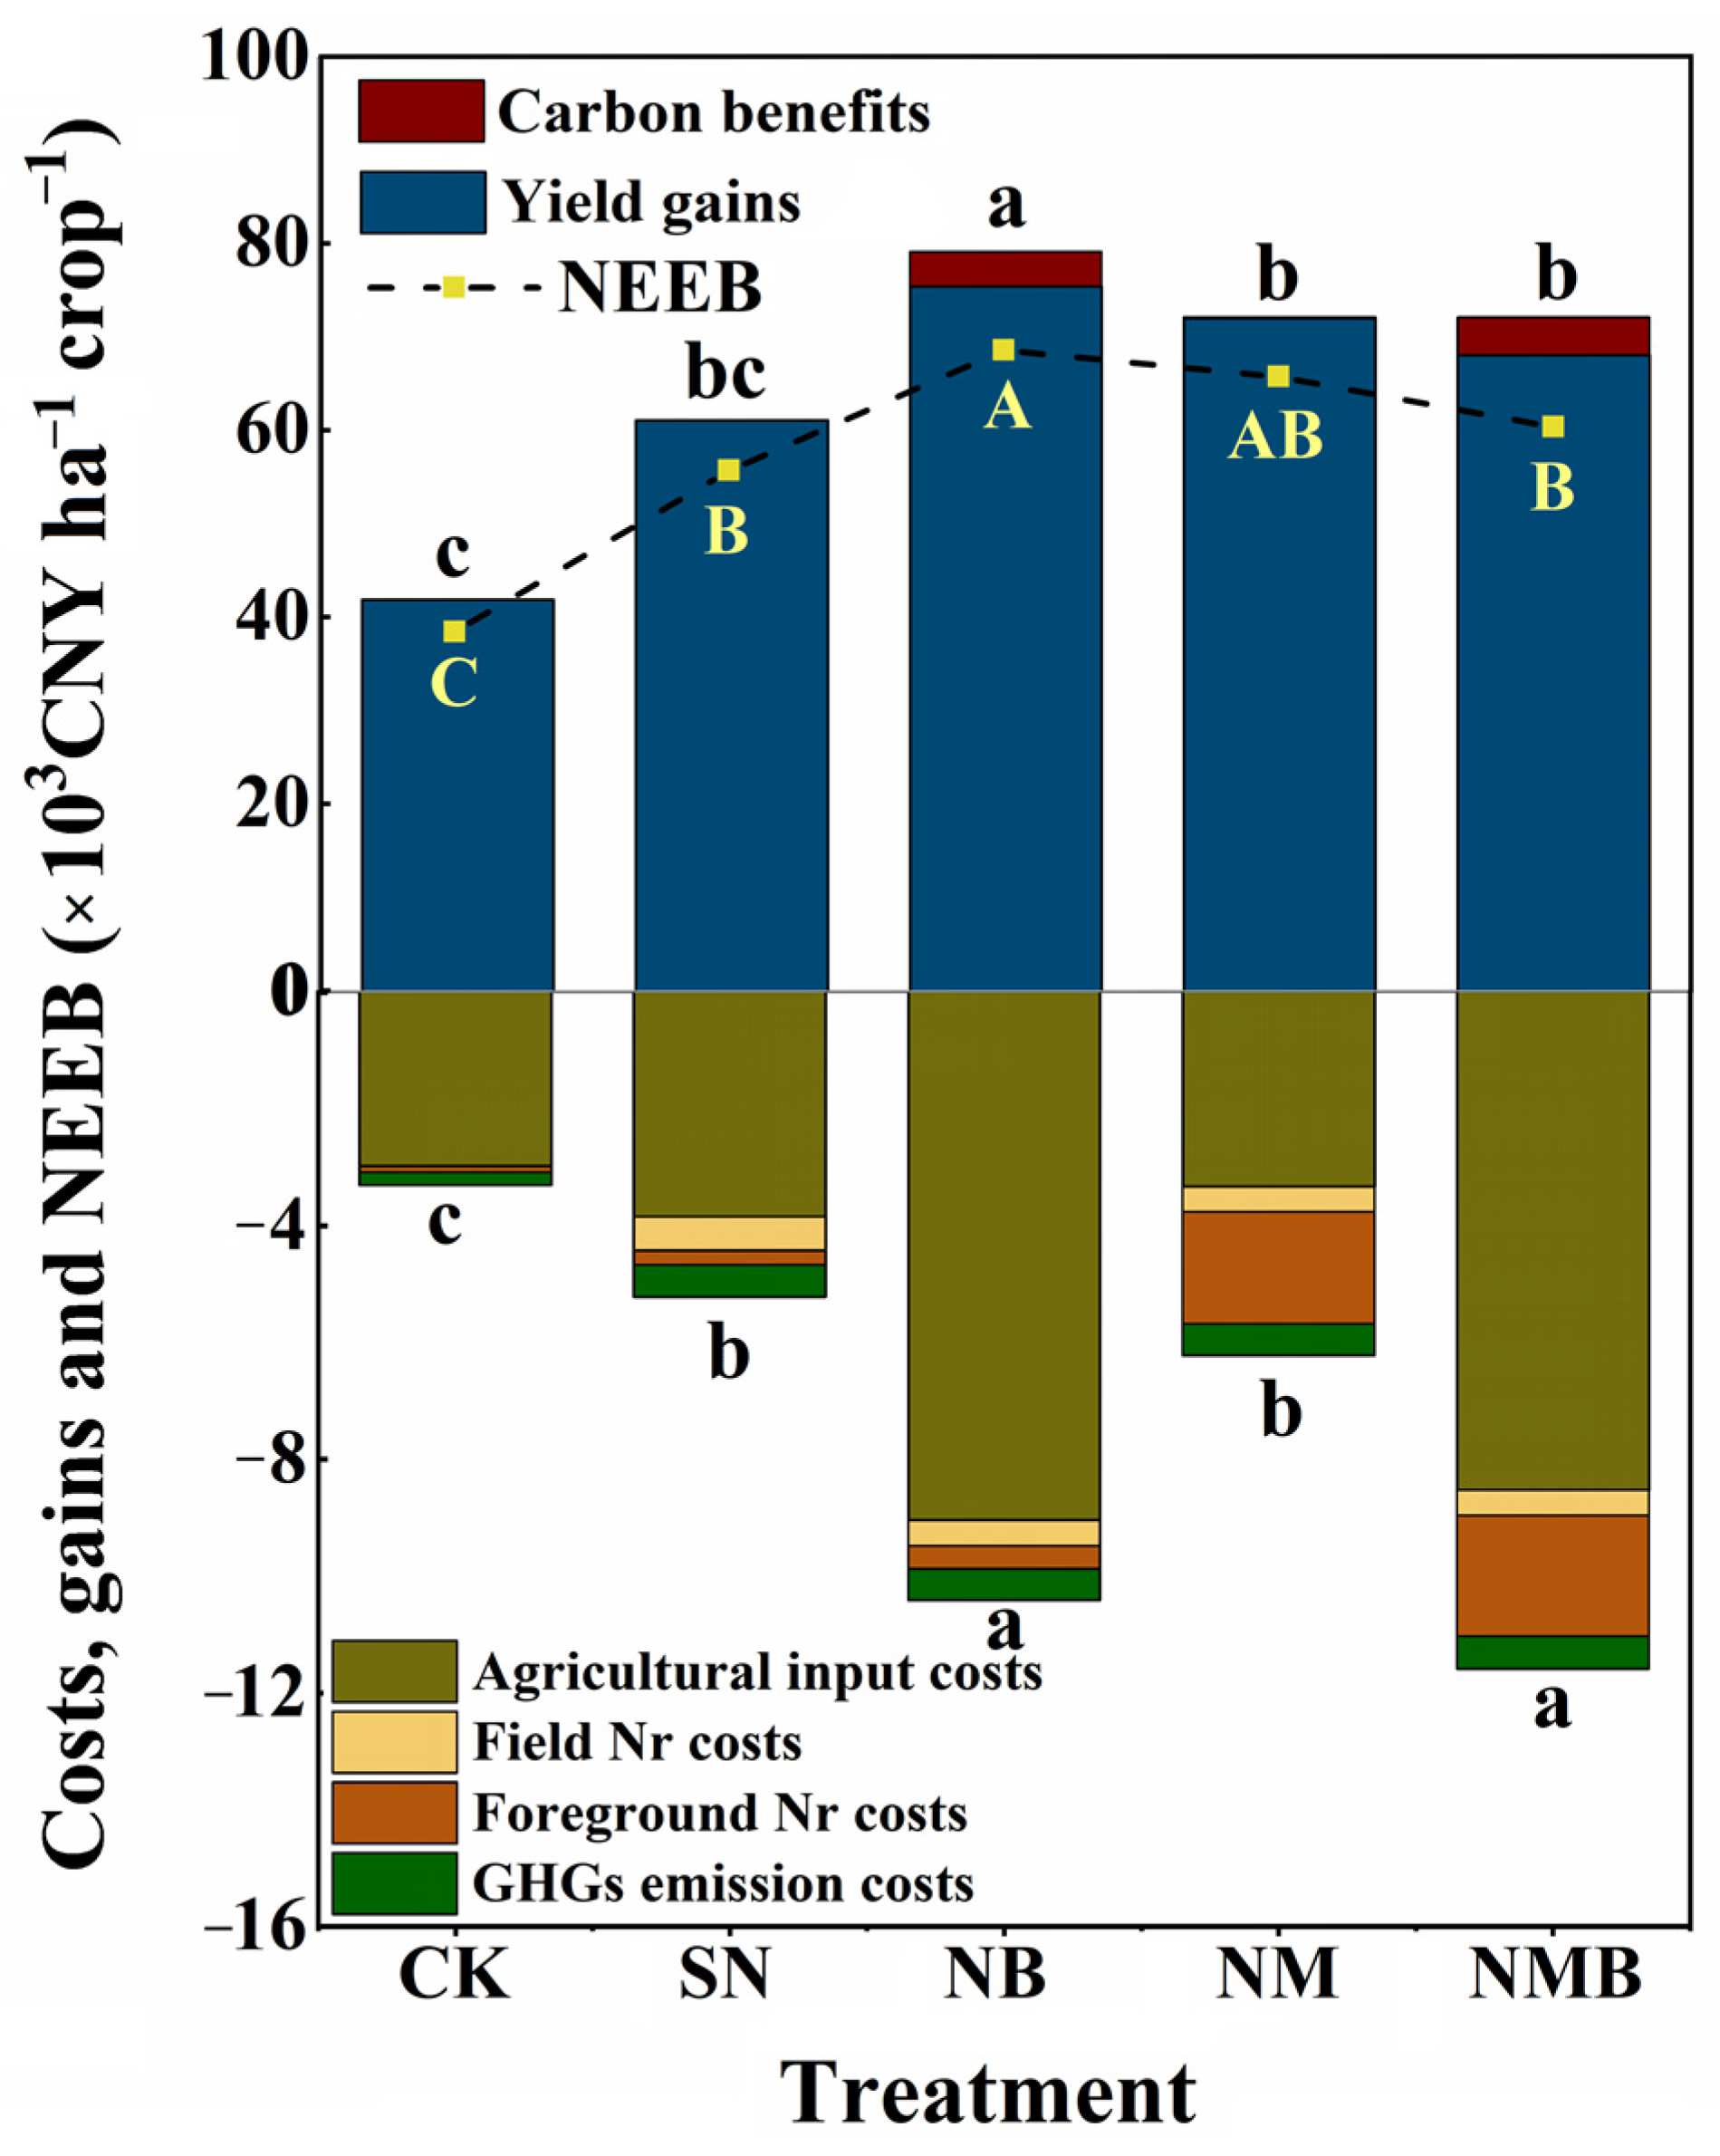
3.3. NEEB of Biochar Amendment and Organic Substitutions
Adopting the newly revised NEEB frames, the NB treatment had the highest NEEB with 68.65 thousand CNY per crop season as the most effective management strategy (Figure 4), which was significantly higher than the SN and NMB treatments, by 23.02% and 13.57%, respectively. It is worth noting that the carbon benefits of the treatments differed significantly, with the NMB treatment being 8.92% higher than the NB treatment, and at the same time about 200 times higher than the SN treatment, which is the primary reason explaining why the NEEB of the NMB was higher than that of the SN. However, the difference between NB and organic substitution alone was not significant, due to the high cost of biochar. On the one hand, the strong stability of biochar can be sequestered in agro-ecosystems for a long period of time, thus reducing the cost of biochar agricultural inputs in this experimental cycle; on the other hand, biochar has a strong carbon sequestration potential. This result emphasizes the importance of considering soil carbon sequestration potential when assessing agro-environmental impacts and demonstrates the advantages of biochar in improving eco-economic benefits.
Figure 4.
Costs, gains and NEEB under different treatments in intensive vegetable production. Different lowercase letters represent significant differences in total costs and total gains, and different uppercase letters represent NEEB (p < 0.05). CK: no fertilizer or biochar addition; SN: synthetic fertilizer application); NB: SN plus 20 t ha−1 biochar amendment; NM: substituting 50% of chemical N fertilizer with organic manure; NMB: NM plus 20 t ha−1 biochar amendment.
4. Discussion
Our newly revised framework incorporates the storage of organic carbon and spans the lifetime of biochar incorporation in the field. Biochar, as a multifunctional soil amendment, not only improves soil quality and crop yields, but also possesses a unique carbon storage function, which give it a huge potential, making it essential for combating climate change and achieving sustainable agriculture [,]. Considering the multiple benefits of biochar, we conclude that biochar is superior to organic substitution in terms of improved benefits and reduced EDC, emerging as the most beneficial practice for NEEB in intensive vegetable production. This finding is consistent with the findings of Lehmann and Joseph [], who emphasized the potential of biochar for improving the economic viability and environmental desirability in agricultural systems. However, this is contrary to our previous preliminary results that we have found that NEEB was significantly better with organic substitution than with biochar addition and that the NEEB was lower with combined application compared to N fertilizer alone. The primary reason for this contradiction is that the study’s inclusion of carbon benefits in the NEEB assessment framework resulted in significantly higher carbon benefits for the NMB treatment compared to the SN treatment. Thus, NEEB was superior to the SN treatment, which suggests that biochar’s ability to sequester carbon makes it uniquely suited for agricultural production. When added to the soil, it is able to conserve carbon stably over a long period of time, thus creating a “carbon sink” in the farmland []. Unlike conventional organic substitutes, biochar can be stabilized in the soil for decades or even centuries, meaning that it can effectively convert atmospheric CO2 into stable carbon in the soil. This long-term carbon sequestration not only helps mitigate climate change, but also creates additional financial gains for farmers in the carbon trading market []. In contrast, while organic matter can increase the SOC content of the soil in the short term, it decomposes more rapidly, and the carbon it fixes is quickly re-released into the atmosphere. Therefore, from the perspective of long-term carbon sequestration benefits, organic alternatives are less beneficial than biochar.
In addition, the multiple benefits of biochar include its positive impact on soil microbial communities. Studies have demonstrated that biochar can provide a favorable habitat for beneficial microorganisms in the soil, promoting their activity and diversity []. These microorganisms play a crucial role in breaking down organic matter, recycling nutrients, and enhancing crop disease resistance, thus indirectly increasing agricultural productivity and soil carbon sequestration rates []. In contrast, while organic alternatives can also improve the soil microbial environment, their effectiveness is limited by the rapid and unstable decomposition of organic matter compared to biochar. Therefore, we believe that biochar is most beneficial to NEEB in intensive vegetable production because of its long-term stability and multifunctionality, making it a more promising strategy for sustainable agricultural management.
For the ultimate NEEB, biochar was higher than the organic substitution, but the difference was not significant. This lack of significance can primarily be attributed to the relatively elevated input costs associated with biochar application, which poses a significant barrier to its widespread adoption []. Therefore, we believe that, through exploring alternative feedstock sources to develop cost-effective production methods, and to achieve an excess of supply over demand for biochar production to reduce purchasing costs, biochar remains the most economically viable strategy. In addition, the combination of organic substitution and biochar exhibited the expected synergistic benefits, which may involve their effects on soil microbial activity and possible changes in the rate of nutrient release from organic fertilizers by biochar [,]. Therefore, further research should explore how to optimize the combined use of these two substances to maximize their contribution to agricultural sustainability and climate change mitigation. In particular, biochar additions significantly enhanced NEEB, suggesting that advantages in soil carbon storage capacity can significantly influence the net economic benefits across the ecosystem. This finding supports the potential for biochar to be used as a sustainable fertilizer treatment option in agricultural practices, particularly in the quest to reduce N footprints and enhance soil health, while providing a more solid scientific basis for its promotion in agricultural production [].
While biochar offers significant advantages in terms of net emission reductions, it is important to recognize the variability and environmental dependence of these results. Their effectiveness can vary depending on soil type, climatic conditions, crop type, and biochar characteristics []. This variability is also reflected in the findings of Jeffery et al. [], who note that the impact of biochar on crop yields and GHG emissions is highly context dependent. Thus, while our study makes a compelling case for a wider adoption of these sustainable practices, it also highlights the need for site-specific assessments to fully realize their potential benefits. For its practical application, site-specific biochar application strategies need to be developed, based on specific agroecosystem characteristics, to maximize its net ecosystem economic benefits. In addition, new research on biochar application should be adopted for considering the emissions resulting from the removal of straw, drying, and transportation to the pyrolysis plant.
In summary, our study emphasizes the need to integrate sustainable practices into agriculture. By recognizing the multifaceted benefits of biochar, including its role in carbon storage, policymakers and farmers can make informed decisions to optimize the ecological and economic outcomes of intensive vegetable production []. Future research should continue to explore the dynamic interactions between biochar, soil health, and crop productivity, further elucidating pathways that might contribute to more resilient and sustainable agricultural systems.
5. Conclusions
This study systematically assessed the superiority of biochar in vegetable production by revising the NEEB framework incorporating new component for its carbon storage benefits. The addition of biochar significantly reduced ecosystem carbon footprints, by promoting carbon storage compared to organic substitution. Meanwhile, it offset part of the input costs by increasing carbon storage benefits, resulting in the highest NEEB, which was significantly higher than that of the N fertilizer alone, but this difference was not significant when compared to the organic substitution. In conclusion, NB is a win-win approach that not only brings considerable economic benefits to farmers, but also promotes sustainable soil development. Given the high purchase cost of biochar, future research and practice should focus more on promoting the production of biochar in abundant supply to reduce the purchase cost.
Author Contributions
R.B.: software, writing; B.W.: software, investigation; X.X.: methodology; Y.D.: resources; Y.J.: data curation; Z.X.: supervision, conceptualization, writing and revision. All authors have read and agreed to the published version of the manuscript.
Funding
We would like to express our heartfelt gratitude to the reviewers and the editor for their constructive comments and suggestions that really improved the manuscript. This work was jointly supported by the National Natural Science Foundation of China (42377292) and the Jiangsu Province Special Project for Carbon Peak & Carbon Neutral Science and Technology Innovations (BE2022309, BE2022421).
Data Availability Statement
Data has been included as additional files and will be made available on reasonable request.
Conflicts of Interest
The authors declare no conflict of interest.
Abbreviations
CEC: Cation exchange capacity; CH4: Methane; CO2: Carbon dioxide; EDCs: Environmental damage costs; GHGs: Greenhouse gases; GPP: Gross primary production; LCA: Life cycle assessment; NEBs: Net economic benefits; NECB: Net ecosystem carbon balance; NEEB: Net ecosystem economic benefit; NH3: Ammonia; N2O: Nitrous oxide; NPP: Net primary productivity; Nr: Reactive nitrogen; Re: Ecosystem respiration; SOC: Soil organic carbon.
References
- Lou, Y.L.; Feng, L.S.; Xing, W.; Hu, N.; Noellemeyer, E.; Cadre, E.L.; Minamikawa, K.; Muchaonyerwa, P.; AbdelRahman, M.A.E.; Pinheiro, É.F.M.; et al. Climate-smart agriculture: Insights and challenges. Clim. Smart Agric. 2024, 1, 100003. [Google Scholar] [CrossRef]
- Liu, Q.; Liu, B.J.; Zhang, Y.H.; Hu, T.L.; Lin, Z.B.; Liu, G.; Wang, X.J.; Ma, J.; Wang, H.; Jin, H.Y.; et al. Biochar application as a tool to decrease soil nitrogen losses (NH3 volatilization, N2O emissions, and N leaching) from croplands: Options and mitigation strength in a global perspective. Glob. Chang. Biol. 2019, 25, 2077–2093. [Google Scholar] [CrossRef] [PubMed]
- Bi, R.; Zhang, Q.; Zhan, L.; Xu, X.; Zhang, X.; Dong, Y.; Yan, X.; Xiong, Z. Biochar and organic substitution improved net ecosystem economic benefit in intensive vegetable production. Biochar 2022, 4, 46. [Google Scholar] [CrossRef]
- Zhou, J.; Li, B.; Xia, L.; Fan, C.; Xiong, Z. Organic-substitute strategies reduced carbon and reactive nitrogen footprints and gained net ecosystem economic benefit for intensive vegetable production. J. Clean. Prod. 2019, 225, 984–994. [Google Scholar] [CrossRef]
- Wu, Z.; Chen, A.; Zhu, S.; Xiong, Z. Assessing nitrous oxide emissions and mitigation potentials from intensive vegetable ecosystems in China—Meta-analysis. J. Agro-Environ. Sci. 2020, 39, 707–714. [Google Scholar]
- Wu, P.; Fu, Y.; Vancov, T.; Wang, H.L.; Wang, Y.J.; Chen, W.F. Analyzing the trends and hotspots of biochar’s applications in agriculture, environment, and energy: A bibliometrics study for 2022 and 2023. Biochar 2024, 6, 78. [Google Scholar] [CrossRef]
- Schmidt, H.P.; Kammann, C.; Hagemann, N.; Leifeld, J.; Bucheli, T.D.; Sánchez Monedero, M.A.; Cayuela, M.L. Biochar in agriculture–A systematic review of 26 global meta-analyses. GCB Bioenergy 2021, 13, 1708–1730. [Google Scholar] [CrossRef]
- Ghorbani, M.; Amirahmadi, E. Biochar and soil contributions to crop lodging and yield performance—A meta-analysis. Plant Physiol. Bioch. 2024, 215, 109053. [Google Scholar] [CrossRef]
- Tan, Z.X.; Lin, C.S.K.; Ji, X.Y.; Rainey, T.J. Returning biochar to fields: A review. Appl. Soil Ecol. 2017, 116, 1–11. [Google Scholar] [CrossRef]
- Zhang, A.F.; Cui, L.Q.; Pan, G.X.; Li, L.Q.; Hussain, Q.; Zhang, X.H.; Zheng, J.W.; Crowley, D. Effect of biochar amendment on yield and methane and nitrous oxide emissions from a rice paddy from Tai Lake plain, China. Agric. Ecosyst. Environ. 2010, 139, 469–475. [Google Scholar] [CrossRef]
- Ying, H.; Ye, Y.; Cui, Z.; Chen, X. Managing nitrogen for sustainable wheat production. J. Clean. Prod. 2017, 162, 1308–1316. [Google Scholar] [CrossRef]
- Lehmann, J.; Cowie, A.; Masiello, C.A.; Kammann, C.; Woolf, D.; Amonette, J.E.; Cayuela, M.L.; Camps-Arbestain, M.; Whitman, T. Biochar in climate change mitigation. Nat. Geosci. 2021, 14, 883–892. [Google Scholar] [CrossRef]
- Zhang, W.; Dou, Z.; He, P.; Ju, X.; Powlson, D.; Chadwick, D.; Norse, D.; Lu, Y.; Zhang, Y.; Wu, L.; et al. New technologies reduce greenhouse gas emissions from nitrogenous fertilizer in China. Proc. Natl. Acad. Sci. USA 2013, 110, 8375–8380. [Google Scholar] [CrossRef] [PubMed]
- Liu, T.Q.; Li, S.H.; Guo, L.G.; Cao, C.G.; Li, C.F.; Zhai, Z.B.; Zhou, J.Y.; Mei, Y.M.; Ke, H.J. Advantages of nitrogen fertilizer deep placement in greenhouse gas emissions and net ecosystem economic benefits from no-tillage paddy fields. J. Clean. Prod. 2020, 263, 121322. [Google Scholar] [CrossRef]
- Xu, H.; Cai, A.D.; Wu, D.; Liang, G.P.; Xiao, J.; Xu, M.G.; Colinet, G.; Zhang, W.J. Effects of biochar application on crop productivity, soil carbon sequestration, and global warming potential controlled by biochar C:N ratio and soil pH: A global meta-analysis. Soil Till. Res. 2021, 213, 105125. [Google Scholar] [CrossRef]
- Nepal, J.; Ahmad, W.; Munsif, F.; Khan, A.; Zou, Z.Y. Advances and prospects of biochar in improving soil fertility, biochemical quality, and environmental applications. Front. Environ. Sci. 2023, 11, 1114752. [Google Scholar] [CrossRef]
- Sun, T.; Li, D.P.; Yan, C.X.; Dong, S.K.; Jia, H.T.; Tang, G.M.; Xu, W.L. Effect of different pyrolysis temperature and time on characteristics of straw-biochar. J. Arid Land Res. Environ. 2019, 33, 110–116. [Google Scholar]
- IPCC. Climate Change 2021: The Physical Science Basis. Contribution of Working Group I to the Sixth Assessment Report of the Intergovernmental Panel on Climate Change; IPCC: Geneva, Switzerland, 2021. [Google Scholar]
- Brown, G.G.; Silva, E.; Thomazini, M.J.; Niva, C.C.; Decaëns, T.; Cunha, L.F.N.; Nadolny, H.; Demetrio, W.C.; Santos, A.; Ferreira, T.; et al. The Role of Soil Fauna in Soil Health and Delivery of Ecosystem Services. In Managing Soil Health for Sustainable Agriculture; Burleigh Dodds Science Publishing Limited: Cambridge, UK, 2018; Volume 1, pp. 197–241. [Google Scholar]
- Ciais, P.; Wattenbach, M.; Vuichard, N.; Smith, P.; Piao, S.L.; Don, A. The European carbon balance Part 2: Croplands. Glob. Chang. Biol. 2010, 16, 1409–1428. [Google Scholar] [CrossRef]
- Ma, Y.C.; Kong, X.W.; Yang, B.; Zhang, X.L.; Yan, X.Y.; Yang, J.C.; Xiong, Z.Q. Net global warming potential and greenhouse gas intensity of annual rice–wheat rotations with integrated soil–crop system management. Agric. Ecosyst. Environ. 2013, 164, 209–219. [Google Scholar] [CrossRef]
- Lehmann, J. A handful of carbon. Nature 2007, 447, 143–144. [Google Scholar] [CrossRef]
- Li, B.; Fan, C.H.; Zhang, H.; Chen, Z.Z.; Sun, L.Y.; Xiong, Z.Q. Combined effects of nitrogen fertilization and biochar on the net global warming potential, greenhouse gas intensity and net ecosystem economic budget in intensive vegetable agriculture in southeastern China. Atmos. Environ. 2015, 100, 10–19. [Google Scholar] [CrossRef]
- Zhang, L.; Yu, D.; Shi, X.; Weindorf, D.C.; Zhao, L.; Ding, W.; Wang, H.; Pan, J.; Li, C. Simulation of global warming potential (GWP) from rice fields in the Tai-Lake region, China by coupling 1: 50,000 soil data bases with DNDC model. Atmos. Environ. 2009, 43, 2737–2746. [Google Scholar] [CrossRef]
- Gregory, P.J. Roots, rhizosphere and soil: The route to a better understanding of soil science. Eur. J. Soil Sci. 2006, 57, 2–12. [Google Scholar] [CrossRef]
- Xia, L.; Lam, S.; Chen, D.; Wang, J.; Tang, Q.; Yan, X. Can knowledge-based n management produce more staple grain with lower greenhouse gas emission and reactive nitrogen pollution? a meta-analysis. Glob. Chang. Biol. 2016, 23, 1917–1925. [Google Scholar] [CrossRef]
- Xia, Y.; Yan, X. Ecologically optimal nitrogen application rates for rice cropping in the Taihu Lake Region of China. Sustain. Sci. 2012, 7, 33–44. [Google Scholar] [CrossRef]
- Xiang, Y.Z.; Deng, Q.; Duan, H.L.; Guo, Y. Effects of biochar application on root traits: A meta-analysis. GCB Bioenergy 2017, 9, 1563–1572. [Google Scholar] [CrossRef]
- Ghorbani, M.; Neugschwandtner, R.W.; Soja, G.; Konvalina, P.; Kopecký, M. Carbon fixation and soil aggregation affected by biochar oxidized with hydrogen peroxide: Considering the efficiency of pyrolysis temperature. Sustainability 2023, 15, 7158. [Google Scholar] [CrossRef]
- Lehmann, J.; Joseph, S. Biochar for Environmental Management: Science, Technology and Implementation; Routledge: London, UK, 2015. [Google Scholar]
- Huang, Y.W.; Tao, B.; Lal, R.; Lorenz, K.; Jacinthe, P.A.; Shrestha, R.K.; Bai, X.X.; Singh, M.P.; Lindsey, L.E.; Ren, W. A global synthesis of biochar’s sustainability in climate - smart agriculture - Evidence from field and laboratory experiments. Renew. Sust. Energ. Rev. 2023, 172, 113042. [Google Scholar] [CrossRef]
- Pokharel, P.; Ma, Z.; Chang, S.X. Biochar increases soil microbial biomass with changes in extra- and intracellular enzyme activities: A global meta-analysis. Biochar 2020, 2, 65–79. [Google Scholar] [CrossRef]
- Zhang, L.; Jing, Y.; Xiang, Y.; Zhang, R.; Lu, H. Responses of soil microbial community structure changes and activities to biochar addition: A meta-analysis. Sci. Total Environ. 2018, 643, 926–935. [Google Scholar] [CrossRef]
- Gomiero, T.; Pimentel, D.; Paoletti, M.G. Environmental impact of different agricultural management practices: Conventional vs. organic agriculture. Crit. Rev. Plant Sci. 2011, 30, 95–124. [Google Scholar] [CrossRef]
- Zhang, Z.; Dong, X.; Wang, S.; Pu, X. Benefts of organic manure combined with biochar amendments to cotton root growth and yield under continuous cropping systems in Xinjiang, China. Sci. Rep. 2020, 10, 4718. [Google Scholar]
- Osman, A.I.; Hefny, M.; Maksoud, M.A.; Elgarahy, A.M.; Rooney, D.W. Recent advances in carbon capture storage and utilisation technologies: A review. Environ. Chem. Lett. 2020, 19, 797–849. [Google Scholar] [CrossRef]
- Agegnehu, G.; Srivastava, A.K.; Bird, M.I. The role of biochar and biochar-compost in improving soil quality and crop performance: A review. Appl. Soil Ecol. 2017, 119, 156–170. [Google Scholar] [CrossRef]
- Jeffery, S.; Verheijen, F.G.A.; van der Velde, M.; Bastos, A.C. A quantitative review of the effects of biochar application to soils on crop productivity using meta-analysis. Agric. Ecosyst. Environ. 2011, 144, 175–187. [Google Scholar] [CrossRef]
- Woolf, D.; Amonette, J.; Street-Perrott, F.; Lehmann, J.; Joseph, S. Sustainable biochar to mitigate global climate change. Nat. Commun. 2010, 1, 56. [Google Scholar] [CrossRef]
Disclaimer/Publisher’s Note: The statements, opinions and data contained in all publications are solely those of the individual author(s) and contributor(s) and not of MDPI and/or the editor(s). MDPI and/or the editor(s) disclaim responsibility for any injury to people or property resulting from any ideas, methods, instructions or products referred to in the content. |
© 2024 by the authors. Licensee MDPI, Basel, Switzerland. This article is an open access article distributed under the terms and conditions of the Creative Commons Attribution (CC BY) license (https://creativecommons.org/licenses/by/4.0/).