Abstract
Drought is a major limiting factor in the cultivation of Sophora alopecuroides in China’s arid and semi-arid regions. This study aimed to identify drought-resistant S. alopecuroides ecotypes and explore key drought tolerance indicators during germination by simulating drought conditions with a 10% PEG-6000 solution, using pure water as a control. Determination of seven germination indicators for S. alopecuroides, including germination rate (GR), germination energy (GE), germination index (GI), vigor index (VI), promptness index (PI), fresh weight (FW), and dry weight (DW), was conducted. Principal component analysis (PCA), membership function, cluster analysis, and linear regression were employed to comprehensively evaluate the drought resistance of thirty-five S. alopecuroides ecotypes. The results showed that drought stress caused reductions in six of the seven indicators across all ecotypes, except for DW, compared to the control. Correlation analysis revealed varying relationships among the indicators, with most showing significant or highly significant correlations. PCA reduced the seven indicators to two independent comprehensive factors, with a cumulative contribution rate of 83.99%. Based on the D-value and cluster analysis, the thirty-five ecotypes were ranked for drought resistance and classified into four categories. The top five drought-tolerant genotypes during the germination stage were identified as Yutian, Alar, Jinghe, Baoding, and Guyuan. Moreover, the stepwise regression model was established and demonstrated that GR, GE, PI, FW, and DW are key indicators for screening and identifying drought-resistant S. alopecuroides ecotypes. This study offers a comprehensive and reliable method for evaluating drought resistance in S. alopecuroides ecotypes and provides a reference for selecting ecotypes for artificial cultivation in Northwestern China.
1. Introduction
Sophora alopecuroides, a perennial leguminous herb, is mainly found along the desert margins in Northwestern China, where it plays crucial ecological roles in wind erosion control, sand stabilization, and soil and water conservation [1,2]. Additionally, the seeds of S. alopecuroides have been used in traditional Chinese medicine for centuries, possessing various medicinal properties such as antibacterial, anti-inflammatory, wind-dampness expelling, heat-clearing, detoxification, and immunoregulation [3,4,5]. S. alopecuroides also holds significant potential in biopesticides [6], green manure [7], and high-quality forage [8]. However, with ongoing research in these fields, the limited availability of wild S. alopecuroides has led to a substantial market demand. Consequently, artificial cultivation of S. alopecuroides has become increasingly crucial [9].
In China, the Northwest region is one of the areas most frequently and severely affected by drought [10]. Due to low precipitation and high evaporation rates, drought has become a major environmental factor limiting plant distribution and growth in this region [11]. The impact of drought stress on plants depends on the characteristics of the stress and the developmental stage at which it occurs [12]. Seed germination is the first step in plant growth, and drought stress can impede water uptake, inhibit metabolic activities, and cause cellular damage. This results in a reduced germination rate, delayed peak germination, and weakened seed vigor [13,14,15]. Therefore, seeds that can successfully germinate under adverse conditions exhibit stronger stress tolerance, which is crucial for the establishment and development of the plant [16,17].
The evaluation of drought tolerance during the seed germination stage mainly uses a PEG-6000 solution to simulate drought conditions. This method is widely applied due to its simplicity and relatively accurate control of stress levels compared to other methods [18,19,20,21]. Additionally, the laboratory identification method assesses drought tolerance by measuring indicators such as germination potential, germination rate, germination index, dry weight, and fresh weight. This approach is not only convenient and efficient but also significantly shortens the evaluation period [22,23]. Furthermore, indicators like the promptness index and vigor index provide valuable insights into the speed and uniformity of seed germination, aiding in the assessment of seed vigor and growth potential [24]. Previous studies have studied the drought tolerance of S. alopecuroides from germination characteristics [25,26], seedling growth [27], and related molecular mechanisms [28,29]. However, the screening of drought-tolerant S. alopecuroides ecotypes has not been reported.
Ecotypes screening typically uses a combination of principal component analysis (PCA), membership function, and cluster analysis, with a primary focus on agronomic and field crops such as Oryza sativa [30], Zea mays [23], Cicer arietinum [31], Brassica napus [32], and Lens culinaris [20]. PCA can simplify multiple variables into a few latent factors with minimal information loss [33]. Meanwhile, the membership function method can eliminate the one-sidedness of single indicators, allowing for the comparability of drought tolerance across all tested materials. It also integrates different drought resistance coefficients, effectively reflecting the overall performance of plants under drought stress [33,34]. Cluster analysis typically assesses the similarity between different ecotypes by measuring the Euclidean distance; a shorter Euclidean distance indicates a higher similarity among ecotypes, thereby categorizing them into different drought tolerance levels [35,36]. Additionally, plant tolerance to drought is a comprehensive expression of multiple factors [37,38,39], making it limited in evaluating drought tolerance using a single indicator. Therefore, combining various statistical analysis methods and integrating multiple indicators is an effective approach for selecting high-quality germplasm resources.
In this study, thirty-five S. alopecuroides ecotypes collected from different habitats were used to simulate drought stress with a PEG-6000 solution. Correlation analysis, PCA, membership function analysis, cluster analysis, and linear regression analysis were used to identify key indicators of drought tolerance and to screen ecotypes with strong drought tolerance potential during the germination period of S. alopecuroides. This study will provide a reference for selecting ecotypes for artificial cultivation of S. alopecuroides in arid and semi-arid regions and provide a rapid and comprehensive identification method for the evaluation of the drought tolerance of S. alopecuroides at the germination stage.
2. Materials and Methods
2.1. Experimental Plant Material
The thirty-five ecotypes of S. alopecuroides were all wild ecotypes, collected from six provinces in China: Xinjiang, Gansu, Hebei, Inner Mongolia, Ningxia, and Shaanxi. Among them, 26 ecotypes were sourced from Xinjiang. Seeds were collected from August to September 2023 (S. alopecaroides maturity stage). After collection, the seeds were naturally air-dried and threshed, then stored in a cool, dry indoor environment (Table 1).

Table 1.
Source of thirty-five Sophora alopecuroides materials.
2.2. Experimental Design
For each genotype, seeds that were plump and uniform in size were selected. The seeds were treated with 98% H2SO4 for 30 min to soften the seed coat, then rinsed 5–6 times with distilled water and air-dried indoors for later use [28]. The seeds were soaked in distilled water for 24 h, sterilized with 10% sodium hypochlorite for 10 min, and thoroughly rinsed with distilled water. Fifty seeds were placed in each petri dish, which was lined with two layers of filter paper. The dishes were covered to prevent moisture loss. The filter paper was changed every 3 days and the corresponding solution was filled with 10 mL of PEG-6000 solution with a mass fraction of 10%. Based on previous studies [25] and preliminary tests, the treatment group was subjected to drought stress simulated by a 10% PEG-6000 solution (T), while the control group (CK) received an equal amount of distilled water. Each treatment was replicated three times. The seed germination experiment was carried out in the laboratory of Shihezi University (44°19′ N, 86°4′ E). The petri dishes were placed in the light incubator (LRH-300-G) with a photoperiod of 14/10 h (day/night), a temperature cycle of 25/20 °C (day/night), and a light intensity of 12,000/0 Lx.
2.3. Germination Indicators
The number of germinated seeds was recorded every 24 h, with germination defined as the emergence of the radicle. The experiment ended after three consecutive days with no change in germination rate, lasting a total of 14 days. Germination energy (GE) was recorded on Day 4 when the number of germinated seeds peaked, and the final germination rate (GR) was calculated on Day 14. After 14 days, ten randomly selected germinated seeds from each ecotype were weighed for fresh weight (FW) using a precision electronic balance accurate to 0.001 g. After measuring FW, dry the sample to a constant weight using a forced-air drying oven (first at 105 °C for 30 min for initial deactivation, then at 70 °C for drying) and then measure the dry weight (DW). The GR, GE, germination index (GI), vigor index (VI), and promptness index (PI) of S. alopecuroides were calculated according to the methods described by Li et al. [40] and Bouslama et al. [41].
GR (%) = total germination number/the total number of seeds × 100%
GE (%) = number of germinated seeds on the 4th day/the total number of seeds × 100%
In the formula, Gt denotes the number of seeds germinated on the t day, and Dt denotes the corresponding days of germination test.
VI = GI × FW
PI = 1.00 G2 + 0.75 G4 + 0.50 G6 + 0.25 G8
In the formula, G2, G4, G6, G8 were the seed germination rate of S. alopecuroides ecotypes on the 2nd, 4th, 6th, and 8th day, respectively.
2.4. Data Processing and Statistical Analysis
The indicator drought tolerance coefficient (DC) was calculated according to Formula (6), where CKi and Ti represent the indicator measure values of control and drought treatment, respectively [42].
DC = Ti/CKi
For the DC value of each indicator, correlation analysis and principal component analysis were performed. PCA extracts jth principal components based on the criterion of eigenvalues greater than one, and obtains a new comprehensive index value (Cj), (j = 1, 2, 3, …, n). Subsequently, according to Formulas (7) and (8), calculate the factor weight coefficients (Wj) and membership function values (μ (Xj)) of the comprehensive index value (Cj), respectively [42,43,44].
μ (Xj) = (Xj − Xj min)/(Xj max − Xj min) j = 1, 2, 3, …, n
In the formula, µ (Xj) represents the membership function value of the jth comprehensive index (Cj), Xj represents the jth comprehensive index value (Cj), Xmax represents the maximum value of the jth comprehensive index (Cj), and Xmin represents the minimum value of the jth comprehensive index (Cj).
The comprehensive evaluation value (D-value) was calculated according to Formula (9).
In the formula, represents the weight of the jth comprehensive index in all comprehensive indices, and represents the contribution rate of the jth comprehensive index.
Cluster analysis was then performed based on the D-value, classifying the drought tolerance levels of S. alopecuroides at a Euclidean distance of 5. Finally, a stepwise regression analysis was conducted with the D-value as the dependent variable and the DC values of each indicator, and the regression equation was computed [43,44,45].
2.5. Date Analysis
Data analysis was performed using Excel 2019 (Version 16.0), mapping with OriginPro 2022 (Version 9.9.5). PCA, cluster analysis, and linear regression were performed with SPSS 27.0 (Version 27.0.1.0). The Pearson correlation coefficient was used to assess the correlation of germination indicators from different S. alopecuroides ecotypes.
3. Results
3.1. Diversity Analysis of Germination Indicators of Sophora alopecuroides from Different Ecotypes
The diversity analysis of germination indicators for S. alopecuroides from all ecotypes revealed substantial variation in the dispersion of germination indicators data across different treatments (Table 2 and Figure 1). The coefficient of variation (CV) for the control group ranged from 0.152 to 0.475, while that for the drought treatment group ranged from 0.111 to 0.714, showing a significant difference between the two. The mean and standard error for GR, GE, GI, VI, PI, and FW were all lower in the treatment group compared to the control group. The GR, PI, and FW in the drought stress group showed slight reductions, with mean values 36.96%, 49.39%, and 14.58% lower than the control group, respectively. GE, GI, and VI exhibited significant reductions, with mean values 55.42%, 66.71%, and 69.35% lower than the control group, respectively. The mean DW in the treatment group increased by 33.33% compared to the control group.
Table 2.
Diversity analysis of germination indicators of S. alopecuroides from different ecotypes.
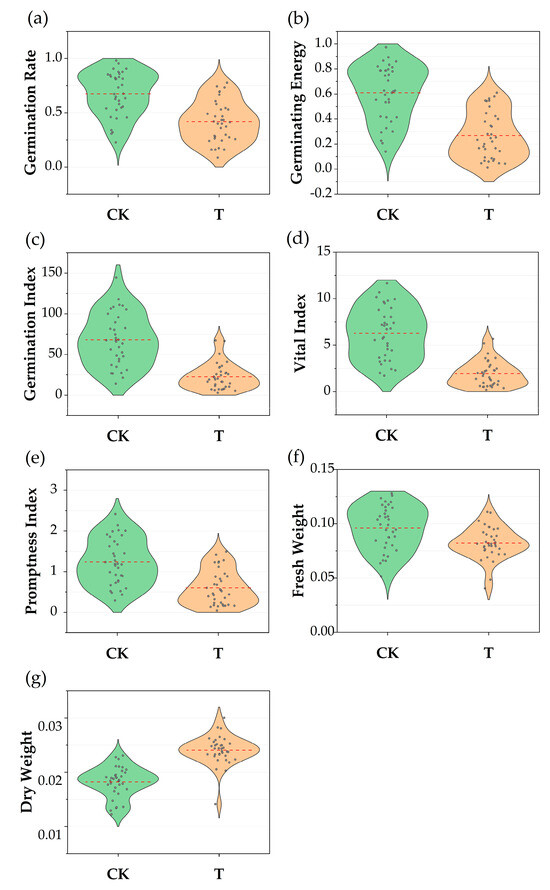
Figure 1.
Comparison of seven germination indicators of Sophora alopecuroides under different treatments. CK: control check group; T: treatment group; (a) germination rate comparison; (b) germination energy comparison; (c) germination index comparison; (d) vigor index comparison; (e) promptness index comparison (f) fresh weight comparison; (g) dry weight comparison.
3.2. Evaluation of Drought Tolerance Indicator Coefficients of S. alopecuroides
The DC of various indicators exhibited varying degrees of variation among the S. alopecuroides ecotypes (Table 3). The DC for GE, GI, VI, and PI displayed significant variability, ranging from 0.041 to 0.933, 0.066 to 0.950, 0.057 to 0.933, and 0.062 to 1.564, with mean values of 0.443, 0.351, 0.320, and 0.526, respectively. The CV ranged from 0.569 to 0.614. In contrast, the DC for GR, FW, and DW exhibited less variability, ranging from 0.165 to 0.942, 0.553 to 1.295, and 1.504 to 1.948, with mean values of 0.620, 0.883, and 1.342, respectively. The CV ranged from 0.148 to 0.319.
Table 3.
Drought tolerance coefficient (DC) of S. alopecuroides from different ecotypes.
3.3. Correlation Analysis of Drought Tolerance Coefficient
Correlation analysis revealed varying degrees of correlation among the indicators (Figure 2). GR was significantly correlated with GE (0.842), GI (0.616), VI (0.694), PI (0.711), and FW (0.530) (p < 0.01), as well as with DW (0.356) (p < 0.05). GE was significantly correlated with GI (0.840), VI (0.891), PI (0.818), and FW (0.497) (p < 0.01). GI was significantly correlated with VI (0.943) and PI (0.867) (p < 0.01). VI was significantly correlated with PI (0.878) (p < 0.01) and FW (0.421) (p < 0.05). FW was significantly correlated with DW (0.471) (p < 0.01).
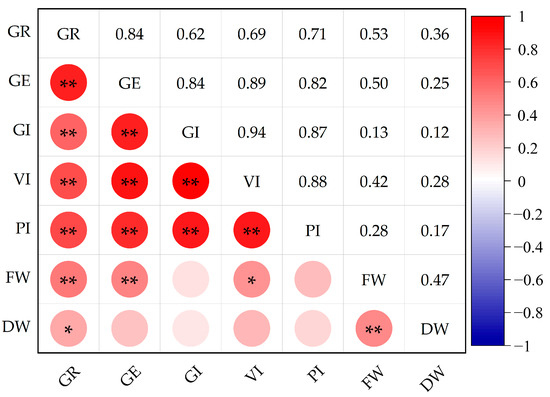
Figure 2.
Correlation of DC of each indicator of leaf lettuce varieties. GR: germination rate; GE: germination energy; GI: germination index; VI: vigor index; PI: promptness index; FW: fresh weight; DW: dry weight. ** In 0.01 level (double-stern), the correlation is significant; * Significant correlation at 0.05 level (double-stern). The same applies to the figures below.
3.4. Principal Component Analysis of Drought Tolerance Coefficient
PCA reduced the DC of the indicators to two independent comprehensive indicators, with contribution rates of 65.11% and 18.88% (Figure 3), respectively, and a cumulative contribution rate of 83.99%. Eigenvalues were ≥1.321 (Table 4). In the first principal component, VI (0.209), GE (0.210), PI (0.198), GI (0.193), and GR (0.189) showed higher loadings. In the second principal component, FW (0.527) and DW (0.563) had higher loadings.
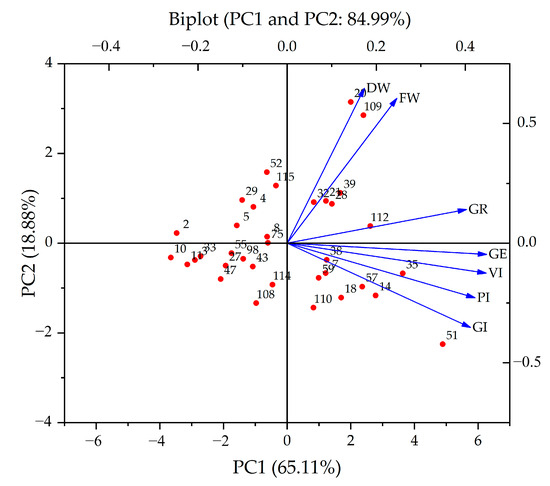
Figure 3.
The biplots display the positions of S. alopecuroides individuals from various ecotypes.
Table 4.
Eigenvectors and contribution rates of all indicators in S. alopecuroides ecotypes by principal component analysis (PCA).
3.5. Analysis of Membership Function Value and Comprehensive Evaluation of D-Value
Membership function values were calculated using the comprehensive indicators (C1, C2) derived from the PCA (Formula (7)). Based on the contribution rates of the comprehensive indicators, the weights for the two indicators were calculated as 77.52% and 22.47% (Formula (8)). The D-value was obtained by multiplying the membership function values by their respective weights, summing the products (Formula (9)), and then ranking the results. The D-value ranged from 0.775 to 0.080. According to the D-value, the top five ecotypes were 23, 31, 11, 18, and 13, with D-values of 0.775, 0.762, and 0.738, respectively, while the bottom three were 8, 1, and 7, with D-values of 0.121, 0.119, and 0.080, respectively (Table 5).
Table 5.
The comprehensive index value, membership function value, and comprehensive evaluation of D-values of S. alopecuroides from different ecotypes.
3.6. Cluster Analysis and Drought Resistance Classification
The thirty-five S. alopecuroides ecotypes were divided into four groups at a Euclidean distance of 5 (Figure 4). Group 1 consisted of five particularly drought-tolerant ecotypes (11, 18, 23, 31, 33) with D-values ranging from 0.775 to 0.678, representing 14.29% of the total. Group 2 comprised 13 ecotypes with moderate drought tolerance (9, 20, 14, 26, 12, 10, 19, 16, 5, 32, 35, 24, 27), with D-values between 0.629 and 0.443, accounting for 37.14%. Group 3 contained 12 drought-tolerant ecotypes (15, 34, 6, 28, 3, 13, 22, 29, 30, 4, 21, 25) with D-values ranging from 0.374 to 0.202, making up 34.29% of the total. Finally, Group 4 included five drought-sensitive ecotypes (1, 8, 2, 17, 7) with D-values between 0.166 and 0.080, comprising 14.29% of the total.
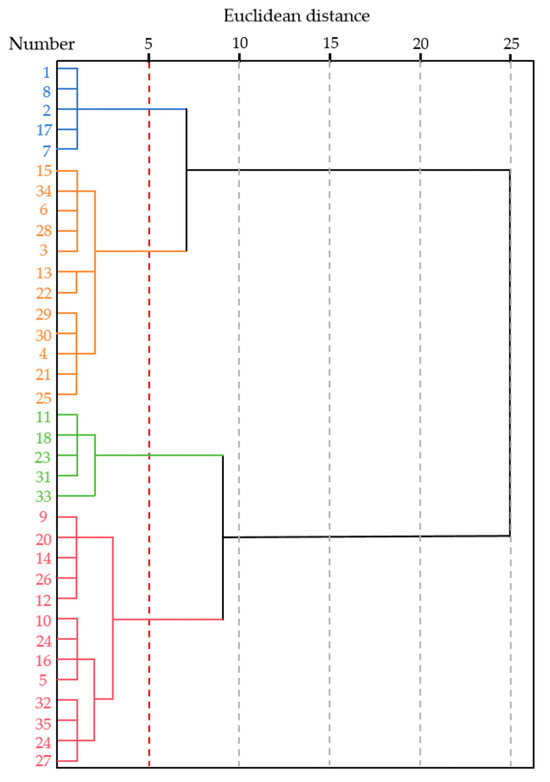
Figure 4.
Cluster diagram of drought resistance of S. alopecuroides ecotypes based on D-value. Different colors represent different groups. Green represents Group 1; red represents Group 2; orange represents Group 3; bule represents Group 4.
3.7. Classification of Germination Indicators and D-Value of Sophora alopecuroides Ecotypes
Based on the results of the cluster analysis, the average values of the germination indicators and D-value for all ecotypes in each group were calculated (Table 6). The results indicate that the average values of GR, GE, GI, VI, PI, FW, DW, and the D-values gradually decrease from group 1 (particularly drought-tolerant ecotypes) to group 4 (drought-sensitive ecotypes).
Table 6.
Mean values of germination indicators and D-value for S. alopecuroides ecotypes classified into four drought tolerance levels.
3.8. Stepwise Regression Analysis
Stepwise regression analysis was conducted with the D-value in Table 5 as the dependent variable and the DC of the seven germination indicators under drought stress as the independent variables. The optimal regression equation was established as follows: y = −0.385 + 0.129 × GR + 0.325 × GE + 0.156 × PI + 0.202 × FW + 0.243 × DW (R2 = 0.991, p < 0.01). Regression analysis excluded GI and VI from the seven indicators, with the remaining five reaching a highly significant level (p < 0.01). A linear analysis was performed between the D-value and the regression value D’ of the thirty-five S. alopecuroides ecotypes, yielding R2 = 0.991 (Figure 5).
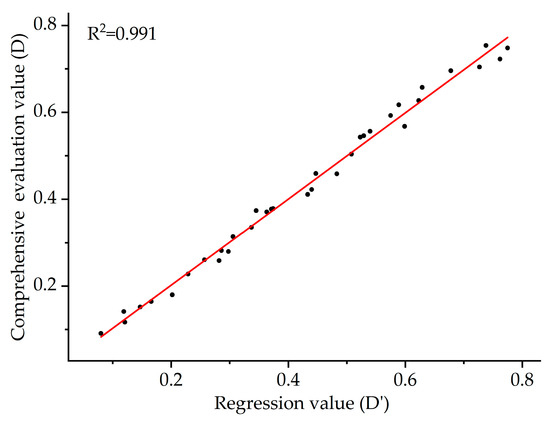
Figure 5.
Linear analysis of comprehensive evaluation D-value and regression value D’ of S. alopecuroides from different ecotypes.
Additionally, the prediction accuracy of the regression equation was evaluated in terms of prediction error and prediction accuracy (Table 7). The prediction error for S. alopecuroides ecotypes ranged from 0.002 to 0.039, with 91.43% of the ecotypes showing a prediction accuracy greater than 90%. The prediction accuracy for 5, 6, and 11 ecotypes was the highest at 99.21%, 98.98%, and 97.86%, respectively. In contrast, the prediction accuracy for 22, 1, and 7 ecotypes was lower, at 88.89%, 86.86%, and 81.62%, respectively.
Table 7.
Evaluation accuracy analysis of regression equation.
4. Discussion
Drought stress inhibited seed imbibition, reduced water absorption, and suppressed cellular division activities, which in turn led to a decrease in observed germination parameters [46]. In this study, drought stress resulted in a noticeable reduction in various germination indicators of different S. alopecuroides ecotypes (Figure 1), consistent with the findings of Wang et al. [26]. However, the DW showed a certain degree of increase, potentially due to the continuous proliferation, expansion of the radicle, and accelerated root growth in response to drought stress resulting in a higher DW under stress conditions compared to the control treatment [47]. Similar observations were reported in the studies on Zea mays by Badr et al. [23] and on Triticum aestivum by Ghosh et al. [48] The DC can eliminate the differences in germination characteristics among different ecotypes [12]. In this study, the DC of GE, GI, VI, and PI exhibited significant variation (Table 2), indicating that these germination parameters are sensitive to drought stress. The DC ranged from 0.148 to 0.614, suggesting variability in drought tolerance among different ecotypes and a rich genetic background of the selected S. alopecuroides ecotypes, which is in line with the findings of Li et al. [44]. Furthermore, correlation analysis indicated a highly significant relationship (p < 0.01) between GR, GE, and PI. These indicators should be given special attention as they can serve as important criteria for the future evaluation and breeding of S. alopecuroides ecotypes.
To minimize inherent variation among ecotypes, a relative value method was used to evaluate the germination performance of different S. alopecuroides ecotypes under drought stress. However, drought tolerance is a complex trait influenced by multiple factors, and assessments based solely on a single indicator may lead to inaccuracies. Therefore, it is crucial to identify more comprehensive plant evaluation indicators and adopt appropriate evaluation methods. Currently, the method combining PCA with membership function analysis and cluster analysis has been widely applied in crop ecotypes selection [48,49,50], enhancing the reliability and practicality of crop stress tolerance evaluation. In this study, PCA was employed to recombine the seven germination indicators into two independent comprehensive indicators. Notably, the cumulative contribution rate of these first two comprehensive indicators exceeded 80%, indicating that a significant portion of the data from the seven indicators was effectively encompassed by these comprehensive indicators. Additionally, membership function analysis integrates the effects of multiple factors, making the evaluation results more comprehensive and objective [42]. For instance, Wang et al. [43] and Tian et al. [51] used a combination of PCA and membership function analysis on Brassica napus and Zea mays ecotypes. In this study, the D-value for each ecotype was calculated based on the weights of the two principal components and their membership function values. This approach facilitates the ranking of drought tolerance among S. alopecuroides ecotypes; the higher the D-value, the greater the drought tolerance. Although the D-values were calculated, they were not sufficient to directly reflect the drought tolerance of these ecotypes. Cluster analysis, however, provides a more intuitive understanding of their drought tolerance [45]. For example, Bai et al. [12] used cluster analysis to classify common Vicia sativa into four groups. Similarly, Tian et al. [52] employed a combination of PCA, membership function analysis, and cluster analysis to categorize Malus × domestica varieties into four groups, identifying ten superior germplasms. In this study, cluster analysis was conducted based on the D-value to evaluate the drought tolerance of S. alopecuroides ecotypes. The thirty-five ecotypes were intuitively classified into four groups: particularly drought-tolerant, moderate drought tolerance, drought-tolerant ecotypes, and drought-sensitive ecotypes. Additionally, using the mean values of each indicator in these four groups (Table 6), the five ecotypes with strong drought tolerance were comprehensively selected: Yutian, Alar, Jinghe, Baoding, and Guyuan. Perhaps due to the fact that these areas belong to arid and semi-arid regions, with less annual precipitation compared to other research areas, S. alopecuroides has been growing on the edge of the desert for a long time, gradually adapting to the climate conditions in the area and developing strong drought tolerance.
In the evaluation system mentioned above, it is not possible to identify which specific indicators contribute to the D-value. The advantage of stepwise regression analysis lies in its ability to identify the most significant indicators from a large set [53]. In this study, stepwise regression analysis revealed that GR, GE, PI, FW, and DW contribute significantly to the D-value. A regression equation for evaluating the drought tolerance of S. alopecuroides was established based on these five indicators. The coefficient of determination R2 = 0.991 indicates that the fitted evaluation equation is reasonable. This further enhances the scientific reliability and credibility of the selected indicators in assessing drought tolerance. Additionally, an accuracy analysis of the regression equation was conducted to ensure the reliability of the results. The results showed that the prediction errors for all S. alopecuroides ecotypes were less than 0.039, and 91.43% of the ecotypes had a prediction accuracy greater than 90%. This validates the reliability of the constructed drought tolerance evaluation system. Using this evaluation system to predict the drought tolerance of S. alopecuroides ecotypes during the germination stage can significantly simplify the identification process.
In this study, seven germination indicators of S. alopecuroides were measured, and a drought tolerance evaluation system was constructed by comprehensively applying PCA, membership function method, cluster analysis, and linear regression analysis. However, since the measured indicators were all related to the germination stage, the corresponding evaluation results only reflect the drought tolerance of S. alopecuroides during the early germination phase, without involving analyses of related physiological, biochemical, or seedling-stage drought tolerance Relevant studies have shown that drought tolerance varies among different materials at different growth stages [54,55]. Therefore, the evaluation and identification of a variety’s drought tolerance should involve a comprehensive assessment using different evaluation indicators at various growth stages to achieve a more accurate and complete evaluation of its drought tolerance. Consequently, whether the results of this experiment can fully represent the drought tolerance of various S. alopecuroides ecotypes throughout their entire life cycle requires further investigation.
5. Conclusions
In this study, thirty-five S. alopecuroides ecotypes were evaluated under 10% PEG-6000-induced drought stress using seven germination indicators through PCA, the membership function method, cluster analysis, and linear regression analysis. Based on the D-value and cluster analysis, the drought tolerance of the thirty-five ecotypes was ranked and classified into four categories, particularly drought-tolerant, moderate drought tolerance, drought-tolerant ecotypes, and drought-sensitive ecotypes. Five ecotypes with strong drought tolerance were comprehensively selected, originating from Yutian, Alar, Jinghe, Baoding, and Guyuan. Additionally, using the D-value as the dependent variable and GR, GE, SGI, FW, and DW as independent variables, a stepwise regression analysis was conducted to establish the optimal regression equation: y = −0.385 + 0.129 × GR + 0.325 × GE + 0.156 × SGI + 0.202 × FW + 0.243 × DW. The accuracy prediction showed that 91.43% of the S. alopecuroides ecotypes had a prediction accuracy greater than 90%. This study will provide a reference for selecting ecotypes for artificial cultivation of S. alopecuroides in arid and semi-arid regions and provide a rapid and comprehensive identification method for the evaluation of the drought tolerance of S. alopecuroides at the germination stage.
Author Contributions
Conceptualization, X.H., C.L., M.W. and G.C.; Software, C.L. and X.Z. (Xingxin Zhang); Formal analysis, X.H. and X.Z. (Xingxin Zhang); Investigation, L.L. and X.Z. (Xiangcheng Zhou); Resources, X.Z. (Xingxin Zhang), L.L. and X.Z. (Xiangcheng Zhou); Data curation, X.H., C.L., P.N. and P.J.; Writing—original draft, X.H. and C.L.; Writing—review and editing, X.H. and G.C.; Visualization, P.N. and P.J.; Supervision M.W. and G.C.; Funding acquisition, M.W., P.J., L.L. and X.Z. (Xiangcheng Zhou). All authors have read and agreed to the published version of the manuscript.
Funding
This research was funded by the Corps Guiding Science and Technology Plan Project (Grant No. 2023ZD088), the New Variety Cultivation Project of Shihezi University (Grant No. YZZX202303), and the College Students’ Innovation and Entrepreneurship Training Program (Grant No. SRP2024222; SRP2024232).
Data Availability Statement
The original contributions presented in this study are in the article; further inquiries can be directed to the corresponding authors.
Conflicts of Interest
The authors declare that they have no conflicts of interest.
References
- Li, Y.Y.; Feng, J.T.; Zhang, X.; Hu, L.F. Advance in research of chemical ingredients from Sophora alopecuroides L. and its bioactivities. Acta Agric. Boreali-Accid. Sin. 2005, 14, 133–136. [Google Scholar] [CrossRef]
- Rong, Z.J.; Hu, G.S.; Lin, S.Y.; Yan, T.; Li, N.; Zhao, Y.; Jia, J.M.; Wang, A.H. Constituents from the Seeds of Sophora alopecuroides L. Molecules 2022, 25, 411. [Google Scholar] [CrossRef] [PubMed]
- Gao, H.Y.; Li, G.Y.; Wang, J.H. A New Alkaloid from the Seeds of Sophora alopecuroides L. Helv. Chim. Acta 2012, 95, 1108–1113. [Google Scholar] [CrossRef]
- Huang, Y.X.; Wang, G.; Zhu, J.S.; Zhang, R.; Zhang, J. Traditional uses phytochemistry and pharmacological properties of Sophora alopecuroides L. Eur. J. Inflamm. 2016, 14, 128–132. [Google Scholar] [CrossRef]
- Aly, S.H.; Elissawy, A.M.; Eldahshan, O.A. The pharmacology of the genus Sophora (Fabaceae): An updated review. Phytomedicine 2019, 64, 153070. [Google Scholar] [CrossRef]
- Qi, X.; Zhao, K.; Ye, Z.; Wang, T.; Chen, B. Effects of Sophora alopecuroides green manure on growth and nutrient characteristics of melon. J. Agric. Sci. Technol. Iran. 2018, 20, 104–112. [Google Scholar] [CrossRef]
- Ma, T.; Yan, H.; Shi, X.; Liu, B.; Ma, Z.; Zhang, X. Comprehensive evaluation of effective constituents in total alkaloids from Sophora alopecuroides L. and their joint action against aphids by laboratory toxicity and field efficacy. Ind. Crops Prod. 2018, 111, 149–157. [Google Scholar] [CrossRef]
- Yan, M.A.; Sun, Y.; Cai, H.Y.; Dong, Y.; Zhang, S.J. Development and application of Sophora alopecuroides L. in animal husbandry. Feed Res. 2023, 46, 5. [Google Scholar] [CrossRef]
- Huang, X.; Rong, W.W.; Zhang, X.X.; Gao, Y.D.; Zhou, Y.S.; Su, J.J.; Luo, H.H.; Chu, G.M.; Wang, M. Transcriptome and metabolome analysis reveal the dynamic changes and biosynthesis pathways of alkaloids in Sophora alopecuroides L. under drought stress. Ind. Crops Prod. 2024, 212, 118365. [Google Scholar] [CrossRef]
- Wang, Z.L.; Xi, L.Z.; Li, Y.H.; Dong, A.X. Characteristics of droughts in eastern Northwest China over the past 546 years. Acta Meteorol. Sin. 2020, 78, 72–85. [Google Scholar]
- Cheng, J.; Yin, S. Analysis of drought characteristics and Its effects on crop yield in Xinjiang in recent 60 years. Sustainability 2021, 13, 13833. [Google Scholar] [CrossRef]
- Bai, J.; Wang, X.; Wang, Y. Screening of drought-resistance index and drought-resistance evaluation of common vetch (Vicia sativa L.) germplasms at germination stage. J. Plant Nutr. Fertil. 2020, 26, 2253–2263. [Google Scholar] [CrossRef]
- Agata, D.G. Arabidopsis seed germination under abiotic stress as a concert of action of phytohormones. Omics 2011, 11, 763–774. [Google Scholar] [CrossRef]
- Khodarahmpour, Z. Effect of drought stress induced by polyethylene glycol (PEG) on germination indices in corn (Zea mays L.) hybrids. Afr. J. Biotechnol. 2011, 10, 222–227. [Google Scholar] [CrossRef]
- Hellal, F.A.; El-Shabrawi, H.M.; El-Hady, A.M.; Khatab, I.A.; El-Sayed, S.A.A.; Abdelly, C. Influence of PEG induced drought stress on molecular and biochemical constituents and seedling growth of Egyptian barley cultivars. J. Genet. Eng. Biotechnol. 2018, 16, 203–212. [Google Scholar] [CrossRef]
- Li, X.M.; Zhao, X.Y.; Zhao, F.; Guo, M.J. Response of seed germination of three Caragana species to temperature and soil moisture. Pratacult. Sci. 2009, 26, 140–145. [Google Scholar] [CrossRef]
- Richardson, P.J.; MacDougall, A.S.; Larson, D.W. Fine-scale spatial heterogeneity and incoming seed diversity additively determine plant establishment. J. Ecol. 2012, 100, 939–949. [Google Scholar] [CrossRef]
- Ma, Q.B.; Xia, Z.L.; Cai, Z.D.; Li, L.; Cheng, Y.B.; Liu, J.; Nian, H. GmWRKY16 enhances drought and salt tolerance through an ABA-mediated pathway in Arabidopsis thaliana. Front. Plant Sci. 2019, 9, 1979. [Google Scholar] [CrossRef]
- Toosi, A.F.; Bakar, B.B.; Azizi, M. Effect of drought stress by using PEG 6000 on germination and early seedling growth of Brassica juncea Var. Ensabi. Sci. Pap. Ser. A Agron. 2014, 57, 2285–5785. [Google Scholar]
- Muscolo, A.; Sidari, M.; Anastasi, U.; Santonoceto, C.; Maggio, A. Effect of PEG-induced drought stress on seed germination of 376 four lentil genotypes. J. Plant Interact. 2014, 9, 354–363. [Google Scholar] [CrossRef]
- Guo, Y.; Li, D.; Liu, L.; Sun, H.; Zhu, L.; Zhang, K.; Zhao, H.; Zhang, Y.; Li, A.; Bai, Z.; et al. Seed priming with melatonin promotes seed germination and seedling growth of Triticale hexaploide L. under PEG-6000 induced drought stress. Front. Plant Sci. 2022, 13, 932912. [Google Scholar] [CrossRef] [PubMed]
- Abdel-Ghani, A.H.; Neumann, K.; Wabila, C.; Sharma, R.; Dhanagond, S.; Owais, S.J.; Rner, A.B.; Graner, A.; Kilian, B. Diversity of germination and seedling traits in a spring barley (Hordeum vulgare L.) collection under drought simulated conditions. Genet. Resour. Crop Evol. 2015, 62, 275–292. [Google Scholar] [CrossRef]
- Badr, A.; El-Shazly, H.H.; Tarawneh, R.A. Screening for drought tolerance in maize (Zea mays L.) germplasm using germination and seedling traits under simulated drought conditions. Plants 2020, 9, 565. [Google Scholar] [CrossRef] [PubMed]
- Liu, M.L.; Li, M.; Liu, K.C.; Sui, N. Effects of drought stress on seed germination and seedling growth of different maize varieties. J. Agric. Sci. 2015, 7, 1916–9752. [Google Scholar] [CrossRef]
- Wang, J.; Wang, J.H.; Zhang, Y.; Ma, Z.Y.; Yan, X. Response of Sophora alopecuroides and Thermopsis lanceolata seed germination and growth to drought stress. Chin. J. Eco-Agric. 2011, 19, 872–877. [Google Scholar] [CrossRef]
- Wang, Y.N.; Zhao, S.M.; Cao, B. Study on drought resistance of ten herbaceous plants under PEG-6000 simulated drought stress. Acta Agrestia Sin. 2020, 28, 983–989. [Google Scholar] [CrossRef]
- Zhao, J.; Shi, C.; Wang, L.; Han, X.; Zhu, Y.; Liu, J.; Yang, X. Functional trait responses of Sophora alopecuroides L. seedlings to diverse environmental stresses in the desert steppe of Ningxia China. Plants 2023, 13, 69. [Google Scholar] [CrossRef]
- Huang, X.; Chu, G.; Wang, J.; Luo, H.H.; Yang, Z.A.; Sun, L.P.; Rong, W.W.; Wang, M. Integrated metabolomic and transcriptomic analysis of specialized metabolites and isoflavonoid biosynthesis in Sophora alopecuroides L. under different degrees of drought stress. Ind. Crops Prod. 2023, 197, 116595. [Google Scholar] [CrossRef]
- Zhu, Y.; Wang, Y.; Ma, Z.; Wang, D.; Yan, F.; Liu, Y.; Li, J.; Yang, X.; Gao, Z.; Liu, X.; et al. Genome-wide identification of CHYR gene family in Sophora alopecuroides and functional analysis of SaCHYR4 in response to abiotic stress. Int. J. Mol. Sci. 2024, 25, 6173. [Google Scholar] [CrossRef]
- Zhang, R.; Hussain, S.; Wang, Y.; Liu, Y.; Li, Q.; Chen, Y.; Wei, H.; Gao, P.; Dai, Q. Comprehensive evaluation of salt tolerance in rice (Oryza sativa L.) germplasm at the germination stage. Agronomy 2021, 11, 1569. [Google Scholar] [CrossRef]
- Asati, R.; Tripathi, M.K.; Tiwari, S.; Yadav, R.K.; Chauhan, S.; Tripathi, N.; Solanki, R.S.; Sikarwar, R.S. Screening of chickpea (Cicer arietinum L.) genotypes against drought stress employing polyethylene glycol 6000 as selecting agent. Int. J. Plant Soil Sci. 2023, 35, 2155–2169. [Google Scholar] [CrossRef]
- Bouchyoua, A.; Kouighat, M.; Hafid, A.; Ouardi, L.; Khabbach, A.; Hammani, K.; Nabloussi, A. Evaluation of rapeseed (Brassica napus L.) genotypes for tolerance to PEG (polyethylene glycol) induced drought at germination and early seedling growth. J. Agric. Food Res. 2024, 15, 100928. [Google Scholar] [CrossRef]
- Zhang, H.; Zhang, L.; Meng, P.; Li, M.; He, H.; Yu, F.; Wang, Z. Drought resistance indicators screening and drought resistance evaluation of Salvia miltiorrhiza Bunge germplasm resources at seedling stage. Chil. J. Agric. Res. 2024, 84, 311–325. [Google Scholar] [CrossRef]
- Nouri-Ganbalani, A.; Nouri-Ganbalani, G.; Hassanpanah, D. Effects of drought stress condition on the yield and yield components of advanced wheat genotypes in Ardabil Iran. J. Food Agric. Environ. 2009, 73, 228–234. [Google Scholar] [CrossRef]
- Gedam, P.A.; Shirsat, D.V.; Arunachalam, T.; Ghosh, S.; Gawande, S.J.; Mahajan, V.; Gupta, A.J.; Singh, M. Screening of onion (Allium cepa L.) genotypes for waterlogging tolerance. Front. Plant Sci. 2022, 12, 727262. [Google Scholar] [CrossRef] [PubMed]
- Uzair, M.; Ali, M.; Fiaz, S.; Attia, K.; Khan, N.; Al-Doss, A.A.; Khan, M.R.; Ali, Z. The characterization of wheat genotypes for salinity tolerance using morpho-physiological indices under hydroponic conditions. Saudi J. Biol. Sci. 2022, 29, 103299. [Google Scholar] [CrossRef]
- Learnmore, M.; Hussein, S.; Samson, T.; Tsilo, T.J. Screening of bread wheat genotypes for drought tolerance using phenotypic and proline analyses. Front. Plant Sci. 2016, 7, 1276. [Google Scholar] [CrossRef]
- Munns, R.; James, R.A.; Sirault, X.R.R.; Furbank, R.T.; Jones, H.G. New phenotyping methods for screening wheat and barley for beneficial responses to water deficit. J. Exp. Bot. 2010, 61, 3499–3507. [Google Scholar] [CrossRef]
- Takahashi, F.; Kuromori, T.; Sato, H.; Shinozaki, K. Regulatory gene networks in drought stress responses and resistance in plants. Adv. Exp. Med. Biol. 2018, 1081, 189–214. [Google Scholar] [CrossRef]
- Li, W.; Zhang, H.; Zeng, Y.; Xiang, L.; Cheng, Q. A salt tolerance evaluation method for sunflower (Helianthus annuus L.) at the seed germination stage. Sci. Rep. 2020, 10, 10626. [Google Scholar] [CrossRef]
- Bouslama, M.; Schapaugh, W.T., Jr. Stress tolerance in soybeans. I. Evaluation of three screening techniques for heat and drought tolerance. Crop Sci. 1984, 24, 933–937. [Google Scholar] [CrossRef]
- Li, J.; Li, J.; Yang, P.; Fu, H.; Yang, Y.; Liu, C. Screening of germplasm and construction of evaluation system for autotoxicity tolerance during seed germination in cucumber. Agronomy 2024, 14, 1081. [Google Scholar] [CrossRef]
- Wang, R.; Peng, W. Principal component analysis and comprehensive evaluation on drought tolerance difference of canola cultivars at germination and emergence stages. Chil. J. Agric. Res. 2023, 83, 18–28. [Google Scholar] [CrossRef]
- Li, J.R.; Abbas, K.; Wang, W.H.; Gong, B.B.; Wang, L.; Hou, S.L.; Xia, H.; Wu, X.L.; Chen, L.D.; Gao, H.B. Drought tolerance evaluation and verification of fifty pakchoi (Brassica rapa ssp. chinensis) varieties under water deficit condition. Agronomy 2023, 13, 2087. [Google Scholar] [CrossRef]
- Chen, E.Y.; Wang, R.F.; Qin, L.; Yang, Y.B.; Li, F.F.; Zhang, H.W.; Wang, H.L.; Liu, B.; Kong, Q.H.; Guan, Y.A. Comprehensive identification and evaluation of foxtail millet for saline-alkaline tolerance during germination. Acta Agron. Sin. 2020, 46, 1591–1604. [Google Scholar]
- Zaefizadeh, M.; Jamaati-e-Somarin, S.; Zabihi-e-Mahmoodabad, R.; Khayatnezhad, M. Discriminate analysis of the osmotic stress tolerance of different sub-convars of durum wheat during germination. Adv. Environ. Biol. 2011, 5, 74–80. [Google Scholar]
- Seleiman, M.F.; Al-Suhaibani, N.; Ali, N.; Akmal, M.; Alotaibi, M.; Refay, Y.; Dindaroglu, T.; Abdul-Wajid, H.H.; Battaglia, M.L. Drought stress impacts on plants and different approaches to alleviate its adverse effects. Plants 2021, 10, 259. [Google Scholar] [CrossRef] [PubMed]
- Ghosh, S.; Shahed, M.A.; Robin, A.H.K. Polyethylene glycol induced osmotic stress affects germination and seedling establishment of wheat genotypes. Plant Breed. Biotechnol. 2020, 8, 174–185. [Google Scholar] [CrossRef]
- Zeng, L.S.; Li, P.Y.; Sun, X.F.; Sun, Z.J. A multi-trait evaluation of drought resistance of bermudagrass (Cynodon dactylon) germplasm from different habitats in Xinjiang province. Acta Pratacult. Sin. 2020, 29, 155. [Google Scholar] [CrossRef]
- Gong, J.; Zhang, D.; Hong, K.; Zhang, X.; Tang, J.; Tang, M.; Yi, Y. Screening for drought-resistant pepper cultivars by multivariate statistical analysis. In Proceedings of the II International Symposium on Germplasm of Ornamentals, Beijing, China, 8–12 August 2016; pp. 277–286. [Google Scholar] [CrossRef]
- Tian, H.J.; Liu, H.; Zhang, D.; Hu, M.T.; Zhang, F.L.; Ding, S.Q.; Yang, K.Z. Screening of salt tolerance of maize (Zea mays L.) lines using membership function value and GGE biplot analysis. PeerJ 2024, 12, e16838. [Google Scholar] [CrossRef]
- Tian, W.; Li, Z.; Wang, L.; Sun, S.M.; Wang, D.J.; Wang, K.; Wang, G.Y.; Liu, Z.; Lu, X.; Feng, J.R.; et al. Comprehensive evaluation of apple germplasm genetic diversity on the basis of 26 phenotypic traits. Agronomy 2024, 14, 1264. [Google Scholar] [CrossRef]
- Bahmani, K.; Izadi-Darbandi, A.; Noori, S.A.; Jafari, A.A.; Moradi, N. Determination of interrelationships among phenotypic traits of Iranian fennel (Foeniculum vulgare Mill.) using correlation stepwise regression and path analyses. J. Essent. Oil Bear. Plants 2012, 15, 424–444. [Google Scholar] [CrossRef]
- Huang, Q.; Zhao, Y.; Liu, C.; Zou, X.; Cheng, Y.; Fu, G.; Xu, J.; Zhang, X.; Lu, G.; Snowdon, R. Evaluation of and selection criteria for drought resistance in Chinese semiwinter rapeseed varieties at different developmental stages. Plant Breed. 2015, 134, 542–550. [Google Scholar] [CrossRef]
- Nguyen, T.C.; Jo, H.; Tran, H.A.; Lee, J.D.; Kim, J.H.; Seo, H.S.; Song, J.T. Assessment of drought responses of wild soybean accessions at different growth stages. Agronomy 2024, 14, 471. [Google Scholar] [CrossRef]
Disclaimer/Publisher’s Note: The statements, opinions and data contained in all publications are solely those of the individual author(s) and contributor(s) and not of MDPI and/or the editor(s). MDPI and/or the editor(s) disclaim responsibility for any injury to people or property resulting from any ideas, methods, instructions or products referred to in the content. |
© 2024 by the authors. Licensee MDPI, Basel, Switzerland. This article is an open access article distributed under the terms and conditions of the Creative Commons Attribution (CC BY) license (https://creativecommons.org/licenses/by/4.0/).