Article

Phenotypic Variation and Relationships between Grain Yield, Protein Content and Unmanned Aerial Vehicle-Derived Normalized Difference Vegetation Index in Spring Wheat in Nordic–Baltic Environments

1
Crop Research Department, Institute of Agricultural Resources and Economics, Stende Research Centre, “Dižzemes”, Talsi Reg., LV-3258 Dižstende, Latvia
2
Faculty of Agriculture, Latvia University of Life Sciences and Technologies, Liela Street 2, LV-3001 Jelgava, Latvia
3
Centre of Estonian Rural Research and Knowledge, J. Aamisepa 1, 48309 Jogeva, Estonia
4
Institute of Agriculture, Lithuanian Research Centre for Agriculture and Forestry, Kedainiai Reg., LT-58344 Akademija, Lithuania
5
Department of Plant Sciences, Norwegian University of Life Sciences, Kirkeveien 12, NO-1433 Ås, Norway
6
Institute of Bioengineering, University of Tartu, Nooruse 1, 50411 Tartu, Estonia
*
Author to whom correspondence should be addressed.
Agronomy 2024, 14(1), 51; https://doi.org/10.3390/agronomy14010051
Submission received: 27 November 2023 / Revised: 19 December 2023 / Accepted: 20 December 2023 / Published: 23 December 2023

Abstract

:
Accurate and robust methods are needed to monitor crop growth and predict grain yield and quality in breeding programs, particularly under variable agrometeorological conditions. Field experiments were conducted during two successive cropping seasons (2021, 2022) at four trial locations (Estonia, Latvia, Lithuania, Norway). The focus was on assessment of the grain yield (GY), grain protein content (GPC), and UAV-derived NDVI measured at different plant growth stages. The performance and stability of 16 selected spring wheat genotypes were assessed under two N application rates (75, 150 kg N ha−1) and across different agrometeorological conditions. Quantitative relationships between agronomic traits and UAV-derived variables were determined. None of the traits exhibited a significant (p < 0.05) genotype-by-nitrogen interaction. High-yielding and high-protein genotypes were detected with a high WAASB stability, specifically under high and low N rates. This study highlights the significant effect of an NDVI analysis at GS55 and GS75 as key linear predictors, especially concerning spring wheat GYs. However, the effectiveness of these indices depends on the specific growing conditions in different, geospatially distant locations, limiting their universal utility.

1. Introduction

Common wheat (Triticum aestivum L.) is a valuable and extensively cultivated cereal worldwide. Global wheat production has increased, rising from 715 million tons in 2015 to 780 million tons in 2021 [1]. The significance of wheat extends to the Baltic countries (Latvia, Estonia, Lithuania) and the Nordic nations (Denmark, Norway, Sweden, Finland), where wheat production collectively accounts for approximately 7% and 5% of the total European wheat production, respectively [1,2].
The climatic conditions in the Nordic–Baltic region facilitate the cultivation of both types of wheat—spring and winter wheat. Notably, the majority of the harvested area in the Baltic countries is dedicated to winter wheat, with only about 20% of the area allocated to spring wheat cultivation [3]. Given that a significant portion of spring wheat production in the Baltic countries and Norway is earmarked for breadmaking, breeding programs in this region simultaneously prioritize traits related to productivity and baking quality, including grain yield (GY) and grain protein content (GPC) [4,5,6,7]. Wheat with a moderate-to-high GPC (exceeding 12%) is considered essential for bread making, while wheat with lower GPC levels is typically used for cookies, noodles, or animal feed [8].
The GY and GPC are complex quantitative characteristics controlled by multiple genes, influenced by genotype, environment, and genotype–environment interactions. Breeders often rely on grain yield and quality, along with their contributed performance and phenotypic expression, when selecting crop cultivars under mega-environment tests [9]. Abiotic stresses, such as water stress, heat, and nutritional deficiency, can negatively impact crop yield and quality [10,11]. Therefore, each genotype should undergo evaluation for several years in different locations to identify high-performing and stable genotypes, recommending them for cultivation in target areas.
Wheat, as a cereal crop, has a high demand for nitrogen (N), crucial for plant growth, development, GY formation, and GPC accumulation and essential for baking and processing quality. Wheat growth has an absolute requirement for N, and crop yield and quality heavily depend on substantial N inputs [12].
Crop breeding needs to be intensified and made more efficient, utilizing new phenomics methods to predict the GY and GPC, both of which are interrelated parameters [13]. Consequently, remote sensing is gradually gaining recognition as an alternative to traditional, destructive field sampling methods and laboratory testing. It serves as a tool for finding the nitrogen (N) status in wheat [14]. Unmanned aerial vehicle (UAV) platforms equipped with multiple sensors, capable of swiftly scanning entire fields, have proven to be useful tools for gathering non-destructive data on the physiological state of plant canopies [15,16]. Multispectral data have been analysed for UAV-based estimation of wheat grain yield under different water and nitrogen conditions and at various wheat growth stages [17,18].
The normalized difference vegetation index (NDVI), calculated from multispectral data, stands out as the most popular index for vegetation assessment [19]. This index finds utility in various fields, including agriculture [20]. The NDVI is valuable in estimating biomass [21], indicating plant stress [22], determining chlorophyll concentration [23], and assessing other characteristics. Numerous studies on wheat have demonstrated the potential use of NDVI readings as a tool to differentiate and identify high-yielding wheat genotypes, even in different nitrogen environments [24,25,26].
There is a lack of published results on the agronomic and UAV remote sensing phenotyping of spring wheat genotypes in multi-environment experiments, particularly within the unique conditions of the Baltic region, which would offer valuable insights for breeding programs. The aim of this study was to identify the best performing and stable spring wheat genotypes for grain yield and grain protein content in different Nordic–Baltic environments.
The objectives of this study were to:
  • Assess the variation in the GY, GPC, and UAV-derived NDVI across different years and nitrogen fertilization rates in the Nordic–Baltic region;
  • Evaluate the performance and stability of spring wheat genotypes concerning the GY and GPC under varying N fertilization rates and diverse agrometeorological conditions;
  • Explore the quantitative relationships between GY, GPC, and UAV-derived NDVI variables across multi-environmental trials during different plant growth stages.
Using UAV phenotyping technologies combined with field evaluations, we intended to determine whether superior genotypes can be accurately identified with this methodology, and at which stages of plant development the assessment should be performed.

2. Materials and Methods

2.1. Plant Materials

In this experiment, sixteen spring wheat genotypes were used, which include cultivars and improved breeding lines mostly developed in the last decade in the spring wheat breeding programs of the Baltic States and Norway. These programs include the Agricultural Resources and Economics Institute (Latvia, LV), the Lithuanian Agricultural and Forestry Research Centre (Lithuania, LT), and the Centre of Estonian Rural Research and Knowledge (Estonia, EE), as well as the Norwegian University of Life Sciences (Norway, NO) and Graminor (Norway). Detailed information on the selected spring wheat genotypes and their origin and descriptions are given in Table S1.

2.2. Field Trials

Field experiments were carried out over two consecutive years (2021 and 2022) at four geographically distant locations representing different agro-ecological conditions and soil types in the Nordic and Baltic region: the Centre of Estonian Rural Research and Knowledge (Jogeva, Eastern part of Estonia, 58°76′ N, 26°24′ E), Stende Research Centre (Dižstende, north-west Latvia, 57°18′ N, 22°56′ E), the Institute of Agriculture (Dotnuva, in central Lithuania, 55°39′ N, 26°24′ E), and the Vollebekk Research Station (Ås, south-eastern Norway, 59°39′ N, 10°45′ E). The physical and chemical properties of the experimental soils prior to sowing are detailed in Table S2.
In each location, spring wheat genotypes were sown in field trials set up with two contrasting nitrogen (N) fertilization rates applied before sowing, i.e., 75 and 150 kg ha−1 N of compound NPK fertilizer, referred to as low N (N75) and high N (N150) rates, respectively. The high N treatment represents the typical fertilization rate for spring wheat in Norway and the Baltic states, whereas the low N treatment reflects less intensive management, allowing for the evaluation of the performance of genotypes at a reduced N supply. The experiment was designed in split plots, with the main plot being the N rates (N75, N150) and the sub-plot being the wheat genotypes.
The harvested plot size for each genotype across different locations was 9–15 m2, arranged in two randomized replicates. The seeding rate was 500 kernels m−2 in LV and LT, and 600 kernels m−2 in EE and NO. Trials were conducted at the proper time, from 21 April to 2 May, depending on the local meteorological conditions at each location. Treatment of trials with pesticides included the application of herbicides and fungicides in all locations based on standard procedures. Foliar fungicide treatments (1–2 applications) were applied at each location, but insecticides were used when the control thresholds of insects was exceeded. Following the ripening stage, the trial material was harvested using a combine harvester.
Daily weather data (precipitation amount, mm; °C; average day temperature, °C) were obtained from services provided by research institutions. The climate normal, or long-term average (LTA, 1991–2020), was used to compare two-year data at each location.

2.3. Phenotyping of Field Traits

Days to maturity (DM, days) were calculated from visually recorded maturity dates when 50% of the plants were in the respective developmental stage. Plant height (PH, cm) was manually measured at the ripening stage in three separate places within the plot and calculated as the average height of a sample of a fertile stem from the soil surface to the top of the spike. Grain yield (GY, g m−2) was recorded for each experimental plot and adjusted to a moisture content of 14%. Grain protein content (GPC, %) was measured using a near-infrared reflectance spectrometer (Perten Inframatic 9200/Perten Instrument AB) in Norway (NO), and near-infrared transmittance whole grain analysers were used in Estonia (EE) (InfratecTM/Foss), Latvia (LV) (InfratecTM NOVA/Foss), and Lithuania (LT) (Infratec 1241/Foss).

2.4. UAV Data Acquisition and Processing

A DJI Phantom 4 Multispectral quadcopter (DJI, Inc., Shenzhen, Guangdong, China) was used to acquire image data in LV, LT, and NO. This commercial UAV model is commonly employed in agronomy research and monitoring [27]. A DJI Phantom 4 RTK (Real Time Kinematics) quadcopter (DJI, Inc., Shenzhen, China) equipped with a Micasense RedEdge MX multispectral camera (AgEagle Aerial Systems, Seattle, WA, USA) was used to acquire image data in EE.
Multispectral UAV images were captured at each location from an altitude of 20 m, resulting in a ground sample distance (GSD) of 1 cm. The images were taken with a minimum of 75% overlap in the front and side directions, using a 90 degree (NADIR) camera position. Each flight mission generated approximately 5000 TIFF images, with five images acquired for each shot.
Four UAV flight missions were planned in each of eight field trials, corresponding to a certain time of plant vegetative and generative development based on the Zadoks growth scale [28]: the middle of vegetative wheat plant development (tillering, growth stage 25/GS25), spike emergence or heading (GS55), the middle of grain filling (milk development stage, GS75), and late grain filling (dough development stage, GS85) (Table 1). However, the developmental stages differed slightly between genotypes due to differences in phenological development.
The result was a series of average reflectance values of the field trial plots in each of the five spectral bands (red, green, blue, red edge, near-infrared). Aerial images were processed in PIX4Dmapper by Pix4D (Lausanne, Switzerland), photogrammetry software for drone mapping. Processed orthophotos were georeferenced with an average root mean square error (RMSE) of 3–5 cm. To maintain this precision and compatibility between data series taken at different time periods, ground control points (GCPs) were set up and measured and maintained throughout the entire vegetation season. Also, for each flight mission, a multispectral photo of the MAPIR calibration panel was taken, which was used to calibrate the results so that the results could be compared between locations and missions under different lighting conditions. Spectral reflectance values were extracted from final orthophoto mosaics and cropped to field boundaries. The QGIS zonal statistics tool was used to extract mean reflectance values from the orthophoto images, which served as the input for the calculation of NDVI values. The vectorized plot layer served as an AOI (area of interest), containing rectangles for each of the trial plots. A vector layer was created using a digitization technique using a georeferenced orthophoto image from the field where plots were clearly visible after germination.
The NDVI was calculated in QGIS based on a combination of visible, red, and NIR wavelengths with the following Equation (1):
NDVI = (RNIR − Rred)/(RNIR + Rred),
where RNIR is the reflectance in the near-infrared band and Rred is the reflectance in the red band.

2.5. Data Statistical Analysis

The data for each of the 16 genotypes across 16 environments (4 locations, 2 years, 2 N rates) were initially studied using a descriptive analysis, including maximum and minimum values, variance, standard deviation, and mean. All derived measurements were calculated from the individual plot values.
For the split-plot trial design, a linear mixed-effects model ANOVA was applied. In the first model, the two main factors, genotype and N rate, and their interaction were fixed, while the field block was considered random. Calculations were carried out separately for the data from the 8 environments (combination of location and year). The partitioning of the percentage of factors was computed from the total sum of the square (TSS, %). In the second model, three main factors, genotype, year, and N rate, and their interactions were fixed, and the field block was random; calculations were carried out separately for the data from each location. Mean comparisons between genotypes, trial years, and N rates were performed using Fisher’s least significant difference (LSD) (p < 0.05).
A multivariate stability analysis was performed using the additive main effects and multiplicative interaction model (AMMI), which combines an ANOVA for the genotype and environment main effects with a principal component analysis of genotype–environment interactions [29]. Each year–location combination was considered as an environment; therefore, eight environments were accounted for in the stability analysis of the 16 genotypes under high N and low N rates.
A stability analysis was carried out using the WAASB index [30]. The index was calculated as follows (2):
W A A S B i = k = 1 p | I P C A i k × E P k | / k = 1 p E P k   ,
where WAASBi is the weighted average of absolute scores of the i-th genotype; IPCAik is the score of the i-th genotype in the k-th IPCA (interaction principal component axis), and EPk is the amount of the variance explained by k-th IPCA. The genotype with the lowest WAASB score deviates least from the mean performance across environments and is therefore considered as the most stable.
Pearson correlation analyses were conducted between GY, GPC, and NDVI values at four plant growth stages in each of the 8 environments, separately for high and low N rates. Linear regression models were employed to examine the relationships between NDVI values at each plant growth stage (as independent variables) and GY and GPC (as dependent variables). Adjusted determination coefficients (adj. R2), root mean squared errors (RMSEs), and p-values were reported to characterize regression models.
Data results were visualized with MS Excel extension Real Statistics and R 4.2.3 statistical program [31] packages: lme4, datasets, agricolaeimetan.

3. Results

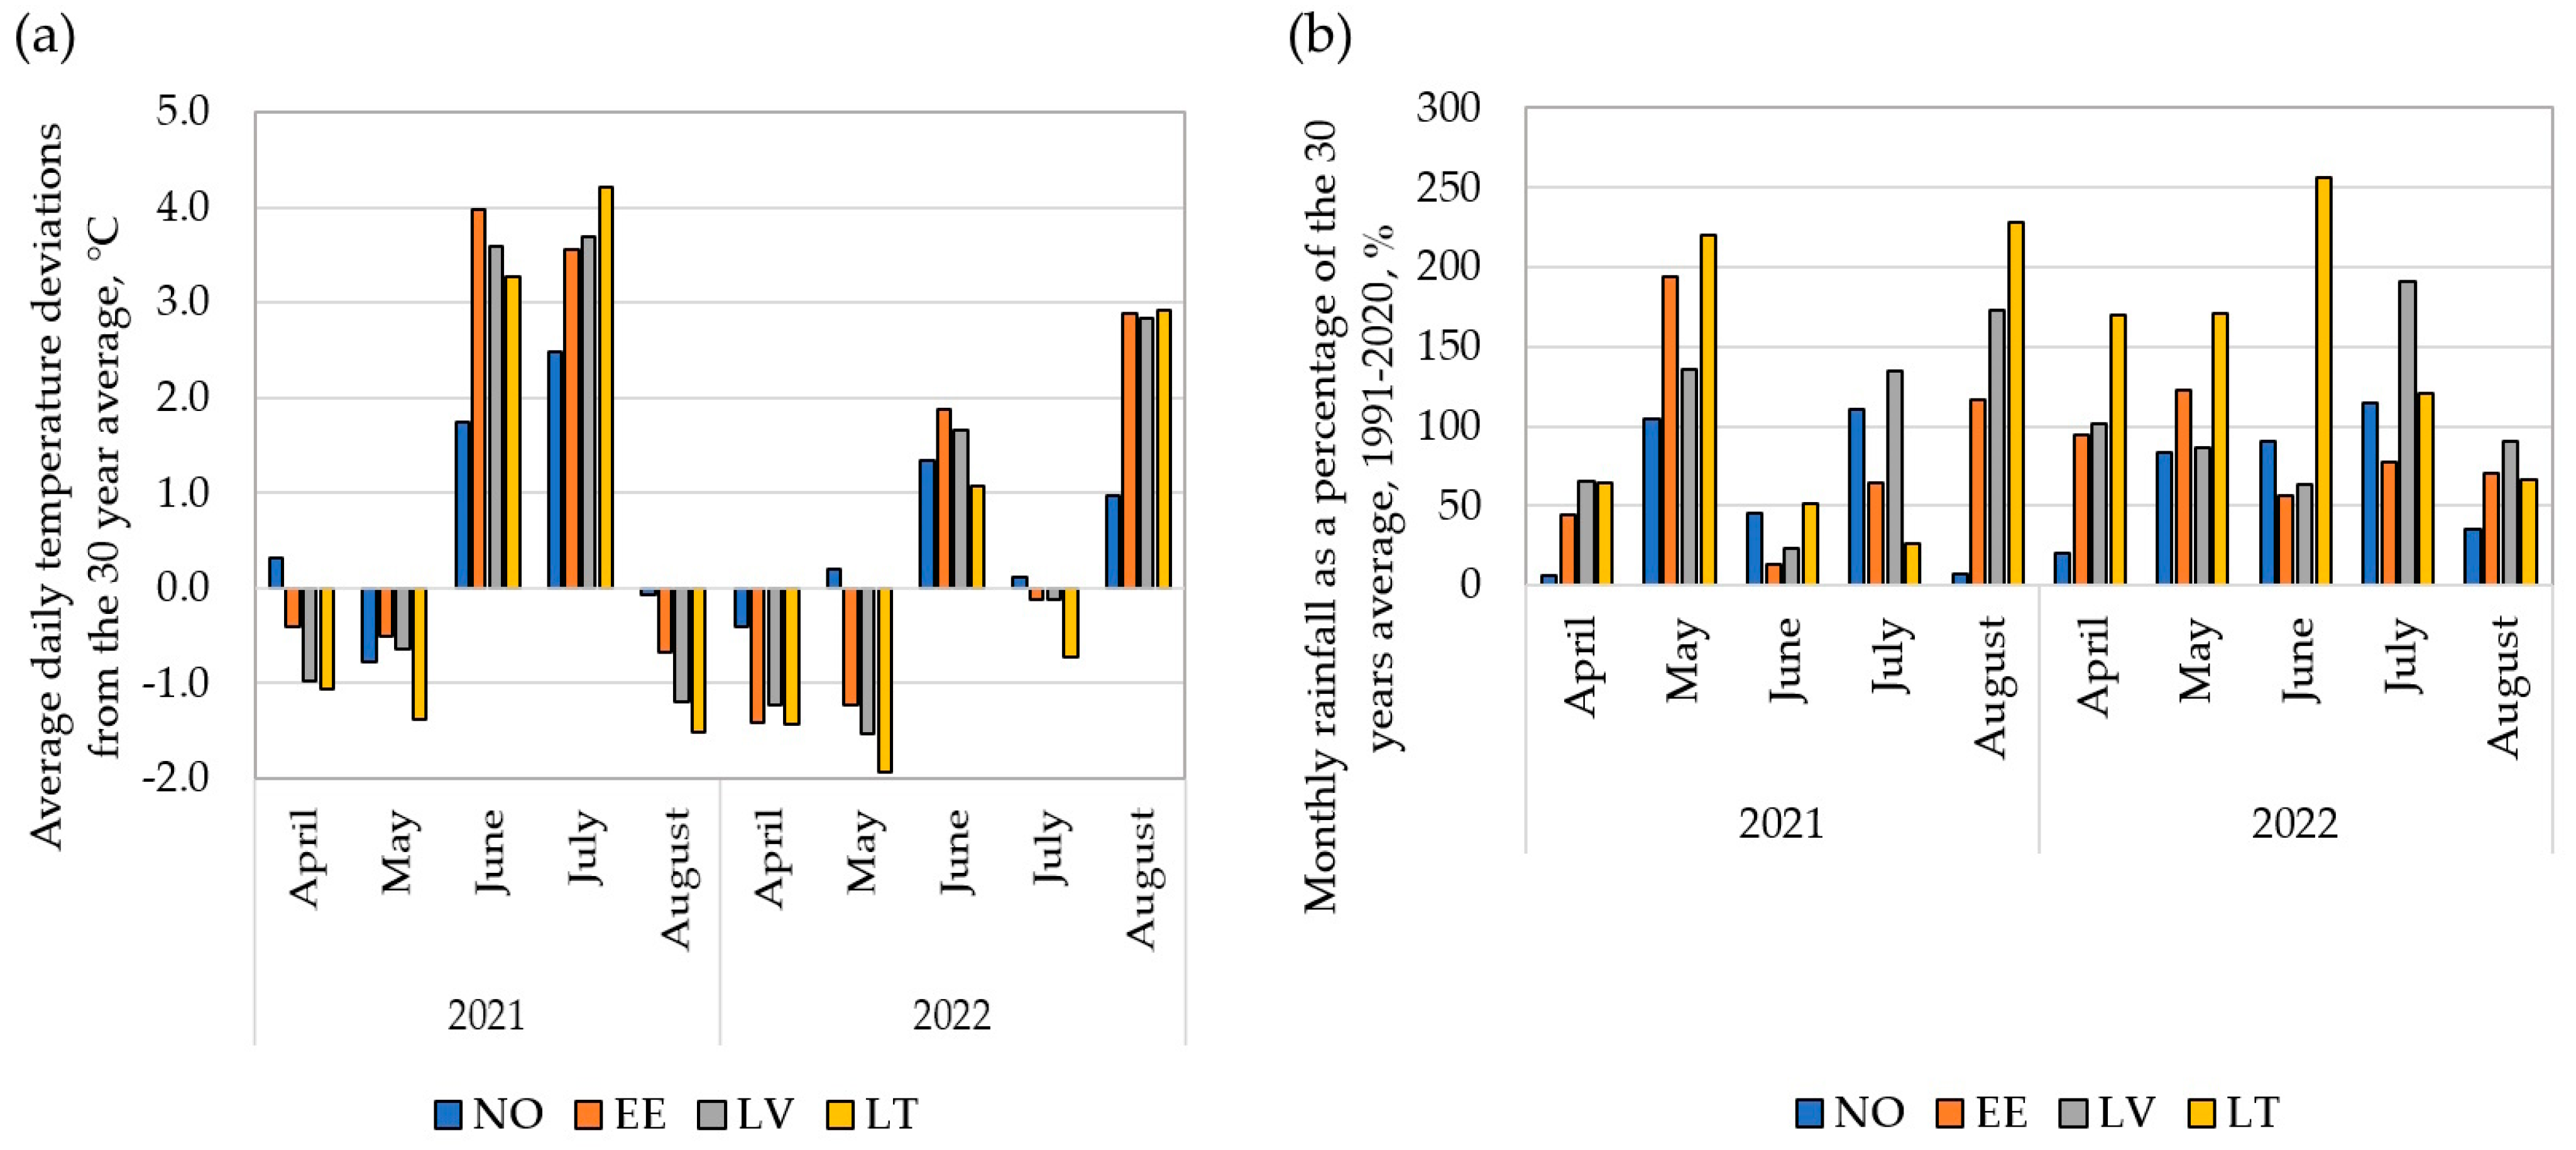
3.1. Variation in Meteorological Data

Overall meteorological conditions were markedly different between the trial years of 2021 and 2022. However, in comparison to the 30-year long-term average (LTA) data (1991–2020), there are both similar trends and differences between environments (Figure 1). In 2021, April, May, and August experienced lower average daily air temperatures than the LTA in all trial locations, but in June and July, temperatures exceeded the average annual observations by 1.7 to 4.0 °C and 1.5 to 4.2 °C, respectively (Figure 1a). In April, May, and June in all test locations, and in July in EE and LT, the amount of precipitation was significantly reduced (Figure 1b). In the 2022 season, April and May were generally relatively cool, but in June, the average daily air temperature in all trial locations exceeded the LTA (Figure 1a). In June, the monthly rainfall was reduced in the trials in NO, EE, and LV. Heavy rains occurred in LT in June, when 256% more precipitation compared to the LTA was noted (Figure 1b).
Overall, the growing season of 2022 was considered as a more favourable season for wheat growth and productivity than the earlier one due to the lower average temperatures and higher rainfall.

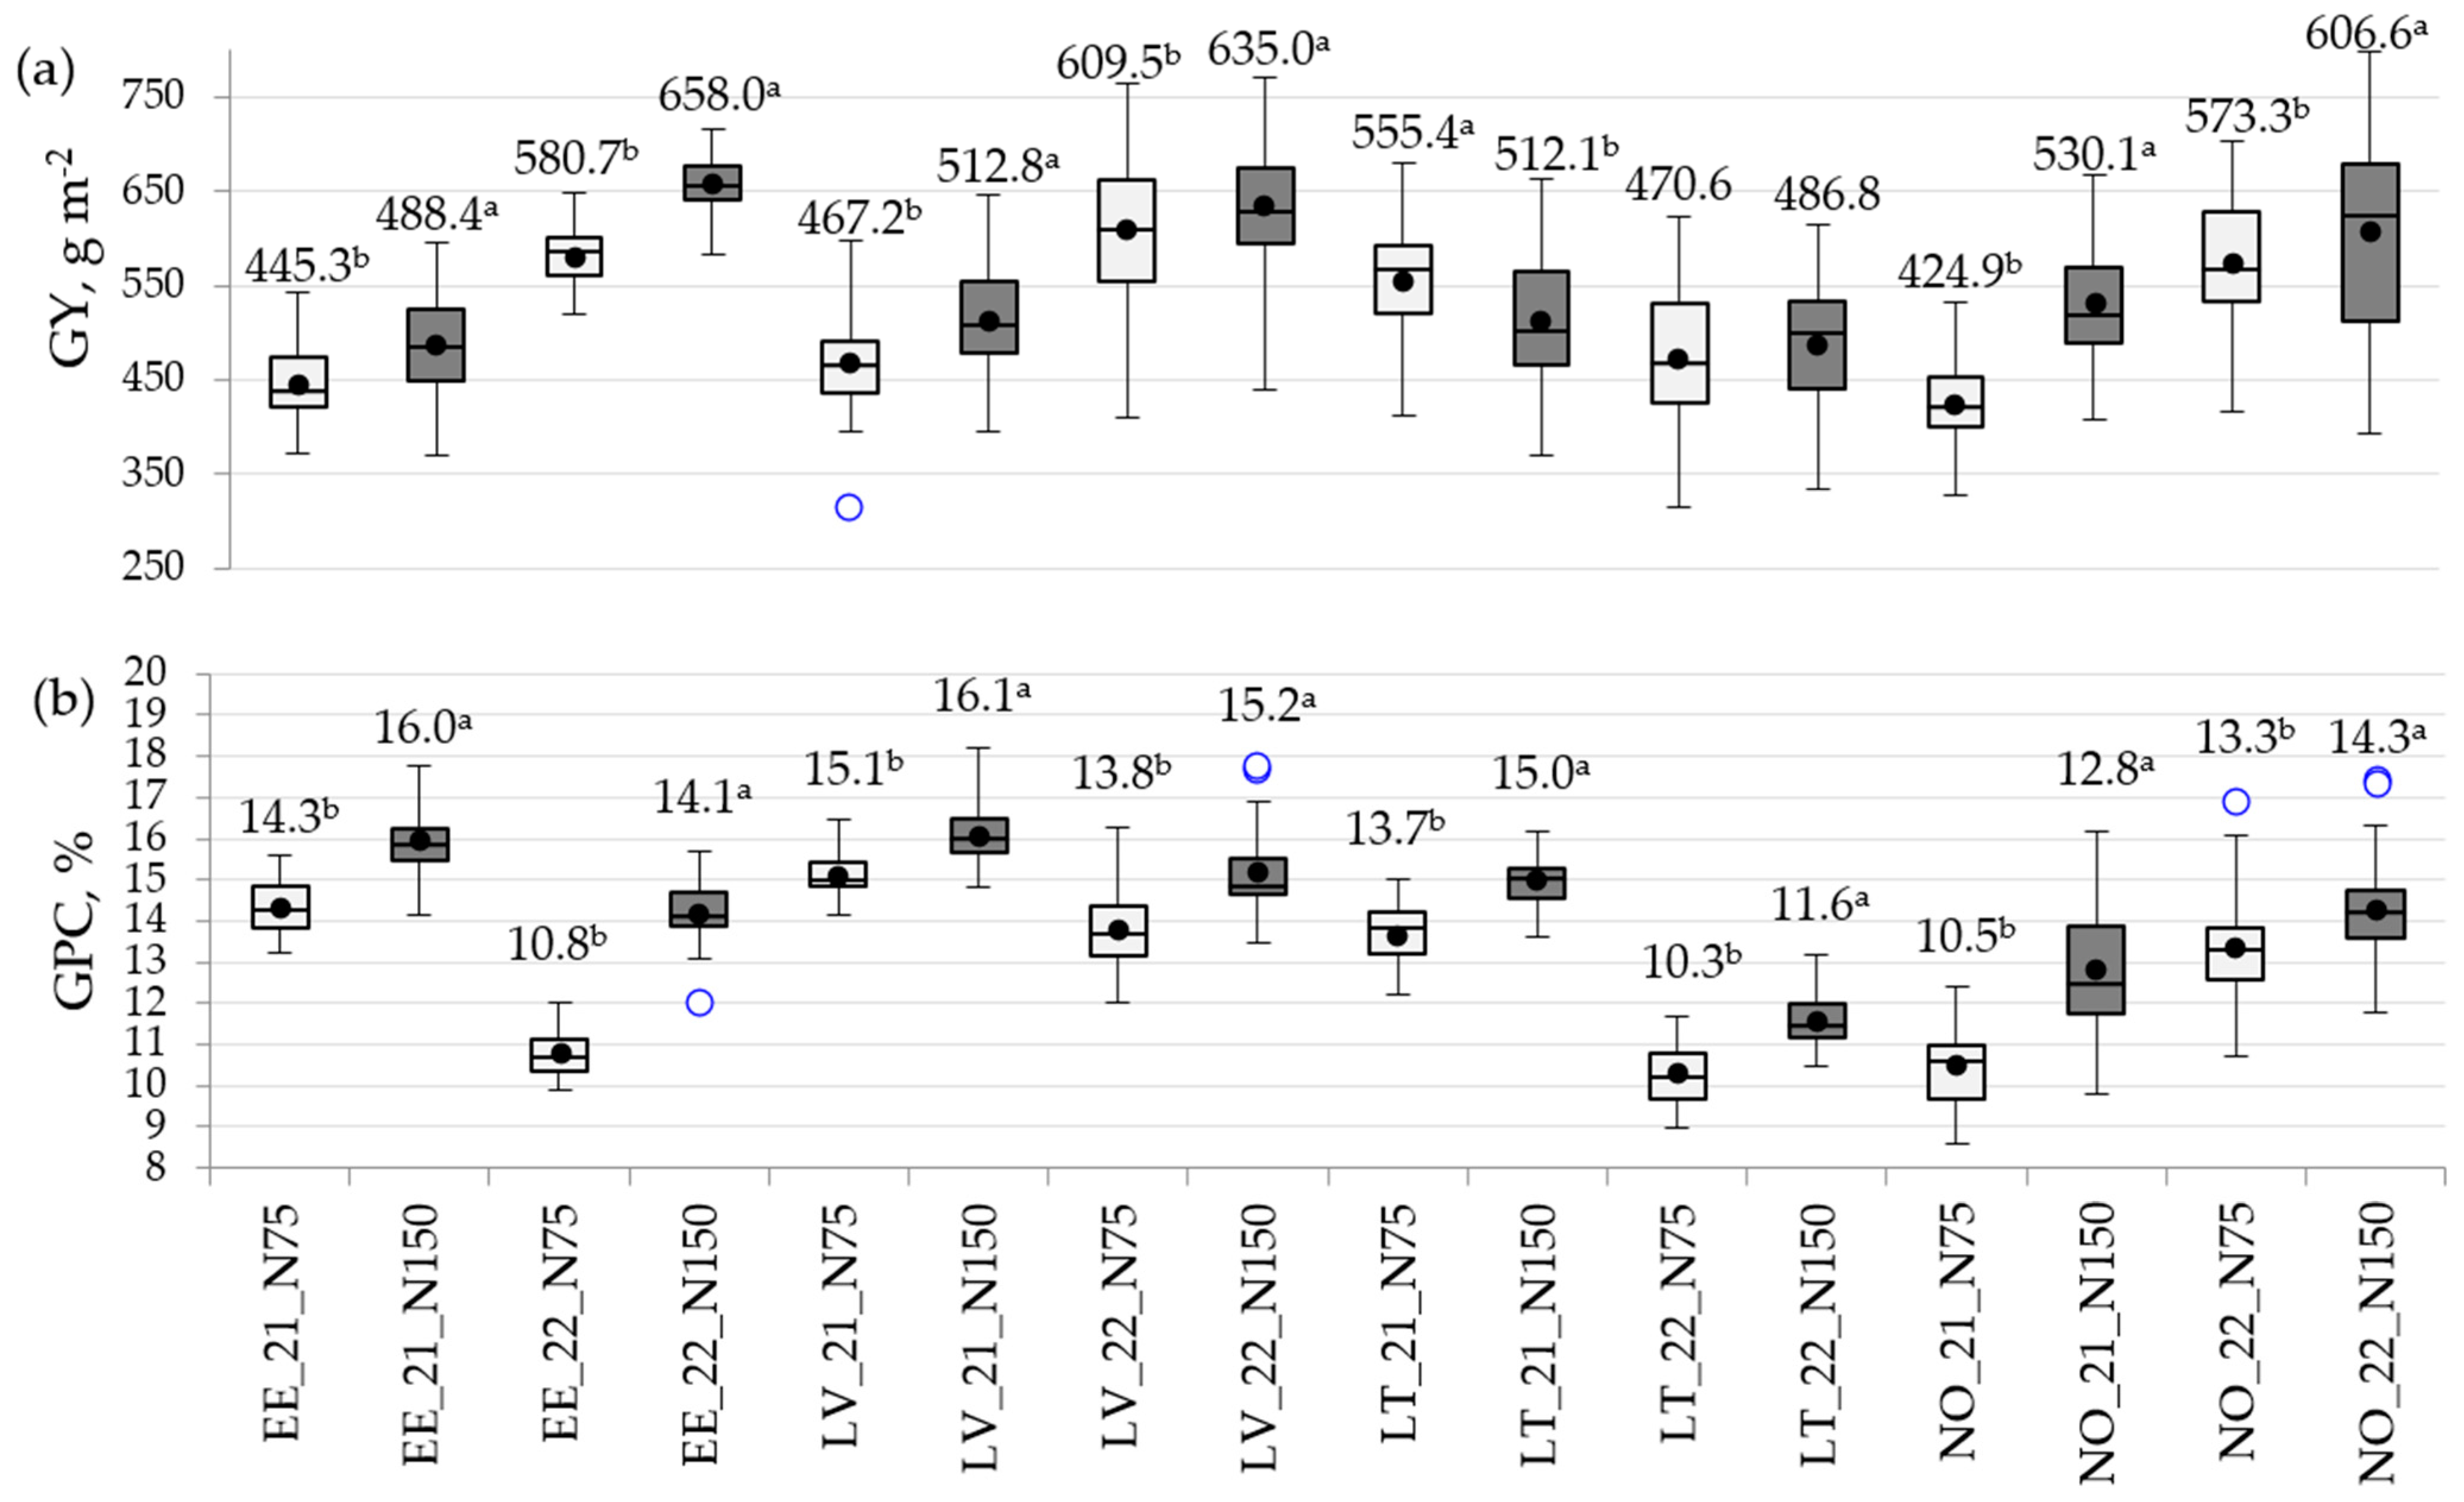
3.2. Variation in Traits by Location and Year

The results of an analysis of variance performed for GY and GPC data showed that in all locations, the effect (sum of squares) of different years was highly significant (p < 0.001) with the highest contribution to both traits’ variability (Table S2). Mean GY values varied significantly by year in each location, where the lowest yielding trial location/year was EE in 2021 (466.8 g m−2), and the highest yielding location/year was LV in 2022 (622.2 g m−2) (Table 2). When comparing the two trial years, the average grain yield was significantly higher in 2022 than in 2021 in three locations (NO, LV, LT), while in LT, it was the opposite.
Mean GPC values also varied substantially from one location and year to another. The mean GPC values among four locations ranged from 11.7 to 15.6% in 2021 and from 10.9 to 14.5% in 2022, with the lowest value in LT in 2022 (10.9%), and the highest value in LV in 2021 (15.6%). Differences were observed between locations in the GPC depending on the trial year. In LV, EE, and LT, a significantly higher GPC was obtained in 2021, but not in NO, where it was, on the contrary, 2.1% higher in 2022.
The UAV-derived NDVI obtained at four growth stages showed also significant variation among trial years (Table 3).
Overall, in all four growth stages, mean value differences varied significantly and did not show consistent similar variations compared to data obtained between years. For instance, in GS55, where comparatively the highest mean NDVI values were detected in LV and LT, this trait was significantly higher in 2022, while in EE it was higher in 2021; however, in NO, in both trial years, we obtained similar NDVI values.

3.3. The Impact of N Rate on Phenotypic Variation in Traits

As shown in Figure 2, the impact of a high N rate was pronounced for the GY at all trial locations; significantly higher GYs in such conditions were obtained in EE, LV, and NO (Figure 2a; Table S4). Opposite results were detected in LT, where in 2021, significantly (p < 0.001) higher average GY values were obtained under low N conditions, but in 2022, N treatment did not have a significant effect. In LV and NO, a higher N regime response to GY variation was detected in 2021 compared to 2022.
A high N fertilization rate promoted the formation of significantly (p < 0.001) higher GPCs at all locations (Figure 2b; Table S4).
The N rate showed a significant effect on the variation in NDVI values measured at the tillering stage (GS25) only in three environments (EE_2021; NO_2021, LT_2022) (Table 4). In all locations, the NDVI was evaluated during heading (GS55) and milk (GS75) growth stages, and in most cases, significantly higher NDVI values were obtained under a high N supply compared to those obtained in low N conditions. At all locations, the NDVI variation was also significantly affected by the N fertilization regime in the late grain filling stage (GS85), with significantly (except in EE_2022) higher values under high N application.
An analysis of variance confirmed that in all location–year environments, the genotype-by-nitrogen (G × N) interaction was not significant for any of the investigated traits (Table S4).

3.4. Mean Performance and Stability of Wheat Genotypes under Contrasting Environments

The mean performance of GY and GPC and their corresponding WAASB stability indices and trait ranking values under high and low N rates for spring wheat genotypes are presented in Table 5. Genotype effects were significant for investigated traits. Three spring wheat genotypes were detected as high yielding under both low N (GY 547.4–564.1 g m−2) and high N (GY 592.5–609.5) rates, confirming the lack of a significant G × N interaction effect. Overall, for the GY, the ranking order of WAASB values for genotypes differed between the N rates. Genotypes DS-655-7-DH and DS-720-3-DH had a below average GY stability ranking via WAASB over all investigated environments. In turn, the top-yielding DS-17-16-DH exhibited the best stability only under a low N rate. Genotype 990-2 on the contrary ranked first via WAASB under N150, but only ranked thirteenth under N75. The variety Betong showed comparatively good GY results and stability under both high and low N rates. The other genotypes, characterized by a high stability ranking via WAASB in both N rates, showed below-average yield levels. The genotype Zombi had the same stability rank across both N rates.
GPCs among different genotypes varied from 11.7 to 14.0% under low N, and from 13.2 to 16.0% under high N. The results showed that genotypes 876 and Runar, with the lowest yield in the investigated environments, exhibited the highest (first and second) GPCs in both N rates. However, in both N rates, these genotypes exhibited some of the lowest stability rankings via WAASB among the 16 tested genotypes. The top-yielding genotype DS-17-16-DH exhibited one of the lowest GPCs under both N rates, where the ranking of WAASB stability values between both N rates distinctly differed. Voore simultaneously combined above average GPCs (13.1 and 14.7% under N75 and N150, respectively) and showed a good stability ranking (fourth) under high N. Overall, the top ranking WAASB values for the GPC were detected for genotypes 013-074, 990-2, and Hiie (all grown under high N) with the GPC approaching the trait average values.
Genotypes DS-17-16-DH, DS-655-7-DH, DS-720-3-DH, 013-01, and DS-638-5-DH were high yielding over all investigated environments and were characterized comparatively by the longest average growing period (DM 106.9–108.6 days) among the 16 tested genotypes (Table 6). All high-yielding genotypes also obtained the highest NDVI values in GS75 and GS85. High-yielding genotypes DS-17-16-DH and DS-638-5-DH were characterized with comparatively short PHs, but for DS-655-7-DH and DS-720-3-DH, this trait was above average. Wheat genotypes 876 and Runar were at the top of GPC rankings, and were characterized by the comparatively tallest plants (fourth and first ranked, respectively), fewer DM (102.8 and 103.1 days, respectively), and the lowest NDVI values in all growth stages. Different patterns in terms of NDVI profiles between genotypes were observed. For instance, for DS-655-7-DH, comparatively high values of the NDVI were detected in all investigated growth stages, but for high-protein cultivar Runnar, the highest NDVI values were only observed in GS25 (Table 6).

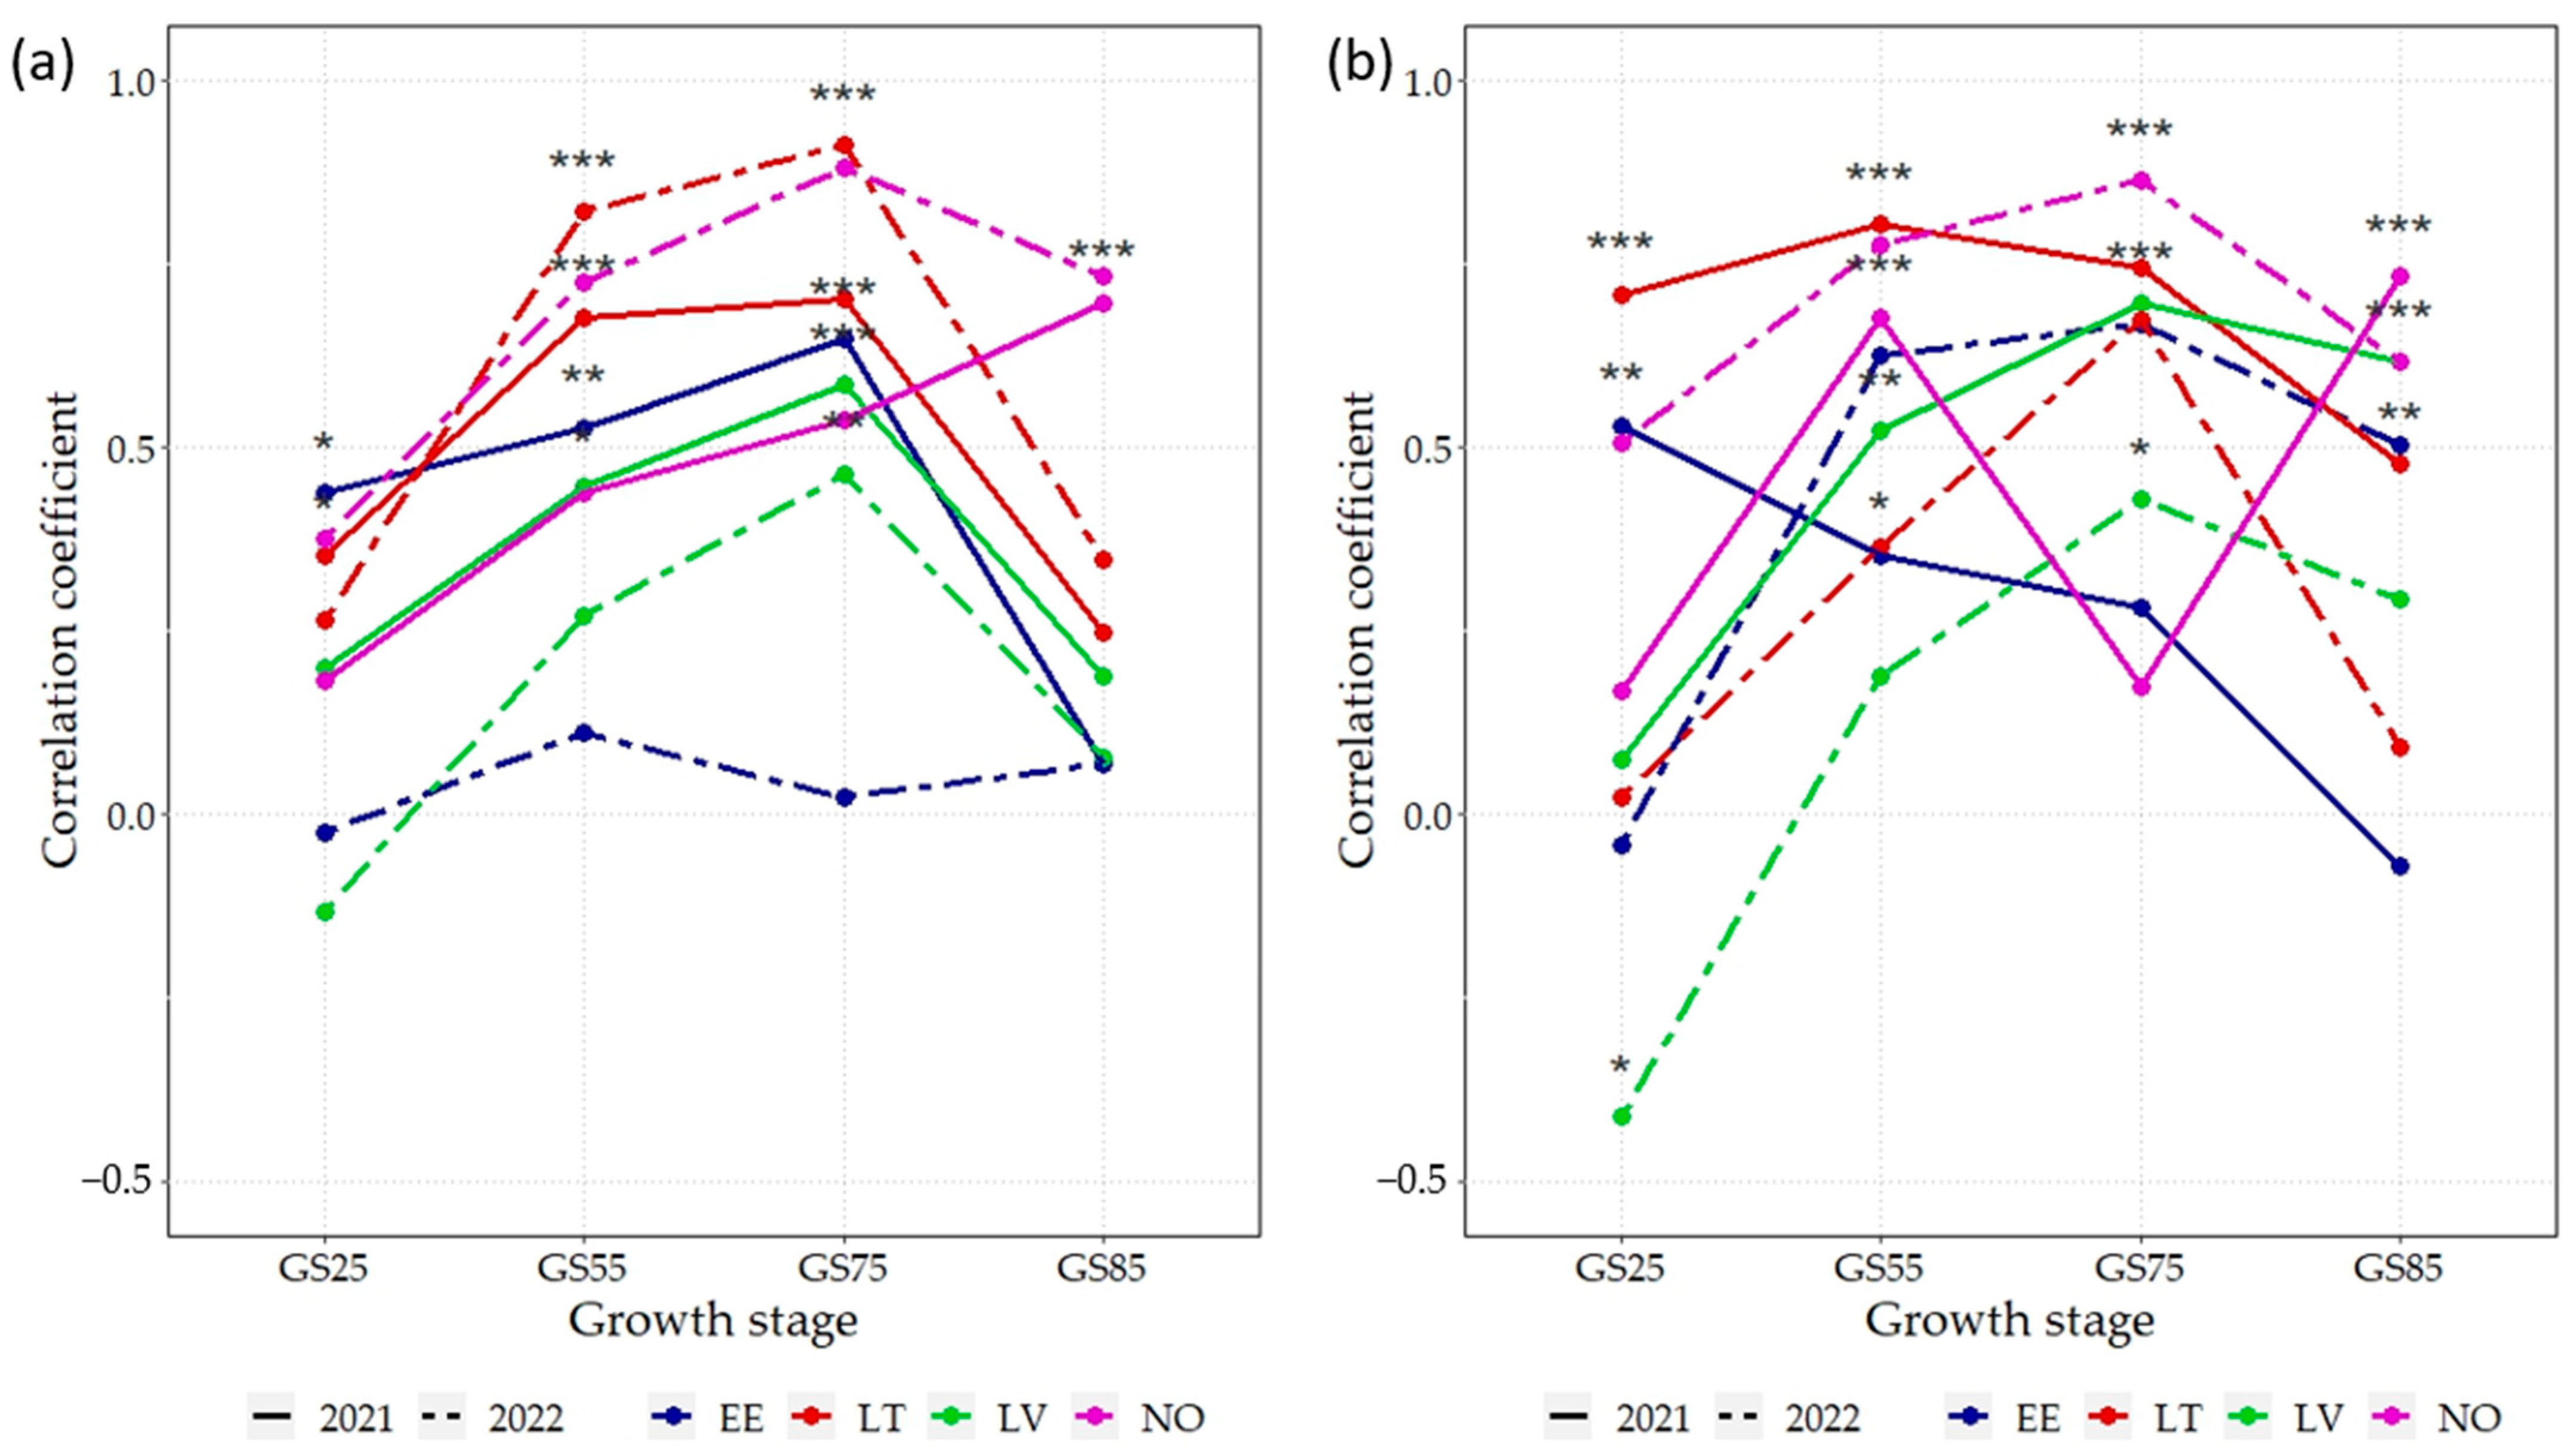
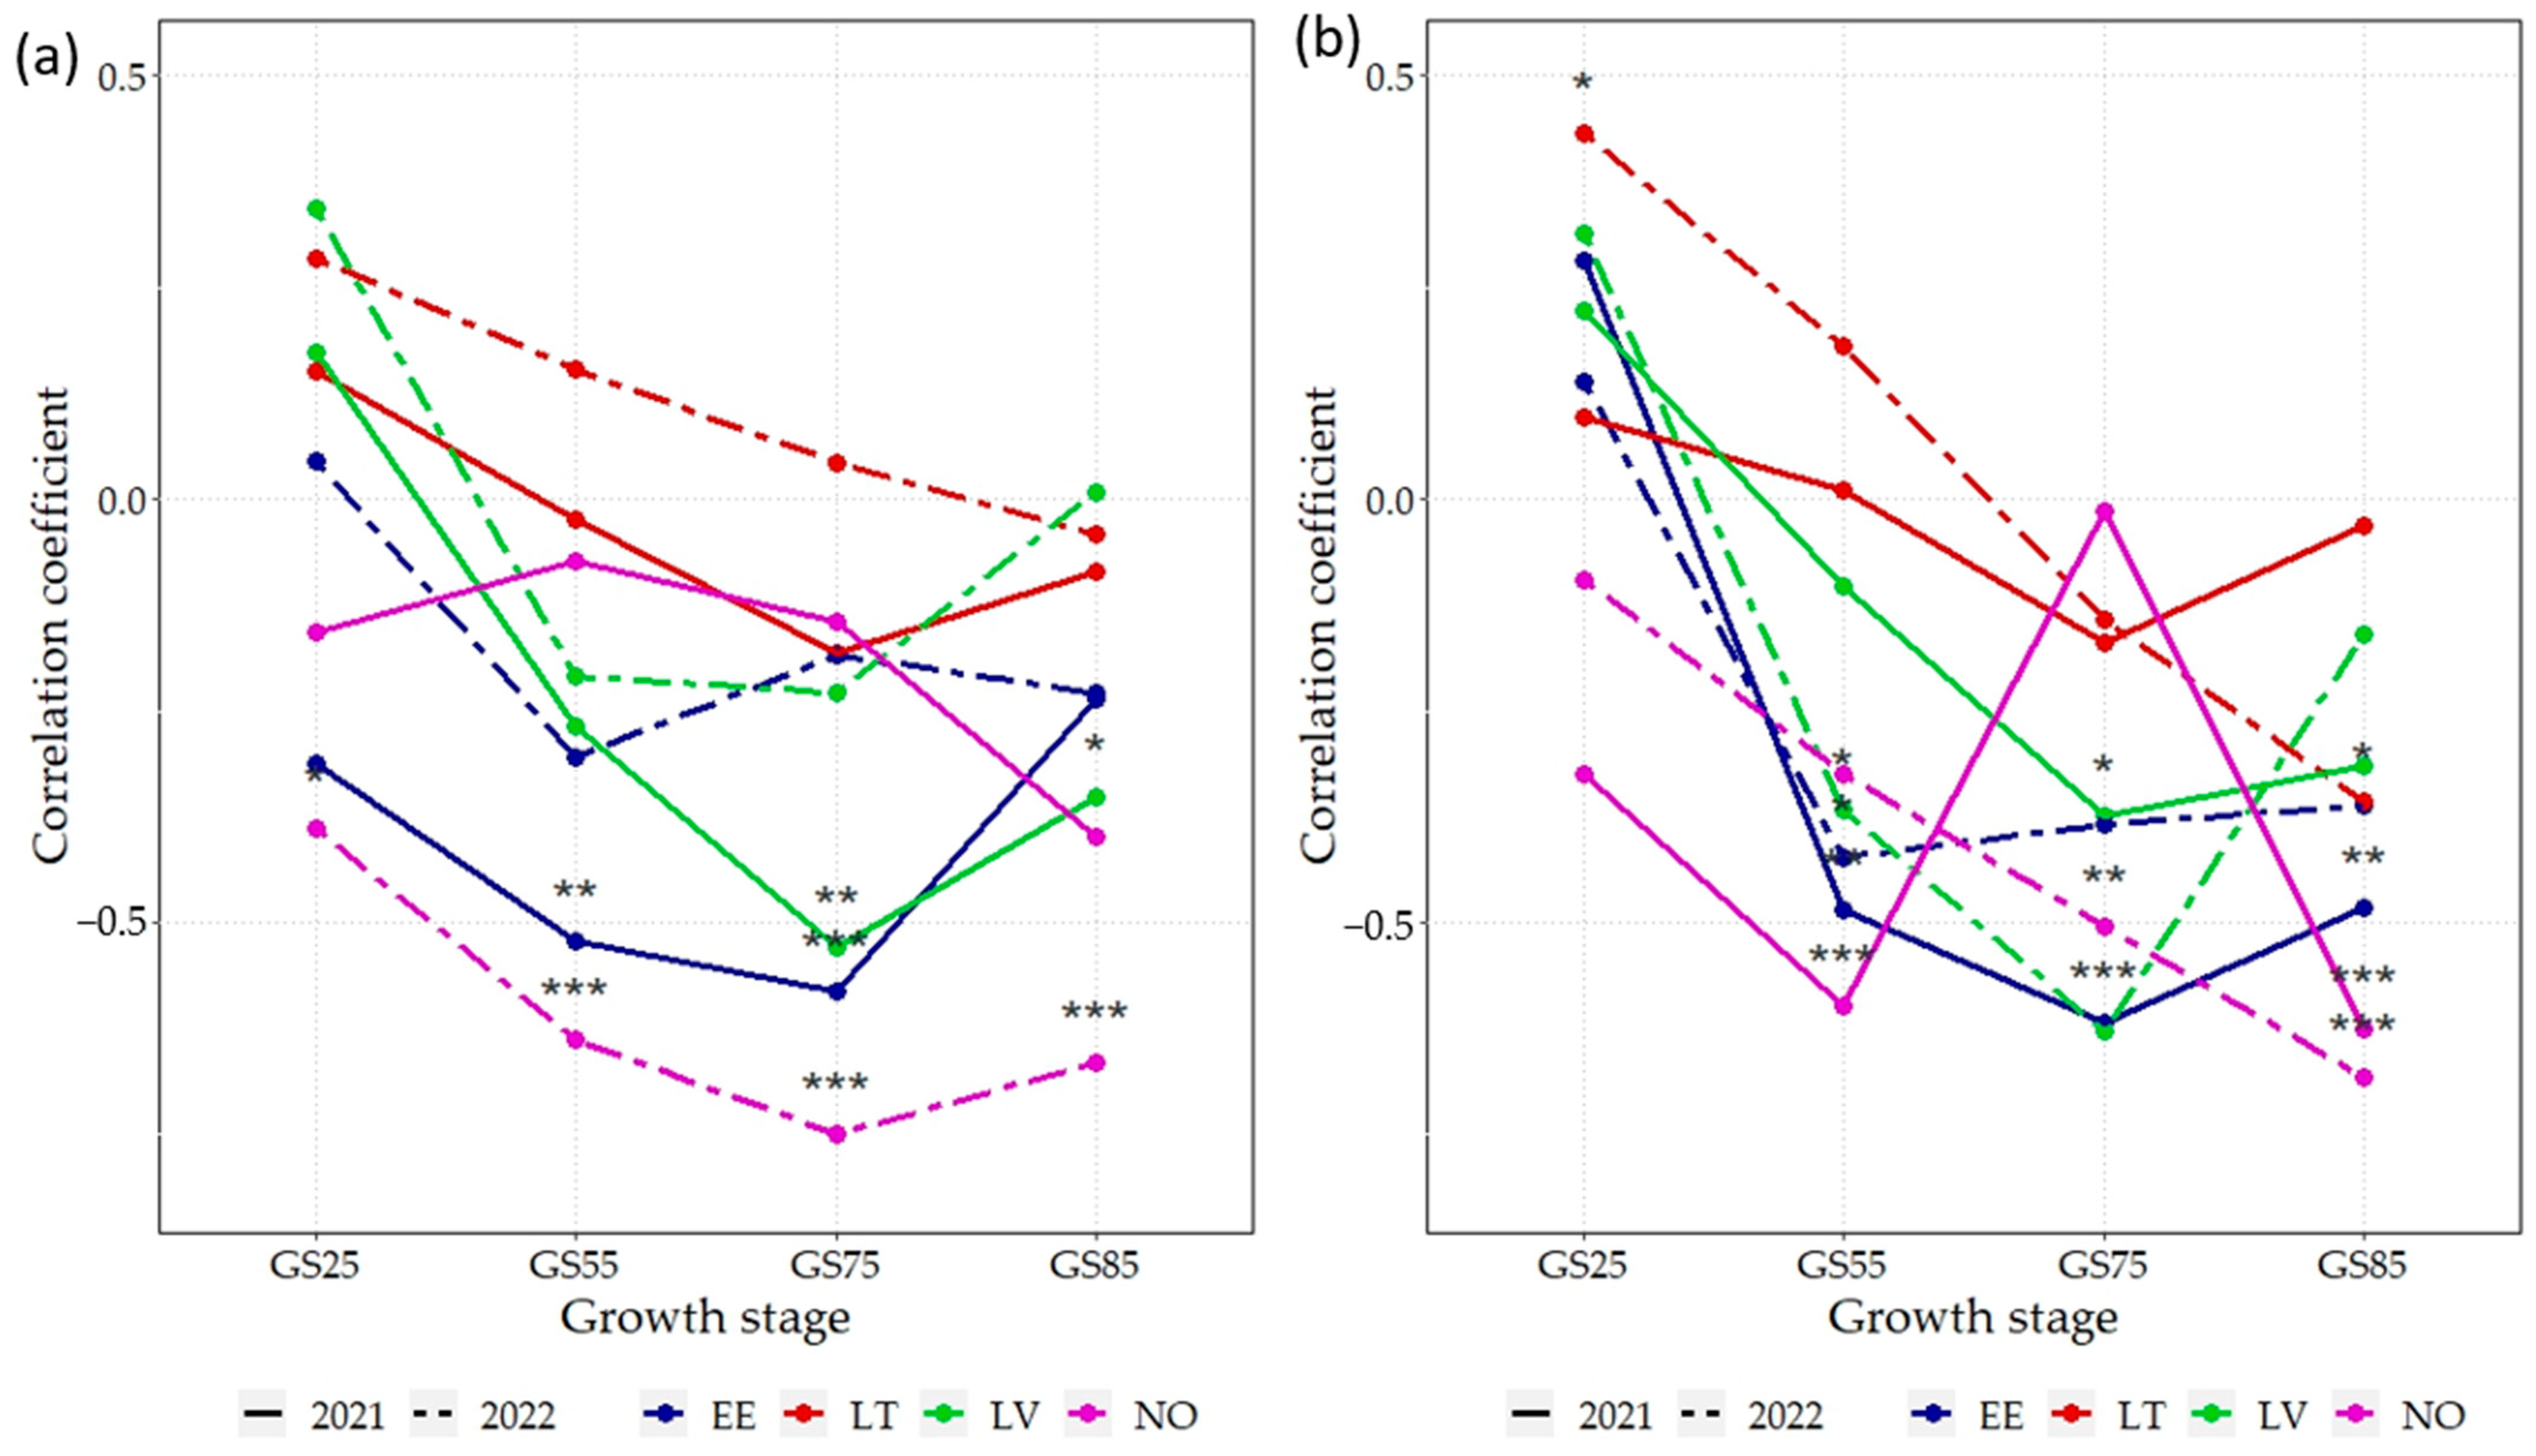
3.5. Correlations between NDVI and GY, GPC

As the above-described results obtained in the trial locations demonstrated the significant effect of year and N rate on the variation in the GY and GPC, relationships with the NDVI were therefore analysed separately in each of the 16 environments. Correlation analyses generally indicated a strong positive relationship between the NDVI and GY at the N75 rate, which differed between environments and plant development stages (Figure 3a). The strongest and most consistent correlations were found in LT and NO in 2022, which were statistically significant at all developmental stages (p < 0.05), except for LT at GS85. In almost all environments, the strongest correlations were found at GS75; all of them, apart from EE in 2022, were significant (p < 0.01). Correlations from 2021 were more similar between environments compared to 2022.
At the N150 fertilization rate, the overall strength of correlations between the NDVI and grain yield (GY) was similar to that at N75. Coefficients were the highest (r > 0.75) for NO in 2022 and LT in 2021 (GS55). For most environments and growth stages, the correlation between the NDVI and grain yield was positive, except for LV (GS25), where there was a significant (p < 0.05) negative correlation (Figure 3b). Overall, at GS25, correlative relationships between the GY and NDVI remained lower compared to the respective results of later growth stages, with the notable exception of EE in 2021, where GS25 had the strongest significant correlation (p < 0.01).
For the GPC, correlations with NDVI were notably weaker and mostly negative compared to the GY, or remained non-significant (Figure 4a). At N75, strong negative correlations (r > −0.5) were found for GS25 (in NO in 2022, EE in 2021, and LV 2021). All the significant correlations at N75 between the GPC and NDVI remained negative. GS75 was also the stage with the strongest overall correlations compared to other development stages. However, in most environments, at GS25 and GS55, correlations between NDVI and GPC were non-significant.
At N150, the correlation coefficients between GPC and NDVI were mostly negative or non-significant (Figure 4b). A notable exception to this was in NO (in 2021 and 2022), where significant negative correlations (r < −0.25) were found at GS55, GS75, and GS85. Similarly, in EE in 2021 and 2022, the negative correlation was rather strong (r < −0.5) for GS55 and for GS75 and GS85. In LT in 2022, the positive correlation was significant (p > 0.05) at GS25—the only significant one for the GPC and NDVI at N150.

3.6. Linear Relationships between NDVI and GY, GPC

A linear regression analysis showed that the most significant relationships between GY and NDVI values were found at the milk growth stage (GS75) and heading growth stage (GS55) (Table 7). Conversely, the dough growth stage (GS85) only had two significant relationships. Specific environments stood out; for instance, NO trials at GS85 were highly significant (p < 0.001) for both years and at both N rates. Lithuania for 2022 showed the highest R2 at GS75 and at N75 (0.82, p < 0.001) and an exceptionally low RMSE value (29.96). Overall, NO trials in 2022 showed the most consistent and significant relationships with the GY for both years and N rates.
Differences in significance between the two N rates were also present; for the GY, trials with N150 showed more significant relationships compared to N75 (23 and 17, respectively, from a total of 32 measured relationships in Table 7). This was especially clear at GS25 and GS85. RMSE values for N75 were on average half of those for N150. Additionally, in EE trials, the GY at GS75 was non-significant at N75 but highly significant at N150 for both years (adj. R2 = 0.40 and 0.42). In LT trials, the GY was highly significant for both GS55 and GS75 in both years.
The GPC showed fewer significant relationships with NDVI values compared to GY. Similarly, as for the GY, most environments showed significant relationships at GS75 and GS85, with N150 having a slightly higher number of these. In contrast to GY, differences in RMSE values for the GPC were on average similar between N75 and N150. For all tested environments, the NO trial in 2022 showed the most consistent and significant relationships with the GPC at GS75 and GS85 (adj. R2 = 0.23–0.55).

4. Discussion

Given that the price of common wheat is determined by the GPC in most wheat markets, including the Nordic–Baltic region, this study focused on the GY and GPC as the most critical economic traits. This comprehensive multifactorial study of spring wheat genotypes, incorporating remote phenotyping data, marks a pioneering effort under the conditions of the Nordic–Baltic region, supplying practical knowledge for breeders.

4.1. Variations in Meteorological Conditions across Trial Years and Locations Resulted in Differences in the GY and GPC

The impacts of climatic variability have been observed in the last few decades, where drought stress is a major factor that affects the wheat GY and GPC, increasing the variability in these traits under Baltic region conditions [7]. A meta-analysis based on wheat data showed that drought significantly decreased GYs and increased GPCs [32]. In our study, drought conditions were recorded in 2021, but to a different degree, in different growing periods, and for varying durations across the four locations, resulting in substantial GY and GPC variation. In 2021, when higher average daily temperatures and lower precipitation were seen, a significantly lower GY was obtained in three out of the four trial locations (EE, LV, and NO). Considering that the complete amount of N fertilizer was applied before sowing, the heavy rainfall experienced in LT in June of 2022 caused leaching of N from the upper soil layer, which is likely the main reason for both the lower GY and GPC in this location. Elevated temperatures during grain filling can result in high protein percentages because these conditions tend to reduce starch synthesis more than protein synthesis [33]. In 2021, temperature and moisture conditions were more favourable for the formation of a higher mean GPC compared to 2022 in EE, LV, and LT, but in NO, the mean value of the GPC did not exceed 12% because of comparatively lower mean daily temperatures in June and July in this location.
In our study, the estimated field traits were significantly affected by N fertilization rates in almost all locations, with some exceptions, which can also be explained by differences in meteorological conditions between locations. It is generally acknowledged that an appropriate increase in nitrogen supply improves plants’ yields, grain quality, and resistance to abiotic stresses [34]. Recently, several attempts have been made to compare plants’ yield penalties due to drought and heat stresses under low and high nitrogen supplies in the field conditions for wheat. Giménez et al. (2021) [35] proved that an increased temperature overnight resulted in an increased tiller mortality only under a high nitrogen supply. A recent study showed that a high nitrogen supply mitigated the adverse effects of drought and heat stresses when they were applied separately. However, when the two stresses were combined, wheat growth and grain yield were negatively affected by a high N supply [36]. In 2021, comparatively worse drought conditions were present in EE and LT; however, the timing of water shortages was different in these locations. In EE, plants experienced drought in June, while the water deficit was mostly in July in LT. In EE, the average yield was significantly higher under a high nitrogen supply, while it was significantly higher under a low nitrogen supply in LT in 2021. The obtained results of yield reductions under a high N rate imply that a high nitrogen supply under a water deficit together with unusually high temperatures at anthesis and during grain filling might cause higher plant sensitivity to drought stress. Considering that drought and high temperatures are becoming more frequent due to global warming, the rates of N fertilization might need to be revised to avoid not only pollution of the environment, but also yield penalties.
In this study, the UAV-derived NDVI obtained at four growth stages also showed significant variation between trial years, although there was no marked consistency between locations due to the aforementioned differences in meteorological variables. The NDVI, as a basic measure of plant vitality and vegetation density, can be influenced by plant growth stages, vegetation cover percentages, plant health and stress, weather conditions, and crop management [37]. In a study by Thapa et al. (2019) [38] in winter wheat, it was detected that as the water stress increased, NDVI values across seasons decreased. Our results showed that the NDVI exhibited a significant difference between N treatments consistently in all locations during GS55, GS75, and GS85, with higher values found under high N compared with low N conditions, although in the study of Yousfi et al. (2019) [39], the NDVI did not show significant differences under contrasting N conditions (N0 and N160).

4.2. Spring Wheat Genotypes Grown under Contrasting N Rates Differed in Stability and Exhibited Different Patterns in NDVI Profiles during Seasons

Genotypes and their genetic characteristics are also key factors that affect the variation in traits in spring wheat. Our results showed that genotype effects were highly significant (p < 0.001) for all traits, showing the presence of wide genetic variation among the genotypes. This is explainable, as the set of 16 genotypes included in this study consisted of both older and newly registered spring wheat genotypes (Table S1), which also differed significantly in terms of PH and the length of the DM (Table 6). Higher input prices and environmental concerns are now also focused on common wheat breeding programs towards low-input agricultural practices, and, more particularly, low N input management [40]. In our research, we were also interested in determining the significant genotype-by-nitrogen (G × N) interaction variability for the studied traits, which would indicate wheat tolerance to N constraints. An analysis of variance showed that in our study, the G × N interaction was not significant for any of the investigated traits (Table S4). Other studies have found both significant [25] and non-significant [41] effects of this interaction factor on GY variability. Hitz et al. (2017) [25] indicated that to select for high yield potential (or NUE), breeding material must be evaluated under both low and high N conditions. A high yield potential only under low N conditions will not be enough to ensure success, since the ability to respond to high rates of N is also important to achieve wide cultivation of a genotype. The three top-yielding spring wheat genotypes DS-655-7-DH, DS-17-16-DH, and DS-720-3-DH (all originated from LT) have been characterized by breeders as high-yielding breeding lines, which was also confirmed in our study, as these genotypes showed the best results under both low and high N rates. The results also showed that the grain yield is strongly associated with the DM; a longer vegetation period comes with a higher GY. In turn, early-maturing genotypes Voore, 876 (both from EE) and Runar (NO) provided the lowest yield, but at the same time exhibited a higher GPC under both N rates. The focus on more yield-stable genotypes will prevent N losses in unfavourable years [42]. We found signs that a genotype that is stable with respect to variation in one influencing factor will not always be relatively stable in response to variation in a different influencing factor, as also shown by Weiner at al. (2021) [43]. We determined genotype performance and stability under different N rates in eight environments by using the WAASB stability index, which is based on the AMMI model [30]. Only a limited amount of published research was found on yield stability investigations under different N rates for wheat [44]. We found that genotypes had different yield stabilities depending on the N rate. DS-17-16-DH was the most stable for GY only under low N, but genotype 990-2 in contrast has the best WAASB stability results under high N. The genotypes Zombi, with a below average GY, and 013-074, with a below average GPC, has a high WAASB stability ranking across both rates of N.
An analysis of variance showed that a comparatively high magnitude of the genotype as a factor effect for the NDVI was seen in the milk (GS75) and dough (GS85) development stages, except in EE in 2022 (Table S4). We recognized that all identified high-yielding genotypes were characterized by the highest NDVI values in GS75 and GS85 (Table 6). During earlier stages of plant development (GS25; GS55), the characteristics of those genotypes showed different patterns in terms of NDVI profiles. For instance, for top-yielding DS-655-7-DH, comparatively high values of the NDVI were detected in all investigated growth stages, while the old, early-maturing, high-protein cultivar Runar showed one of the highest NDVI values only in GS25.

4.3. Correlations and Linear Relationships between the GY, GPC, and UAV-Derived NDVI Highlight Key Crop Growth Stages

We used the UAV-derived NDVI as the main vegetation index, since it has been widely used in vegetation assessments in general and wheat phenotyping in particular [19]. Our preliminary checks showed that the use of red edge indices (in this case, NDRE) strongly correlates with the NDVI. The correlation between NDRE and yield is weak, not significantly better. A study of rapid wheat phenotyping using the NDVI in China showed that it had more consistent correlations with grain yield compared to other indices like NDRE and NGRDI [45]. Wheat trials in Australia found that UAV-derived NDVI values were strongly correlated with the hand-held GreenSeeker sensor (R2 = 0.85) [46], which can be considered as a baseline for such measurements.
Analysing the relationships between NDVI and grain yield (GY) data in each of the 16 environments, we found the strongest correlations between the NDVI and GY at GS75 (r = 0.74, p < 0.01), which shows that this period can be used for the exploration of the predictive power of the NDVI by linear models. By using a split-plot design, Sultana et al. (2014) [47] found that the NDVI had the strongest correlations (R2 > 0.9) with GY in booting, grain filling, and maturity stages.
UAV data collected at the heading stage were superior for predicting GPCs, while the GY was more accurately predicted during the grain filling stage [48]. A study in Idaho, USA [49], reported similar findings, with strong linear relationships between GY and NDVI values in the middle phase of plant development (R2 = 0.78). Yousfi et al. (2016) [50] showed correlation coefficients between GY and NDVI ranging from 0.36 to 0.74.
Another main response variable—the grain protein content (GPC)—expressed a negative relationship with the NDVI, which is typical and has been reported in several studies [51,52]. GPC prediction is less straightforward compared to GY prediction, often requiring machine learning methods and ensembles of predictors [53,54]. Li-Hong et al. (2007) [55] concluded that using a single measurement of spectral reflectance was not enough to predict GPCs reliably in wheat. A study in China [54] found that in GPC prediction from UAV-derived NDVIs using machine learning methods, the RMSE did not exceed 0.74. Our study also found a weaker relationship between the NDVI and GPC compared to GY. Research has found that the weak relationship between the NDVI and GPC makes it a suboptimal index for protein content prediction in wheat [56].
A study using correlation analyses for wheat trials with high-resolution NDVI data for yield found average to strong correlations (r = 0.60–0.81) and was able to distinguish between various rates of fertilization [27]. Here, we showed that N fertilization rates did not significantly affect the strength of correlations between the NDVI and GPC, since the highest r values were found at the same locations and growth stages for both N75 and N150.
Differences in correlations between environments were quite pronounced for all yield parameters. Two locations, NO and EE, stood out, especially for significant correlations between the NDVI and GY in GS25 and GS85, absent in other environments. Such differences in early and late stages of crop development could be explained by variations in biophysical parameters of the environments in these trials. Sánchez et al. (2023) [57] mention that NDVI values are influenced by soil type and moisture as well as local meteorological conditions, which are impossible to control in field trials.
Our study proved that UAV-derived NDVI data, combined with field-collected agronomic data, may be successfully employed for multi-environmental trials of wheat phenotyping. One of our main findings is that NDVI values at GS55 and GS75 were the most significant linear predictors for spring wheat GYs. Other studies [58,59] reported the highest R2 values for linear relationships between the wheat NDVI and GY at these stages. However, it is important to note that uncertainties arise from differences in growing conditions during crop development stages. In our study, GY showed more significant relationships compared to GPC. This is also visible in many studies which use GY as the main response variable, see [60].
In our trials, a higher N application rate (N150) exhibited slightly more significant linear relationships compared to N75, although this was not clear from a correlation analysis. This effect was expected since the N fertilization rate is known to influence NDVI values [24,61]; however, the influence on R2 values between environments was quite modest.
A single growing season with a major meteorological influence, for example, significant drought stress, can alter expected NDVI values. Thapa et al. (2019) [38] report that drought stress at the later stages of wheat development reduced the strength of the relationship between the NDVI and GY.

5. Conclusions

Overall, our study reveals the intersection of climate issues and agricultural development in the Nordic and Baltic region. Unusual temperatures and water deficits during critical stages of plant development emphasize significant meteorological differences between years and locations. The study shows a clear link between these deviations and their effects on nitrogen uptake, causing substantial phenotypic changes and altering trait relationships in different environments. Our findings supply important insights into the development of resilient crops under changing environmental conditions.
In brief, our research found high-yielding spring wheat genotypes that performed well under both high and low nitrogen rates. Genotypes with early maturity exhibited higher grain protein contents. This study revealed that variations in grain yield stability among different genotypes depend on nitrogen rates.
This study underscores substantial enhancements in wheat phenotyping research through UAV-derived data, particularly in a multi-environment pilot project. A key finding is the importance of the role of NDVI analysis at GS55 and GS75, serving as a significant linear predictor, particularly for spring wheat grain yields. However, it is crucial to note that the impact of these indices varies across different growing conditions at various locations, limiting their universal applicability. To perfect their effectiveness, a nuanced understanding of the intricate relationships between NDVI values and local growing conditions is essential. Further research and optimization of these indicators for specific environments are necessary.

Supplementary Materials

The following supporting information can be downloaded at: https://www.mdpi.com/article/10.3390/agronomy14010051/s1, Table S1: Name, origin, and description of the spring wheat genotypes selected for study; Table S2: Physical and chemical properties of the experimental soil before sowing at four locations (EE, LV, LT, NO) and two growing year (2021, 2022); Table S3: Results of a three-way ANOVA for GY, GPC, and NDVI at different growth stages; Table S4: Results of a two-way ANOVA for GY, GPC, and NDVI at different growth stages.

Author Contributions

Conceptualization and methodology, G.B., M.L, M.B., H.K. and I.T.; formal analysis, M.B., Z.J. and A.L.; investigation, A.G., A.A, T.M., S.S., M.L., Z.J., A.L. and A.I.; resources, M.L.; data curation, A.G., A.A. and Z.J.; writing—original draft preparation, M.B., Z.J. and Z.R.; writing—review and editing, A.G., A.A., G.B., H.K., M.B., Z.R., Z.J., M.L, A.L., I.T. and A.I.; visualization, A.G. and Z.J.; project administration, G.B.; funding acquisition, G.B., M.L., M.B., H.K. and I.T. All authors have read and agreed to the published version of the manuscript.

Funding

This research was funded under the project “NOBALwheat—breeding toolbox for sustainable food system of the NOrdic BALtic region”, which received funding from Iceland, Liechtenstein, and Norway through EEA Grants, with the Research Council of Lithuania (LMTLT) contract No. S-BMT-21-3 (LT08-2-LMT-K-01-032).

Data Availability Statement

Data are available from the authors upon reasonable request.

Conflicts of Interest

The authors declare no conflict of interest.

References

  1. FAOSTAT. Crops and Livestock Production. 2023. Available online: https://www.fao.org/faostat/en/#data/QCL (accessed on 12 June 2023).
  2. Wirehn, L. Nordic agriculture under climate change: A systematic review of challenges, opportunities and adaptation strategies for crop production. Land Use Policy 2018, 77, 63–74. [Google Scholar] [CrossRef]
  3. FAOSTAT. Crops and Livestock Production. 2021. Available online: https://www.fao.org/faostat/en/#data/QCL (accessed on 30 November 2021).
  4. Lillemo, M.; Dieseth, J.A. Wheat breeding in Norway. In The World Wheat Book, A History of Wheat Breeding; Bonjean, A.P., Angus, W.J., van Ginkel, M., Eds.; Lavoisier Publishing: Paris, France, 2011; Volume 2, pp. 45–75. [Google Scholar]
  5. Ruzgas, V.; Liatukas, Z. Wheat breeding in Lithuania. In The World Wheat Book, A History of Wheat Breeding; Bonjean, A.P., Angus, W.J., van Ginkel, M., Eds.; Lavoisier Publishing: Paris, France, 2011; Volume 2, pp. 175–192. [Google Scholar]
  6. Strazdina, V.; Belicka, I.; Rashal, I.; Grauda, D. History of wheat breeding development in Latvia. In The World Wheat Book, A History of Wheat Breeding; Bonjean, A.P., Angus, W.J., van Ginkel, M., Eds.; Lavoisier Publishing: Paris, France, 2011; Volume 2, pp. 213–238. [Google Scholar]
  7. Koppel, R.; Ingver, A.; Ardel, P.; Kangor, T.; Kennedy, H.J.; Koppel, M. The variability of yield and baking quality of wheat and suitability for export from Nordic-Baltic conditions. Acta Agric. Scand. Sect. B Soil Plant Sci. 2020, 70, 628–639. [Google Scholar] [CrossRef]
  8. Ross, A.S. Genetic and other factors affecting wheat quality. In Achieving Sustainable Cultivation of Wheat, Volume 1: Breeding, Quality Traits, Pests and Diseases; Langridge, P., Ed.; Burleigh Dodds Series in Agricultural Science; Burleigh Dodds Science Publishing Ltd.: Cambridge, UK, 2017; Volume 5, pp. 177–211. [Google Scholar]
  9. Cormier, F.; Faure, S.; Dubreuil, P.; Heumez, E.; Beauchêne, K.; Lafarge, S.; Praud, S.; Le Gouis, J. A multi-environmental study of recent breeding progress on nitrogen use efficiency in wheat (Triticum aestivum L.). Theor. Appl. Genet. 2013, 126, 3035–3048. [Google Scholar] [CrossRef] [PubMed]
  10. Sehgal, A.; Sita, K.; Siddique, K.H.M.; Kumar, R.; Bhogireddy, S.; Varshney, R.K.; HanumanthaRao, B.; Nair, R.M.; Prasad, P.V.V.; Nayyar, H. Drought or/and heat-stress effects on seed filling in food crops: Impacts on functional biochemistry, seed yields, and nutritional quality. Front. Plant Sci. 2018, 9, 1705. [Google Scholar] [CrossRef] [PubMed]
  11. Kopecká, R.; Kameniarová, M.; Cerny, M.; Brzobohaty, B.; Novák, J. Abiotic Stress in Crop Production. Int. J. Mol. Sci. 2023, 24, 47. [Google Scholar] [CrossRef] [PubMed]
  12. Hawkesford, M.J. Reducing the reliance on nitrogen fertilizer for wheat production. J. Cereal Sci. 2014, 59, 276–283. [Google Scholar] [CrossRef]
  13. Marsh, J.I.; Hu, H.F.; Gill, M.; Batley, J.; Edwards, D. Crop breeding for a changing climate: Integrating phenomics and genomics with bioinformatics. Theor. Appl. Genet. 2021, 134, 1677–1690. [Google Scholar] [CrossRef]
  14. Ma, J.J.; Zheng, B.Y.; He, Y. Applications of a Hyperspectral Imaging System Used to Estimate Wheat Grain Protein: A Review. Front. Plant Sci. 2022, 13, 10. [Google Scholar] [CrossRef]
  15. Radoglou-Grammatikis, P.; Sarigiannidis, P.; Lagkas, T.; Moscholios, I. A compilation of UAV applications for precision agriculture. Comput. Netw. 2020, 172, 18. [Google Scholar] [CrossRef]
  16. Xie, C.; Yang, C. A review on plant high-throughput phenotyping traits using UAV-based sensors. Comput. Electron. Agric. 2020, 178, 105731. [Google Scholar] [CrossRef]
  17. Fei, S.P.; Hassan, M.A.; He, Z.H.; Chen, Z.; Shu, M.Y.; Wang, J.K.; Li, C.C.; Xiao, Y.G. Assessment of Ensemble Learning to Predict Wheat Grain Yield Based on UAV-Multispectral Reflectance. Remote Sens. 2021, 13, 25. [Google Scholar] [CrossRef]
  18. Prey, L.; Hanemann, A.; Ramgraber, L.; Seidl-Schulz, J.; Noack, P.O. UAV-Based Estimation of Grain Yield for Plant Breeding: Applied Strategies for Optimizing the Use of Sensors, Vegetation Indices, Growth Stages, and Machine Learning Algorithms. Remote Sens. 2022, 14, 17. [Google Scholar] [CrossRef]
  19. Huang, S.; Tang, L.N.; Hupy, J.P.; Wang, Y.; Shao, G.F. A commentary review on the use of normalized difference vegetation index (NDVI) in the era of popular remote sensing. J. For. Res. 2021, 32, 1–6. [Google Scholar] [CrossRef]
  20. Bellón, B.; Bégué, A.; Lo Seen, D.; de Almeida, C.A.; Simoes, M. A Remote Sensing Approach for Regional-Scale Mapping of Agricultural Land-Use Systems Based on NDVI Time Series. Remote Sens. 2017, 9, 600. [Google Scholar] [CrossRef]
  21. Zhu, X.L.; Liu, D.S. Improving forest aboveground biomass estimation using seasonal Landsat NDVI time-series. ISPRS J. Photogramm. Remote Sens. 2015, 102, 222–231. [Google Scholar] [CrossRef]
  22. Beisel, N.S.; Callaham, J.B.; Sng, N.J.; Taylor, D.J.; Paul, A.-L.; Ferl, R.J. Utilization of single-image normalized difference vegetation index (SI-NDVI) for early plant stress detection. Appl. Plant Sci. 2018, 6, e01186. [Google Scholar] [CrossRef] [PubMed]
  23. Pastor-Guzman, J.; Atkinson, P.M.; Dash, J.; Rioja-Nieto, R. Spatiotemporal Variation in Mangrove Chlorophyll Concentration Using Landsat 8. Remote Sens. 2015, 7, 14530–14558. [Google Scholar] [CrossRef]
  24. Cabrera-Bosquet, L.; Molero, G.; Stellacci, A.M.; Bort, J.; Nogués, S.; Araus, J.L. NDVI as a Potential Tool for Predicting Biomass, Plant Nitrogen Content and Growth in Wheat Genotypes Subjected to Different Water and Nitrogen Conditions. Cereal Res. Commun. 2011, 39, 147–159. [Google Scholar] [CrossRef]
  25. Hitz, K.; Clark, A.J.; Van Sanford, D.A. Identifying nitrogen-use efficient soft red winter wheat lines in high and low nitrogen environments. Field Crops Res. 2017, 200, 1–9. [Google Scholar] [CrossRef]
  26. Naser, M.A.; Khosla, R.; Longchamps, L.; Dahal, S. Using NDVI to Differentiate Wheat Genotypes Productivity Under Dryland and Irrigated Conditions. Remote Sens. 2020, 12, 17. [Google Scholar] [CrossRef]
  27. Guan, S.L.; Fukami, K.; Matsunaka, H.; Okami, M.; Tanaka, R.; Nakano, H.; Sakai, T.; Nakano, K.; Ohdan, H.; Takahashi, K. Assessing Correlation of High-Resolution NDVI with Fertilizer Application Level and Yield of Rice and Wheat Crops using Small UAVs. Remote Sens. 2019, 11, 19. [Google Scholar] [CrossRef]
  28. Zadoks, J.C.; Chang, T.T.; Konzak, C.F. A decimal code for the growth stages of cereals. Weed Res. 1974, 14, 415–421. [Google Scholar] [CrossRef]
  29. Zobel, R.; Wright, M.; Gauch, H. Statistical Analysis of a Yield Trial. Agron. J. 1988, 80, 388–393. [Google Scholar] [CrossRef]
  30. Olivoto, T.; Lúcio, A.D.C.; da Silva, J.A.G.; Marchioro, V.S.; de Souza, V.Q.; Jost, E. Mean Performance and Stability in Multi- Environment Trials I: Combining Features of AMMI and BLUP Techniques. Agron. J. 2019, 111, 2949–2960. [Google Scholar] [CrossRef]
  31. R Core Team. R: A Language and Environment for Statistical Computing; R Foundation for Statistical Computing: Vienna, Austria, 2021; Available online: https://www.R-project.org/ (accessed on 15 July 2023).
  32. Wan, C.; Dang, P.; Gao, L.; Wang, J.; Tao, J.; Qin, X.; Feng, B.; Gao, J. How Does the Environment Affect Wheat Yield and Protein Content Response to Drought? A Meta-Analysis. Front. Plant Sci. 2022, 13, 896985. [Google Scholar] [CrossRef]
  33. Asseng, S.; Martre, P.; Maiorano, A.; Roetter, R.P.; O’Leary, G.J.; Fitzgerald, G.J.; Girousse, C.; Motzo, R.; Giunta, F.; Babar, M.A.; et al. Climate change impact and adaptation for wheat protein. Glob. Chang. Biol. 2019, 25, 155–173. [Google Scholar] [CrossRef]
  34. Abid, M.; Tian, Z.; Ata-Ul-Karim, S.T.; Cui, Y.; Liu, Y.; Zahoor, R.; Jiang, D.; Dai, T. Nitrogen Nutrition Improves the Potential of Wheat (Triticum aestivum L.) to Alleviate the Effects of Drought Stress during Vegetative Growth Periods. Front. Plant Sci. 2016, 7, 981. [Google Scholar] [CrossRef]
  35. Giménez, V.D.; Miralles, D.J.; García, G.A.; Serrago, R.A. Can crop management reduce the negative effects of warm nights on wheat yield? Field Crops Res. 2021, 261, 108010. [Google Scholar] [CrossRef]
  36. Ru, C.; Hu, X.T.; Chen, D.Y.; Wang, W.E.; Zhen, J.B.; Song, T.Y. Individual and combined effects of heat and drought and subsequent recovery on winter wheat (Triticum aestivum L.) photosynthesis, nitrogen metabolism, cell osmoregulation, and yield formation. Plant Physiol. Biochem. 2023, 196, 222–235. [Google Scholar] [CrossRef] [PubMed]
  37. Forkel, M.; Carvalhais, N.; Verbesselt, J.; Mahecha, M.D.; Neigh, C.S.R.; Reichstein, M. Trend Change Detection in NDVI Time Series: Effects of Inter-Annual Variability and Methodology. Remote Sens. 2013, 5, 2113–2144. [Google Scholar] [CrossRef]
  38. Thapa, S.; Rudd, J.C.; Xue, Q.W.; Bhandari, M.; Reddy, S.K.; Jessup, K.E.; Liu, S.Y.; Devkota, R.N.; Baker, J.; Baker, S. Use of NDVI for characterizing winter wheat response to water stress in a semi-arid environment. J. Crop Improv. 2019, 33, 633–648. [Google Scholar] [CrossRef]
  39. Yousfi, S.; Gracia-Romero, A.; Kellas, N.; Kaddour, M.; Chadouli, A.; Karrou, M.; Araus, J.L.; Serret, M.D. Combined Use of Low-Cost Remote Sensing Techniques and δ13C to Assess Bread Wheat Grain Yield under Different Water and Nitrogen Conditions. Agronomy 2019, 9, 285. [Google Scholar] [CrossRef]
  40. Laperche, A.; Brancourt-Hulmel, M.; Heumez, E.; Gardet, O.; Hanocq, E.; Devienne-Barret, F.; Le Gouis, J. Using genotype x nitrogen interaction variables to evaluate the QTL involved in wheat tolerance to nitrogen constraints. Theor. Appl. Genet. 2007, 115, 399–415. [Google Scholar] [CrossRef]
  41. Mroz, T.; Dieseth, J.A.; Lillemo, M. Historical grain yield genetic gains in Norwegian spring wheat under contrasting fertilization regimes. Crop Sci. 2022, 62, 997–1010. [Google Scholar] [CrossRef]
  42. Zörb, C.; Ludewig, U.; Hawkesford, M.J. Perspective on Wheat Yield and Quality with Reduced Nitrogen Supply. Trends Plant Sci. 2018, 23, 1029–1037. [Google Scholar] [CrossRef]
  43. Weiner, J.; Du, Y.L.; Zhao, Y.M.; Li, F.M. Allometry and Yield Stability of Cereals. Front. Plant Sci. 2021, 12, 5. [Google Scholar] [CrossRef]
  44. Ali, M. Stability Analysis of Bread Wheat Genotypes under Different Nitrogen Fertilizer Levels. J. Plant Prod. 2017, 8, 261–275. [Google Scholar] [CrossRef]
  45. Hassan, M.A.; Yang, M.J.; Fu, L.P.; Rasheed, A.; Zheng, B.Y.; Xia, X.C.; Xiao, Y.G.; He, Z.H. Accuracy assessment of plant height using an unmanned aerial vehicle for quantitative genomic analysis in bread wheat. Plant Methods 2019, 15, 12. [Google Scholar] [CrossRef]
  46. Duan, T.; Chapman, S.C.; Guo, Y.; Zheng, B. Dynamic monitoring of NDVI in wheat agronomy and breeding trials using an unmanned aerial vehicle. Field Crops Res. 2017, 210, 71–80. [Google Scholar] [CrossRef]
  47. Sultana, S.R.; Ali, A.; Ahmad, A.; Mubeen, M.; Zia-Ul-Haq, M.; Ahmad, S.; Ercisli, S.; Jaafar, H.Z.E. Normalized Difference Vegetation Index as a Tool for Wheat Yield Estimation: A Case Study from Faisalabad, Pakistan. Sci. World J. 2014, 2014, 725326–725328. [Google Scholar] [CrossRef] [PubMed]
  48. Sandhu, K.S.; Mihalyov, P.D.; Lewien, M.J.; Pumphrey, M.O.; Carter, A.H. Combining Genomic and Phenomic Information for Predicting Grain Protein Content and Grain Yield in Spring Wheat. Front. Plant Sci. 2021, 12, 14. [Google Scholar] [CrossRef]
  49. Walsh, O.S.; Marshall, J.M.; Nambi, E.; Jackson, C.A.; Ansah, E.O.; Lamichhane, R.; McClintick-Chess, J.; Bautista, F. Wheat Yield and Protein Estimation with Handheld and Unmanned Aerial Vehicle-Mounted Sensors. Agronomy 2023, 13, 14. [Google Scholar] [CrossRef]
  50. Yousfi, S.; Kellas, N.; Saidi, L.; Benlakehal, Z.; Chaou, L.; Siad, D.; Herda, F.; Karrou, M.; Vergara, O.; Gracia, A.; et al. Comparative performance of remote sensing methods in assessing wheat performance under Mediterranean conditions. Agric. Water Manag. 2016, 164, 137–147. [Google Scholar] [CrossRef]
  51. Feng, M.-C.; Xiao, L.-J.; Zhang, M.-J.; Yang, W.-D.; Ding, G.-W. Integrating Remote Sensing and GIS for Prediction of Winter Wheat (Triticum aestivum) Protein Contents in Linfen (Shanxi), China. PLoS ONE 2014, 9, e80989. [Google Scholar] [CrossRef]
  52. Stoy, P.C.; Khan, A.M.; Wipf, A.; Silverman, N.; Powell, S.L. The spatial variability of NDVI within a wheat field: Information content and implications for yield and grain protein monitoring. PLoS ONE 2022, 17, e0265243. [Google Scholar] [CrossRef]
  53. Barmeier, G.; Hofer, K.; Schmidhalter, U. Mid-season prediction of grain yield and protein content of spring barley cultivars using high-throughput spectral sensing. Eur. J. Agron. 2017, 90, 108–116. [Google Scholar] [CrossRef]
  54. Fu, Z.P.; Yu, S.S.; Zhang, J.Y.; Xi, H.; Gao, Y.; Lu, R.H.; Zheng, H.B.; Zhu, Y.; Cao, W.X.; Liu, X.J. Combining UAV multispectral imagery and ecological factors to estimate leaf nitrogen and grain protein content of wheat. Eur. J. Agron. 2022, 132, 15. [Google Scholar] [CrossRef]
  55. Xue, L.H.; Cao, W.X.; Yang, L.Z. Predicting grain yield and protein content in winter wheat at different N supply levels using canopy reflectance spectra. Pedosphere 2007, 17, 646–653. [Google Scholar] [CrossRef]
  56. Wang, K.; Huggins, D.R.; Tao, H.Y. Rapid mapping of winter wheat yield, protein, and nitrogen uptake using remote and proximal sensing. Int. J. Appl. Earth Obs. Geoinf. 2019, 82, 10. [Google Scholar] [CrossRef]
  57. Sánchez, N.; Plaza, J.; Criado, M.; Pérez-Sánchez, R.; Gómez-Sánchez, M.A.; Morales-Corts, M.R.; Palacios, C. The Second Derivative of the NDVI Time Series as an Estimator of Fresh Biomass: A Case Study of Eight Forage Associations Monitored via UAS. Drones 2023, 7, 19. [Google Scholar] [CrossRef]
  58. Marti, J.; Bort, J.; Slafer, G.A.; Araus, J.L. Can wheat, yield be assessed by early measurements of Normalized Difference Vegetation Index? Ann. Appl. Biol. 2007, 150, 253–257. [Google Scholar] [CrossRef]
  59. Chandel, N.S.; Tiwari, P.S.; Singh, K.P.; Jat, D.; Gaikwad, B.B.; Tripathi, H.; Golhani, K. Yield prediction in wheat (Triticum aestivum L.) using spectral reflectance indices. Curr. Sci. 2019, 116, 272–278. [Google Scholar] [CrossRef]
  60. Noureldin, N.A.; Saudy, H.S.; Ashmawy, F.; Saed, H.M. Grain yield response index of bread wheat cultivars as influenced by nitrogen levels. Ann. Agric. Sci. 2013, 58, 147–152. [Google Scholar] [CrossRef]
  61. Walsh, O.S.; Torrion, J.A.; Liang, X.; Shafian, S.; Yang, R.; Belmont, K.M.; McClintick-Chess, J.R. Grain yield, quality, and spectral characteristics of wheat grown under varied nitrogen and irrigation. Agrosyst. Geosci. Environ. 2020, 3, e20104. [Google Scholar] [CrossRef]
Figure 1. Meteorological parameters at the field trial locations (NO—Norway, EE—Estonia, LV—Latvia, LT—Lithuania) and seasons (2021, 2022) compared to 30-year long-term average (LTA) data (1991–2020): (a) deviation from the mean daily temperature from LTA; zero values on the y-axis represent the LTA; (b) monthly rainfall as a percentage of the LTA; 100% on the y-axis represents the LTA.
Agronomy 14 00051 g001
Figure 2. Boxplot showing the phenotypic distribution of (a) grain yield (GY) and (b) grain protein content (GPC) for 16 spring wheat genotypes grown in 16 environments. The black horizontal line in each boxplot is the median, the lower and upper box edges are the first and third quartiles, respectively, and the whiskers are the data minimum and maximum. The black circle in each plot is the mean for that class. Outliers are shown as open circles; EE—Estonia, LV—Latvia, LT—Lithuania, NO—Norway; 2021 and 2022—year of trials; N75—N rate with 75 kg N ha−1; N150—N rate with 150 kg N ha−1; a, b—significant differences (p < 0.05) between the mean values of two N rates within each location and year are shown by different superscript letters.
Agronomy 14 00051 g002
Figure 3. Correlation coefficients (r) between the NDVI and grain yield across 16 spring wheat genotypes grown under two N rates: (a) 75 kg N ha−1, (b) N150—150 kg N ha−1 in eight environments; EE—Estonia, LV—Latvia, LT—Lithuania, NO—Norway; NDVI—normalized difference vegetation index; GS25—tillering growth stage; GS55—heading growth stage; GS75—milk growth stage; GS85—dough growth stage; *** p < 0.001; ** p < 0.01; * p < 0.05.
Agronomy 14 00051 g003
Figure 4. Correlation coefficients (r) between the NDVI and grain protein content across 16 spring wheat genotypes grown under two N rates: (a) 75 kg N ha−1, (b) N150—150 kg N ha−1 in eight environments. EE—Estonia, LV—Latvia, LT—Lithuania, NO—Norway; NDVI—normalized difference vegetation index; GS25—tillering growth stage; GS55—heading growth stage; GS75—milk growth stage; GS85—dough growth stage; *** p < 0.001; ** p < 0.01; * p < 0.05.
Agronomy 14 00051 g004
Table 1. UAV flight mission dates for multi-location trials.
Stage of Plant DevelopmentLVEELTNO
20212022202120222021202220212022
Middle of vegetative plant developmentGS2505.2905.2505.3106.0605.2805.2305.2805.31
Spike emergence or headingGS5506.2106.3006.2806.3006.2406.2706.2306.29
Middle of grain fillingGS7507.1307.2207.1207.2107.0907.1907.1307.21
Late grain fillingGS8507.2708.1207.2608.0907.2308.0807.2608.09
GS—approximate growth stage based on the Zadoks growth scale [28]; LV—Latvia, EE—Estonia, LT—Lithuania; NO—Norway.
Table 2. Mean values by years in the trial locations averaged over N fertilization rates for grain yield (GY) and grain protein content (GPC).
YearLocation
NOEELVLT
GY, g m−2
2021477.5 ± 79.1 b466.8 ± 51.9 b490.0 ± 57.2 b533.7 ± 70.7 a
2022589.9 ± 94.6 a619.3 ± 50.5 a622.2 ± 75.7 a478.7 ± 73.3 b
GPC, %
202111.7 ± 1.7 b15.1 ± 1.1 a15.6 ± 0.8 a14.3 ± 0.9 a
202213.8 ± 1.4 a12.5 ± 1.8 b14.5 ± 1.2 b10.9 ± 0.9 b
NO—Norway, EE—Estonia, LV—Latvia, LT—Lithuania; the values with different superscript letters in a row are significantly different between years (p < 0.05).
Table 3. Mean values by years in the trial locations averaged over N fertilization rates for the UAV-derived NDVI at four wheat plant growth stages.
YearLocation
NOEELVLT
GS25
20210.536 ± 0.05 a 0.637 ± 0.05 a0.479 ± 0.03 a0.544 ± 0.08 b
20220.466 ± 0.10 b0.515 ± 0.09 b0.408 ± 0.04 b0.574 ± 0.06 a
GS55
20210.889 ± 0.030.903 ± 0.01 a0.864 ± 0.02 b0.870 ± 0.03 b
20220.882 ± 0.030.894 ± 0.02 b0.905 ± 0.01 a0.885 ± 0.02 a
GS75
20210.821 ± 0.04 b0.791 ± 0.030.763 ± 0.05 b0.755 ± 0.06 a
20220.837 ± 0.04 a0.782 ± 0.070.803 ± 0.04 a0.729 ± 0.06 b
GS85
20210.478 ± 0.09 b0.445 ± 0.060.349 ± 0.04 b0.350 ± 0.04 a
20220.577 ± 0.10 a0.425 ± 0.080.366 ± 0.05 a0.269 ± 0.03 b
NO—Norway, EE—Estonia, LV—Latvia, LT—Lithuania; the values with different superscript letters in a row are significantly different between years (p < 0.05); GS25—tillering growth stage; GS55—heading growth stage; GS75—milk growth stage; GS85—dough growth stage.
Table 4. Mean values of UAV-derived NDVIs obtained at four growth stages from eight environments (combination of locations and years) under low and high N application (N75, N150).
EnvironmentGS25GS55GS75GS85
N75N150N75N150N75N150N75N150
EE_20210.613 b0.660 a0.898 b0.908 a0.7840.7970.430 b0.461 a
EE_20220.5060.5210.8900.8970.7800.7830.4140.436
LV_20210.4770.4750.857 b0.871 a0.748 b0.778 a0.335 b0.363 a
LV_20220.4030.4120.901 b0.910 a0.7990.8070.351 b0.382 a
LT_20210.5460.5420.8680.8720.7530.7570.323 b0.346 a
LT_20220.602 a0.546 b0.878 b0.891 a0.702 b0.755 a0.260 b0.277 a
NO_20210.520 b0.552 a0.866 b0.912 a0.791 b0.850 a0.421 b0.535 a
NO_20220.4670.4660.8850.8800.8370.8360.547 b0.606 a
E—Estonia, LV—Latvia, LT—Lithuania, NO—Norway; NDVI—normalized difference vegetation index; GS25—tillering growth stage; GS55—heading growth stage; GS75—milk growth stage; GS85—dough growth stage. NDVI mean values followed by different letters within columns of each pair of two N rates (N75—75 kg N ha−1, N150—150 kg N ha−1) are significantly different (p < 0.05).
Table 5. Grain yield (GY), grain protein content (GPC), and corresponding weighted average of absolute scores (WAASB) stability index estimates and their ranking for genotypes in the trial averaged over eight environments (combination of location and year) under low N and high N rates.
GenotypeGYWAASB_GYGPCWAASB_GPC
N75N150N75N150N75N150N75N150
g m−2Rg m−2RValueRValueR%R%R%R%R
DS-655-7-DH564.11592.532.7 113.541212.7714.370.39120.3310
DS-17-16-DH558.12609.511.1312.63912.01513.6150.2020.3512
DS-720-3-DH547.43607.724.23162.831013.0514.540.2260.205
DS-638-5-DH539.94575.663.28124.181611.71613.2160.39130.5915
Betong538.65570.971.7342.02612.7914.2110.2250.287
013-01538.46581.744.22153.791512.31413.7140.42150.6116
013-032528.77580.652.34101.43412.51214.2120.42140.3411
Robijs523.68554.893.7143.681412.41314.1130.3080.339
013-074521.49564.481.9872.30712.51114.560.1710.173
990-2507.410528.6133.48131.04112.7814.380.31100.131
Hiie505.911511.5151.2023.201112.61014.2100.2130.142
Zombi496.612533.1111.4931.14313.1314.550.3090.288
Caress493.913548.4101.8561.86512.7614.390.2140.226
Voore489.314532.1122.1391.06213.1414.730.2470.194
876477.915516.4141.7752.43814.0116.010.52160.4813
Runar422.316454.5162.0983.591313.5215.620.32110.5214
Mean515.8 a×553.9 b×2.46×2.54×12.7 b×14.4 a×0.3×0.32×
LSD29.03×34.2×××××0.26×0.38×××××
R—ranking order; mean values of GY and GPC followed by different letters within columns of two N rates (N75; N150) are significantly different (p < 0.05); N75—75 kg N ha−1; N150—150 kg N ha−1; LSD—least significant difference (α = 0.05).
Table 6. Mean values of plant height (PH), days to maturity (DM), and NDVIs at four growth stages and their ranking for genotypes averaged over 16 environments (combination of locations × years × N rates).
Genotype *PH, cmRDM, DaysRNDVI
GS25RGS55RGS75RGS85R
DS-17-16-DH86.312106.950.512110.88680.80950.4275
DS-655-7-DH91.45107.840.53330.89640.82330.4334
DS-720-3-DH90.17108.620.52660.89730.82240.4493
013-0188.58108.430.493150.90420.83710.4912
DS-638-5-DH85.514111.010.504130.91010.83320.5111
Betong86.113104.9100.51880.877120.770110.37910
013-03286.411106.660.505120.89160.80560.4058
013-07488.29104.8110.52370.882100.767120.37112
Robijs94.03106.180.57010.89450.79570.4106
Caress80.415105.490.499140.88390.78090.3829
990-291.16106.270.472160.876140.78080.4077
Zombi76.916104.7120.52650.88970.775100.36913
Voore87.510104.1140.515100.876130.754140.37611
Hiie95.52104.5130.53240.879110.758130.36014
87693.04102.8160.51690.871150.738150.35716
Runar97.71103.1150.56820.870160.716160.36015
LSD1.81×0.48× 0.031×0.001×0.019×0.020×
Mean88.7×106.0×0.519×0.886×0.785×0.405×
* Genotypes are ranked based on GYs over 16 environments (combination of year × location × N rates); PH—plant height; DM—days to maturity; R—ranking order; N75—75 kg N ha−1; N150—150 kg N ha−1; GS25—tillering growth stage; GS55—heading growth stage; GS75—milk growth stage; GS85—dough growth stages; LSD—least significant difference (α = 0.05).
Table 7. Values of RMSE, adjusted R2, and corresponding significance of linear regression analyses in multi-environment trials for the relationships between grain yield (GY) and grain protein content (GPC) as dependent variables and the NDVI as the independent variable.
EnvironmentGrain Yield (GY)Grain Protein Content (GPC)
RMSEadj. R2RMSEadj. R2
N75N150N75N150N75N150N75N150
GS25
EE_202135.0946.490.26 **0.16 *0.650.72−0.030.01
EE_202232.0031.62−0.03−0.030.560.71−0.03−0.01
LV_202152.1650.520.01−0.030.510.730.000.02
LV_202279.2661.47−0.010.14 *0.930.930.090.07
LT_202157.9650.180.10 *0.49 ***0.690.7−0.01−0.02
LT_202270.0271.970.04−0.030.630.580.050.16 *
NO_202146.2466.820.000.000.931.48−0.010.08
NO_202270.9691.320.11 *0.23 **1.231.180.12 *−0.02
GS55
EE_202138.6843.980.1 *0.25 **0.570.650.21 **0.18 **
EE_202231.8124.68−0.020.37 ***0.530.650.060.15 *
LV_202147.6643.20.17 *0.25 **0.50.740.04−0.02
LV_202276.9966.320.040.000.970.910.010.11 *
LT_202145.6042.240.44 ***0.64 ***0.70.64−0.030.13 *
LT_202241.5867.020.66 ***0.10 *0.650.63−0.010 ns
NO_202142.2949.900.16 *0.44 ***0.941.25−0.030.34 ***
NO_202252.5966.730.51 ***0.59 ***1.021.120.39 ***0.08
GS75
EE_202139.6839.400.050.4 ***0.530.540.32 ***0.44 ***
EE_202232.0023.56−0.030.43 ***0.550.660.000.12 *
LV_202143.1736.410.32 ***0.47 ***0.440.690.26 **0.11 *
LV_202270.8361.000.19 **0.16 *0.960.760.020.37 ***
LT_202144.1847.450.47 ***0.54 ***0.690.650.000.12 *
LT_202229.9653.130.82 ***0.44 ***0.660.63−0.03−0.01
NO_202139.6266.750.27 **0.000.931.56−0.01−0.03
NO_202236.0853.460.77 ***0.74 ***0.881.020.55 ***0.23 **
GS85
EE_202141.2451.58−0.03−0.030.60.720.11 *0.01
EE_202231.9327.36−0.030.23 **0.540.670.020.1 *
LV_202152.2839.910.000.36 ***0.490.710.09 *0.07
LV_202279.7464.50−0.030.060.990.96−0.03−0.01
LT_202160.0162.530.030.2 **0.70.67−0.030.07
LT_202268.1071.680.09−0.020.660.6−0.030.1 *
NO_202133.6846.160.47 ***0.52 ***0.871.220.13 *0.37 ***
NO_202252.1383.350.52 ***0.36 ***0.990.860.42 ***0.45 ***
Environments: four locations—Estonia (EE), Latvia (LV), Lithuania (LT), Norway (NO); two years—2021 and 2022; two N rates—75 kg N ha−1, N150—150 kg N ha−1 across four crop growth stages: GS25—tillering growth stage; GS55—heading growth stage; GS75—milk growth stage; GS85—dough growth stages. RMSE—root mean square error; * p < 0.05; ** p < 0.01; *** p < 0.001.
Disclaimer/Publisher’s Note: The statements, opinions and data contained in all publications are solely those of the individual author(s) and contributor(s) and not of MDPI and/or the editor(s). MDPI and/or the editor(s) disclaim responsibility for any injury to people or property resulting from any ideas, methods, instructions or products referred to in the content.

