Article

Phosphorus Availability and Uptake following a Maize-Pigeon Pea Rotation under Conservation Agriculture

1
Faculty of Environmental Sciences and Natural Resource Management, Norwegian University of Life Sciences, P.O. Box 5003, N-1432 Ås, Norway
2
Department of Soil Science, School of Agricultural Sciences, University of Zambia, Lusaka P.O. Box 32379, Zambia
*
Author to whom correspondence should be addressed.
Agronomy 2024, 14(1), 169; https://doi.org/10.3390/agronomy14010169
Submission received: 1 December 2023 / Revised: 2 January 2024 / Accepted: 9 January 2024 / Published: 12 January 2024
(This article belongs to the Section Soil and Plant Nutrition)

Abstract

:
Soils on many smallholder farms in Southern Africa are severely depleted in plant nutrients, in particular phosphorus (P), following years of maize monocropping with little or no fertilizer input. Past studies suggest that pigeon pea (Cajanus cajan (L.) Millsp.) may increase plant-available P. Pigeon pea is not a common crop in much of Southern Africa, and the effect of locally grown pigeon pea varieties on plant-available P is unknown. We assessed the changes in plant-available P after growing pigeon pea varieties MPPV-2, MPPV-3, and Babati White in Zambia, viz. Lixisols of Choma and Mkushi, Acrisols of Chipata and Kasama, and Arenosols of Kaoma. The selected soils were not fertilized. Baseline soils (0–20 cm), sampled after long-term maize monocropping and soils from the same fields after growing pigeon pea were collected from field trials in Kaoma, Chipata, Choma, and Mkushi and analyzed for plant-available P. Further, a greenhouse study was conducted with soils from Kasama, Choma, Kaoma, and Chipata, under which soil P was determined before and after growing pigeon pea, soybean (Dina), and maize (SC 419) without fertilizer addition. Pigeon pea under field studies had no significant (p > 0.05) effect on plant-available P in Choma, Kaoma, and Chipata. In Mkushi, pigeon pea cropping resulted in a 47.5% significant decline (p ≤ 0.05) in plant-available P, amounting to a loss of 11.2 kg ha−1. The greenhouse study showed a significant decline (p ≤ 0.001) in plant-available P after seven weeks of maize growth, while there was no significant (p > 0.05) effect on plant-available P after soybean and pigeon pea cropping. The latter was primarily due to the significantly higher P uptake associated with larger biomass production of maize after seven weeks in the greenhouse. During the initial seven weeks, pigeon pea biomass had significantly higher P concentrations than maize. Thus, P deficiency symptoms were exhibited in maize, while pigeon pea appeared healthy. However, mobilized P, calculated as the sum of plant P and soil P after cropping minus soil P before planting, was significantly lower (p ≤ 0.01) in pigeon pea compared to soybean and maize. Synthesizing field and greenhouse experiments suggests that there is a low net decline of plant-available P from soils after pigeon pea cropping. Therefore, rotation with these pigeon pea varieties could be beneficial to resource-poor farmers due to low P removal and its ability to grow in P-deficient soil.

1. Introduction

Agriculture is the main support for the rural economies in Southern Africa, with smallholder farmers in Zambia accounting for more than 80% of the national output. However, because of soil fertility limitations, agricultural productivity is low. In particular, the availability of native phosphorus (P) in the dominant agricultural soils of Zambia is relatively low [1]. Therefore, most Zambian fertilizer management programs involve regular applications of P to the soil. However, smallholder farmers are reluctant to invest in fertilizers because they have limited income, and the returns may be uncertain in risky environments [2], such as increasingly erratic rainfall and often-occurring years with severe drought. The high cost of fertilizers, environmental pollution, and soil degradation due to acidification and salinization caused by the use of fertilizers necessitates the need to utilize fertilizers more efficiently [3,4]. Most of Southern Africa is severely affected by land degradation due to several decades of farming without the use of fertilizer inputs by smallholder farmers. This practice has stripped the soils of vital nutrients needed to support plant growth [5]. This is especially so given that farmers in Southern Africa own relatively small land holdings, and maize is often grown in monoculture with few legumes or other crops in rotation [6].
Monocultures have long been recognized to cause soil degradation compared to crop rotation [7]. A study reported an enhanced yield of wheat subsequently grown after legumes, compared with wheat grown after wheat [8]. In striving to minimize risks associated with heavy dependence on maize monoculture, the Zambian government has been gradually promoting diversification into high-value crops [9]. Land degradation due to monocropping can be alleviated by the promotion of farming systems such as Conservation Agriculture (CA), which has crop rotation with legumes as a principal component [10].
Conservation Agriculture aims to improve soil health and crop productivity through three principles, which include minimum soil disturbance, permanent organic soil cover, and diversification of crop species through rotations or including a balanced mix of legume and nonlegume crops [11]. This system has the potential to increase crop yield through improved physical, chemical, and biological soil properties and has been promoted in Zambia as a strategy to mitigate the negative effects of conventional farming practices [12]. One benefit of CA is the reduced soil carbon losses resulting from the addition of crop residues [13]. Crop rotation can have a major impact on soil health and long-term sustainability due to increased microbial diversity, improved soil structural stability and nutrient use efficiency, increased crop water-use efficiency, and soil organic matter levels [14,15]. One legume crop that is promoted as a viable option in CA systems is pigeon pea (Cajanus cajan (L.) Millsp.). Despite some degree of success, the adoption of CA systems in Southern Africa is hindered by the limited implementation of the principle of crop diversification through rotations and intercropping [16].
Pigeon pea is an important grain legume in the semi-arid tropics and is commonly intercropped with maize or sorghum on poor soils [17]. It provides valuable animal feed and grain for human consumption. This crop has shown agronomic benefits in rehabilitating degraded land and depleted soils due to its high N-fixation capacity [18]. Pigeon pea can bring minerals from deeper soil horizons to the surface [19]. Therefore, it may have a greater ability to replenish soil P fertility due to its ability to exploit subsoil nutrients that other crops cannot use. Pigeon pea was also shown to be more efficient at utilizing iron-bound P due to root exudates like piscidic acid and its p-O-methyl derivative, which chelate Fe3+, to release P [20]. Garland et al. [21] reported a significant increase in soil aggregation under pigeon pea cropping associated with greater accumulation of organic P, which could reduce P losses. In smallholder systems of sub-Saharan Africa, poor soil fertility results in low pigeon pea yields ranging between 0.5 to 0.7 tons ha−1, representing only 20–26% of its potential [22]. In Eastern and Southern Africa, the yield of green pods varies from 1.0 to 9.0 tons ha−1, and that of dry grain may reach 2.5 tons ha−1 in pure stands with modern cultivars [23].
Quantitative estimation of plant nutrient depletion from soils is useful for understanding the state of degradation and for developing corrective measures [24]. Zambia has few improved, officially released pigeon pea varieties. These include MPPV-2 (ICEAP 00554), MPPV-3, and MPPV-4 (ICEAP 01551), with days to maturity ranging 150–180 and grain yield of 1.5–3 tons ha−1 [25]. Data on plant P uptake and changes in soil P after cropping of these varieties are lacking. Information on changes in plant-available P, P uptake by plants, and the potential of these pigeon pea varieties to mobilize P from the soil should be assessed to guide the development of fertilization advice for the next crop. To contribute to filling this knowledge gap, we determined changes in plant-available P after growing the available pigeon pea varieties MPPV-2 and MPPV-3 in Lixisols, Acrisols, and Arenosols under field conditions.
In Zambia, pigeon pea is a little-used crop, which contrasts with its popularity in East Africa, while CA systems usually include maize-soybean rotation. Recently, it was suggested to grow pigeon pea in rotation with other crops, such as maize and cotton, under CA. However, there is a paucity of literature on the effect of rotation with pigeon pea on plant-available P under CA. This study assessed the effect of rotation with pigeon pea on P availability in soils of Zambia. The effect of rotation with locally available pigeon pea varieties on P availability and uptake is important for farmers, extension workers, and policymakers to assess its potential for sustainable land management systems, increased income generation, as well as food and nutrition security among the smallholder farmers.
The assessment of the effect of rotation with pigeon pea on plant P availability was conducted in field experiments, where pigeon pea was grown to maturity without fertilizer addition on previous maize fields. In addition, we conducted a greenhouse pot experiment of seven weeks to test the effect of pigeon pea on P availability and uptake in the early growth stages. Maize and soybean were used as reference crops in the greenhouse experiment.

2. Materials and Methods

2.1. Description of Experimental Site, Design, and Treatments

The study was conducted in Mkushi, Kaoma, Choma, and Chipata districts of Zambia, where field trials were set up, while the greenhouse experiment was carried out at the University of Zambia, School of Agricultural Sciences.
The field trials were carried out on 24 farms (6 farms in each of four districts) at established study sites where pigeon pea was grown in rotation with maize [26] in two agro-ecological zones in Zambia. In agro-ecological zone II, with mean annual rainfall between 800–1000 mm, the sites were in Kaoma, Chipata, and Choma. In agro-ecological zone III, with mean annual rainfall > 1000 mm, the site was in Mkushi. For the greenhouse study, soils were collected from Kaoma, Chipata, and Choma in agro-ecological zone II and Kasama in agro-ecological zone III. Average temperatures during the growing season (November to April) range between 18 °C and 29 °C. The dominant soil groupings at the study sites are Acrisols in Kasama and Chipata, Lixisols in Mkushi, and Choma and Arenosols in Kaoma [27].
The field study was a comparative assessment of plant-available P before and after growing pigeon pea. Six farms, previously with maize cropping, were selected in each of the districts Mkushi, Kaoma, Choma, and Chipata in September 2019. All farms were selected based on homogeneous soil conditions and slope for the experimental trials (2500 m2 each). Land preparation was conducted by digging basins (minimum tillage) of around 15 (w) × 20 (d) × 40 (l) cm, with 90 cm inter-row spacing and intra-row spacing of 70 cm (15,873 basins ha−1). Three pigeon pea seeds were planted at a depth of 2.5–5 cm in each basin and thinned to 2 plants (31,746 plants ha−1). In the 2019–2020 growing season, pigeon pea was planted on the entire experimental area at each of the farms. No fertilizer was applied because most Zambian farmers do not apply fertilizer to pigeon pea fields. Inoculation with Rhizobia was not performed based on the farmer’s practice of growing this crop without inoculation. Pigeon pea variety MPPV-2 was planted in Mkushi, while MPPV-3 was planted in Chipata, Kaoma, and Choma. The two varieties have similar characteristics. MPPV-2 is a drought-tolerant pigeon pea variety with 170–180 days to maturity and potential yields of 2–3 tons ha−1 [25]. MPPV-3 is drought tolerant and takes 150–165 days to mature with potential yields of 1.5–2.5 tons ha−1. Hand weeding was conducted to manage weeds, and plant protection measures were applied as needed to control insect pests. The pigeon pea was harvested in June 2020.
The greenhouse pot trial involved the determination of plant P uptake and changes in plant-available P after growing maize (SC 419), soybean (Dina), and pigeon pea (Babati White) for seven weeks in a randomized complete block design. Soils from the four sites were planted with maize, soybean, and pigeon pea, respectively, replicated three times giving a total of 36 pots. The pigeon pea variety, Babati White, is a local variety in Eastern and Southern Africa [2]. Although several improved pigeon pea varieties are available in Eastern and Southern Africa, access to improved seeds and adoption is limited, and most farmers grow traditional landraces [23]. Throughout the trial, air temperatures in the greenhouse ranged from 23.5 to 39.0 °C with a mean of 31.6 °C.

2.2. Soil Sampling and Analysis

2.2.1. Field Trials

Baseline composite soil samples, sampled after maize cropping, and composite samples taken after pigeon pea harvest (0–20 cm depth) were collected on all six farms in each of the four districts. Composite samples, taken at four points on each farm, were analyzed for plant-available P using ammonium lactate (P-AL) as an extractant based on the method described by Egner et al. [28]. After extraction, the concentration of P was measured on ICP-OES. Total soil carbon was analyzed by dry combustion, as described by Nelson and Sommers [29]. Samples were analyzed on Leco CHN628. Bulk density was determined using the core method [30] after collecting two samples from each farm in core rings at a depth of 0–20 cm.

2.2.2. Greenhouse Study

Soil samples were collected from fields without P fertilizer addition in Kasama, Choma, and Chipata. Kaoma soil was collected from a field previously cultivated with maize, which had been fertilized with “Compound D” (N, P2O5, K2O, 10:20:10) basal fertilizer at the rate of 200 kg ha−1. Soil samples were collected from a depth of 0–20 cm at 10 random spots per field and mixed to obtain a composite sample.
Maize, soybean, and pigeon pea were grown without fertilizer in pots containing 2.5 kg of soil. Nutrient losses out of the pots through leaching were negligible as soils were watered to field capacity with minimal free drainage. The pots were irrigated daily with 150–200 mL water per pot to keep the soil moisture at approximately field capacity. Both above-ground and root biomass were harvested. The soil adhered to roots was washed out with water after putting roots on sieves to prevent loss of fine roots during washing. The biomass was dried in an oven at 65 °C to a constant weight and then weighed to obtain dry matter yield.
Both prior to and after the greenhouse experiment, soils from each pot were sampled. All samples were air-dried and ground to pass through a 2 mm sieve. Soil reaction (pH) was measured in 0.01 M CaCl2 using a 1:2.5 (w/v) suspension [31]. Soil organic carbon (SOC) was determined using the Walkley-Black chromate reduction procedure described by Nelson and Sommers [29]. Total nitrogen (N) was determined using the Kjeldahl method adopted from Bremner and Mulvaney [32]. Iron and aluminum-bound P (FeAl-P) were extracted in 0.1 N NaOH-1 M NaCl [33]. Plant-available P was determined by the Bray-1 method, as described by Bray and Kurtz [34]. Phosphorus concentration was determined colorimetrically by measuring absorbance at a wavelength of 882 nm after developing a molybdenum blue color. Exchangeable potassium (K) was extracted using 1 N NH4OAc [35] and concentration was determined using the Atomic Absorption Spectrophotometer. Particle size distribution was determined using the hydrometer method after dispersing the soil with sodium hexametaphosphate [36]. The above-ground plant biomass was ground into fine material, dry ashed, and taken up in nitric acid. Phosphorus in solution was determined colorimetrically by measuring absorbance at a wavelength of 882 nm after developing a molybdenum blue color. Phosphorus in roots was not determined due to inadequate root samples as 78% dry matter of pigeon pea and soybean was below 1 g. Total P uptake was calculated by multiplying P concentration in shoots by total dry matter yield. Soils were analyzed for Bray-1 extractable P (Bray-P) after growing pigeon pea, soybean, and maize. Mobilized P was calculated according to Equation (1):
Mobilized   P   ( g pot ) = ( Bray   P   after   planting + Plant   P ) Bray   P   before   planting
Soil analyses for the greenhouse study were carried out at the University of Zambia (UNZA), where Bray-1 is used to determine plant-available P of acid soils, while soil analyses for the field trial were conducted at the Norwegian University of Life Sciences (NMBU) where P-AL is used.

2.3. Statistical Analysis

Analysis of variance (ANOVA) was used to test the effects of treatments and to determine differences between sites. Tukey’s test was used to test for significance between means, and regression analysis was used to determine the relationship between plant P concentration and Bray-P. Statistical analysis was conducted using the statistical software “R” [37] version 4.2.3 [38].

3. Results

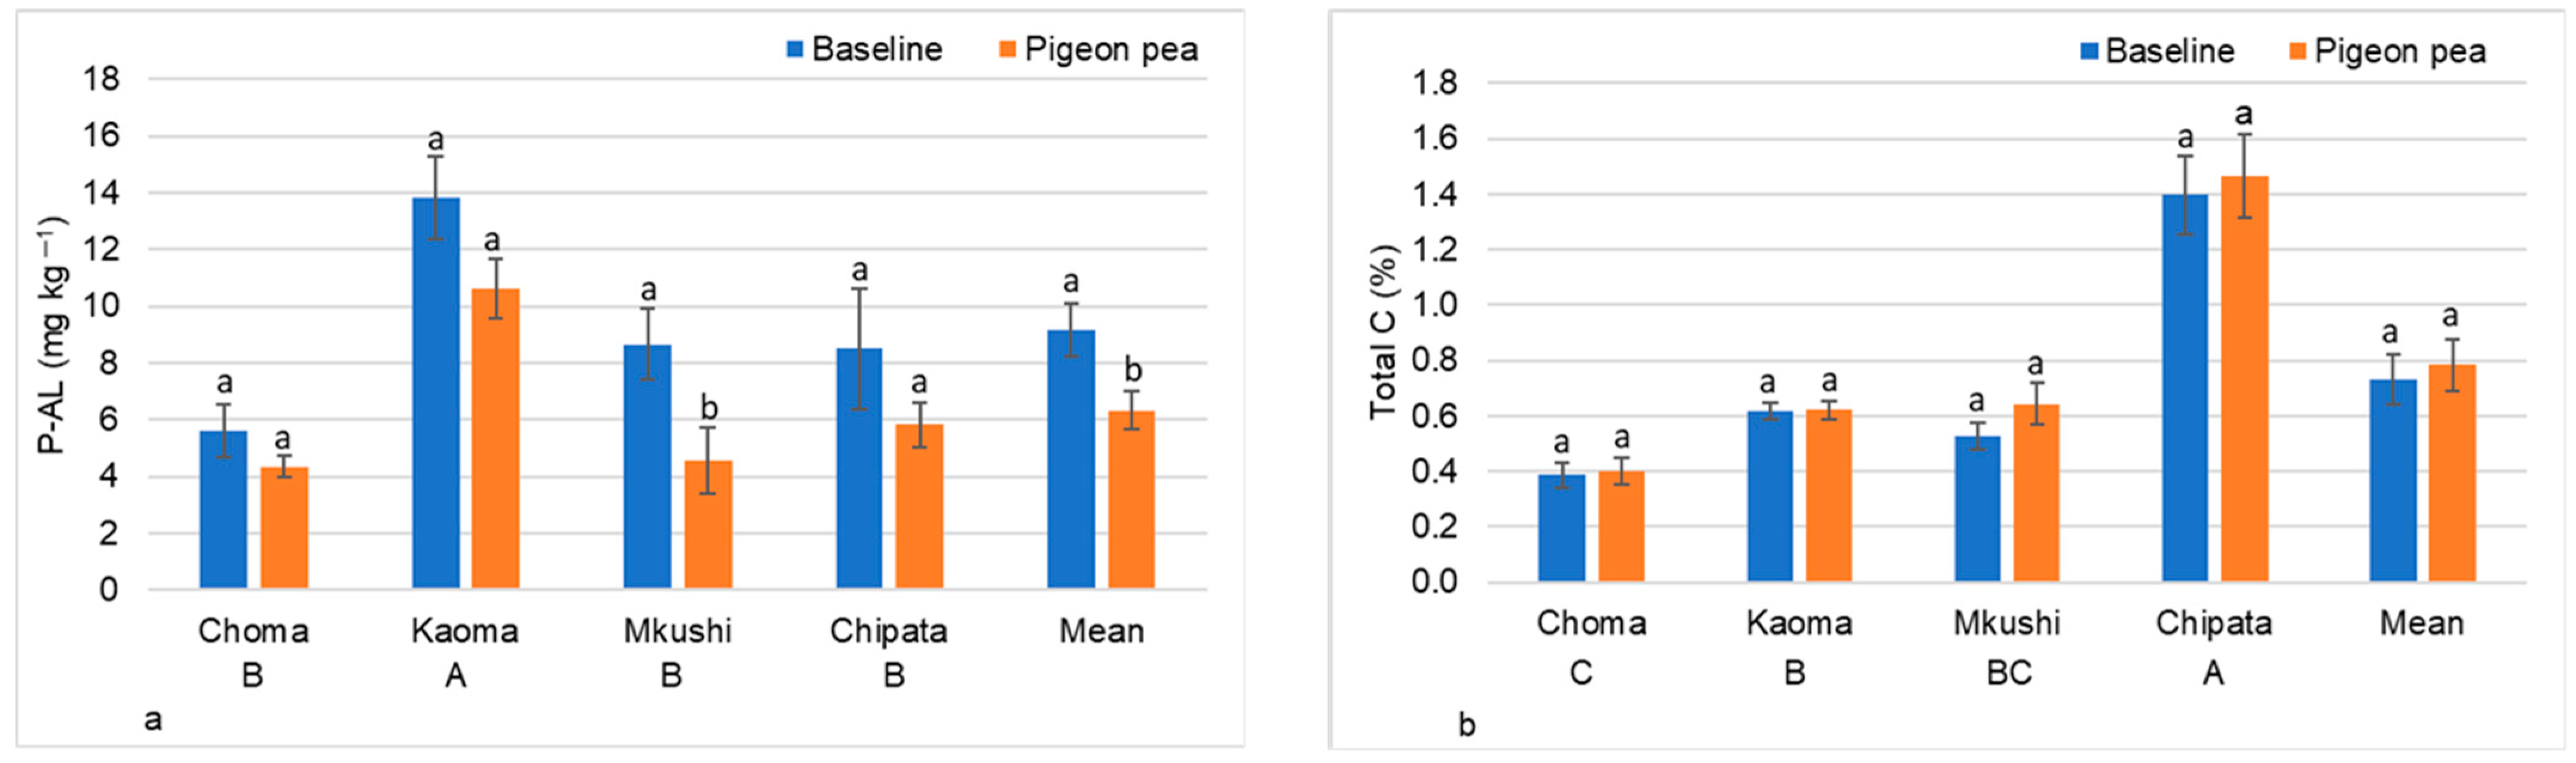
3.1. Effect of Rotation with Pigeon Pea on Plant-Available Phosphorus under Field Conditions

The concentration of plant-available P (P-AL) was low, indicating P limitation in all four districts (Figure 1a). In Mkushi, P-AL significantly declined (p ≤ 0.05) --by 47.5% after rotation with pigeon pea (Figure 1a). However, pigeon pea had no significant effect (p > 0.05) on P-AL in Choma, Kaoma, and Chipata. The soil in Kaoma had significantly higher (p ≤ 0.001) P-AL compared to Choma, Mkushi, and Chipata.
The mean bulk densities (g cm−3) for the study sites were 1.58 ± 0.02 for Choma, 1.52 ± 0.02 for Kaoma, 1.36 ± 0.02 for Mkushi, and 1.49 ± 0.05 for Chipata. The stocks of plant-available P in the soil before and after rotation with pigeon pea at the four sites show a reduction in available P ranging between 4.0 and 11.2 kg ha−1 (Table 1).
All soils contained low total carbon except Chipata soil, which had moderate levels of total carbon (Figure 1b). There was no significant change (p > 0.05) in the total carbon content of soils after rotation with pigeon pea at any of the sites. Total carbon in Chipata soils was significantly higher (p ≤ 0.001) compared to the other sites, probably due to their finer texture (Table 2).

3.2. Effect of Pigeon Pea on Plant-Available Phosphorus under Greenhouse Study

Characteristics of the soils used in the greenhouse study prior to planting are presented in Table 2. The soil in Chipata was a sandy loam; in Kaoma, it was sand; and in Choma and Kasama, it was loamy sand. The soils from Chipata, Choma, and Kaoma were strongly acidic, while the soil from Kasama was very strongly acidic, as indicated by the soil pH in Table 2. Bray-1 extractable P was medium in soils from Kaoma and low (<12 mg kg−1) in Chipata, Choma, and Kasama. Total N was low in all soils, with levels below 0.2% by weight. The levels of exchangeable K were below 0.2 cmol (+) kg−1 soil, which are rated low for Kasama, Choma, and Kaoma, while medium levels were detected in soil from Chipata.

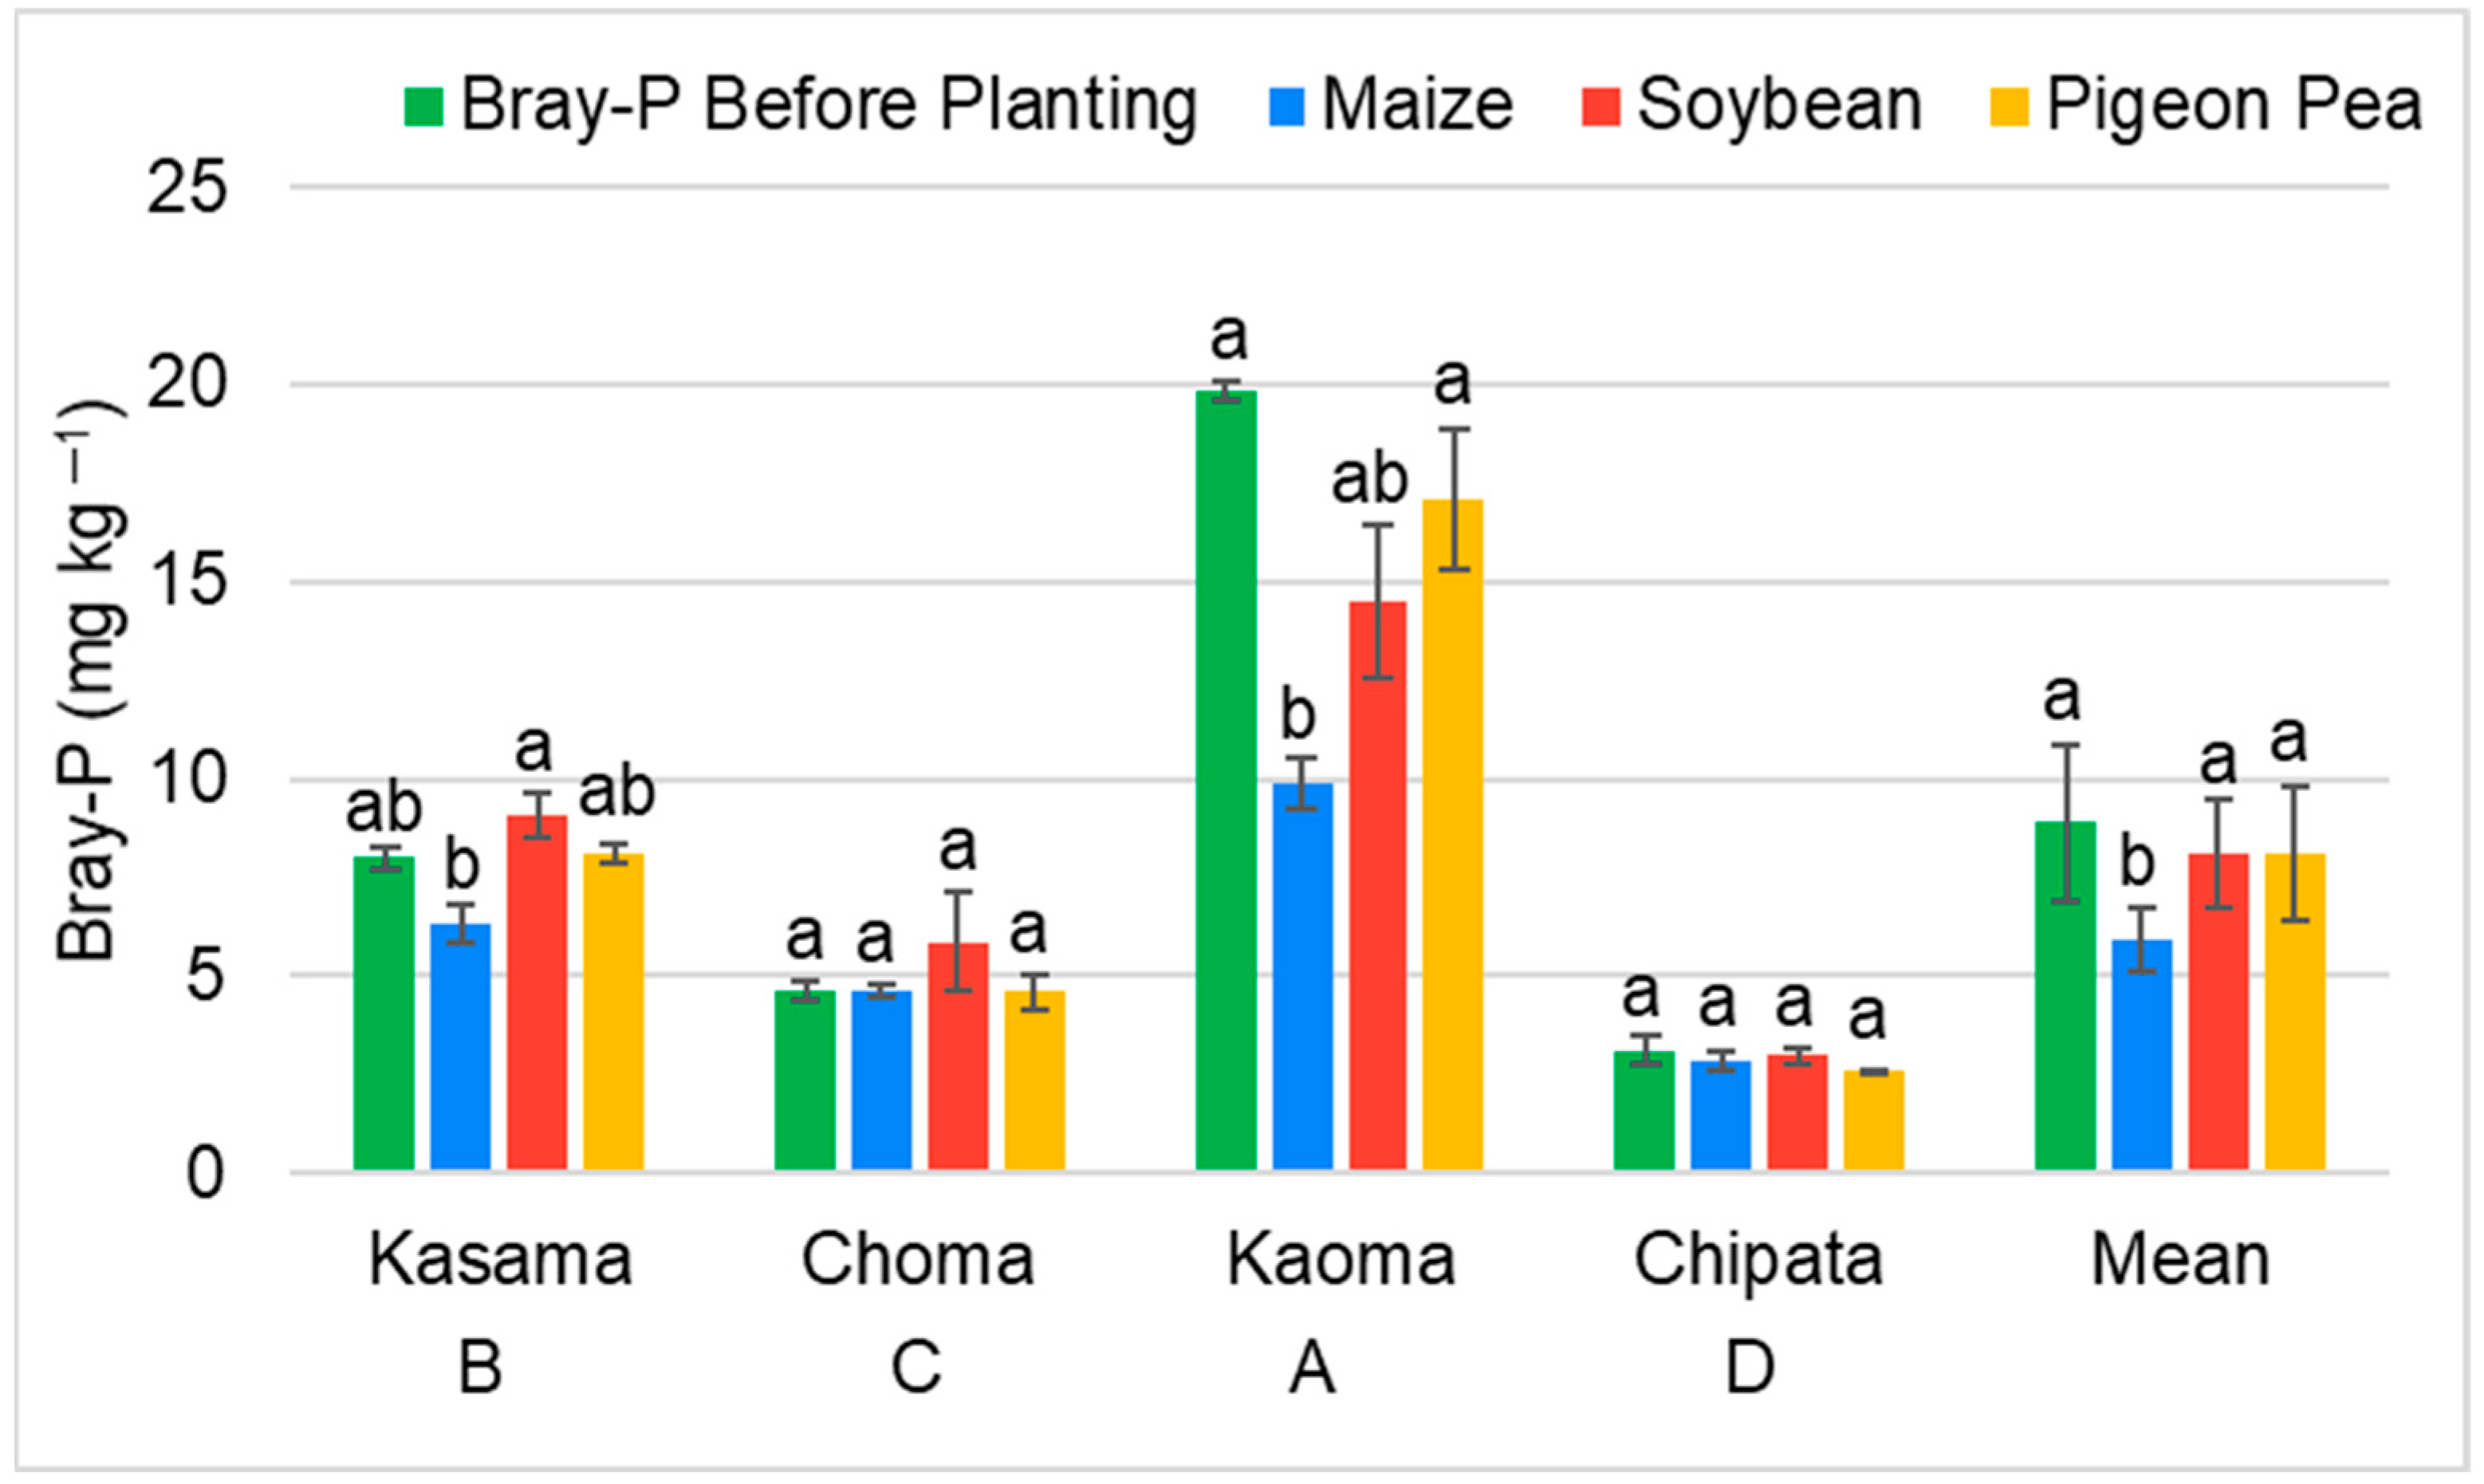
3.2.1. Effect of Maize, Soybean, and Pigeon Pea on Plant-Available Phosphorus

The results for the effect of maize, soybean, and pigeon pea on plant-available P (Bray-P) are presented in Figure 2. In soil from Kaoma, Bray-P was significantly higher (p ≤ 0.05) by 53.1% under pigeon pea than under maize (Figure 2). Similarly, Bray-P was significantly higher (p ≤ 0.01) by 36.0% in the soil with soybean compared to maize in the soil from Kasama. For Kaoma, extractable P significantly declined (p ≤ 0.01) by 49.9% after maize cropping. However, there was no significant difference (p > 0.05) in extractable P after planting between soybean and pigeon pea in either of the soils.
There was no significant difference (p > 0.05) in extractable P before and after planting pigeon pea in any soil. No significant change was observed in extractable P for soils from Choma and Chipata under any of the three crops. There were significant differences (p ≤ 0.001) in Bray-P among soils after cropping. In general, extractable P significantly declined (p ≤ 0.001) after growing maize, while soybean and pigeon pea had no significant (p > 0.05) effect on Bray-P after cropping (Figure 2). Extractable P was significantly higher (p ≤ 0.01) in soils under soybean and pigeon pea compared to maize. There was a significant interaction effect (p ≤ 0.001) of crop and soil type on plant-available P. After cropping, the available P content was significantly higher (p ≤ 0.05) in the soybeans and pigeon pea treatments for Kaoma soil compared to other crop-soil combinations. Thus, the effect of the crop on plant P availability was significantly influenced by soil type.
-Regression analysis showed that P concentration in maize increased significantly (p ≤ 0.01, explained variability = 52%) with plant-available P (Bray-P) in soil (Figure 3). There was no significant relationship (p > 0.05) between plant-available P in soil with P concentration in dry matter of soybean and pigeon pea.

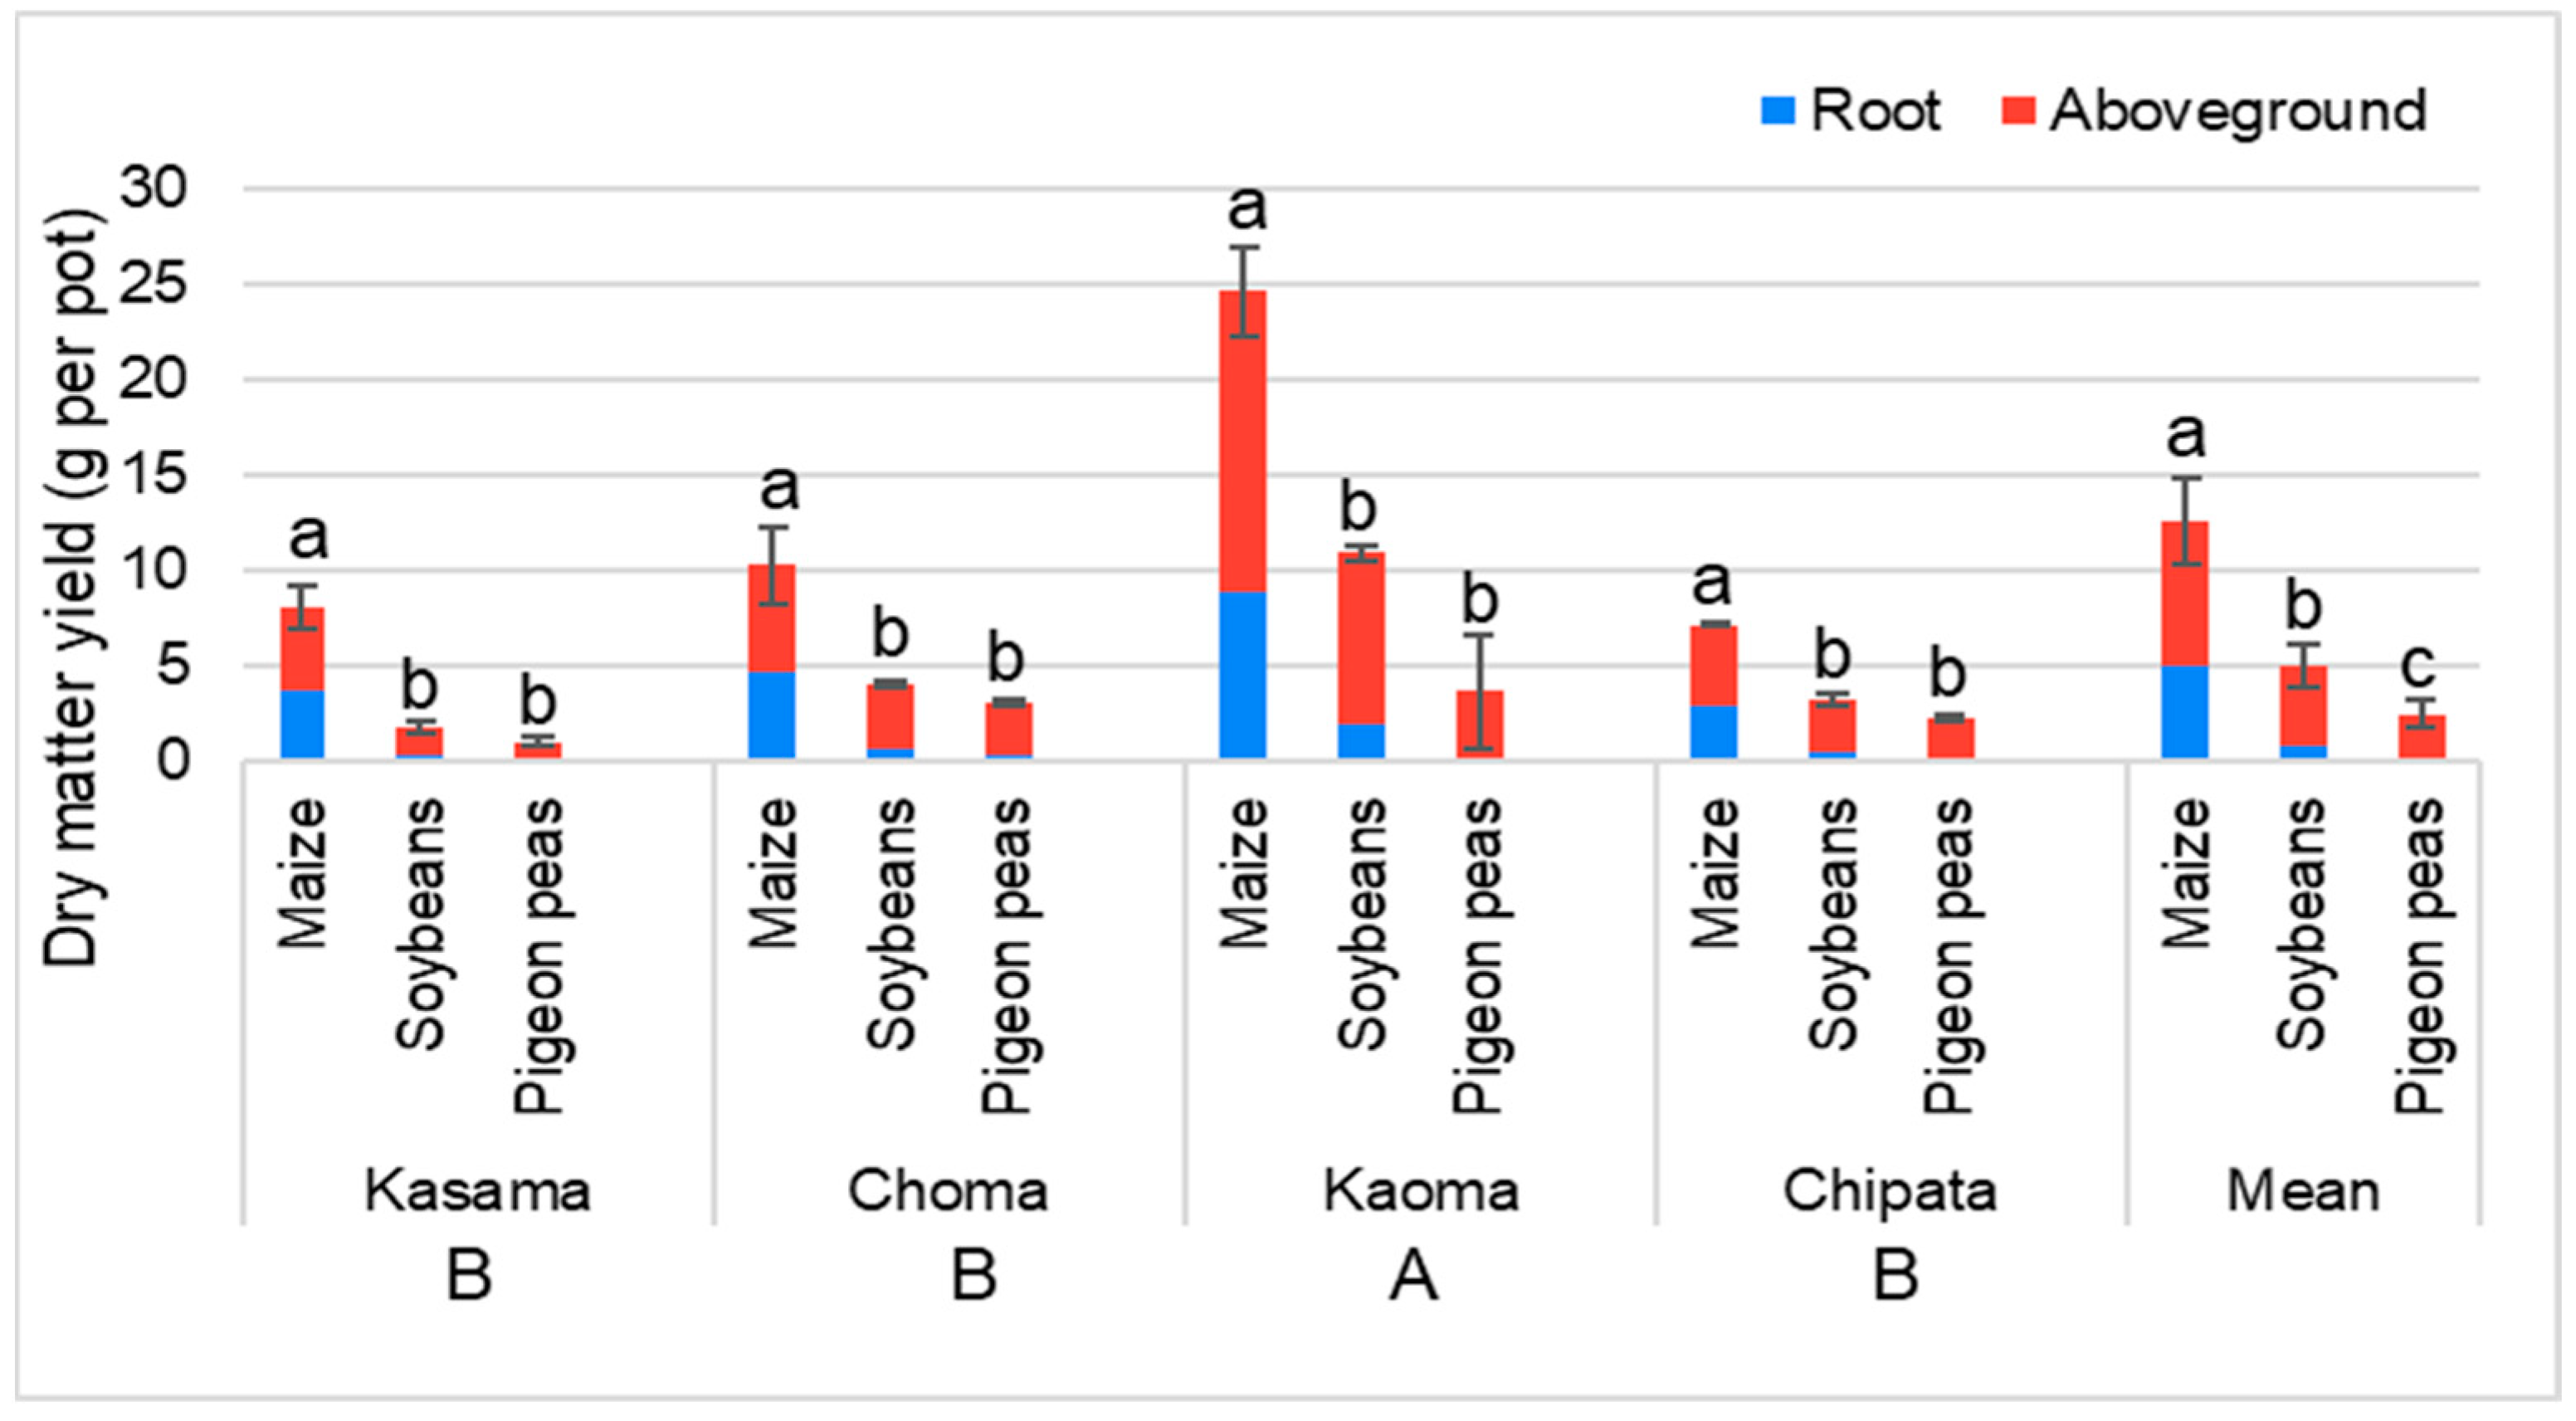
3.2.2. Dry Matter Yield of Maize, Soybean, and Pigeon Pea

Biomass (dry matter) yield of maize, soybean, and pigeon pea after seven weeks was small, in particular for soybean and pigeon pea (Figure 4). In all soils, maize had the highest biomass compared to soybean and pigeon pea. A non-significant difference (p > 0.05) within soils in dry matter yield was found between soybean and pigeon pea. The highest dry matter (p ≤ 0.001) was obtained in soil from Kaoma compared to Kasama, Choma, and Chipata. Maize produced the most root dry matter, whereas pigeon pea root dry matter was the lowest. The root/shoot ratio was highest (p ≤ 0.001) in maize (0.75 ± 0.05) compared to soybean (0.23 ± 0.01) and pigeon pea (0.14 ± 0.03). However, there was no significant difference (p > 0.05) in root/shoot ratio between soybean and pigeon pea.
Overall, maize had the highest (p ≤ 0.001) dry matter compared to soybean and pigeon pea, giving an average biomass of 12.6 g maize, 5.03 g soybean, and 2.55 g pigeon pea across soils. The dry matter yield of soybean was significantly greater (p ≤ 0.05) than pigeon pea.

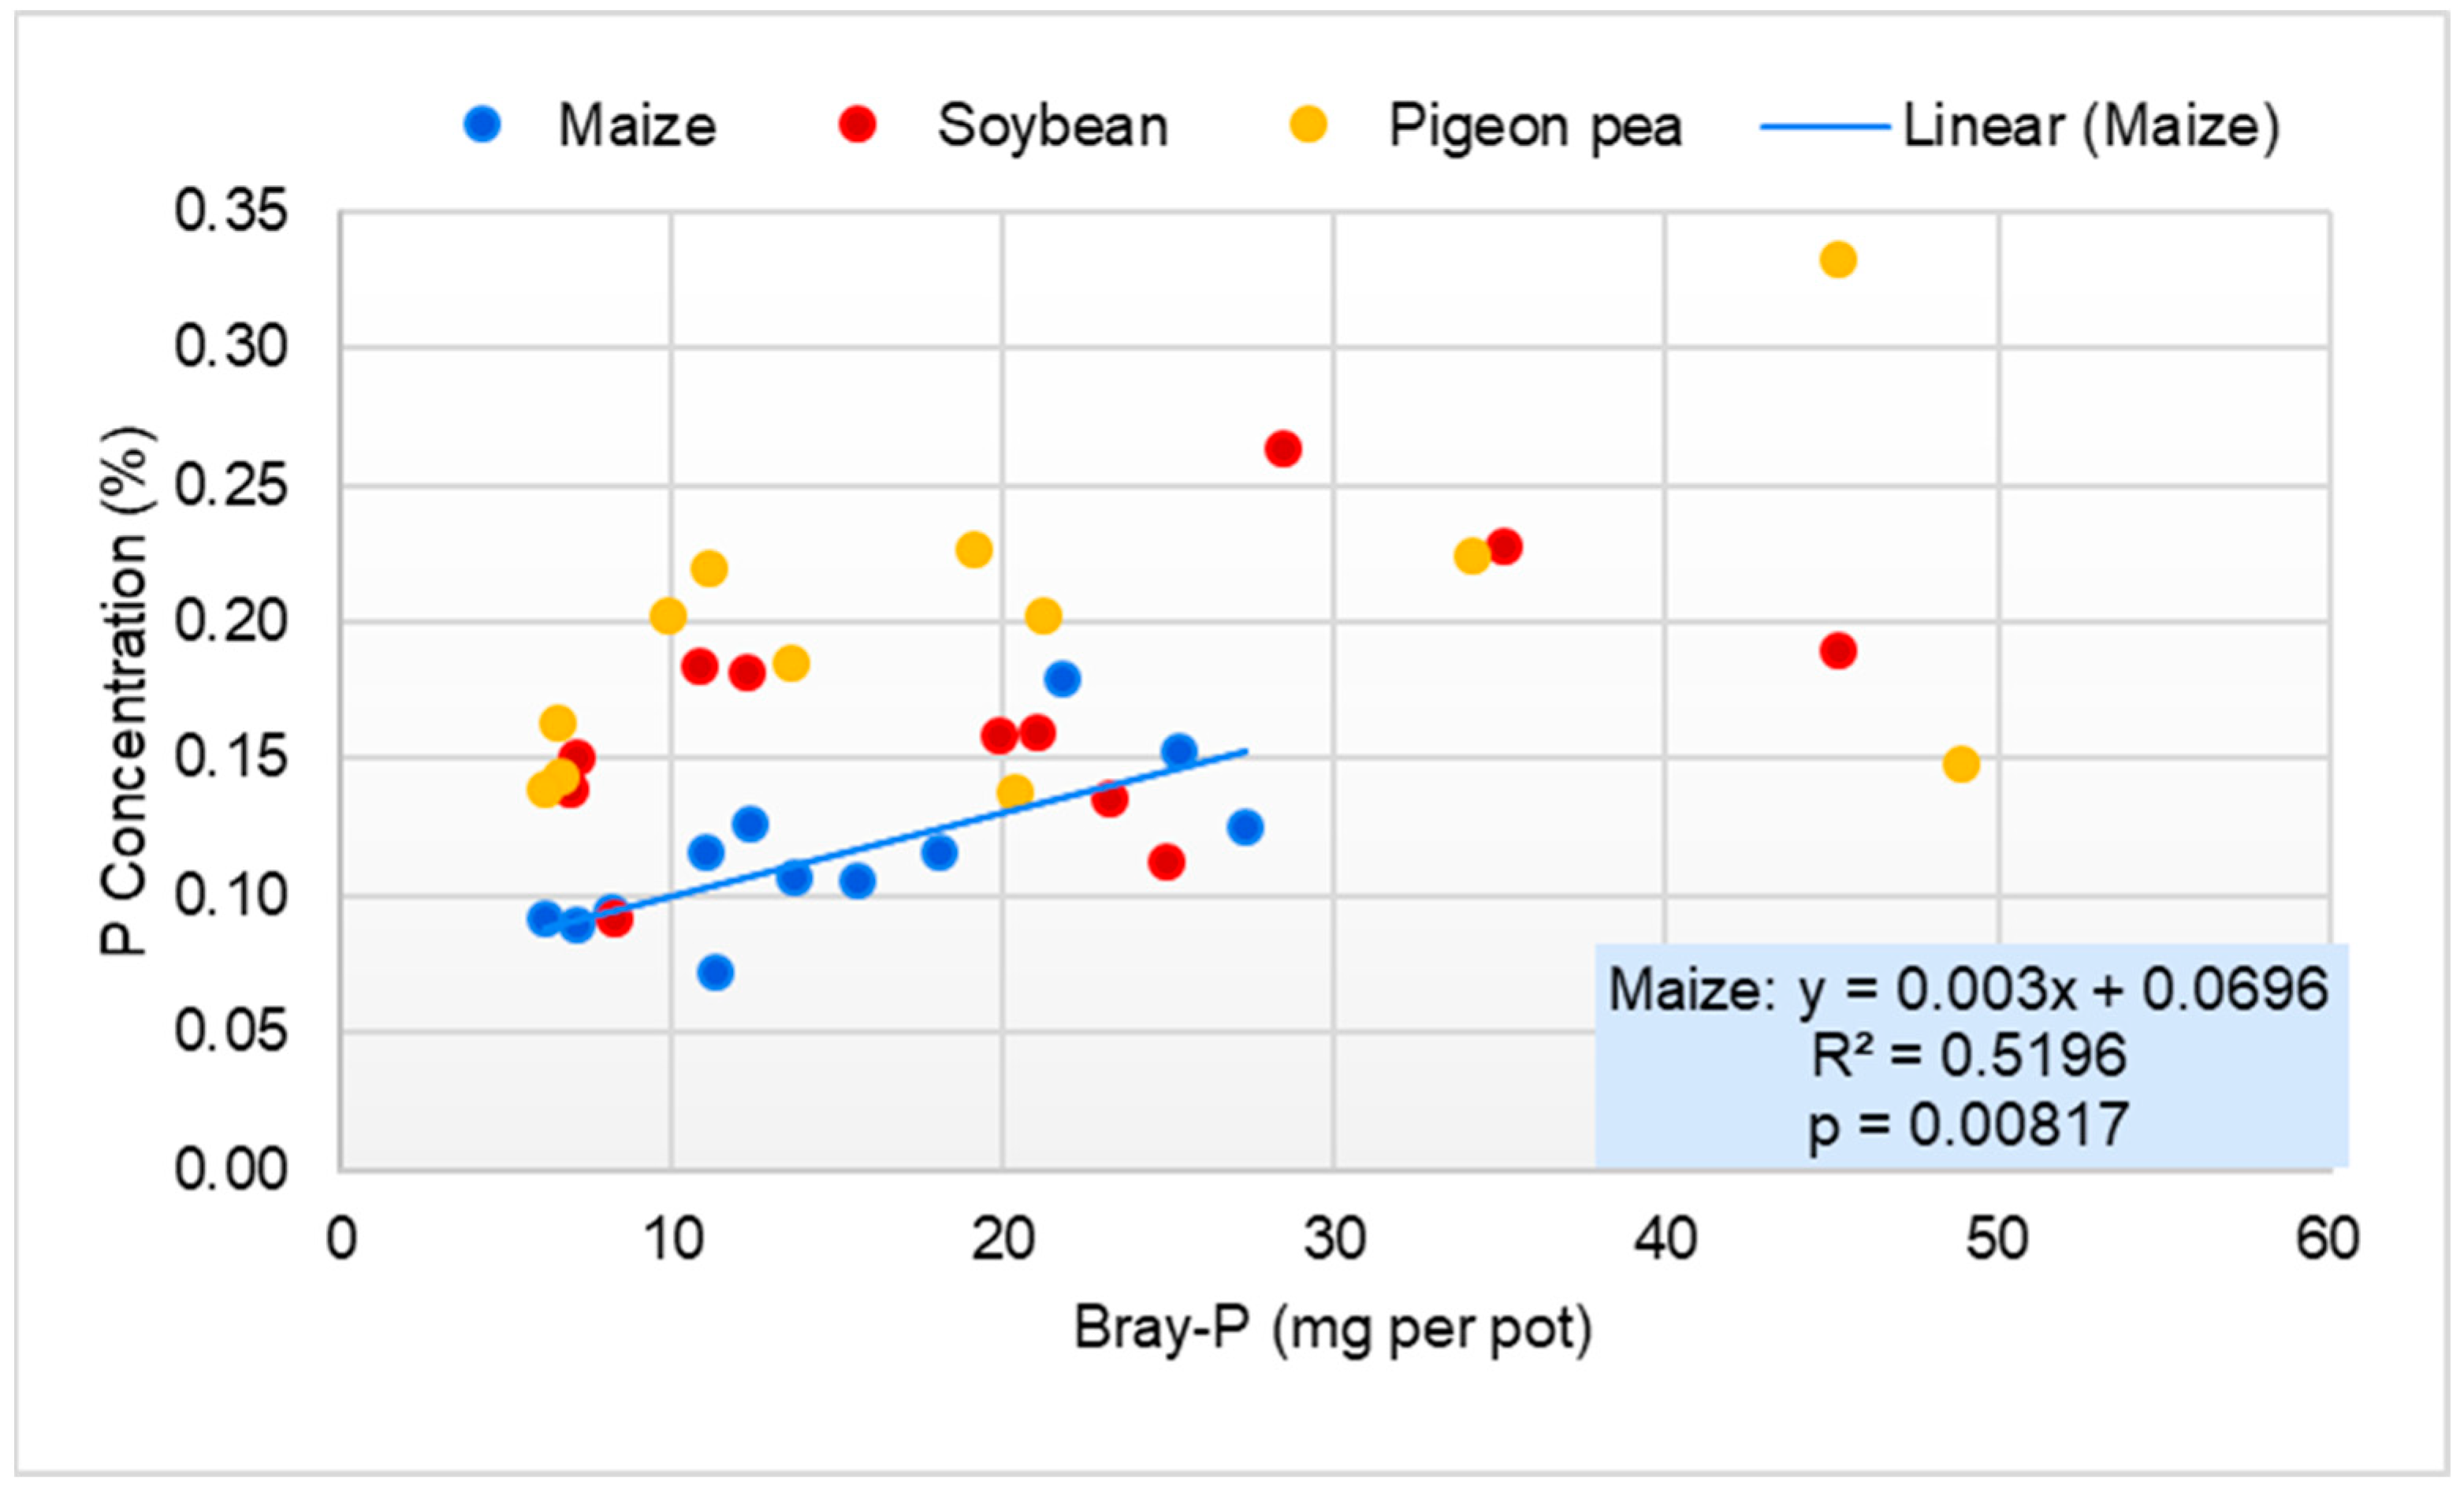
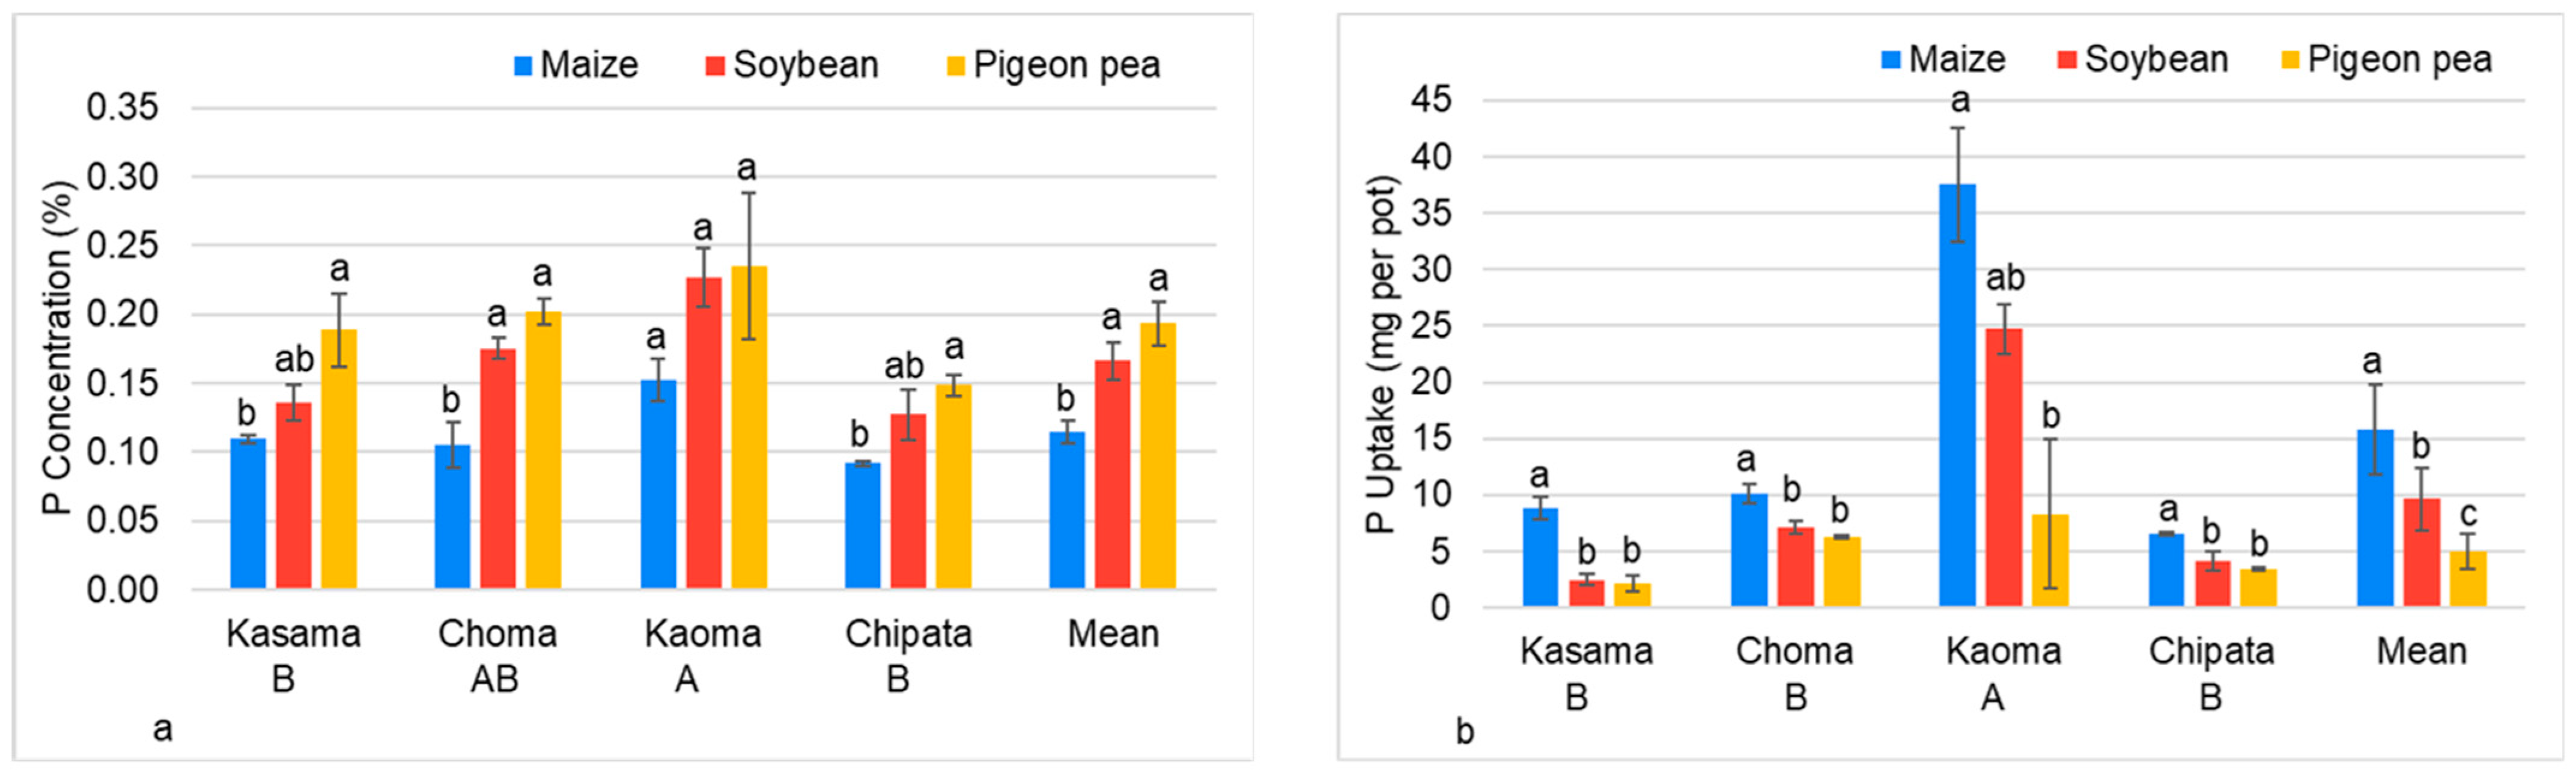
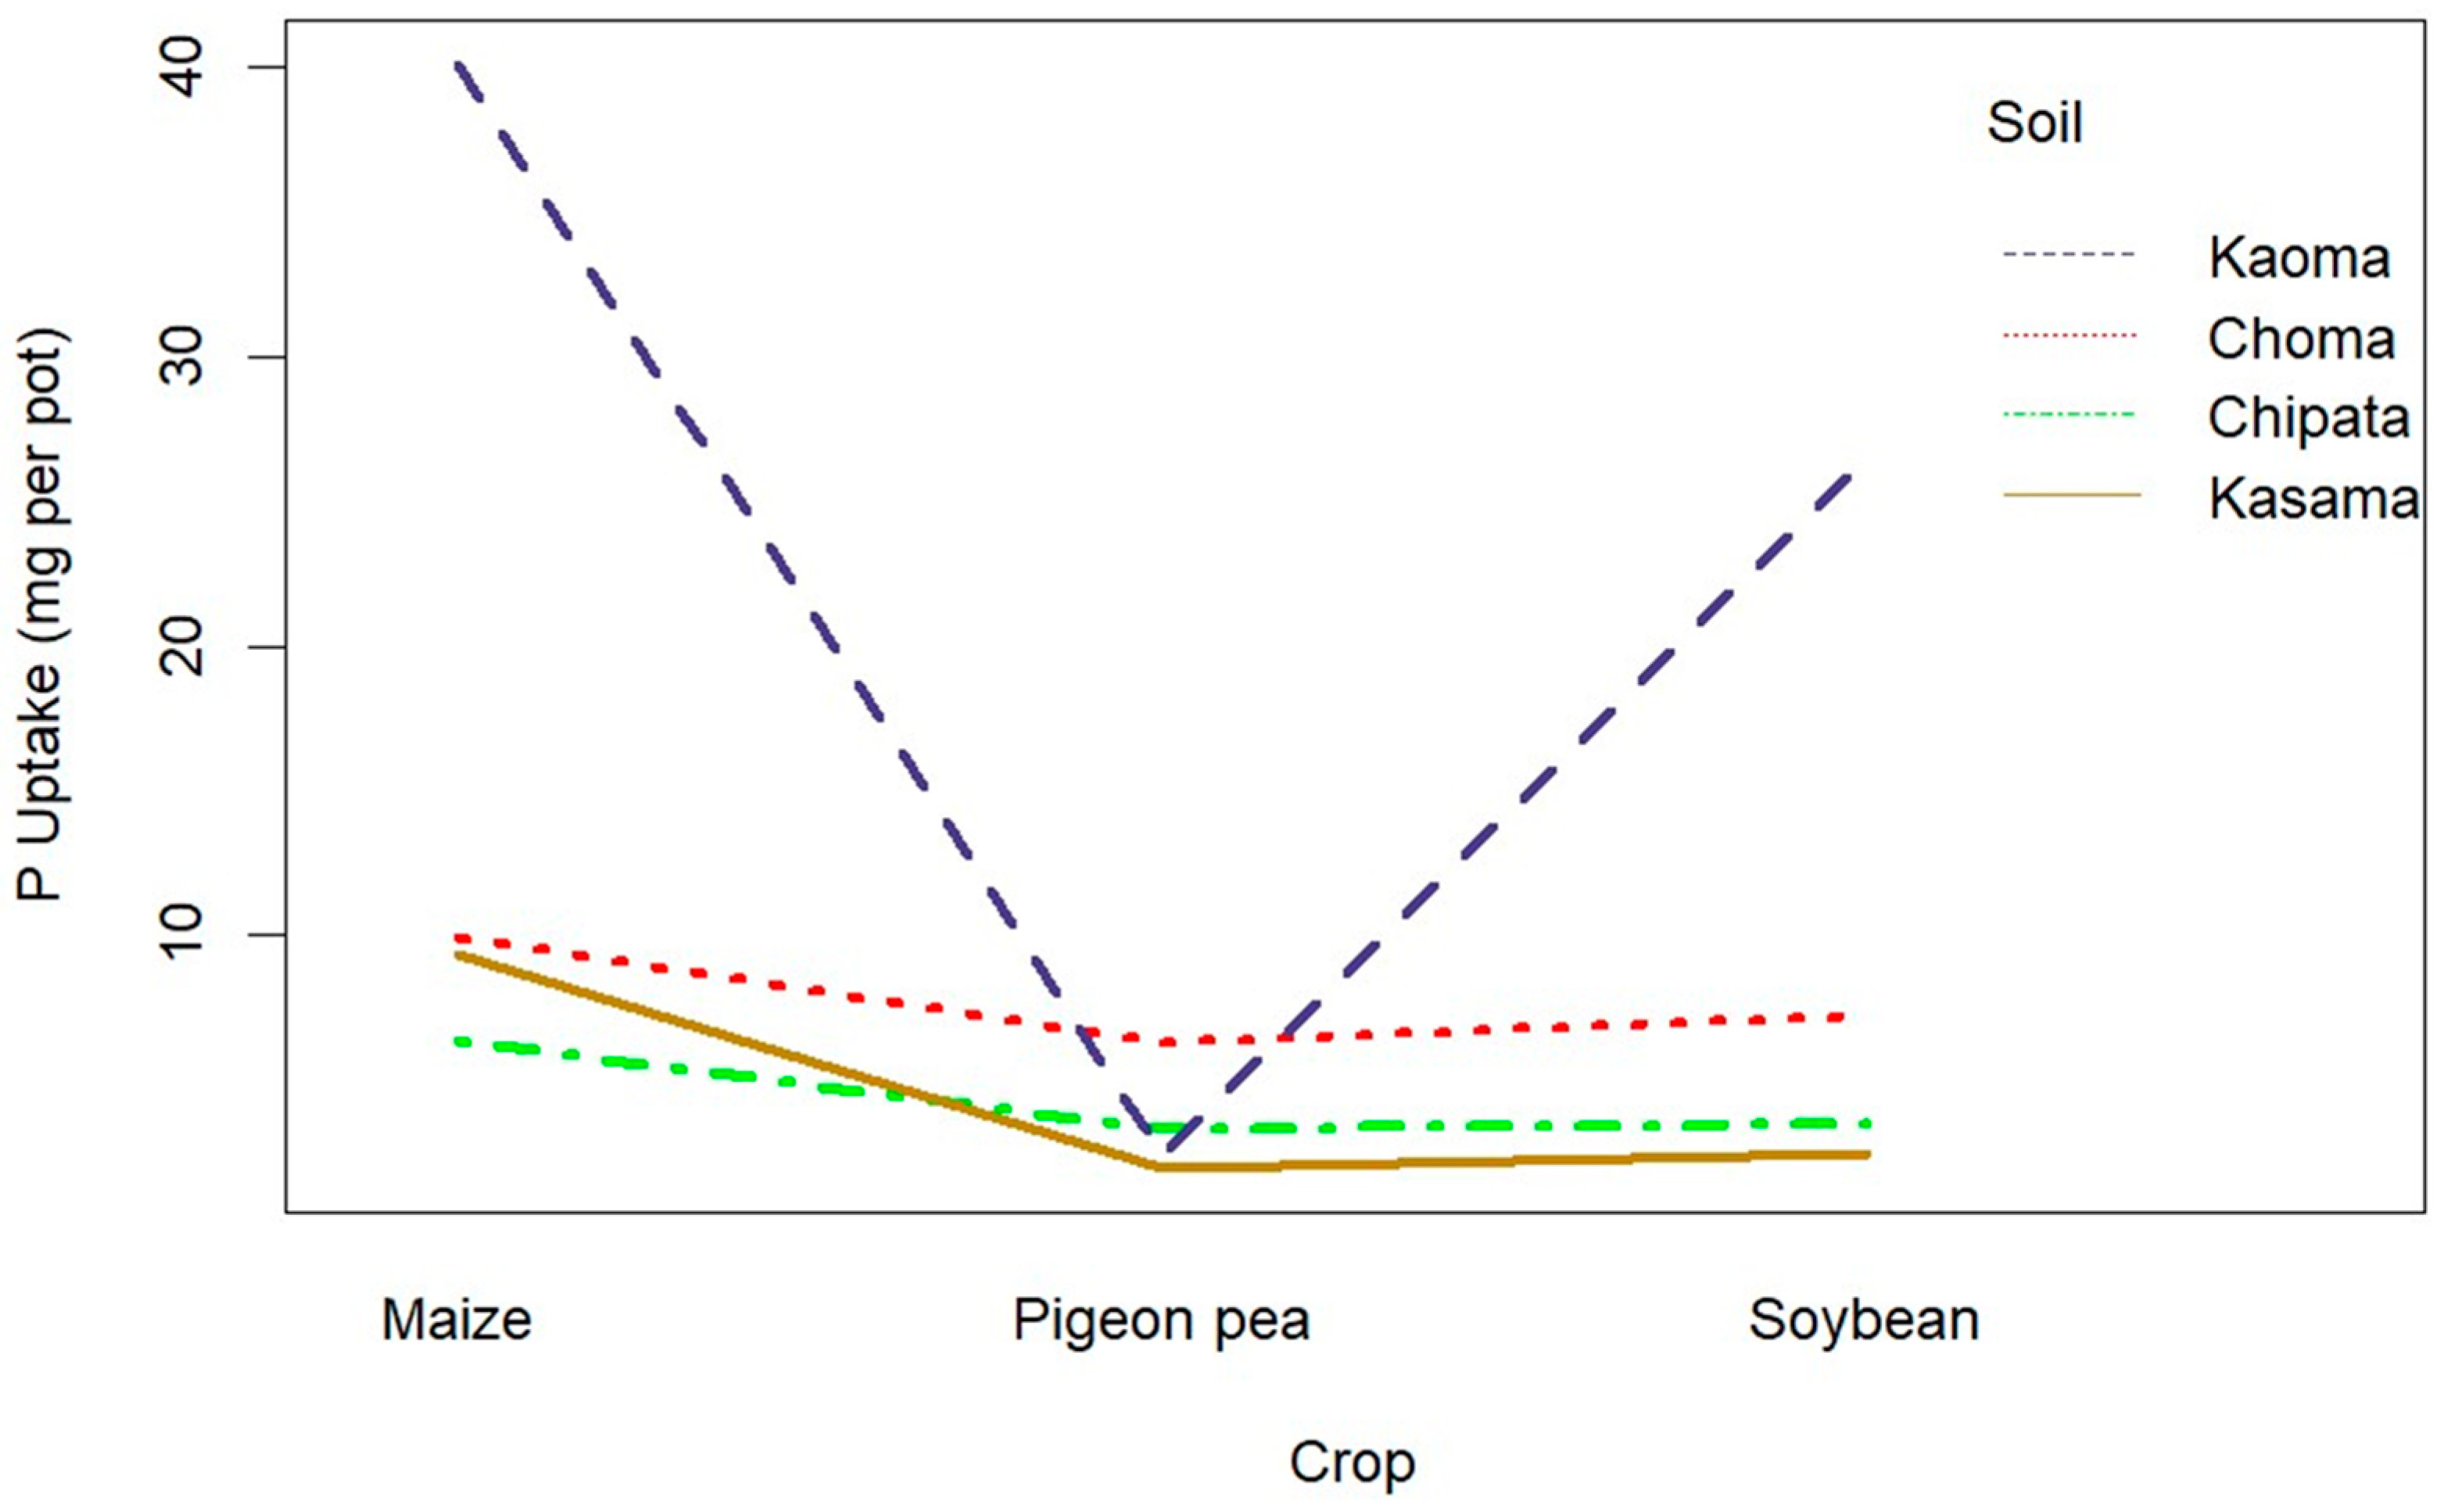
3.2.3. Phosphorus Concentration and Uptake by Maize, Soybean, and Pigeon Pea

The concentration of P in the above-ground biomass of maize, soybean, and pigeon pea was low for all the different soils (Figure 5a). Pigeon pea biomass had a significantly higher P concentration compared to maize in soils from Kasama (p ≤ 0.05), Choma (p ≤ 0.01) and Chipata (p ≤ 0.05). Phosphorus concentration was significantly higher (p ≤ 0.05) in soybean compared to maize in soil from Choma. The concentration of P was significantly higher in plants grown in the relatively P-rich soil from Kaoma compared to Kasama (p ≤ 0.01) and Chipata (p ≤ 0.001). The concentration of P in plant biomass from Choma did not differ significantly (p > 0.05) from P in biomass produced on soils from Chipata, Kaoma, and Kasama. Overall, P concentration was significantly higher in soybean (p ≤ 0.01) and pigeon pea (p ≤ 0.001) compared to maize (Figure 5a). Maize dry matter had the lowest P concentration, averaging 0.11% across sites. Phosphorus deficiency symptoms were observed in maize (Appendix A, Figure A1), exhibited by critical stunting of growth and purple leaves and stems in all soils except Kaoma, which had high initial P content. There was no significant difference (p > 0.05) in P concentration between soybean and pigeon pea dry matter across sites. We observed no significant interaction (p > 0.05) between crop and soil type on plant P concentration.
Associated with its higher biomass production, P uptake by maize was significantly higher than by pigeon pea in all four soils (Figure 5b). The results showed significantly higher P uptake by maize compared to soybean in soils from Kasama (p ≤ 0.01), Choma (p ≤ 0.05), and Chipata (p ≤ 0.05). There was no significant difference (p > 0.05) in P uptake between soybean and pigeon pea in any of the soils. Despite the lowest concentration of P in maize biomass, high P uptake was observed compared to pigeon pea and soybean due to the relatively high biomass of maize (Figure 4). Generally, P uptake was significantly greater in maize than in soybean (p ≤ 0.01) and pigeon pea (p ≤ 0.001). Overall, P uptake by soybean was significantly higher (p ≤ 0.05) than by pigeon pea. There was a significant interaction (p ≤ 0.001) between crop and soil type on plant P uptake (Figure 6).
Phosphorus uptake was significantly higher (p ≤ 0.05) in maize and soybeans from Kaoma soil compared to other crop-soil combinations. Similar interaction trends between crop and soil type were observed on dry matter yield. Therefore, P uptake and dry matter yield were dependent on both crop and soil type.

3.2.4. Enrichment of Plant-Available P after Maize, Soybean, and Pigeon Pea Cropping

A simple source/sink model was used for the greenhouse experiment to calculate the P budgets (Table 3). The source was Bray-P in the soil before cropping, and the sinks were plant P uptake and Bray-P measured after cropping. The difference between sources and sinks was considered as mobilized P, indicating enrichment of plant-available P.
The P output, indicated by the sum of Bray-P at the end of the pot trial and P taken up by the plants, was greater than the initial amount of plant-available P in the soil, indicating an increase in plant-available P during the pot trial. A significant increase in plant-available P was observed after planting maize and soybean in soils from Kasama (p ≤ 0.05) and Choma (p ≤ 0.01). Similarly, in Chipata soil, plant-available P increased significantly in maize (p ≤ 0.01) and soybean (p ≤ 0.05), but this was not the case for pigeon pea. For Kaoma, there was no significant difference (p > 0.05) between the sum of plant-available P in soil (Bray-P) after cropping and P uptake as compared with the initial amount of plant-available P. Generally, there was a significant increase (p ≤ 0.001) in plant-available P (Bray-P plus plant P) in maize and soybean indicating high P mobilization by maize and soybean compared to pigeon pea (Table 3). The sum of Bray-P and plant P, as well as mobilized P, was significantly lower in pigeon pea compared to soybean (p ≤ 0.01) and maize (p ≤ 0.001).

4. Discussion

This study has demonstrated that pigeon pea under field conditions had no significant (p > 0.05) effect on plant-available P in Choma, Kaoma, and Chipata. However, pigeon pea resulted in a significant P decline (p ≤ 0.05) by 11.2 kg ha−1 in Mkushi. A comprehensive comparative study on the performance of six pigeon pea varieties (ICEAP 00040, ICP 9145, ICEAP 00020, ICEAP 00053, ICEAP 00068, and Babati White) intercropped with maize in smallholder farmers’ fields in Eastern and Southern Africa showed P accumulations (kg ha−1) in pigeon pea grain, shell, stem, leaves, and litter ranging between 1.4 kg ha−1 and 17.0 kg ha−1 and dry matter between 1.7 tons ha−1 and 10.9 tons ha−1 in 2002 and 2003 growing seasons [2]. Mwila et al. [16] reported 6.5 tons ha−1 as the highest biomass yield of sole pigeon pea (Chitedze 1 variety), while mean grain yields were below 2 tons ha−1 after applying fertilizer at a rate of 10 kg N, 20 kg P2O5, and 10 kg K2O per hectare in Acrisols and Luvisols of Eastern Zambia during 2016, 2017, and 2018 growing seasons. However, plant P uptake and changes in plant-available P in soil after pigeon pea were not reported. In the 2019–2020 growing season, pigeon pea biomass across 25 farms in Mkushi was estimated to be 4.8 to 6.8 tons ha−1 [26]. Assuming a mean plant P concentration of 0.19% (Figure 5a), the 4.8 to 6.8 tons ha−1 biomass yield would result in P off-take corresponding to 9.1 to 12.9 kg ha−1. With reference to the decrease in P-AL (11.2 kg ha−1) reported in Table 1, the 9.1 to 12.9 kg ha−1 P off-take would imply limited P mobilization in the soils under pigeon pea. Therefore, the rhizosphere in the pigeon pea varieties used in the study requires investigation to ascertain the biochemical processes and changes. In addition, the deep roots of pigeon pea could take up available P from the subsoil, hence limiting P uptake from the top 20 cm of soil, which was analyzed. A possible increase in soil aggregation under pigeon pea cropping could result in a greater accumulation of organic P observed by Garland et al. [21]. Further, decomposing litter from pigeon pea biomass could contribute to replenishing plant-available P in the subsequent growing season with maize, thus reducing P fertilizer requirements. Future studies should focus on assessing these and other new varieties’ adaptability to grow in soils with low P and determining P mobilization and uptake from soil under field conditions. Furthermore, organic matter changes and P mineralization should be evaluated in the subsequent seasons to determine the contribution of pigeon pea residues to P availability in tropical soils.
In the greenhouse study, the concentration of P in maize biomass was significantly lower (0.11%) compared to soybean (0.17%) and pigeon pea (0.19%). Hocking et al. [40] reported lower P concentration in pigeon pea biomass (0.124%) and soybean (0.095%) in a 4-week pot experiment on an Oxisol which contained lower amounts of P (1.8 mg kg−1 Bray-1 extractable P) compared to the soils used in this study. Phosphorus concentrations in this study were below the values reported by Bortolon et al. [41] in 17 soybean cultivars under on-farm field experiments, which varied between 0.27% and 0.38% at R5 stage (beginning seed) in an Oxisol after application of 90 kg P2O5 ha−1, showing higher P concentrations in soils with high P. Above-ground biomass of pigeon pea cultivar Babati White averaged 3.4 tons ha−1 and accumulated comparable amounts (1.6–6.5 kg ha−1) of P in above-ground dry matter with ICEAP 00040, ICEAP 00053, and ICEAP 00068 in field trials during the 2002–2003 growing seasons [2]. In the present study, total P uptake by soybean and pigeon pea was lower than maize due to the low dry matter yield of the two legumes. However, at maturity, pigeon pea high amount of biomass is expected to sequester large amounts of P compared to the values reported in this study. With the increasing interest in the use of biochar as a soil amendment to enhance soil fertility, especially in acid and nutrient-deficient subtropical and tropical soils, the woody biomass of pigeon pea may be a good choice of feedstock for biochar due to relatively higher P concentration in the biomass compared to maize.
The P concentration in above-ground biomass was below the nutrient sufficiency range (0.3–0.5%) for maize at the early growth stages [42]. High-yielding maize varieties, such as hybrids, have been reported to have a high P uptake of about 49 kg P ha−1 [43]. The maize crop is especially sensitive to P deficiency in juvenile phases [44]. The concentration of P in soybean and pigeon pea biomass was below adequate total P concentration of 0.26% and 0.23% for soybean and pigeon pea, respectively [40]. However, soybean and pigeon pea appeared healthy with no P deficiency symptoms, indicating a high P requirement by maize related to its high growth rate compared to the legumes within the 7-week period examined. Phosphorus concentration in maize significantly increased (p ≤ 0.01) with plant-available P in soil, showing that maize was affected by P availability in soils, unlike soybean and pigeon pea, which showed a non-significant (p > 0.05) relationship (Figure 3). Maize had a significantly higher root/shoot ratio (0.75) compared to soybean (0.23) and pigeon pea (0.14). An enlarged root system provides an expanded root surface area to which non-mobile nutrients such as P can diffuse [45], a mechanism that maize exhibited in this study. Phosphorus shortage can lead to an increased root/shoot ratio [46], and this has often been reported for P-stressed plants as compared with P-sufficient plants [47]. The root/shoot ratio of legume species did not show a significant variation in response to P application, while the fibrous-root species, such as maize, showed larger root morphological plasticity as a way of increasing P acquisition to cope with variable P supply in acidic and calcareous soils [48]. Minimal P variations in roots and shoots were observed for each of the crops, maize, soybean, and pigeon pea, around 6–7 weeks [49,50,51].
There was no significant difference in Bray-1 extractable P before planting pigeon pea and after harvest in any soil in the greenhouse study. These results are similar to the findings under field studies, which showed a non-significant effect on plant-available P after a growth season with pigeon pea in Choma, Kaoma, and Chipata. Plant-available P (the sum of P in plants and soil) increased during the trial for both maize and soybean cropping in all soils except Kaoma, with initially high levels of available P. This increase could be due to the release of organic acids and phosphatase enzymes by soil microbes and plant roots to mobilize P. Plants adapt to low soil P bioavailability by ‘mobilizing’ P, which refers to solubilization of fixed P through rhizosphere processes [44] evidenced by the significant increase in plant-available P after maize and soybean cropping. Equivalent amounts of P were mobilized in maize and soybean across soils. However, due to high P uptake by maize, all the mobilized P was taken up by plants including some initial available P as in the case of Kasama. On the other hand, more P was left in soils with soybean due to less P uptake by soybean compared to maize.
Pigeon pea showed limited capacity to mobilize P compared to soybean and maize in the early stages of growth. This could be due to low FeAl-P in the soils, from which pigeon pea is known to solubilize its P. Ae et al. [20] reported high P solubilization by pigeon pea in an Alfisol with higher levels of FeAl-P (Fe-P = 51.3 mg kg−1; Al-P = 8.1 mg kg−1) compared to the soils used in this study. Low FeAl-P were reported in ten benchmark soils in Zambia, averaging 21.4 mg kg−1, while Ca-P concentrations constituted the highest proportion of the inorganic P pools with an average of 38.4 mg kg−1 [52]. In the same study, organic P constituted 52% (average = 115.8 mg kg−1) of total P, showing the potential of this pool to supply P for uptake by plants through the mineralization of organic matter. The potential of pigeon pea to mobilize P from Fe-P could be limited by inherent low levels of Fe-P in most soils in Zambia. In addition, the major growth phase was excluded as the duration of the greenhouse study was 7 weeks, and roots were not fully developed due to the short-term experiment. Therefore, a full season with a mature crop is required to draw conclusions about the potential of pigeon pea to mobilize plant-available P, as this would include the later phase of pigeon pea growth. Soybean could mobilize P more than its own demands, which could potentially benefit subsequent maize crops. However, further studies are required to assess P-mobilizing strategies, plant-available P changes, and uptake by soybean considering all crop growth stages up to maturity.

5. Conclusions

This study shows a low net decline of plant-available P from soils after pigeon pea cropping under field conditions. Further, the greenhouse study showed a non-significant effect on plant-available P after pigeon pea cropping, but this was attributed to low P uptake due to low biomass yield, as the crop showed limited P mobilization in the early growth stages. Future studies should evaluate the P uptake and mobilization of fully grown pigeon pea to ascertain the P mobilization potential of the varieties.

Author Contributions

M.P., V.M. and J.M. designed the study. V.M. and J.M. established the study sites for the field trial. M.P. conducted the pot experiment. M.P., V.M. and J.M. performed the data analyses. M.P. wrote the manuscript with inputs from V.M., J.M., B.H.C. and L.M.C. All authors have read and agreed to the published version of the manuscript.

Funding

This research was funded by the research project NORPART-2016/10498 (Academic cooperation on sustainable, climate-smart agriculture between Zambia and Norway) funded by HK-DIR (Norwegian Directorate for International Collaboration in Higher Education). Support was given by “Climate smart agriculture in Sub-Saharan Africa” (NORHED II NMBU program 2021–2026, QZA-21/0182) under the Norwegian Programme for Capacity Development in Higher Education and Research for Development (NORHED II) funded by Norwegian Agency for Development Cooperation (NORAD).” Further support was given by Nordic Climate Facility (NCF) under the ClimChar Project NCF-C7-091 “Testing biochar-pigeon pea agroforestry businesses in Zambia”.

Data Availability Statement

The findings from this study are supported by data which is available from the corresponding author upon reasonable request.

Acknowledgments

Professional and logistical support provided by Victor Shitumbanuma is gratefully acknowledged. Appreciation is extended to Chabu Kamfwa and Gilbert Simasiku for assisting in soil analyses. Special thanks to Gibson Simusokwe from the Conservation Farming Unit (CFU), Edward Bwalya from the University of Zambia, and Brian Gondwe and Mulundu Mwila from Zambia Agriculture Research Institute (ZARI) for assisting with the collection of soil samples.

Conflicts of Interest

The authors declare no conflicts of interest.

Appendix A

Figure A1. P deficiency symptoms in Maize grown in soils from Kasama, Choma, and Chipata.
Agronomy 14 00169 g0a1

References

  1. Yerokun, O.A. Chemical Characteristics of Phosphorus in Some Representative Benchmark Soils of Zambia. Geoderma 2008, 147, 63–68. [Google Scholar] [CrossRef]
  2. Høgh-Jensen; Myaka, F.A.; Sakala, W.D.; Kamalongo, D.; Ngwira, A.; Odgaard, R. Adu-Gyamfi Yields and Qualities of Pigeonpea Varieties Grown under Smallholder Farmers’ Conditions in Eastern and Southern Africa. Afr. J. Agric. Res. 2007, 2, 269–278. [Google Scholar]
  3. Bahl, G.S.; Pasricha, N.S. Efficiency of P Utilization by Pigeonpea and Wheat Grown in a Rotation. Nutr. Cycl. Agroecosyst. 1998, 51, 225–229. [Google Scholar] [CrossRef]
  4. Pahalvi, H.N.; Rafiya, L.; Rashid, S.; Nisar, B.; Kamili, A.N. Chemical Fertilizers and Their Impact on Soil Health. In Microbiota and Biofertilizers, Volume 2: Ecofriendly Tools for Reclamation of Degraded Soil Environs; Springer International Publishing: Berlin/Heidelberg, Germany, 2021; pp. 1–20. ISBN 9783030610104. [Google Scholar]
  5. Kiwia, A.; Kimani, D.; Harawa, R.; Jama, B.; Sileshi, G.W. Sustainable Intensification with Cereal-Legume Intercropping in Eastern and Southern Africa. Sustainability 2019, 11, 2891. [Google Scholar] [CrossRef]
  6. Thierfelder, C.; Rusinamhodzi, L.; Ngwira, A.R.; Mupangwa, W.; Nyagumbo, I.; Kassie, G.T.; Cairns, J.E. Conservation Agriculture in Southern Africa: Advances in Knowledge. Renew. Agric. Food Syst. 2015, 30, 328–348. [Google Scholar] [CrossRef]
  7. Bogužas, V.; Skinulienė, L.; Butkevičienė, L.M.; Steponavičienė, V.; Petrauskas, E.; Maršalkienė, N. The Effect of Monoculture, Crop Rotation Combinations, and Continuous Bare Fallow on Soil CO2 Emissions, Earthworms, and Productivity of Winter Rye after a 50-Year Period. Plants 2022, 11, 431. [Google Scholar] [CrossRef] [PubMed]
  8. Nuruzzaman, M.; Lambers, H.; Bolland, M.D.A.; Veneklaas, E.J. Phosphorus Uptake by Grain Legumes and Subsequently Grown Wheat at Different Levels of Residual Phosphorus Fertiliser. Aust. J. Agric. Res. 2005, 56, 1041–1047. [Google Scholar] [CrossRef]
  9. Mangaba, D.A. The Impact of the Farmer Input Support Program on Crop Diversification among Small-Scale Farmers in Zambia: A Case Study of Nega-Nega Agricultural Camp. Int. J. Multi-Displinary Res. 2017, 1–34. Available online: https://www.multiresearch.net/cms/publications/CFP4482017.pdf (accessed on 13 December 2023).
  10. Farooq, M.; Siddique, K.H.M. Conservation Agriculture; Springer International Publishing: Berlin/Heidelberg, Germany, 2015; ISBN 9783319116204. [Google Scholar]
  11. Kassam, A.; Friedrich, T.; Derpsch, R. Global Spread of Conservation Agriculture. Int. J. Environ. Stud. 2019, 76, 29–51. [Google Scholar] [CrossRef]
  12. Muchabi, J.; Lungu, O.I.; Mweetwa, A.M. Conservation Agriculture in Zambia: Effects on Selected Soil Properties and Biological Nitrogen Fixation in Soya Beans (Glycine max (L.) Merr). Sustain. Agric. Res. 2014, 3, 28–36. [Google Scholar] [CrossRef]
  13. Sommer, R.; Paul, B.K.; Mukalama, J.; Kihara, J. Reducing Losses but Failing to Sequester Carbon in Soils—The Case of Conservation Agriculture and Integrated Soil Fertility Management in the Humid Tropical Agro-Ecosystem of Western Kenya. Agric. Ecosyst. Env. 2018, 254, 82–91. [Google Scholar] [CrossRef]
  14. Liu, X.; Herbert, A.M.; Hashemi, X.; Zhang, X.; Ding, G. Effects of Agricultural Management on Soil Organic Matter and Carbon Transformation—A Review. Plant Soil Env. 2006, 52, 531–543. [Google Scholar] [CrossRef]
  15. Venter, Z.S.; Jacobs, K.; Hawkins, H.J. The Impact of Crop Rotation on Soil Microbial Diversity: A Meta-Analysis. Pedobiologia 2016, 59, 215–223. [Google Scholar] [CrossRef]
  16. Mwila, M.; Mhlanga, B.; Thierfelder, C. Intensifying Cropping Systems through Doubled-up Legumes in Eastern Zambia. Sci. Rep. 2021, 11, 8101. [Google Scholar] [CrossRef] [PubMed]
  17. Vesterager, J.M.; Nielsen, N.E.; Høgh-Jensen, H. Variation in Phosphorus Uptake and Use Efficiencies between Pigeonpea Genotypes and Cowpea. J. Plant Nutr. 2006, 29, 1869–1888. [Google Scholar] [CrossRef]
  18. Abebe, Z.; Tola, M.; Tadesse, S. Multiple Advantages of Pigeon Pea (Cajanas cajan) in Maize Based Cropping Systems: Used as Live Stake for Climbing Bean with Phosphorus Rates and Maize Productivity Enhancement in Mono Cropping Areas. J. Nat. Sci. Res. 2016, 6, 58–69. [Google Scholar]
  19. Odeny, D.A. The Potential of Pigeonpea (Cajanus cajan (L.) Millsp.) in Africa. Nat. Resour. Forum. 2007, 31, 297–305. [Google Scholar] [CrossRef]
  20. Ae, N.; Arihara, J.; Okada, K.; Yoshihara, T.; Johansen, C. Phosphorus Uptake by Pigeon Pea and Its Role in Cropping Systems of the Indian Subcontinent. Science 1990, 248, 477–480. [Google Scholar] [CrossRef] [PubMed]
  21. Garland, G.; Bünemann, E.K.; Oberson, A.; Frossard, E.; Snapp, S.; Chikowo, R.; Six, J. Phosphorus Cycling within Soil Aggregate Fractions of a Highly Weathered Tropical Soil: A Conceptual Model. Soil Biol. Biochem. 2018, 116, 91–98. [Google Scholar] [CrossRef]
  22. Saidia, P.S.; Asch, F.; Kimaro, A.A.; Germer, J.; Kahimba, F.C.; Graef, F.; Semoka, J.M.R.; Rweyemamu, C.L. Soil Moisture Management and Fertilizer Micro-Dosing on Yield and Land Utilization Efficiency of Inter-Cropping Maize-Pigeon-Pea in Sub Humid Tanzania. Agric. Water Manag. 2019, 223, 105712. [Google Scholar] [CrossRef]
  23. Kaoneka, S.R.; Saxena, R.K.; Silim, S.N.; Odeny, D.A.; Ganga Rao, N.V.P.R.; Shimelis, H.A.; Siambi, M.; Varshney, R.K. Pigeonpea Breeding in Eastern and Southern Africa: Challenges and Opportunities. Plant Breed. 2016, 135, 148–154. [Google Scholar] [CrossRef]
  24. Adu-Gyamfi, J.J.; Myaka, F.A.; Sakala, W.D.; Odgaard, R.; Vesterager, J.M.; Høgh-Jensen, H. Biological Nitrogen Fixation and Nitrogen and Phosphorus Budgets in Farmer-Managed Intercrops of Maize-Pigeonpea in Semi-Arid Southern and Eastern Africa. Plant Soil 2007, 295, 127–136. [Google Scholar] [CrossRef]
  25. Murata, M. Crop Varieties Released under the Agricultural Productivity Programme for Southern Africa (APPSA)—Zambia 2019. Available online: https://www.ccardesa.org/knowledge-products/crop-varieties-released-under-agricultural-productivity-programme-southern-0 (accessed on 18 May 2023).
  26. Nordic Climate Facility Completion Report Testing Biochar-Pigeon Pea Agroforestry Businesses in Zambia (ClimChar Zambia), Zambia, NCF7, NCF-C7-091. 2023. Available online: https://smartme.adalia.fi/NCF/fact_sheet/document/2318/field_XWJFUubB:9SoVPVQ8:KPHkG1W0/en (accessed on 29 October 2023).
  27. Ministry of Agriculture Exploratory Soil Map of Zambia. 1991. Available online: https://edepot.wur.nl/487478 (accessed on 23 April 2023).
  28. Egner, H.; Riehm, H.; Domigo, W.R. Investigations on the Chemical Soil Analysis as a Basis for Assesing the Soil Nutrient Status II: Chemical Extraction Methods for Phosphorus and Potassium Determination. Ann. R. Swed. Agric. Coll. 1960, 26, 199–215. [Google Scholar]
  29. Nelson, D.W.; Sommers, L.E. Organic Carbon. In Methods of Soil Analysis, Part 2: Chemical and Biological Properties; Page, A.L., Miller, R.H., Keeney, D.R., Eds.; American Society of Agronomy: Madson, WI, USA, 1982. [Google Scholar]
  30. ISO 11272; ISO Soil Quality-Determination of Dry Bulk Density. ISO: Geneva, Switzerland, 2017.
  31. McLean, E.O. Soil PH and Lime Requirement. In Methods of Soil Analysis, Part 2: Chemical and Biological Properties; Page, A.L., Miller, R.H., Keeney, D.R., Eds.; American Society of Agronomy: Madson, WI, USA, 1982. [Google Scholar]
  32. Bremner, J.M.; Mulvaney, C.S. Nitrogen—Total. In Methods of Soil Analysis, Part 2: Chemical and Microbiological Properties; Page, A.L., Miller, R.H., Keeney, D.R., Eds.; American Society of Agronomy: Madison, WI, USA, 1982. [Google Scholar]
  33. Olsen, S.R.; Sommers, L.E. Phosphorus. In Methods of Soil Analysis, Part 2: Chemical and Microbiological Properties; Page, A.L., Miller, R.H., Keeney, D.R., Eds.; American Society of Agronomy: Madison, WI, USA, 1982. [Google Scholar]
  34. Bray, R.H.; Kurtz, L.T. Determination of Total, Organic and Inorganic Phosphorus in Soil. Soil Sci 1945, 59, 39–45. [Google Scholar] [CrossRef]
  35. Thomas, G.W. Exchangeable Cations. In Methods of Soil Analysis, Part 2: Chemical and Microbiological Properties; Page, A.L., Miller, R.H., Keeney, D.R., Eds.; American Society of Agronomy: Madison, WI, USA, 1982. [Google Scholar]
  36. Day, P.R. Particle Fractionation and Particle Size Analysis. In Methods of Soil Analysis. Part 1, Agronomy 9; Clark, C.A., Ed.; American Society of Agronomy: Madison, WI, USA, 1965; pp. 545–567. [Google Scholar]
  37. R Core Team R. A Language and Environment for Statistical Computing, R Foundation for Statistical Computing: Vienna, Austria, 2023.
  38. Posit Team RStudio. Integrated Development Environment for R, Posit Software; PBC: Boston, MA, USA, 2023.
  39. FAO. Food and Agriculture Organization of the United Nations World Reference Base for Soil Resources 2014: International Soil Classification System for Naming Soils and Creating Legends for Soil Maps; FAO: Rome, Italy, 2014; ISBN 9789251083697. [Google Scholar]
  40. Hocking, P.J.; Keerthisinghe, G.; Smith, F.W.; Randaul, P.J. Comparison of the Ability of Different Crop Species to Access Poorly-Available Soil Phosphorus. Plant Nutr. Sustain. Food Prod. Environ. 1997, 305–308. [Google Scholar]
  41. Bortolon, L.; Bortolon, E.S.O.; de Camargo, F.P.; Seraglio, N.A.; Lima, A.d.O.; Rocha, P.H.F.; de Souza, J.P.; Sousa, W.C.; Tomazzi, M.; Lago, B.C.; et al. Yield and Nutrient Uptake of Soybean Cultivars under Intensive Cropping Systems. J. Agric. Sci. 2018, 10, 344–357. [Google Scholar] [CrossRef]
  42. Amissah, S.; Ankomah, G.; Agyei, B.K.; Lee, R.D.; Harris, G.H.; Cabrera, M.; Franklin, D.H.; Diaz-Perez, J.C.; Habteselassie, M.Y.; Sintim, H.Y. Nutrient Sufficiency Ranges for Corn at the Early Growth Stage: Implications for Nutrient Management. Plants 2023, 12, 713. [Google Scholar] [CrossRef] [PubMed]
  43. Bender, R.R.; Haegele, J.W.; Ruffo, M.L.; Below, F.E. Modern Corn Hybrids’ Nutrient Uptake Patterns. Better Crops 2013, 97, 7–10. [Google Scholar]
  44. Klamer, F.; Vogel, F.; Li, X.; Bremer, H.; Neumann, G.; Neuhäuser, B.; Hochholdinger, F.; Ludewig, U. Estimating the Importance of Maize Root Hairs in Low Phosphorus Conditions and under Drought. Ann. Bot. 2019, 124, 961–968. [Google Scholar] [CrossRef]
  45. Morris, R.A.; Garrity, D.P. Resource Capture and Utilization in Intercropping: Non-Nitrogen Nutrients. Field Crops Res 1993, 34, 319–334. [Google Scholar] [CrossRef]
  46. Tiziani, R.; Mimmo, T.; Valentinuzzi, F.; Pii, Y.; Celletti, S.; Cesco, S. Root Handling Affects Carboxylates Exudation and Phosphate Uptake of White Lupin Roots. Front. Plant Sci. 2020, 11, 584568. [Google Scholar] [CrossRef] [PubMed]
  47. Balemi, T.; Negisho, K. Management of Soil Phosphorus and Plant Adaptation Mechanisms to Phosphorus Stress for Sustainable Crop Production: A Review. J. Soil Sci. Plant Nutr. 2012, 12, 547–561. [Google Scholar] [CrossRef]
  48. Lyu, Y.; Tang, H.; Li, H.; Zhang, F.; Rengel, Z.; Whalley, W.R.; Shen, J. Major Crop Species Show Differential Balance between Root Morphological and Physiological Responses to Variable Phosphorus Supply. Front. Plant Sci. 2016, 7, 1939. [Google Scholar] [CrossRef]
  49. Adu-Gyamfi, J.J.; Fujita, K.; Ogata, S. Phosphorus Fractions in Relation to Growth in Pigeon Pea (Cajanus cajan (L.) Millsp.) at Varions Levels of P Supply. Soil Sci. Plant Nutr. 1990, 36, 531–543. [Google Scholar] [CrossRef]
  50. Mahanta, D.; Rai, R.K.; Mishra, S.D.; Raja, A.; Purakayastha, T.J.; Varghese, E. Influence of Phosphorus and Biofertilizers on Soybean and Wheat Root Growth and Properties. Field Crops Res 2014, 166, 1–9. [Google Scholar] [CrossRef]
  51. Subramanian, K.S.; Bharathi, C.; Jegan, A. Response of Maize to Mycorrhizal Colonization at Varying Levels of Zinc and Phosphorus. Biol. Fertil. Soils 2008, 45, 133–144. [Google Scholar] [CrossRef]
  52. Phiri, M.; Yerokun, O.A.; Chilombo, G. Phosphorus Fractions and Uptake in Semi-Arid Soils of Zambia. Proc. Afr. Crop Sci. Conf. Proc. 2013, 11, 831–834. [Google Scholar]
Figure 1. (a,b). Average and standard errors of P-AL and total C for each site comprising six farms per site. Different lowercase letters indicate significant (p < 0.05) differences between baseline and one season with pigeon pea in each of the four districts (having six farms each). The set of bars labeled “Mean” represents average values (n = 24) and standard error (SE) across 4 districts. Lowercase letters indicate significant differences in P-AL and total C before and after one season with pigeon pea. Different uppercase letters below the site names indicate significant (p < 0.05) differences between districts.
Agronomy 14 00169 g001
Figure 2. Average (n = 3) and standard errors (SE) of Bray-1 extractable P after growing maize, soybean, and pigeon pea. Different lowercase letters indicate significant (p < 0.05) differences within soil between plants. The bars labeled “Mean” represent average values (n = 12) and standard error (SE) across four soils with lowercase letters indicating differences between baseline P and soil P concentrations at the end of the experiment. Different uppercase letters below the soil names indicate significant (p < 0.05) differences between soil.
Agronomy 14 00169 g002
Figure 3. Relationship between plant P concentration (%) with Bray-P (mg per pot) in soil after planting across soils from Kasama, Choma, Kaoma, and Chipata.
Agronomy 14 00169 g003
Figure 4. Average (n = 3) and standard errors (SE) of dry matter yield in g per pot for maize, soybean, and pigeon pea. Different lowercase letters indicate significant (p < 0.05) differences within soil between plants. The bars labeled “Mean” represent average values (n = 12) and standard error (SE) across 4 soils, with lowercase letters indicating differences between treatments across soils. Different uppercase letters below the soil names indicate significant (p < 0.05) differences between soils.
Agronomy 14 00169 g004
Figure 5. (a,b) Phosphorus concentration in above-ground biomass and plant P uptake with mean values (n = 3) and standard error (SE) for each soil Kasama, Choma, Kaoma, and Chipata. Lowercase letters indicate differences between plants in each of the soils. The bars labeled “Mean” represent average values (n = 12) and standard error (SE) across 4 soils, with lowercase letters indicating differences between treatments across soils. Upper case letters indicate differences between soils with the same plants. Means with the same letter are not significantly different at a 95% level of confidence. P Uptake (mg per pot) = P Concentration (mg kg−1) * Dry matter yield (kg per pot).
Agronomy 14 00169 g005
Figure 6. Effect of crop and soil type on plant P uptake.
Agronomy 14 00169 g006
Table 1. Stocks of plant-available P (P-AL) before and after pigeon pea cropping under field conditions.
SiteBaselineAfter Pigeon PeaDifference
P kg ha−1P kg ha−1P kg ha−1% Decrease
Choma17.7 ± 3.213.7 ± 1.2−4.022.6
Kaoma41.8 ± 4.6 32.2 ± 3.4−9.623.0
Mkushi23.6 ± 3.412.4 ± 3.4−11.247.5 *
Chipata25.3 ± 5.317.3 ± 2.8−8.031.6
Means with standard errors of soil P stock before and after pigeon pea cropping. * The soil P stock before and after pigeon pea cropping is only significantly different in Mkushi.
Table 2. Selected properties of the soils used in the greenhouse study.
Soil ID pHSOCNFeAl-PPKSandClaySiltTextureSoil Type
0.01 MCaCl2W & BlackKjeldahlNaOH-NaClBray 1NH4OAcHydrometer MethodUSDA* WRB
%%mg kg−1mg kg−1cmol (+) kg−1%%%
Kasama 3.93 ± 0.020.83 ± 0.050.05 ± 0.0111.21 ± 0.618.00 ± 0.260.09 ± 0.0081.2 ± 0.06.4 ± 0.012.4 ± 0.0Loamy SandAcrisols
Choma 4.71 ± 0.060.48 ± 0.020.05 ± 0.001.52 ± 1.294.62 ± 0.230.08 ± 0.0083.9 ± 0.73.7 ± 0.712.4 ± 1.2Loamy SandLixisols
Kaoma 4.85 ± 0.070.71 ± 0.05 0.05 ± 0.007.12 ± 0.7219.84 ± 0.270.14 ± 0.0191.2 ± 0.02.4 ± 0.06.4 ± 0.0SandArenosols
Chipata 4.55 ±0.031.71 ± 0.050.19 ± 0.013.86 ± 1.173.12 ± 0.360.29 ± 0.0068.5 ±0.79.1 ± 0.722.4 ± 1.2Sandy LoamAcrisols
Means with standard errors of soil properties. * WRB is World Reference Base [39].
Table 3. The enrichment of plant-available P after maize, soybean, and pigeon pea cropping.
SitePlant-Available PP before PlantingMaizeSoybeanPigeon Pea
mg per potmg per pot mg per potmg per pot
KasamaBray-P 20.01 ± 0.66 15.78 ± 1.2522.70 ± 1.4920.27 ± 0.61
Plant P -8.84 ± 0.982.49 ± 0.492.18 ± 0.71
Bray-P + Plant P20.01 ± 0.66 b24.62 ± 0.79 a25.19 ± 1.39 a22.45 ± 0.53 ab
Mobilized P-4.61 ± 0.795.18 ± 1.392.44 ± 0.53
ChomaBray-P 11.56 ± 0.5711.58 ± 0.4114.71 ± 3.1811.53 ± 1.09
Plant P -10.13 ± 0.887.17 ± 0.556.28 ± 0.19
Bray-P + Plant P11.56 ± 0.57 b21.71 ± 0.52 a21.88 ± 2.75 a17.81 ± 0.90 ab
Mobilized P-10.15 ± 0.5210.32 ± 2.756.25 ± 0.90
KaomaBray-P 49.59 ± 0.6824.80 ± 1.6336.25 ± 4.8942.76 ± 4.46
Plant P -37.54 ± 5.0224.76 ± 2.208.34 ± 6.58
Bray-P + Plant P49.59 ± 0.68 a62.34 ± 4.29 a61.01 ± 2.85 a51.10 ± 2.36 a
Mobilized P-12.75 ± 4.2911.42 ± 2.851.51 ± 2.36
ChipataBray-P 7.79 ± 0.907.17 ± 0.577.46 ± 0.426.47 ± 0.15
Plant P -6.60 ± 0.194.15 ± 0.803.40 ± 0.13
Bray-P + Plant P7.79 ± 0.90 c13.77 ± 0.74 a11.61 ± 0.72 ab9.87 ± 0.08 bc
Mobilized P-5.98 ± 0.743.82 ± 0.722.08 ± 0.08
MeanBray-P 22.24 ± 4.9514.83 ± 2.0220.28 ± 3.4720.26 ± 4.31
Plant P -15.78 ± 3.979.65 ± 2.735.05 ± 1.59
Bray-P + Plant P22.24 ± 4.95 b 30.61 ± 5.73 a29.93 ± 5.69 a25.31 ± 4.72 b
Mobilized P-8.37 ± 1.36 a7.69 ± 1.33 a 3.07 ± 0.79 b
Phosphorus budgets with average values (n = 3) and standard error (SE) for each soil. Lowercase letters indicate differences between treatments in each of the soils. The category labeled “Mean” represents average values (n = 12) and standard error (SE) across four soils, with lowercase letters indicating differences between treatments across soils. Means with the same letter are not significantly different at a 95% level of confidence.
Disclaimer/Publisher’s Note: The statements, opinions and data contained in all publications are solely those of the individual author(s) and contributor(s) and not of MDPI and/or the editor(s). MDPI and/or the editor(s) disclaim responsibility for any injury to people or property resulting from any ideas, methods, instructions or products referred to in the content.

