Abstract
The TGACG motif-binding factor1 (TGA1) transcription factor, in which belongs to the bZIP transcription factor family and has vast application potential in plant growth and development. Here, we cloned the gene of the MtTGA1 transcription factor from Medicago truncatula. The MtTGA1 promoter region contains a diverse range of photoregulatory and hormonal regulatory elements. The expression profile of MtTGA1 indicated its highest expression in the root. Additionally, the expression level of MtTGA1 was significantly upregulated after SA and BR treatments and showed a downward trend after GA and ABA treatments. To explore the potential function of MtTGA1, we treated the transgenic plants with salt treatment for 15 days, and the results showed that transgenic plants demonstrated significantly longer root lengths and heightened activities of antioxidant enzymes such as ascorbic acid catalase (APX), peroxidase (POD), catalase (CAT), and superoxide dismutase (SOD) in their roots and leaves. The levels of endogenous hormones, including ABA and BR were improved in transgenic plants, with a marked change in the morphology of their leaf cells. Transcriptome analysis identified a total of 193 differentially expressed genes, which were significantly enriched in the pathways of “Brassinosteroid biosynthesis”, “Ascorbate and aldarate metabolism”, and “Plant hormone signal transduction”. Furthermore, MtTGA1 was found to interact with the SPX domain-containing protein 1 (SPX1) in Medicago truncatula. In conclusion, these results are beneficial for further studies about the plant growth and development regulatory network mediated by the TGA1 transcription factor family.
1. Introduction
Salinization does more than just impede the normal growth of plants; it presents a significant challenge to crop yield and global land utilization. Salt stress inflicts three primary forms of damage on plants: ion imbalance, hypertonic stress, and oxidative damage [1]. It is the root system that first detects the salt signal, reacting swiftly to maintain its function and propagate the signal to other plant organs [2]. Consequently, plants use a myriad of complex mechanisms to counter salt stress, including selective ion absorption/rejection, regulation of photosynthesis and energy metabolism, the accumulation of antioxidant enzymes, hormone regulation, and alterations to cell structure [3]. Therefore, unraveling the salt response mechanism in plant roots to enhance plant salt tolerance represents a primary focus of research in this field.
In recent years, numerous researchers have delved into the molecular mechanisms underlying plant salt tolerance by elucidating the pathways of salt signal transduction. The use of plant growth regulators has proven to be an effective strategy for enhancing plant salt tolerance. Abscisic acid (ABA), a critical stress response hormone, plays an indispensable role in seed development, as well as in defense mechanisms against drought and salt stress [4,5,6]. Sucrose non-fermenting 1-associated protein kinases (SnRK2s), activated by ABA, help maintain osmotic homeostasis by regulating the conversion of BAM1- and amy 3-dependent starch into sugars and osmolytes [7,8]. Moreover, SnRK2 has the capability to phosphorylate various ABA-responsive element (ABRE)-binding protein/Abre-binding factor (AREB/ABF) transcription factors, which subsequently regulate stomatal closure in response to osmotic stress in plants [9]. Gibberellin (GA) is also pivotal in plant growth and development. Some studies have revealed that genes related to GA metabolism, such as AtGA2ox7 [10], OsGA2ox5 [11], and OsMYB91 [12], can enhance plant salt tolerance by decelerating growth. The SLR1 protein, an inhibitor of the GA signaling pathway, can boost plant survival under salt stress by suppressing plant growth [13]. Salicylic acid (SA) not only plays a role in biological stress in plants but is also crucial in the response to salt stress. Applying SA can bolster a plant’s antioxidant and osmotic systems and can even stimulate photosynthesis under salt stress [14]. Overexpression of the SA receptor AtNPR1 or MhNPR1 in tobacco plants has been shown to enhance tobacco’s tolerance to oxidative and salt stress by promoting the SA signaling pathway [15,16]. Brassinosteroids (BR) have been identified as playing a role in plant responses to various abiotic stresses, including salt stress [17]. Overexpression of the BR biosynthetic gene SoCYP85A1 in spinach has been shown to enhance salt tolerance [18]. Furthermore, BR can channel more carbohydrates to the roots and hasten the establishment of bacteria in root nodules under stress, thereby enhancing a plant’s salt tolerance [17].
Basic region/leucine zipper (bZIP) proteins comprise one of the most extensively studied transcription factor families, present across all eukaryotic organisms. TGA transcription factors, belonging to the bZIP protein family, are known to specifically bind to the tgacg central activation sequence 1 (as-1). This binding event regulates the transcription level of target genes, thereby enhancing a plant’s capacity to withstand abiotic stress [19]. Genome-wide studies in Arabidopsis thaliana have revealed that the TGA gene family, encompassing ten members, can be further subdivided into five groups based on sequence similarity [20,21,22]. Numerous studies have demonstrated that TGA transcription factors play a significant role in modulating plant stress tolerance, including the enhancement of plant salt tolerance. Jayakannan [23] discovered that Arabidopsis NPR1 facilitates the absorption of Na+ into the root system via the SA signaling pathway while inhibiting transport to the above-ground parts, thereby bolstering salt tolerance. The MhTGA2 gene in apple trees has been found to enhance the resistance of transgenic tobacco seeds to NaCl during the germination and seedling stages [24]. Similarly, the MhNPR1 gene in tobacco augments the resilience of tobacco seeds to NaCl during germination [16]. Hao’s research [25] showed that npr1-1 mutants blocked by SA signaling pathways can improve plant salt tolerance. Furthermore, npr3 npr4 double mutants accumulate higher levels of NPR1, which has a positive effect on improving plant basal resistance [26,27].
While significant advancements have been made in the study of salt stress genes pertaining to the TGA family, research involving the TGA1 transcription factor remains scant. Medicago truncatula, a model plant within the legume family [28], has considerable importance for studying salt-tolerance response genes. Exploring its salt-tolerance mechanisms could potentially enhance its salt-tolerance capability and improve legume yields. Therefore, this study focuses on the MtTGA1 of Medicago truncatula. Using biotechnological approaches, we investigate the regulatory mechanism underlying MtTGA1 in response to salt stress. Our findings aim to lay a foundation for expedited breeding of salt-tolerant forage varieties using genetic engineering.
2. Results
2.1. Structural Analysis of the Protein MtTGA1
The transcription factor MtTGA1 possesses a complete coding region of 1092 bp, encoding a protein of 363 amino acids. The MtTGA1 protein exhibits a molecular weight of 41.304 kD and a theoretical isoelectric point of 6.36. This protein includes a bZIP domain, categorizing it within the bZIP family of transcription factors (Supplementary Figure S1).
SWISS-MODEL and PyMOL software were used to obtain the tertiary model and electrostatic potential of the MtTGA1 protein (Figure 1). The three-dimensional tertiary structure simulation shows that the MtTGA1 protein displays a substantial α-helix content, constituting 61.71% of the structure (Figure 2a). The protein also includes polar residues at positions 55–71, with its functional domain extending from residues 77 to 121 (Figure 1a and Figure S1). The electrostatic potential shows multiple negative potentials on the surface of the protein (Figure 1b). Additionally, protein sequences of various species (Supplementary Table S2) were procured from the NCBI database for phylogenetic examination of the MtTGA1 protein. The derived phylogenetic tree efficaciously classifies the included species. Notably, MtTGA1 exhibits the highest homology with the TGA1 protein of Trifolium pratense and other legumes (Supplementary Figure S2).
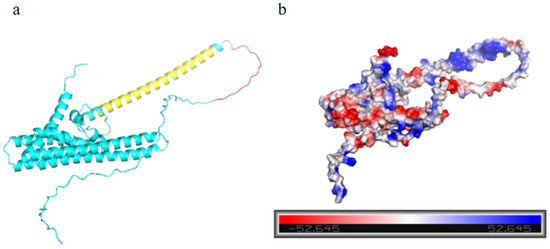
Figure 1.
MtTGA1 protein structure analysis. (a) MtTGA1 protein structure model. Yellow indicates the domain area, red indicates the area where the polar residues are located, and blue represents the remaining area. (b) Electrostatic distribution of proteins. The electrostatic point value is positively correlated with the color depth, with blue representing positive potential and red representing negative potential.
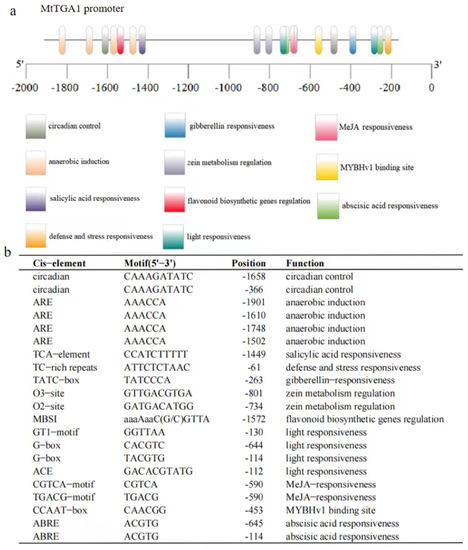
Figure 2.
Analysis of the upstream sequence of MtTGA1 transcription factor. (a) Cis−acting elements upstream of the MtTGA1transcription factor. (b) List of predicted binding sites for the transcription factors upstream of MtTGA1.
2.2. MtTGA1 Upstream Sequence Analysis
To investigate the regulatory mechanism underlying MtTGA1, a 2000 bp sequence was obtained at the 5′ upstream end of MtTGA1 located on genome chromosome 3. Analysis of these sequences revealed their wide involvement in light response elements such as ACE, G−box, and GT1−motif (Figure 2). Reaction elements related to abscisic acid (ABA), gibberellin (GA), methyl jasmonate (MeJA), and salicylic acid (SA) pathways were also identified. Furthermore, these promoter regions significantly influence zein metabolism regulation, defense and stress responsiveness, and anaerobic induction responses. These findings suggest that the transcription factor MtTGA1 may play multifaceted roles in plant growth and development regulation.
2.3. Localization and Expression Pattern of MtTGA1
Following Agrobacterium-mediated tobacco infection with the recombinant plasmid, the fusion protein is expressed in tobacco leaf tissues, and the protein emits a strong fluorescence signal in the nucleus when observed under laser confocal microscopy. A non-targeted yellow fluorescent protein (YFP), serving as a control, was localized throughout the cell. Subcellular localization studies indicated that the MtTGA1 protein was primarily localized in the nucleus (Figure 3).
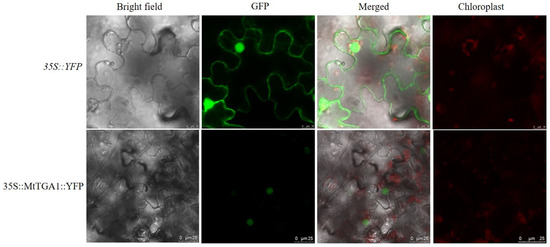
Figure 3.
Subcellular localization of MtTGA1. MtTGA1 is confirmed to be located in the nucleus after detecting the YFP signal. The green color represents the YFP signal. Scale bars = 10 μm/25 μm.
Real-time PCR was used to examine the expression of MtTGA1 across different tissue development stages. The results showed that MtTGA1 was expressed in roots, stems, leaves, and flowers, with the highest expression in roots (Figure 4a). Following osmotic stress treatment (150 mMNaCl), the expression of MtTGA1 initially decreased and then increased (Figure 4b). Treatment with SA upregulated the expression level of MtTGA1 (Figure 4c). After GA treatment, the expression level of MtTGA1 first decreased and then increased, and the overall trend was lower than 0 h (Figure 4d), while ABA treatment led to a decrease (Figure 4e). After BR treatment, the expression level of MtTGA1 increased gradually (Figure 4f). These findings suggest that MtTGA1 may participate in salt stress and hormone regulation networks.
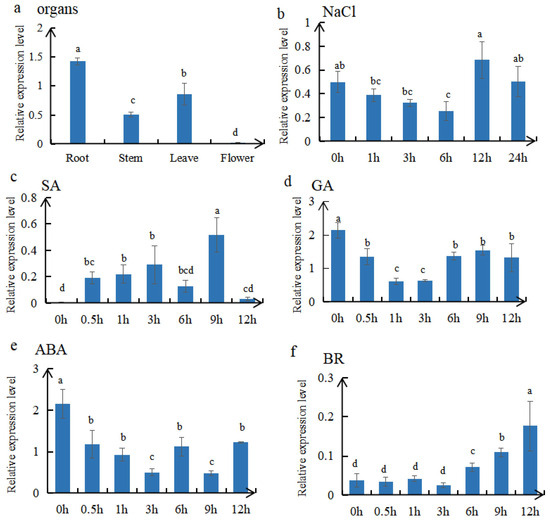
Figure 4.
Expression analysis of MtTGA1 in Medicago truncatula. (a) The relative expression level of MtTGA1 in the root, stem, leaf, and flower. (b) The relative expression level of MtTGA1 after 150 mM NaCl. (c–f) The relative expression level of MtTGA1 under different hormones, including 0.5 mM SA, 10 μM GA, 50 μM ABA, and 0.1 μM BR treatments. The X-axis represents the sampling time, and the Y-axis represents the MtTGA1-related expression level. The mean is calculated in three repeats. Lowercase letters above columns indicate differences in means (p < 0.05). Error bars indicate the standard error of the mean.
2.4. MtTGA1 Enhanced Salt Stress Tolerance in Overexpressed Transgenic Plants
Based on expression levels of MtTGA1 transcription factor analysis, the S9 and S11 plants were selected for further exploration (Figure 5c). WT and transgenic S9 and S11 plants showed almost no difference under untreated conditions (Figure 5a,e). However, the root length of S9 and S11 plants significantly increased under treatment with 150 mM NaCl for 15 days compared with WT plants (Figure 5b). In addition, we found that the expression level of MtTGA1 was proportional to root length, while the expression level of S11 was lower than that of S9, and the root length was also lower (Figure 5b–d). The average root length of transgenic MtTGA1 plants was 4.14 and 3.24 times longer than that of WT plants, respectively (Figure 5e). The chlorophyll content of transgenic plants was similar to that of wild types, with S11 having 0.39% higher chlorophyll content and S9 being 0.58% lower than WT (Figure 5d). In addition, the expression levels of key enzymes for detoxification of reactive oxygen species (ROS) under salt stress conditions, including ascorbic acid (AA) and monodehydroascorbate reductase (MDHAR), were detected in transgenic Arabidopsis [29]. The results showed that the expression of AA and MDHAR was up-regulated in S9 and S11 (Figure 5f). The analysis of antioxidant enzymes in the roots and leaves of transgenic and WT plants treated with 150 mM NaCl showed higher activities of APX, POD, CAT, and SOD in transgenic lines S9 and S11 than in WT (Figure 5g–j). These results suggest that MtTGA1 might promote root development and enhance plant salt resistance under salt stress.
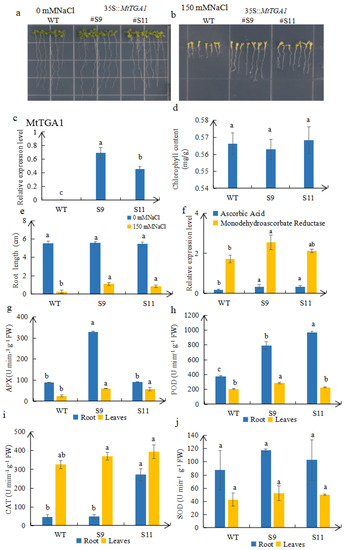
Figure 5.
Responses of WT and transgenic plants to NaCl treatment. (a,b) Transgenic and WT plants were planted on 1/2 MS medium with or without 150 mM NaCl for 15 days. (c) MtTGA1 expression levels are in the WT, S9, and S11 strains. (d) Chlorophyll content of transgenic and wild-type plants treated with 150 mM NaCl. (e) The root lengths of transgenic and WT plants were measured for 15 days with or without 150 mM NaCl treatment. (f) Relevant expression levels of ascorbic acid and monodehydroascorbate reductase in WT, S9, and S11 plants. APX enzyme (g), POD enzyme (h), CAT enzyme (i), and SOD (j) enzyme in roots and leaves of transgenic and WT plants treated with 150 mM NaCl. The mean is calculated from three repeats. Lowercase letters above columns indicate differences in means (p < 0.05). Error bars indicate the standard error of the mean.
2.5. Detection of Endogenous Hormones in Overexpressed Plants
The plant hormone content in the WT and transgenic plants was evaluated. The results demonstrated that the content of ABA and BR in S9 and S11 plants was significantly higher than in WT plants (Figure 6a,c). Moreover, the GA3 content of S9 and S11 was lower than that in WT. Specifically, the GA3 content in transgenic S9 and S11 plants decreased by 0.18% and 18.47%, respectively, compared with WT (Figure 6b).
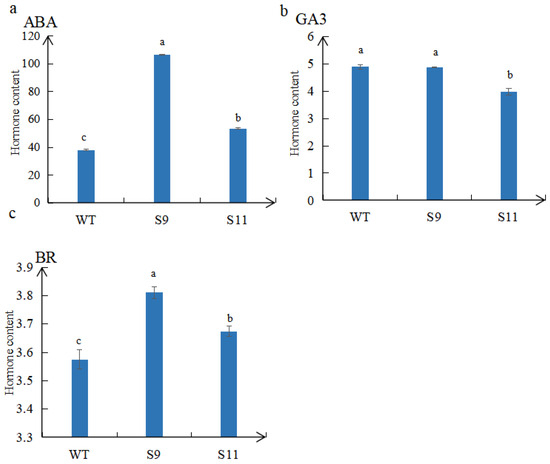
Figure 6.
Determination of endogenous hormones ABA (a), GA3 (b), and BR (c) in WT, S9, and S11. The values are means ± SD (n = 3). Lowercase letters above columns indicate differences in means (p < 0.05). The mean is calculated from three repeats. Error bars indicate the standard error of the mean.
2.6. Leaf Morphological Changes in Transgenic Plants
The cross-sections of transgenic and wild-type plants revealed distinct changes in the leaves of transgenic plants. Compared with the control, the cortical tissue thickness of transgenic plants decreased (Figure 7). In wild-type leaves, mesophyll and phloem cells were densely and uniformly arranged (Figure 7a). However, in transgenic cells, mesophyll and phloem cells were arranged more sparsely and irregularly (Figure 7b,c). Additionally, the upper epidermal cells in S11 were significantly larger than those in the WT, with average lengths of approximately 45.6 μm and 67.7 μm, respectively.
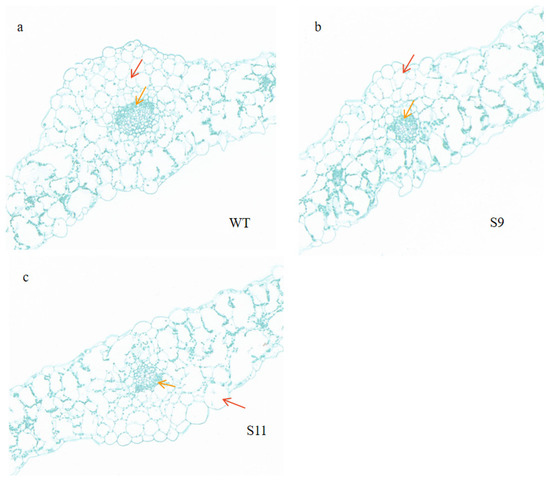
Figure 7.
Observation of leaf morphology in a transverse section. (a) WT blade transverse section. (b) S9 blade transverse section. (c) S11 blade transverse section. Red arrows indicate mesophyll cells and yellow arrows indicate phloem cells. Scale bar = 100 μm.
2.7. MtTGA1 Interacts with MtSPX1
In order to explore the interaction between MtTGA1 proteins, UniProt software was used to analyze the MtTGA1 protein. It was found that the MtTGA1 protein interacts with the MtSPX1 protein, which was verified with a yeast two-hybrid system and a bimolecular fluorescence system. The results showed that only the yeast mixture containing both PGADT7−MtSPX1 and PGBKT7−MtTGA1 grew normally and turned blue on a medium lacking Leu, Trp, His, and Ade, while the control did not, suggesting an interaction within yeast cells (Figure 8a). MtTGA1 and MtSPX1 were fused to the N− and C−terminals of YFP, respectively, and co-transformed into tobacco cells. After 3 days of co−culture in the dark, strong YFP signals were detected in the cytoplasm (Figure 8b). These results indicate that MtTGA1 binds directly to the MtSPX1 protein.
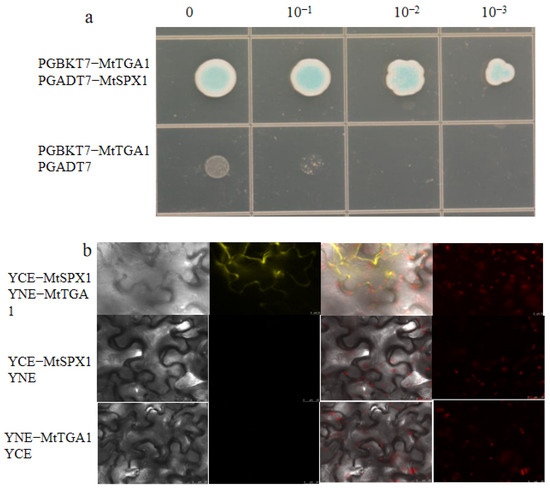
Figure 8.
MtTGA1 interacts with MtSPX1. (a) Interaction between MtTGA1 and MtSPX1. The number indicates the dilution times of transformed yeast cells. The control was PGBKT7−MtTGA1 and PGADT7. The control was not long and remained blue. (b) BIFC shows the interaction between MtTGA1 and MtSPX1 in living cells. MtTGA1 interacts with MtSPX1 in the cytoplasm by detecting the YFP signal. The negative control was YCE−MtSPX1 co−expression with YNE or YNE−MtTGA1 co−expression with YCE. The YFP fluorescence in the tobacco cells was observed using a LEICA SP−8 confocal microscope. The yellow color represents the YFP signal. Scale bars = 25 μm.
2.8. Identification of DEGs and TFs Using Transcriptome Analysis
Transcriptome sequencing unveiled a total of 193 differentially expressed genes (DEGs) in both the transgenic and control samples, among which 185 genes were up-regulated and 8 genes down-regulated (Figure 9a). To further elucidate gene function, the DEGs were analyzed using gene ontology (GO) enrichment and KEGG pathway enrichment. The DEGs were most actively involved in the “Biological Process” category and displayed the most substantial enrichment in the “Molecular Function” category (Figure 9b). Notably, in the GO-enriched biological processes, we observed that the gibberellin metabolic process gene (AT2G36690), the response to the abscisic acid gene (AT5G52310), and the response to the oxidative stress gene (AT5G43750) were upregulated (Supplementary Table S3). Additionally, DEGs were classified into 38 pathways, with the “Photosynthesis” pathway demonstrating the highest enrichment (Figure 9c). We also discovered that DEGs were significantly enriched in the “Brassinosteroid biosynthesis”, “Ascorbate and aldarate metabolism”, and “Plant hormone signal transduction” pathways (Supplementary Figure S3a–c). These findings suggest that the MtTGA1 transcription factor plays a pivotal role in plant hormone signaling responses and stress response networks.
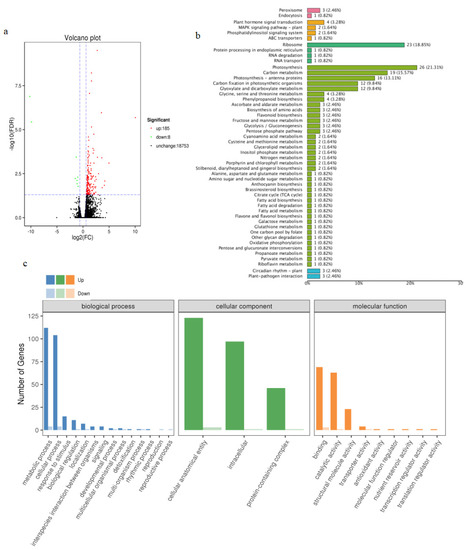
Figure 9.
Transcriptome analysis of transgenic and wild-type Arabidopsis thaliana. Volcano plot of DEGs (a). In the graphs, each plot represents one gene with three colors, including red (up-regulated), green (down-regulated), and blank (unchanged). The X-axis represents the value of log2 (fold change) in the two samples, and the Y-axis indicates the negative value of log10 (FDR). GO classification enrichment analysis of DEGs (b). In the graphs, the X-axis represents the GO classification, and the Y-axis represents the number of genes. KEGG pathway types of DEGs (c). In the graphs, the X-axis represents the KEGG metabolic pathway name, and the Y-axis represents the ratio of the number of genes annotated to the pathway to the total number of annotated genes.
To validate the transcription data, four up-regulated genes (At2G36690, AtRD29A, AtPNSB5, AtCHLH) and four down-regulated genes (AtZIP4, AtFLP2, AT3G05770, AtIPT3) from DEGs were selected to perform a quantitative real-time PCR (qRT-PCR) analysis. The results of this experiment show a similar trend compared to our RNA-seq results, further confirming our sequencing results (Figure 10).
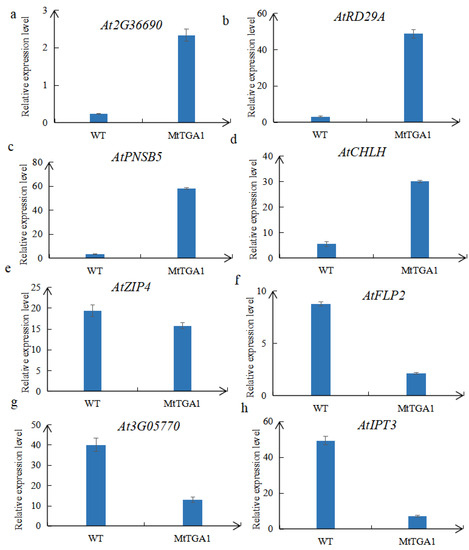
Figure 10.
The relative expression of eight DEGs was selected: (a–d) indicates up-regulated genes and (e–h) indicates downregulated genes. The mean is calculated from three repeats, and the error bar represents the standard error of the mean.
3. Discussion
TGA1 transcription factors, belonging to Group I members of the TGA gene family, are primarily involved in plant disease and stress resistance and play a crucial role in mitigating plant salt stress [30]. In our study, the MtTGA1 also responds to salt stress in Medicago truncatula (Figure 4b), which may be related to the cis-acting elements of its promoter (Figure 2b). The MtTGA1 transcription factor was studied using bioinformatics strategies, and using a simple analysis, it was discovered that the MtTGA1 protein contains a polar residues region, a DOG1 structure region, and a BZIP domain region. The specific protein structure of TGA1 may lead to some functional differences between this transcription factor and other homologous genes, but this requires further validation. YFP and MtTGA1 were fused and performed subcellular localization in tobacco. The results showed that MtTGA1 was mainly located in the nucleus (Figure 3). These results suggest that MtTGA1 may plan an imprint role in stress responses by regulating the gene expression of its downstream targets.
Plant hormones are signaling compounds that regulate crucial aspects of growth, development, and environmental stress responses [31]. The promoter analysis showed that MtTGA1 responds to multiple hormonal elements, including SA, GA, ABA, and BR, and consistent with these results, MtTGA1 transcription levels respond to SA, GA, ABA, and BR, suggesting that MtTGA1 may be involved in the hormonal regulatory network. (Figure 4c–f). It is well known that plants can adapt to environmental stress by regulating hormone levels. Previous studies have shown that under salinity osmotic stress, endogenous ABA levels rapidly increase, activating SnRK2s proteases, which in turn enhances salt stress [7]. The dominant inhibitor OsDSK2a protein can degrade the GA-inactivating enzyme ELONGATED UPPERMOST INTERNODE (EUI). Under salt stress conditions, OsDSK2a levels decreased, and the accumulated EUIs reduced the GA levels, slowing down plant growth and indicating that salt stress improved plant stress resistance by decreasing bioactive GA levels [32]. Arabidopsis BR mutants det2-1 and bin2-1 are more sensitive to salt stress, which can be rescued with the administration of exogenous BR [33]. In this study, endogenous hormone content in transgenic plants was altered compared with the wild type (Figure 6), possibly due to MtTGA1 responding to salt stress by responding to endogenous hormones.
In plants, a common set of signaling components may integrate inputs from multiple hormones to regulate growth, including ABA and BR hormones [34]. Under our experimental conditions, MtTGA1 expression level was altered by spraying ABA and BR hormones (Figure 4e,f), and we speculate that MtTGA1 can be jointly regulated by BR and ABA. Brassinosteroid signaling kinase 5 (BSK5) is a crucial enzyme in the brassin synthesis pathway, activated by BR and ABA, as well as salt stress [35]. A previous study showed that BSK5 overexpression inhibited developmental defects of bril mutants, suggesting that BSK5 has a positive effect on BR signaling [36]. BR has been reported to improve plant tolerance by mediating redox mechanisms [37]. Lv et al. demonstrated that the crosstalk nodes between BR and reactive oxygen species (ROS) pathways were related to plant root growth and development [38]. Overexpression of MtTGA1 also increased the root length of transgenic plants under salt-stressed conditions (Figure 5b). Thus, BR may directly act on MtTGA1. A large number of studies have shown that reactive oxygen species (ROS) are induced under abiotic stress, leading to excessive accumulation that can cause membrane damage and even cell death [39,40,41]. Peroxidase acts as a cytoplasmic enzyme antioxidant that can eliminate ROS damage to plants [29]. In MtTGA1 transgenic plants, we found that some key enzyme expression levels were up-regulated and associated with inducing ROS clearance (Figure 5f). Furthermore, under salt stress treatment, the APX, POD, CAT, and SOD activities of S9 and S11 plant roots and leaves were enhanced, indicating that excess ROS was cleaned, and the membrane structure was protected (Figure 5g–j). Thus, we speculated that when plants receive salt stress signals, they activate BSK5, promoting BR hormone synthesis, leading to an increase in MtTGA1 expression and, subsequently, enhancing plant salt stress capacity by increasing antioxidant enzyme activity and cleaning ROS. Conversely, while ABA inhibits BR signal output, BR can enhance the response of ABA by increasing the level of ABA under certain conditions, thereby improving plant stress tolerance [1,42]. BR also modulates plant adaptation to salt by directly inducing ROS clearance (Figure 11) [43]. The interaction between BR and ABA hormones and MtTGA1 transcription factors can provide a new perspective to explore the regulatory mechanism underlying the Medicago truncatula salt stress response.
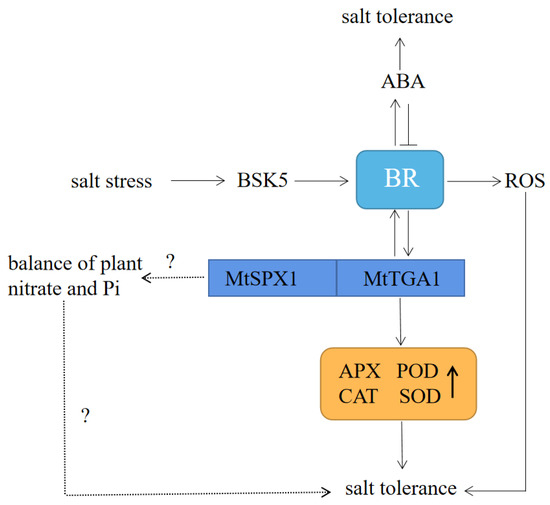
Figure 11.
Model showing the role of the MtTGA1 regulatory chain in the Arabidopsis thaliana salt stress response. BSK5 promotes the synthesis of BR, induces the expression of MtTGA1, enhances the activity of antioxidant enzymes, and enhances salt stress in plants. BR increases ABA levels, and ABA inhibits BR signal output. BR regulates plant adaptation to salt by regulating ROS. MtTGA1 and MtSPX1 work together to regulate the balance of nitrate and Pi and improve salt tolerance through this pathway. The question mark represents an idea that needs to be confirmed by further exploration.Plant roots are primarily responsible for sensing salinity signals. Under salt stress conditions, Na+ first enters the roots, then most Na+ is expelled from the root cells via the root plasma membrane (PM) Na+/H+ antiporters (NHXs), while the rest is isolated into vacuoles or transported above ground [44,45]. In response to increased Na+ concentrations, plant root growth typically slows down rapidly and can gradually recover under moderate salt stress [46]. In our study, the length of S9 and S11 roots was significantly longer than the wild type under 150 mM NaCl stress, indicating that S9 and S11 are less sensitive to salt stress compared to the controls (Figure 5a,b,e). We also observed that the chlorophyll content in S9 was slightly lower than that in the wild type (Figure 5d). On the one hand, this may be due to mechanical damage during sampling, which affects the normal transport of Na+ to the ground, resulting in an increase in the concentration of Na+ transport into the leaf, which hinders the synthesis of chlorophyll. On the other hand, the decrease in cortical tissue thickness of transgenic plants may lead to a decrease in the number of chloroplasts in the leaves of transgenic plants and a reduction in chlorophyll synthesis (Figure 7). Additionally, we found that MtTGA1 interacts with MtSPX1 (Figure 8a,b). Proteins containing the SPX1 domain are key to regulating Pi homeostasis and signaling [47]. Studies have shown that the rice OsSOX4 protein can interact with the nitrate transporter OsNRT1.1B to regulate the balance of nitrate and Pi in rice [48]. Interestingly, TGA1 is a crucial regulator of the nitrate response in Arabidopsis thaliana roots and can regulate the expression of NRT1.1 homologous gene NRT2.1, thereby promoting root development [49]. Thus, MtTGA1 and MtSPX1 might jointly regulate the balance of nitrate and Pi in roots and possibly regulate the root length of plant under salt stress through this pathway (Figure 11).
4. Materials and Methods
4.1. Plant Materials, Growth Conditions, and Stress Treatments
Seeds of Medicago truncatula (R108) were received from the Samuel Roberts Noble Foundation (Ardmore, OK, USA). Arabidopsis thaliana and Nicotiana benthamiana, plant expression vectors 3302Y and 3302-strep, and the Agrobacterium tumefaciens strain EHA105 used in this study were stored and cultivated at Beijing Forestry University for a long time in an environment at 4 °C. Following a 4-day vernalization at 4 °C, Medicago truncatula and Nicotiana benthamiana seeds were grown under conditions of 16 h of light at 26 °C and 8 h of darkness at 24 °C until root development. Seedlings were transferred to a nutrient medium containing peat, vermiculite, and perlite, and growth continued under the same conditions. Arabidopsis thaliana seeds were sown on plastic Petri plates containing half-strength Murashige–Skoog (MS) medium (PhytoTech, Lenexa, KS, USA) with or without 150 mM NaCl. After cold stratification at 4 °C for 3 days, the plants were transferred to an incubator at 23 °C for 16 h and 21°C dark for 8 h for 15 days for subsequent experiments.
4.2. Bioinformation Analysis
The sequence of MtTGA1 was retrieved from the National Center for Biotechnology Information (NCBI) database. Protein interactions were analyzed and predicted using UniProt (https://www.uniprot.org/ accessed on 18 November 2022). The cis-regulatory elements analysis used the PlantCARE database (http://bioinformatics.psb.ugent.be/webtools/plantcare/html/ accessed on 27 April 2022) and TBtools [50,51,52,53]. The secondary and tertiary structures of the proteins were analyzed using the Compute pI/MW tool (http://web.expasy.org/compute_pi/ accessed on 20 October 2022), Phyre v2.0 tool (www.sbg.bio.ic.ac.uk/phyre2/ accessed on 20 October 2022), SWISS-MODEL (https://swissmodel.expasy.org/ accessed on 23 October 2022), and PyMOL version 2.5.2. Using BLAST homologous identification in the NCBI database, 25 TGA1 proteins from different plants were obtained. A phylogenetic tree analysis in MEGA version 5.0 was performed using the adjacency method.
4.3. Expression Pattern
Two-month-old Medicago truncatula leaves were selected. Osmotic stress was induced with 150 mmol/L NaCl; and 0.5 mmol/L SA, 10 μmol/L GA3, 50 μmol/L ABA, and 0.1 μmol/L BR were sprayed for hormone treatment. Plant leaf tissues were collected at 0 h, 0.5 h, 1 h, 3 h, 6 h, 9 h, 12 h, and 24 h for temporal expression analysis. Two-month-old root, stem, leaf, and flower samples in the same state were quickly frozen with liquid nitrogen and stored at −80 °C for further spatial differential expression analysis. Total RNA from different treatment samples was extracted using a Plant RNA Kit (Omega Bio-tek, Inc., Norcross, GA, USA), and cDNA was synthesized using the PrimeScript™ RT reagent Kit (TaKaRa, Shiga, Japan). The AtUBQ10 gene was used as the housekeeping gene, and attraction-rt-F/R and TGA1-RT-F/R were used as the primers to perform real-time quantitative (qRT-PCR) experiments (Supplementary Table S1). The expression of the MtTGA1 gene was calculated using the 2−ΔΔCT method, with three replicates [54].
4.4. Subcellular Localization
The MtTGA1-pMD19-T plasmid and MtTGA1-YFP-F/R primers (Supplementary Table S1) were used to construct the subcellular localization vector 35S::MtTGA1-YFP, which was transformed into EHA105 A. tumefaciens. The aforementioned bacterial solution was injected into 30-day-old tobacco leaves and cultured in darkness for 48 h. Green represents the YFP fluorescence signal, and red represents the chlorophyll fluorescence signal. The YFP signal location within the cells was then observed using a confocal microscope (Leica TCS SP8).
4.5. Transformation of Plants
The TGA1-F/R primers (Supplementary Table S1) were used to clone the coding domain sequence (CDS) from Medicago truncatula. The TGA1-strep-F/R primer was used to construct the expression vector 35S::MtTGA1. This recombinant plasmid 35S::MtTGA1-strep was transformed into EHA105 A. tumefaciens and subsequently into Arabidopsis thaliana using the Agrobacterium-mediated floral dip method [55]. Two different lines (S11, S9) demonstrating high expression levels were selected for further experiments.
4.6. Hormone Measurement and Microscopy Analysis
Leaves from 25-day-old transgenic and wild-type plants at a similar growth stage were collected. The metabolites were extracted and concentrated, and the endogenous hormones were detected using an enzyme-linked immunoassay (ELISA) [56]. The leaf morphology of transgenic and wild-type plants at 25 days of leaf age was analyzed. The leaves were preserved using a 50% FAA fixative, followed by saffron solid green staining and paraffin sectionalization and analysis. The samples were observed using an optical microscope and images were captured [57]. These processes were conducted at Servicebio Biotechnology Co., Ltd. (Servicebio, Wuhan, China).
4.7. Next-Generation Sequencing and Analysis
RNA-seq technology was used to analyze the 30-day-old transgenic and wild-type groups under identical conditions. Differentially expressed genes (DEGs) were identified using the DESeq R package (version 1.18.0) [58] with parameters set at an adjusted p-value < 0.05 and |log2FC| ≥ 1. Gene ontology (GO) analysis of DEGs between samples was performed using the GOseq R package (version: Release 2.12) [59]. KOBAS software (version: 2.0) was used for the functional analysis of DEGs in the KEGG pathway [60]. To validate RNA-seq data, 8 relevant genes annotated using GO were selected for real-time quantitative PCR (qRT-PCR) using the method described above, setting up three replicates per sample. qRT-PCR used primers as shown in the table below (Supplementary Table S1).
4.8. Yeast Two-Hybrid and BiFC
Primers PGBKT7-TGA1-F/R,PGADT7-SPX1-F/R (Supplementary Table S1) and plasmids MtTGA1-pMD19-T and MtSPX-pMD19-T were used to construct yeast two-hybrid vectors. The recombinant plasmids PGBKT7-TGA1 and PGADT7-SPX1 were transformed into yeast strains Y2H and Y187, respectively, using the Yeastmaker™ Yeast Transformation System (Clontech Laboratories, Mountain View, CA, USA). The two yeast strains were then mixed in an SD solid medium lacking Leu, Trp, His, and Ade, supplemented with 40 μg·mL−1 X-α-gal and 200 ng·mL−1 Aureobasidin A, and cultured at 29.5 °C for 3–5 days. As a control, PGBKT7-TGA1 was paired with yeast strains containing empty PGADT7 vectors.
Bimolecular fluorescence complementation (BiFC) expression vectors were constructed using the N-terminal vector primer TGA1-NE2-F/R and the C-terminal vector primer SPX-CE4-F/R, which contained the YFP protein. These were then separately transformed into the EH105 strain. The strains harboring TGA1-NE2 and SPX-CE4 were combined to form the treatment group, while those carrying NE2 or CE4 empty vectors were mixed with the aforementioned strains to serve as control groups. The treatment group and the control group were injected with 30-day-old tobacco leaves, respectively. After a 2-day incubation in the dark, the YFP fluorescence in the tobacco cells was observed using a LEICA SP-8 confocal microscope.
4.9. Antioxidant Enzyme Activity and Chlorophyll Content
The activity of ascorbate peroxidase (APX) was determined using ascorbic acid colorimetry. A spectrophotometer cuvette (1cm path length) was filled with 50 mM phosphate buffer (PBS, pH 7.0), 30 μL of 50 mM ascorbic acid, 30 μL of 10 mM EDTA, 100 μL of enzyme extract, and 30 μL of 10 mM H2O2. The mixture was stirred, and the optical density (OD) was measured at 290 nm within 1 min at 5 s intervals using pH 7.0 PBS in place of the enzyme solution for reference. Peroxidase (POD) activity was determined using the guaiacol method. A spectrophotometer cuvette (1cm path length) was filled with 1 mL of 50 mM PBS (pH 7.0), 1 mL of 0.3% H2O2, 0.95 mL of 0.2% guaiacol, and 50 μL of enzyme solution. The OD values were measured at 470 nm for 1 min with 5 s intervals. Catalase (CAT) activity was determined using an ultraviolet spectrophotometer. A quartz cuvette was filled with 2.84 mL of 50 mM PBS (pH 7.0), 30 μL of 1.5 M H2O2, and 100 μL of enzyme solution. The OD values were measured at 240 nm within 1 min at 5 s intervals using pH 7.0 PBS as the blank control. Superoxide dismutase (SOD) activity was determined using the nitro blue tetrazolium (NBT) photoreduction method. Each 100 μL of enzyme solution was mixed with 2.97 mL of the reaction solution and 0.03 mL of 130 μmol·L−1 riboflavin solution. The mixture was kept in the dark as a control at 25 °C and exposed to a light intensity of 60 μmol·m−2·s−1 for 20–30 min, and the OD values were measured at 560 nm.
Chlorophyll content was determined using 95% ethanol extraction, and the total chlorophyll content, including Chl a, Chl b, and carotenoid content, were calculated based on absorbance [61].
4.10. Statistical Analysis
Data related to gene expression, peroxidase, chlorophyll content, hormone content, and leaf cell structure were analyzed using SPSS 15.0, Excel 2020, Origin 2022, and CaseViewer 2.4. All data were presented as the mean ± SD (n = 3).
5. Conclusions
In summary, the MtTGA1 transcription factor acts as a salt stress regulator, modulating the adaptation of Arabidopsis thaliana to salinity through a hormonal regulatory network and antioxidant enzyme activity. Additionally, MtTGA1 transcription factors can be induced with SA, ABA, BR, and GA, and genes from multiple stress-related families were identified using next-generation sequencing analysis. Under salt stress conditions, BR and ABA hormones accumulated abundantly, and the activities of APX, POD, CAT, and SOD increased, thereby improving the salt tolerance of plants. This study provides a new understanding of the regulation of plant salt tolerance mechanisms mediated by BR and ABA, offering a molecular theoretical basis for enhancing plant salt tolerance.
Supplementary Materials
The following supporting information can be downloaded at https://www.mdpi.com/article/10.3390/agronomy13082184/s1. Supplementary Figure S1. MtTGA protein molecular weight, theoretical isoelectric point, and protein domain analysis. Supplementary Figure S2. Phylogenetic tree of MtTGA proteins. MtTGA1 has the highest homology to the Trifolium pratense TGA1 protein. Supplementary Figure S3. KEGG pathway of DEGs in transgenic and control plants. (a) DEGs involved in the “Brassinosteroid biosynthesis” pathway. (b) DEGs involved in the “Ascorbate and aldarate metabolism” pathway. (c) DEGs involved in the “Plant hormone signal transduction” pathway. Enzymes marked in red boxes are associated with up-regulating genes, green boxes are associated with down-regulated genes, and the number inside the box represents the number of the enzyme. Supplementary Table S1. List of primers. Supplementary Table S2. Protein sequences of different species. Supplementary Table S3. Statistical analysis of DEGs classification.
Author Contributions
Y.C. (Yuehui Chao), L.H. and S.L. conceived and designed the experiment. S.L. conducted the experiments. D.D., Y.L. and H.X. analyzed the data. M.W. and W.J. contributed analysis tools. Y.C. (Yuehui Chao) provided financial support. S.L. wrote the manuscript. Y.C. (Yuehui Chao), Y.C. (Yinglong Chen) and T.Z. edited and revised the manuscript. All authors have read and agreed to the published version of the manuscript.
Funding
This work was supported by the major demonstration project of “The open competition” for seed Industry science and technology innovation in Inner Mongolia (Grant No.: 2022JBGS00160302).
Institutional Review Board Statement
Not applicable.
Data Availability Statement
The raw assembled data was uploaded to The National Center for Biotechnology Information (NCBI). The accession number is PRJNA978999. The URL is https://www.ncbi.nlm.nih.gov/sra/PRJNA978999 (accessed on 2 June 2023).
Acknowledgments
We appreciated Meiqin Liu of Beijing Forestry University for her assistance.
Conflicts of Interest
The authors declare no conflict of interest.
References
- Türkan, I.; Demiral, T. Recent developments in understanding salinity tolerance. Environ. Exp. Bot. 2009, 67, 2–9. [Google Scholar] [CrossRef]
- Zhao, Q.; Zhang, H.; Wang, T.; Chen, S.; Dai, S. Proteomics-based investigation of salt-responsive mechanisms in plant roots. J. Proteom. 2013, 82, 230–253. [Google Scholar] [CrossRef]
- Zhang, H.; Han, B.; Wang, T.; Chen, S.; Li, H.; Zhang, Y.; Dai, S. Mechanisms of Plant Salt Response: Insights from Proteomics. J. Proteome Res. 2012, 11, 49–67. [Google Scholar] [CrossRef]
- Niu, M.; Xie, J.; Chen, C.; Cao, H.; Sun, J.; Kong, Q.; Shaba, S.; Shabala, L.; Huang, Y.; Bie, Z. An early ABA-induced stomatal closure, Na+ sequestration in leaf vein and K+ retention in mesophyll confer salt tissue tolerance in Cucurbita species. J. Exp. Bot. 2018, 69, 4945–4960. [Google Scholar] [CrossRef] [PubMed]
- Chen, K.; Li, G.; Bressan, R.A.; Song, C.; Zhu, J.; Zhao, Y. Abscisic acid dynamics, signaling, and functions in plants. J. Integr. Plant Biol. 2020, 62, 25–54. [Google Scholar] [CrossRef] [PubMed]
- Min, J.-H.; Chung, J.-S.; Lee, K.-H.; Kim, C.S. The CONSTANS-like 4 transcription factor, AtCOL4, positively regulates abiotic stress tolerance through an abscisic acid-dependent manner in Arabidopsis. J. Integr. Plant Biol. 2015, 57, 313–324. [Google Scholar] [CrossRef]
- Umezawa, T.; Sugiyama, N.; Mizoguchi, M.; Hayashi, S.; Myouga, F.; Yamaguchi-Shinozaki, K.; Ishihamab, Y.; Hirayama, T.; Shinozaki, K. Type 2C protein phosphatases directly regulate abscisic acid-activated protein kinases in Arabidopsis. Proc. Natl. Acad. Sci. USA 2009, 106, 17588–17593. [Google Scholar] [CrossRef]
- Thalmann, M.; Pazmino, D.; Seung, D.; Horrer, D.; Nigro, A.; Meier, T.; Kölling, K.; Pfeifhofer, H.; Zeeman, S.; Santelia, D. Regulation of Leaf Starch Degradation by Abscisic Acid Is Important for Osmotic Stress Tolerance in Plants. Plant Cell 2016, 28, 1860–1878. [Google Scholar] [CrossRef]
- Cai, S.; Chen, G.; Wang, Y.; Huang, Y.; Marchant, D.B.; Wang, Y.; Yang, Q.; Dai, F.; Hills, A.; Franks, P.J.; et al. Evolutionary Conservation of ABA Signaling for Stomatal Closure. Plant Physiol. 2017, 174, 732–747. [Google Scholar] [CrossRef]
- Magome, H.; Yamaguchi, S.; Hanada, A.; Kamiya, Y.; Oda, K. The DDF1 transcriptional activator upregulates expression of a gibberellin-deactivating gene, GA2ox7, under high-salinity stress in Arabidopsis. Plant J. 2008, 56, 613–626. [Google Scholar] [CrossRef]
- Shan, C.; Mei, Z.; Duan, J.; Chen, H.; Feng, H.; Cai, W. OsGA2ox5, a gibberellin metabolism enzyme, is involved in plant growth, the root gravity response and salt stress. PLoS ONE 2014, 9, e87110. [Google Scholar] [CrossRef] [PubMed]
- Zhu, N.; Cheng, S.; Liu, X.; Du, H.; Dai, M.; Zhou, D.-X.; Yang, W.; Zhao, Y. The R2R3-type MYB gene OsMYB91 has a function in coordinating plant growth and salt stress tolerance in rice. Plant Sci. 2015, 236, 146–156. [Google Scholar] [CrossRef]
- Achard, P.; Cheng, H.; Grauwe, L.D.; Decat, J.; Schoutteten, H.; Moritz, T.; Straeten, D.V.D.; Peng, J.; Harberd, N.P. Integration of Plant Responses to Environmentally Activated Phytohormonal Signals. Science 2006, 311, 91–94. [Google Scholar] [CrossRef]
- Ahanger, M.A.; Aziz, U.; Alsahli, A.A.; Alyemeni, M.N.; Ahmad, P. Influence of Exogenous Salicylic Acid and Nitric Oxide on Growth, Photosynthesis, and Ascorbate-Glutathione Cycle in Salt Stressed Vigna angularis. Biomolecules 2019, 10, 42. [Google Scholar] [CrossRef]
- Srinivasan, T.; Kumar, K.R.R.; Meur, G.; Kirti, P.B. Heterologous expression of Arabidopsis NPR1 (AtNPR1) enhances oxidative stress tolerance in transgenic tobacco plants. Biotechnol. Lett. 2009, 31, 1343–1351. [Google Scholar] [CrossRef]
- Zhang, J.-Y.; Qu, S.-C.; Qiao, Y.-S.; Zhang, Z.; Guo, Z.-R. Overexpression of the Malus hupehensis MhNPR1 gene increased tolerance to salt and osmotic stress in transgenic tobacco. Mol. Biol. Rep. 2014, 41, 1553–1561. [Google Scholar] [CrossRef] [PubMed]
- Tanveer, M.; Shahzad, B.; Sharma, A.; Biju, S.; Bhardwaj, R. 24-Epibrassinolide; an active brassinolide and its role in salt stress tolerance in plants: A review. Plant Physiol. Biochem. 2018, 130, 69–79. [Google Scholar] [CrossRef] [PubMed]
- Duan, F.; Ding, J.; Lee, D.; Lu, X.; Feng, Y.; Song, W. Overexpression of SoCYP85A1, a Spinach Cytochrome p450 Gene in Transgenic Tobacco Enhances Root Development and Drought Stress Tolerance. Front. Plant Sci. 2017, 8, 1909. [Google Scholar] [CrossRef]
- Jakoby, M.; Weisshaar, B.; Dröge-Laser, W.; Vicente-Carbajosa, J.; Tiedemann, J.; Kroj, T.; Parcy, F. bZIP transcription factors in Arabidopsis. Trends Plant Sci. 2002, 7, 106–111. [Google Scholar] [CrossRef]
- Xiang, C.; Miao, Z.; Lam, E. DNA-binding properties, genomic organization and expression pattern of TGA6, a new member of the TGA family of bZIP transcription factors in Arabidopsis thaliana. Plant Mol. Biol. 1997, 34, 403–415. [Google Scholar] [CrossRef]
- Kesarwani, M.; Yoo, J.; Dong, X. Genetic Interactions of TGA Transcription Factors in the Regulation of Pathogenesis-Related Genes and Disease Resistance in Arabidopsis. Plant Physiol. 2007, 144, 336–346. [Google Scholar] [CrossRef] [PubMed]
- Gatz, C. From pioneers to team players: TGA transcription factors provide a molecular link between different stress pathways. Mol. Plant-Microbe Interact. 2013, 26, 151–159. [Google Scholar] [CrossRef] [PubMed]
- Jayakannan, M.; Bose, J.; Babourina, O.; Shabala, S.; Massart, A.; Poschenrieder, C.; Rengel, Z. The NPR1-dependent salicylic acid signalling pathway is pivotal for enhanced salt and oxidative stress tolerance in Arabidopsis. J. Exp. Bot. 2015, 66, 1865–1875. [Google Scholar] [CrossRef]
- Zhang, J.-Y.; Qu, S.-C.; Du, X.-L.; Qiao, Y.-S.; Cai, B.-H.; Guo, Z.-R.; Zhang, Z. Overexpression of the Malus hupehensis MhTGA2 Gene, a Novel bZIP Transcription Factor for Increased Tolerance to Salt and Osmotic Stress in Transgenic Tobacco. Int. J. Plant Sci. 2012, 173, 441–453. [Google Scholar] [CrossRef]
- Hao, L.; Zhao, Y.; Jin, D.; Zhang, L.; Bi, X.; Chen, H.; Xu, Q.; Ma, C.; Li, G. Salicylic acid-altering Arabidopsis mutants response to salt stress. Plant Soil. 2012, 354, 81–95. [Google Scholar] [CrossRef]
- Attaran, E.; He, S.Y. The long-sought-after salicylic acid receptors. Mol. Plant 2012, 5, 971–973. [Google Scholar] [CrossRef] [PubMed]
- Fu, Z.Q.; Yan, S.; Saleh, A.; Wang, W.; Ruble, J.; Oka, N.; Mohan, R.; Spoel, S.H.; Tada, Y.; Zheng, N.; et al. NPR3 and NPR4 are receptors for the immune signal salicylic acid in plants. Nature 2012, 486, 228–232. [Google Scholar] [CrossRef] [PubMed]
- Stacey, G.; Libault, M.; Brechenmacher, L.; Wan, J.; May, G.D. Genetics and functional genomics of legume nodulation. Curr. Opin. Plant Biol. 2006, 9, 110–121. [Google Scholar] [CrossRef]
- Das, K.; Roychoudhury, A. Reactive oxygen species (ROS) and response of antioxidants as ROS-scavengers during environmental stress in plants. Front. Environ. Sci. 2014, 2, 53. [Google Scholar] [CrossRef]
- Shearer, H.L.; Cheng, Y.T.; Wang, L.; Liu, J.; Boyle, P.; Després, C.; Zhang, Y.; Li, X.; Fobert, P.R. Arabidopsis Clade I TGA Transcription Factors Regulate Plant Defenses in an NPR1-Independent Fashion. Mol. Plant-Microbe Interact. 2012, 25, 1459–1468. [Google Scholar] [CrossRef]
- Waadt, R.; Seller, C.A.; Hsu, P.-K.; Takahashi, Y.; Munemasa, S.; Schroeder, J.I. Plant hormone regulation of abiotic stress responses. Nat. Rev. Mol. Cell Biol. 2022, 23, 680–694. [Google Scholar] [CrossRef] [PubMed]
- Wang, J.; Qin, H.; Zhou, S.-R.; Wei, P.; Zhang, H.; Zhou, Y.; Miao, Y.; Huang, R. The Ubiquitin-Binding Protein OsDSK2a Mediates Seedling Growth and Salt Responses by Regulating Gibberellin Metabolism in Rice. Plant Cell 2020, 32, 414–428. [Google Scholar] [CrossRef] [PubMed]
- Zeng, H.; Tang, Q.; Hua, X. Arabidopsis Brassinosteroid Mutants det2-1 and bin2-1 Display Altered Salt Tolerance. J. Plant Growth Regul. 2010, 29, 44–52. [Google Scholar] [CrossRef]
- Nemhauser, J.L.; Hong, F.; Chory, J. Different Plant Hormones Regulate Similar Processes through Largely Nonoverlapping Transcriptional Responses. Cell 2006, 126, 467–475. [Google Scholar] [CrossRef]
- Li, Z.-Y.; Xu, Z.-S.; He, G.-Y.; Yang, G.-X.; Chen, M.; Li, L.-C.; Ma, Y.-Z. A mutation in Arabidopsis BSK5 encoding a brassinosteroid-signaling kinase protein affects responses to salinity and abscisic acid. Biochem. Biophys. Res. Commun. 2012, 426, 522–527. [Google Scholar] [CrossRef]
- Tang, W.; Kim, T.-W.; Oses-Prieto, J.A.; Sun, Y.; Deng, Z.; Zhu, S.; Wang, R.; Burlingame, A.L.; Wang, Z.-Y. BSKs Mediate Signal Transduction from the Receptor Kinase BRI1 inArabidopsis. Science 2008, 321, 557–560. [Google Scholar] [CrossRef]
- Planas-Riverola, A.; Gupta, A.; Betegón-Putze, I.; Bosch, N.; Ibañes, M.; Caño-Delgado, A.I. Brassinosteroid signaling in plant development and adaptation to stress. Development 2019, 146, dev151894. [Google Scholar] [CrossRef]
- Lv, B.; Tian, H.; Zhang, F.; Liu, J.; Lu, S.; Bai, M.; Li, C.; Ding, Z. Brassinosteroids regulate root growth by controlling reactive oxygen species homeostasis and dual effect on ethylene synthesis in Arabidopsis. PLoS Genet. 2018, 14, e1007144. [Google Scholar] [CrossRef]
- Mittler, R. Oxidative stress, antioxidants and stress tolerance. Trends Plant Sci. 2002, 7, 405–410. [Google Scholar] [CrossRef]
- Gill, S.S.; Tuteja, N. Reactive oxygen species and antioxidant machinery in abiotic stress tolerance in crop plants. Plant Physiol. Biochem. 2010, 48, 909–930. [Google Scholar] [CrossRef]
- Vranová, E.; Inzé, D.; Van Breusegem, F. Signal transduction during oxidative stress. J. Exp. Bot. 2002, 53, 1227–1236. [Google Scholar] [CrossRef] [PubMed]
- Zhang, S.; Cai, Z.; Wang, X. The primary signaling outputs of brassinosteroids are regulated by abscisic acid signaling. Proc. Natl. Acad. Sci. USA 2009, 106, 4543–4548. [Google Scholar] [CrossRef] [PubMed]
- Zhu, T.; Deng, X.-G.; Tan, W.-R.; Zhou, X.; Luo, S.-S.; Han, X.-Y.; Zhang, D.-W.; Lin, H.-H. Nitric oxide is involved in brassinosteroid-induced alternative respiratory pathway in Nicotiana benthamiana seedlings’ response to salt stress. Physiol. Plant 2016, 156, 150–163. [Google Scholar] [CrossRef] [PubMed]
- Tester, M.; Davenport, R. Na+ Tolerance and Na+ Transport in Higher Plants. Ann. Bot. 2003, 91, 503–527. [Google Scholar] [CrossRef]
- Munns, R.; Tester, M. Mechanisms of salinity tolerance. Annu. Rev. Plant Biol. 2008, 59, 651–681. [Google Scholar] [CrossRef]
- Munns, R. Comparative physiology of salt and water stress. Plant Cell Environ. 2002, 25, 239–250. [Google Scholar] [CrossRef]
- Hu, B.; Jiang, Z.; Wang, W.; Qiu, Y.; Zhang, Z.; Liu, Y.; Li1, A.; Gao, X.; Liu, L.; Qian, Y.; et al. Nitrate–NRT1.1B–SPX4 cascade integrates nitrogen and phosphorus signalling networks in plants. Nat. Plants 2019, 5, 401–413. [Google Scholar] [CrossRef]
- Jung, J.-Y.; Ried, M.K.; Hothorn, M.; Poirier, Y. Control of plant phosphate homeostasis by inositol pyrophosphates and the SPX domain. Curr. Opin. Biotechnol. 2018, 49, 156–162. [Google Scholar] [CrossRef]
- Alvarez, J.M.; Riveras, E.; Vidal, E.A.; Gras, D.E.; Contreras-López, O.; Tamayo, K.P.; Aceitun, F.; Gomez, I.; Ruffel, S.; Lejay, L.; et al. X Systems approach identifies TGA1 and TGA4 transcription factors as important regulatory components of the nitrate response of Arabidopsis thaliana roots. Plant J. 2014, 80, 1–13. [Google Scholar] [CrossRef]
- Bailey, T.L.; Elkan, C. Fitting a mixture model by expectation maximization to discover motifs in biopolymers. Proc. Int. Conf. Intell. Syst. Mol. Biol. 1994, 2, 28. [Google Scholar]
- Lescot, M.; Déhais, P.; Thijs, G.; Marchal, K.; Moreau, Y.; Peer, Y.V.; Rouzé, P.; Rombauts, S. PlantCARE, a database of plant cis-acting regulatory elements and a portal to tools for in silico analysis of promoter sequences. Nucleic Acids Res. 2002, 30, 325–327. [Google Scholar] [CrossRef] [PubMed]
- Kumar, S.; Stecher, G.; Li, M.; Knyaz, C.; Tamura, K. MEGA X: Molecular Evolutionary Genetics Analysis across Computing Platforms. Mol. Biol. Evol. 2018, 35, 1547–1549. [Google Scholar] [CrossRef] [PubMed]
- Chen, C.; Chen, H.; Zhang, Y.; Thomas, H.R.; Frank, M.H.; He, Y.; Xia, R. TBtools: An Integrative Toolkit Developed for Interactive Analyses of Big Biological Data. Mol. Plant 2020, 13, 1194–1202. [Google Scholar] [CrossRef] [PubMed]
- Schmittgen, T.D.; Livak, K.J. Analyzing real-time PCR data by the comparative CT method. Nat. Protoc. 2008, 3, 1101–1108. [Google Scholar] [CrossRef]
- Guo, L.; Li, C.; Jiang, Y.; Luo, K.; Xu, C. Heterologous Expression of Poplar WRKY18/35 Paralogs in Arabidopsis Reveals Their Antagonistic Regulation on Pathogen Resistance and Abiotic Stress Tolerance via Variable Hormonal Pathways. Int. J. Mol. Sci. 2020, 21, 5440. [Google Scholar] [CrossRef]
- Engvall, E.; Perlmann, P. Enzyme-linked immunosorbent assay (ELISA) quantitative assay of immunoglobulin G. Immunochemistry 1971, 8, 871. [Google Scholar] [CrossRef]
- Wang, G.-L.; Xiong, F.; Que, F.; Xu, Z.-S.; Wang, F.; Xiong, A.-S. Morphological characteristics, anatomical structure, and gene expression: Novel insights into gibberellin biosynthesis and perception during carrot growth and development. Hortic. Res. 2015, 2, 15028. [Google Scholar] [CrossRef]
- Robinson, M.D.; McCarthy, D.J.; Smyth, G.K. edgeR: A Bioconductor package for differential expression analysis of digital gene expression data. Bioinformatics 2010, 26, 139–140. [Google Scholar] [CrossRef]
- Young, M.D.; Wakefield, M.J.; Smyth, G.K.; Oshlack, A. Gene ontology analysis for RNA-seq: Accounting for selection bias. Genome Biol. 2010, 11, R14. [Google Scholar] [CrossRef]
- Mao, X.; Cai, C.; Olyarchuk, J.G.; Wei, L. Automated genome annotation and pathway identification using the KEGG Orthology (KO) as a controlled vocabulary. Bioinformatics 2005, 21, 3787–3793. [Google Scholar] [CrossRef]
- Teng, K.; Tan, P.; Guan, J.; Dong, D.; Liu, L.; Guo, Y.; Guo, W.; Yuesen, Y.; Fan, X.; Wu, J. Functional characterization of the chlorophyll b reductase gene NYC1 associated with chlorophyll degradation and photosynthesis in Zoysia japonica. Environ. Exp. Bot. 2021, 191, 104607. [Google Scholar] [CrossRef]
Disclaimer/Publisher’s Note: The statements, opinions and data contained in all publications are solely those of the individual author(s) and contributor(s) and not of MDPI and/or the editor(s). MDPI and/or the editor(s) disclaim responsibility for any injury to people or property resulting from any ideas, methods, instructions or products referred to in the content. |
© 2023 by the authors. Licensee MDPI, Basel, Switzerland. This article is an open access article distributed under the terms and conditions of the Creative Commons Attribution (CC BY) license (https://creativecommons.org/licenses/by/4.0/).