Abstract
Rice production has faced numerous challenges in recent years, and traditional methods are still being used to detect rice diseases. This research project developed an automated rice blast disease diagnosis technique based on deep learning, image processing, and transfer learning with pre-trained models such as Inception V3, VGG16, VGG19, and ResNet50. The public dataset consists of 2000 images; about 1200 images belong to the leaf blast class, and 800 to the healthy leaf class. The modified connection-skipping ResNet 50 had the highest accuracy of 99.75% with a loss rate of 0.33, while the other models achieved 98.16%, 98.47%, and 98.56%, respectively. Furthermore, ResNet 50 achieved a validation accuracy of 99.69%, precision of 99.50%, F1-score of 99.70, and AUC of 99.83%. In conclusion, the study demonstrated a superior performance and disease prediction using the Gradio web application.
1. Introduction
Rice is a highly produced, nutritious food that is a significant element of the world’s diet. Rice is still the essential food and grain for people and is grown more than any other prominent grain these days [1]. The rice kernel contains iron, copper, zinc, and other nutrients, making it healthy. Rice has several varieties: brown, red, black, and basmati rice [2]. The rice kernel is beneficial since it contains iron, copper, zinc, and other nutrients. Rice was grown on 164.19 million hectares worldwide in 2020, and its global trade expanded faster than any other crop [3]. In the crop years 2019 to 2020, total global rice production was 497.7 million metric tons. China, Thailand, Bangladesh, Pakistan, Brazil, and Indonesia produced 52.9% of worldwide production and used 480 million metric tons [4]. Rice is considered in Pakistan the “Money Crop”, accounting for 3.1 percent of agriculture and 0.6 percent of Pakistan’s GDP [5]. The Economic Survey of Pakistan (FY-2020) states that Pakistan is now the largest exporter of rice in the world. Its outstanding success in the agriculture industry has generated significant income in the billions of dollars [6].
Pakistan is currently dealing with increasing water constraints and viral crop diseases, which are causing massive losses in rice quantity and quality [7]. Rice is now suffering from various diseases, divided into two categories: bacterial and fungal infections. Without recommended care, protection, and the use of appropriate pesticides, these diseases can be more dangerous for plant survival [8]. Rice leaf blast disease can decrease rice yield worldwide [9]. Because of its extensive distribution and capacity to persist in various environmental situations, it has become a dominant, dangerous disease in Pakistan. The rice leaf blast is caused by Magnaporthe grisea [10]. It ranks among the most destructive diseases in rice fields. It accounts for 10–30% of yearly yield losses [11]. Under favorable circumstances, it can worsen and devastate the whole rice yield in 15 to 20 days and up to 100% of the crop loss [12].
Farmers are practicing a traditional method for identifying diseases in rice plants by observing the plant condition with the naked eye. The disease’s early symptoms may appear discreetly, making them difficult for the human eye to spot. These symptoms could appear as slight discoloration, tiny lesions, or changes in the texture of the leaves [11]. The later symptoms, in contrast, show increased intensity and conspicuity, noticeable even to inexperienced perception. Early assessment and treatment can stop the spread of the disease and prevent significant harm. However, the deep learning model will be trained on the dataset, which has early symptoms. This will allow the early prediction of rice leaf blast disease.
Therefore, this study introduced the connection-skipping ResNet module by joining the pre-trained Dense layer [13] on ImageNet [14] to overcome the degradation problem of unique image features in deep neural networks, which can increase the disease detection accuracy and decrease the computational complexity. However, the study provides a deep learning-based ResNet 50 model to detect the early stages of rice leaf blast disease to decrease rice productivity loss. Second, we collected the dataset from Kaggle which can be shown in Figure 1, which can be accessed at https://www.kaggle.com/datasets/shareef0612/riceleaf-dataset, accessed on 12 March 2023. Third, we propose the ResNet 50 model. The model evaluation results showed the highest accuracy of 99.75%. Since we used the Gradio web user interface for the prediction, shown in Figure 6, it can generate a public link that can be accessed from anywhere. Fourth, we used Google Colab for this deployment. The remaining sections present the elaborated methodology to attain the rice blast disease detection chore along with the proposed architecture and discussion. Finally, the conclusion and references are given in the last section.
2. Related Work
Food is the most vital component of a healthier life. Rice insecurity now influences the quality and availability of rice in Pakistan. Rice disease detection using machine learning algorithms is a novel example of advancement [15]. The automated diagnosis system is now based on CNN, which is considered one of the best modules [16]. Traditional disease identification methods are time consuming and require expertise, such as the extraction of the size, color, texture, or vein for the disease area. Deep learning is now being used to improve the detection accuracy. Rapid advancement allows researchers to adopt transfer learning as part of deep learning terminology.
In article [17], simple and successful deep learning models, especially variations of You Only Look Once (YOLO), are suggested. The module is trained using transfer learning on a dataset of 100 photos of oil palm fruit and 400 photographs representing various fruits in the RGB format. The algorithms’ effectiveness and accuracy in automatically annotating photos comprising 3500 fruits are explored. The findings show that the suggested approach would proficiently and accurately annotate many photos. The mean Average Precision (mAP) for oil palm fruit categorization is 98.7%, while 99.5% for various fruits. These findings illustrate the annotation technique’s effectiveness in categorizing and annotating photos of the oil palm fruit.
In research study [18], deep learning models, notably CNN, are used in the horticulture sector for fruit categorization. Traditional methods need substantial human feature engineering, but CNN can automatically extract features from pictures for classification. The researchers used 26,149 photos of 40 distinct types of fruits to create an automated fruit categorization system. The study used five layered pre-trained models and updated the MobileNetV2 model’s classification layer, resulting in an improved version known as TL-MobileNetV2. The previously trained model was leveraged via transfer learning. TL-MobileNetV2 achieved an outstanding 99% accuracy, outperforming MobileNetV2 by 3%. The TL-MobileNetV2’s identical error rate was under 1%.
The Human Protein Atlas (HPA) project offers an extensive database online of tagged bio-images that may be used to predict protein localization. However, most existing systems only enable single-label classification. Still, the HPA database requires a multi-label classification system. Researchers [19] propose improving the current CNN and pre-trained models by utilizing deep learning and ensemble approaches. They created a stacked ensemble-based deep learning model that improves the classifier’s consistency and robustness. The suggested model’s efficiency was assessed using the F1-score, accuracy, and recall measures. When the researchers compared their methodology to existing deep learning algorithms, they discovered that their ensemble strategy considerably outperformed them in the multi-label categorization of Human Protein Atlas photos. The results demonstrated a recall of 0.70, Precision of 0.72, and F1-score of 0.71.
Authors [20] used a convolutional neural network trained on 2906 healthy images and 2902 disease images. The researchers conducted a comparison study of composed algorithms and other traditional algorithms. However, the proposed model results showed the highest accuracy level of feature extraction rather than crafted features like the texture or binary. Besides SVM, CNN achieved 95% accuracy in detecting rice diseases. A well-performing and accurate detection of rice diseases could be beneficial for farmers to overcome the financial decrease and the adoption of early precautions.
The recent advancement in the CNN-based model has significantly improved its image base classification accuracy. The deep learning model was constructed in [8] to analyze images of plants to find diseases and pests that affect rice. The best scale architecture models, such as VGG16 and Inception V3, were used and fine-tuned to identify rice diseases. After all, the models were evaluated on a large-scale dataset. The CNN models were broken down into two stages of architecture for mobile identification using MobileNeta and SqueezeNet. The experiments showed the proposed model significantly scored an accuracy of 93.3% with reducing over-fitting and fewer generalization problems.
Nowadays, machine vision approaches help enhance the agricultural sector’s productivity. Using deep learning to predict rice diseases depends on the best features of plant images. Researchers [21] used texture features to integrate automated CNN on rice varieties. They collected digital imaging datasets to train the deep learning model to predict rice disease [22]. Authors have selected histogram, texture, and binary [23] features and created a fusion to train machine learning models like Meta begging and tree J48. One of the models attained 97.4% accuracy. Over the principles of biotic factors, rice grains are affected by soil fertility, bacteria, and diseases. Such diseases are prevalent and hard to identify [24]. The CNN model was proposed in [25] to be trained on 6330 images and the YOLO v3 classifier for object detection on rice plant images.
The experiments showed that YOLOv3 provided the best Precision at 79.19% in detecting rice leaf diseases. The overall results were 75.92% for Mask-R CNN, 70.96% for Faster R-CNN, and 36.11% for Retina-Net. Selecting features from an image is an important factor in machine learning classification. The algorithms are dependent on features. In this way, using convolutional neural networks shows the high quality of data for identifying rice plant diseases. Authors [26] introduced the deep features for rice leaf disease identification on 5932 images of rice diseases, including rice leaf blasts.
The simulation of different transfer learning models was applied to obtain better results. The performance was measured by combining CNN with SVM by learning counterparts. In transfer learning models such as VGG16 and 19 and SVM, the F1-score was 0.98 percent. The dynamic segmentation base algorithm, including minimum and maximum distance, was applied to classify rice diseases [27]. Firstly, the proposed method was used to address the different types of rice diseases by removing extra noise, image blurring, and a soothing background of images for higher accuracy. Multilevel interference was used with K-means clustering for optimizing the local prediction [28]. The model combined CNN layers with R-CNN for the target frame and detected the rice diseases with an accuracy of 96%. The method indicates that using deep learning schema increases the possibilities of farmers, especially for detecting rice leaf blasts. Rice is one of the most stable crops for any agricultural economy [29].
Rice diseases become problematic by affecting crop production and the economy. Nowadays, plants are being affected by diseases like leaf blasts, bacterial blight, and brown spots. Detecting such rice diseases using deep CNN, combined with the naive Bayes algorithm, generates an economic advancement [30]. Authors [31] constructed an image processing-based machine learning algorithm that allows the detection of diseases based on color, texture, and outlining [32].
The CNN model selected those features and combined them with the naive Bayes algorithm for classifying rice diseases and had an accuracy of 95%. Proper management and detection are required to control rice diseases and pests [33]. Rice diseases cause a 30 percent average loss annually [11]. Authors [33] annotated each image’s sick portion by introducing the solution by contributing to ICT. Unlike previous algorithms, a localized categorization for each picture segment used Mask RCNN to locate and measure sick plant areas in different districts of Pakistan [34]. This technique estimated agricultural damage, achieving 87.6% accuracy on the provided dataset against 58.4% without localized information. Authors [35] employed a Support Vector Machine (SVM) image processing strategy to investigate and categorize three rice crop illnesses. This process had two stages: training and symptom prediction [36]. Leaf diseases were detected with a trained classifier in this method.
The suggested study optimized the parameters (gamma, nu) of SVM. The model showed 94.16% Overall Accuracy. The researchers adopted a convolutional neural network algorithm by importing Inception and ResNet architecture. They analyzed the image classification and segmentation using the datagen library and optimized the models for detecting rice diseases, including rice leaf blasts. The approach was optimized for the classification of diseases with an accuracy of 95%, respectively. However, for this study, we utilized CNN-based models on the public rice disease dataset, and those convolutional models provided sufficient results regarding speed and accuracy.
3. Materials and Methods
3.1. Dataset and Environment Setup
A vast collection of approximately 2000 images was initially obtained from an online machine learning dataset repository called Kaggle [37]. These images encompassed rice leaf blast and healthy leaves’ class, originating from diverse sources such as field surveys, experimental setups from India, and various imaging techniques that employed red, green, and blue (RGB) colors. A preprocessing step was executed to resize all the images to streamline the data. The preprocessing involved a downscale procedure by specifying the desired dimensions at the input layer. Additionally, certain images were manually enhanced by augmenting their brightness. Example images from the dataset are shown in Figure 1.
Originally, the images were of size 256 × 256 pixels, but they were subsequently downscaled to a pixel dimension of 224 × 224. These modified images were stored on a cloud server in separate train and validation folders. Subsequently, the collected images were meticulously divided into different datasets for specific purposes. The training dataset was utilized to nourish the models, while the validation dataset assessed and validated various parameters during model training. The testing dataset, on the other hand, was employed to predict occurrences of leaf blast disease. The dataset was divided for training and testing using a 70% to 30% ratio, respectively, incorporating both leaf blast disease and healthy class samples. A detailed breakdown of this division is found in Table 1. Moreover, using a Tensorflow preprocessing function, the images were resized to accommodate the models’ input requirements, and as per the formed dataset, we artificially generated a new training dataset using a data augmentation technique; for instance, image rotation, shear range, and zoom range were implemented on the training dataset, and the trained model was deployed using Gradio web service for the prediction of rice leaf blast disease, depicted in Figure 6.

Table 1.
Details of the image dataset as per classes [37].
3.2. Deep Learning Methodology
ResNet 50 represents the first concept of connection skipping to overcome the degradation problem of unique image features in deep neural networks. However, the connection-skipping design helps remove the vanishing gradients in an image. Inceptions V3, VGG 16, VGG 19, custom CNN, and KNN lack effective propagation of gradient problems. Considering the early detection of rice leaf blasts is a crucial task in image classification, ResNet has performed very well in differentiating affected and healthy image patterns. ResNet is a standard neural network that serves as the base for many machine vision applications, allowing easier learning throughout the network.
The suggested model, ResNet 50, presented a convolution with 64 kernels, each with a stride of value 2, to illustrate the connection-skipping approach. A MaxPolling with two strides was produced with a kernel size of 7 × 7 in the first convolutional layer. Three layers comprised the previous convolution: a 1 × 1, 64 kernels; a 3 × 3, 64 kernels; and a 1 × 1, 256 kernels. Nine layers were available and duplicated three times. Figure 3 shows the kernel size of 1 × 1, 128, as well as the kernel size of 3 × 3, 128 and the kernel size of 1 × 1, 512. We conducted this process four times to make 12 layers. The first kernel was 1 × 1, 256, while the following two were 3 × 3, 256, and the size was 1 × 1, 1024. Finally, the process was repeated six times to generate 18 convolutional layers.
We froze the top input layer of each module by defining it as none trainable and adding batch normalization and a ReLU layer of 512 neurons, which ensured enhanced gradients with better norms. Considering a fully connected layer with Softmax function initialized on training classes on the modified residual network, the first part of the proposed methodology used pre-trained module as expressed in Equation (1).
Each layer in a CNN conducts different calculations or transformations on the input data, extracting different features at different levels of abstraction. Equation (1) emphasizes that a layer’s output (Xl) is dependent on its features (Hl) gathered from previous layers. Xl denotes the output or activation of a given layer within the CNN. Where Hl, conversely, comprises features taken from the same layer. These features are formed from the input features x0, x1, …, x(l−1) that correlate to the transmitted image features collected from the previous layers (0 to (l−1). In the simplest terms, Equation (1) states that the output Xl of a particular CNN layer is calculated by performing a function indicated by Hl on the previous layers’ input features x0, x1, …, x(l−1).
Initially, the network was loaded with ImageNet weights and augmented labeled images according to the class category, which provided a better performance in the detection of images.
Secondly, convolutional blocks of 1 × 1 shown as (convo 1 × 1) were used to extract the features and store them in a NumPy array to solve a new prediction problem. Additionally, we froze the existing weights of the input layer and fully connected layer concatenated with convo 1 × 1 and identical block, shown in Figure 3.
Finally, the model was modified by adding average polling to make the image smoother and a fully connected layer with 2048 neurons, allowing the entire network layer to be trained on the new proposed dataset. Figure 2 depicts the overall process of image disease prediction, and Figure 3 illustrates the proposed structure of the network.
In addition, a Tensorflow binary cross-entropy function was implemented to calculate the loss rate, allowing the picking of correct high and low probability digits calculated in Equation (2).
The symbol “−1” denotes a constant value. The letter “N” represents the total number of observations or data points in the dataset. The sign ∑ represents summation, suggesting that the following expression should be summed across a range of values. The expressions “i = 1” and “N” indicate the sum of the individual observations from 1 to N. The “log” function is used on the expression “Model [yi Cyi],” which gives the model’s estimated probability for the appropriate category given the observation “i”. The notation “yi C” denotes that the actual category of observation “i” is one of the alternative categories represented by “C”. Then, using the Equation, we had to perform a logarithm operation to evaluate the probability of sums and observations [23]. Finally, the loss was evaluated by dividing the probability results by N.
Additionally, in Equation (3), “y” denotes the output, while “x” denotes the input as an image in the CNN model. The expression “F(x, Wi)” denotes a function that operates on “x” along with a set of weights indicated by “Wi”. It is important to note that the symbol “σ” also represents the activation function employed with these weights.

Figure 1.
Sample images of rice leaf diseases and healthy leaves.
Figure 1.
Sample images of rice leaf diseases and healthy leaves.


Figure 2.
The overall process of rice leaf blast detection.
Figure 2.
The overall process of rice leaf blast detection.

Each layer extracted features from an image by accepting the binary matrix from the previous layer as input. After all, a 1 × 1 kernel with 512 neurons and a 1 × 1 layer with 2048 neurons were repeated, giving us more than nine feature map layers, shown in Figure 3. At last, we performed an average pool to sharpen the output image, and a fully connected layer with two nodes ended up providing us with one layer using a Softmax function. In the rice leaf blast disease detection process, we employed different machine vision and deep learning models using cross-validation techniques to analyze the effectiveness of the ResNet 50 model. Figure 2 represents the overall identification process of rice leaf blast disease.

Figure 3.
Proposed ResNet 50 architecture.
Figure 3.
Proposed ResNet 50 architecture.

4. Results and Discussion
This study analyzed rice leaf blast disease using various MV classifiers, including ResNet connection skipping, Inception V3, VGG 16, VGG 19, CNN, and an ensemble module KNN. The evaluation was performed on an updated rice dataset, as presented in Table 4. For the training and testing stages, we utilized Python version 3.7 and employed the Tensorflow preprocess function on Google Colab. The training process benefited from a Tesla T4 GPU allocated by Collab, while the model utilized an Intel(R) Xeon(R) CPU with 12 GB of memory. Table 2 shows hyperparameter used to train the model. Figure 3 illustrates the architecture of the ResNet 50 model, divided into six parts from the input to the output layer. Based on the parameter values described in Table 3, it was observed that the ResNet network with connection skipping outperformed the other networks in identifying rice leaf blast disease. We employed Python’s built-in augmentation process to enhance the original training imaging data. Figure 4 showcases examples of augmented rice leaf blast images. The augmentation process involved rescaling, shear range adjustment, and zoom range modification, controlled with specific parameter values.
Table 2.
Hyper-parameter values in our experiment.
Table 2.
Hyper-parameter values in our experiment.
| Parameter | Values |
|---|---|
| Input layer | 1 |
| Optimizer | adam |
| Validation threshold | 20 |
| Epochs | 50 |
| Neurons | 512 |

Figure 4.
Examples of augmented rice leaf blast images.
Figure 4.
Examples of augmented rice leaf blast images.

These values were distributed among rescaling to 1/0.256, shear range to 0.3, and zoom range to 0.2 for an input image. In this scenario, we retained specific numbers of sample images to monitor the model’s effectiveness, as shown in Figure 4.
Table 3.
Performance of models along evaluation metrics.
Table 3.
Performance of models along evaluation metrics.
| Model |
OA Accuracy, % | Validation Accuracy, % | F1-Score, % | AUC, % | Precision, % |
|---|---|---|---|---|---|
| Inception V3 | 97.59 | 93.77 | 97.61 | 98.44 | 97.30 |
| VGG 16 | 97.45 | 97.91 | 97 | 98.01 | 97.66 |
| VGG 19 | 96.49 | 75.76 | 94.17 | 98.91 | 96.30 |
| CNN | 89.62 | 79.75 | 89.62 | 90.01 | 89 |
| Ensemble module | K-value | ||||
| KNN | 81 | 77 | 81 | 10 | |
| Proposed Module | 99.75 | 99.69 | 99.70 | 99.83 | 99.50 |
Table 4 summarizes the overall performance of the applied modules on the public rice dataset. The metrics evaluated include Overall Accuracy (OA), Validation Accuracy, F1-score, Area Under the Curve (AUC), and Precision. Among the models tested, Inception V3 achieved an OA of 97.59%, a Validation Accuracy of 93.77%, an F1-score of 97.61%, an AUC of 98.44%, and a Precision of 97.30%. VGG 16 obtained an OA of 97.45%, a Validation Accuracy of 97.91%, an F1-score of 97%, an AUC of 98.01%, and a Precision of 97.66%. VGG 19 exhibited an OA of 96.49%, a Validation Accuracy of 75.76%, an F1-score of 94.17%, an AUC of 98.91%, and a Precision of 96.30%. The CNN model achieved an OA of 89.62%, a Validation Accuracy of 79.75%, an F1-score of 89.62%, an AUC of 90.01%, and a Precision of 89%. The KNN model, part of the ensemble module, attained an OA of 81%, a Validation Accuracy of 77%, an F1-score of 81%, and a K-value of 10. The ResNet model demonstrated phenomenal performance, achieving an astounding Overall Accuracy of 99.75%, Validation Accuracy of 99.16%, F1-score of 99.70%, AUC of 99.83%, and Precision of 99.50%. These impressive metrics solidify the module as the highest performer across all evaluated measures, emphasizing its exceptional ability to accurately identify rice leaf blast disease on a public dataset. Figure 5 illustrates the accuracy and loss curves of the ResNet module on 50 epochs.
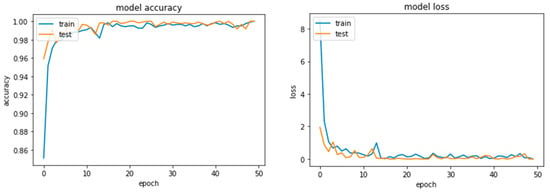
Figure 5.
(Left) Accuracy curve and (Right) loss curve.
The evaluation indicators were used to evaluate various aspects of the model: the accuracy, Precision, recall, and F1-score, along with True Positives (TP), True Negatives (TN), False Positives (FP), and False Negatives (FN), enabling us to measure predictability, Precision, and reliability. The comprehensive computation for the OA metric—Equation (4)—encompasses all contributory factors. The equation provides the OA of the model by dividing TP + FP + TN + FN on TP + TN.
OA = TP + TN/TP + FP +TN + FN
Discussion
Utilizing sophisticated tools such as deep learning, image processing, and transfer learning with pre-trained models led us to a remarkable breakthrough in diagnosing rice blast disease. Our dynamic approach is proving effective at detecting and predicting different forms of rice diseases while showcasing promising outcomes. One significant contribution of this study is the introduction of the connection-skipping ResNet module, which effectively addresses the degradation problem in deep neural networks. Combining a pre-trained Dense layer on ImageNet, the modified connection-skipping ResNet 50 achieved an outstanding accuracy of 99.75% in identifying rice blast disease.
Similarly, other models like Inception V3, VGG16, and VGG19 also demonstrated high accuracies of 98.16%, 98.47%, and 98.56%, respectively. Deep learning models, specifically convolutional neural networks (CNN), have revolutionized disease detection in agriculture. Unlike traditional methods that are time-consuming and require specialized knowledge for feature extraction, deep learning models can automatically extract relevant features from images, resulting in improved detection accuracy.
Transfer learning has played a vital role in this study, where pre-trained models such as VGG16, VGG19, Inception V3, and ResNet50 were utilized as a foundation for training the rice disease detection models. This approach leverages the extensive knowledge gained from large datasets in general image recognition tasks and applies it to rice disease detection. The algorithms used transfer learning to accomplish high precision while using minimal training data and processing resources. Additionally, a web application strategy for disease prognosis utilizing the ResNet 50 model was used to detect the disease.
As illustrated in Figure 6, Gradio, an open-source Python library, was used for implementing the model and forecasting the class. The input as an image and the output as the text were adjusted. The intuitive user interface of web apps makes it simple for farmers and agricultural experts to access and use disease prediction algorithms. This strategy has the potential to substantially boost the speed and effectiveness of decision making in controlling diseases and preventive plans. A large dataset is necessary for both training and assessing the models. We gathered a dataset of over 2000 images of rice leaves for this research, comprising both healthy and harmful samples.
These images were sourced from a reputable online machine learning dataset repository. The dataset was divided into training and testing sets, with 70% of the data used for training the models and 30% for evaluating their performance. The results obtained from this study demonstrate the effectiveness of deep learning models, particularly the modified connection-skipping ResNet 50, in detecting and predicting rice blast disease. The remarkable accuracy achieved by these models highlights their potential for real-world applications in disease management and prevention. Integrating transfer learning and web application approaches further enhances the usability and accessibility of these models.

Figure 6.
Predicted categories using Gradio web server.
Figure 6.
Predicted categories using Gradio web server.

The proposed model was compared with the other approaches from the literature to generate the quantitative and qualitative analysis. Table 4 indicates how well the proposed method performed on the rice leaf blast disease dataset. However, state-of-the-art models such as the Meta and Tress classifier, Faster R-CNN, and YOLO contracted on the latest architectures. Therefore, it can be concluded that the model has a higher predictive accuracy, as shown in Figure 6, on the rice leaf blast disease public dataset.
Table 4.
Comparison of the TL-MobileNetV2 model with approaches.
Table 4.
Comparison of the TL-MobileNetV2 model with approaches.
| Reference | Dataset | Predictive Classes | Methodology | Accuracy |
|---|---|---|---|---|
| [19] | Oil palm, fruit | 4 | Deep Learning | 95.5% |
| [21] | Rice | 6 | Meta-Based/Tree-Based Classifier | 97.3% |
| [25] | Rice plant disease | 10 | Deep Transfer Learning | 97.6% |
| [29] | Rice disease | 3 | Faster R-CNN | 98.26% |
| Connection-Skipping ResNet 50 | Public rice disease | 1 | ResNet 50 | 99.75% |
5. Conclusions
This groundbreaking research introduces an innovative method for the automated detection and diagnosis of rice blast disease. Leveraging the power of deep learning, image processing, and transfer learning, our approach pioneers a transformative solution. Our model, a modified connection-skipping ResNet 50, achieved an astounding accuracy of 99.75% when tested on a publicly accessible dataset. To further support farmers, we developed a user-friendly web application based on Gradio UI that expedites the diagnosis of rice blast disease with utmost ease and efficiency.
This paradigm shift can completely alter how rice blast disease is diagnosed and treated. Our trained module has benefits over conventional approaches for diagnosing rice blast disease. Firstly, it is far more accurate than traditional methods, such as eye inspection, frequently resulting in subjectivity and an incorrect diagnosis. Contrarily, our method guarantees neutrality and offers conclusive diagnoses. Secondly, our method significantly reduces the time required for a diagnosis. While traditional approaches may take hours or even days, our solution delivers diagnoses in seconds.
Experts can only use traditional procedures; however, everyone, including farmers, may easily use our system. Our strategy opens the path for a more affluent future by reducing the effects of rice blast disease, a dangerous threat that causes significant crop losses. Farmers can quickly, accurately, and affordably diagnose rice blast disease, which helps to quickly and effectively reduce losses. We will continue improving our approach’s accuracy in the future while strongly decreasing the computing complexity using compatible resources. We are also creating a smartphone app enabling farmers to use our approach in the field. We expect our proposed strategy will significantly impact the fight against rice blast disease.
Limitations
However, it is critical to recognize several constraints imposed by our existing strategy. It is difficult and time-consuming to gather many tagged photos for training the model. Our solution is less practical in environments with low resources due to its computing needs. Our method still requires human expert verification to confirm the model’s conclusions despite its impressive performance. However, we are certain that these obstacles can be overcome shortly. Simultaneously, advancements in deep learning algorithms will enhance their efficiency, enabling them to run on less powerful devices. Furthermore, with continuous advancements in result interpretation, our models will evolve toward increased autonomy.
Author Contributions
Conceptualization, M.I.S.; Methodology, S.R.S. and S.Q.; Validation, H.B. and S.M.W.S.; Formal analysis, F.M.; Investigation, M.I.S. and F.M. All authors have read and agreed to the published version of the manuscript.
Funding
The contribution by Francesco Marinello to this study was carried out within the Agritech National Research Centre and received funding from the European Union Next-GenerationEU (PIANO NAZIONALE DI RIPRESA E RESILIENZA (PNRR)—MISSIONE 4 COMPONENTE 2, INVESTIMENTO 1.4—D.D. 1032 17/06/2022, CN00000022). This manuscript reflects only the authors’ views and opinions, neither the European Union nor the European Commission can be considered responsible for them.
Data Availability Statement
The data presented in this research study is openly available in [37].
Conflicts of Interest
The authors declare no conflict of interest.
References
- Siddiqui, S.U.; Kumamaru, T.; Satoh, H. Pakistan rice genetic resources-I: Grain morphological diversity and its distribution. Pak. J. Bot. 2007, 39, 841–848. [Google Scholar]
- Rehman, H.-U.; Aziz, T.; Farooq, M.; Wakeel, A.; Rengel, Z. Zinc nutrition in rice production systems: A review. Plant Soil Biol. Biochem. 2012, 361, 203–226. [Google Scholar] [CrossRef]
- Chauhan, B.S.; Jabran, K.; Mahajan, G. Rice Production Worldwide; Springer: Berlin/Heidelberg, Germany, 2017. [Google Scholar]
- Shahbandeh, M. Top Countries Based on Production of Milled Rice 2020/21. 2022. Available online: https://www.statista.com/statistics/255945/top-countries-of-destination-for-us-rice-exports-2011/ (accessed on 12 February 2023).
- OEC. Rice in Pakistan. 2020. Available online: https://oec.world/en/profile/bilateral-product/rice/reporter/pak (accessed on 14 January 2023).
- Rehman, A.; Jingdong, L.; Chandio, A.; Shabbir, M.; Hussain, I. Economic outlook of rice crops in Pakistan: A time series analysis (1970–2015). Financ. Innov. 2017, 3, 1–9. [Google Scholar] [CrossRef]
- Uzzaman, T.; Sikder, R.; Asif, M.; Mehraj, H.; Uddin, A.J. Growth and yield trial of sixteen rice varieties under System of Rice Intensification. Sci. Agric. 2015, 11, 81–89. [Google Scholar]
- Rahman, C.R.; Arko, P.S.; Ali, M.E.; Khan MA, I.; Apon, S.H.; Nowrin, F.; Wasif, A. Identification and recognition of rice diseases and pests using convolutional neural networks. Biosyst. Eng. 2020, 194, 112–120. [Google Scholar] [CrossRef]
- Kaur, A.; Guleria, K.; Trivedi, N.K. Rice Leaf Disease Detection: A Review. In Proceedings of the 2021 6th International Conference on Signal Processing, Computing and Control (ISPCC), Solan, India, 7–9 October 2021; pp. 418–422. [Google Scholar]
- Prajapati, H.B.; Shah, J.; Dabhi, V.K. Detection and classification of rice plant diseases. Intell. Decis. Technol. 2017, 11, 357–373. [Google Scholar] [CrossRef]
- Nalley, L.; Tsiboe, F.; Durand-Morat, A.; Shew, A.; Thoma, G. Economic and environmental impact of rice blast pathogen (Magnaporthe oryzae) alleviation in the United States. PLoS ONE 2016, 11, e0167295. [Google Scholar] [CrossRef]
- Duku, C.; Sparks, A.; Zwart, S.J. Spatial modelling of rice yield losses in Tanzania due to bacterial leaf blight and leaf blast in a changing climate. Clim. Chang. 2016, 135, 569–583. [Google Scholar] [CrossRef]
- Szegedy, C.; Vanhoucke, V.; Ioffe, S.; Shlens, J.; Wojna, Z. Rethinking the inception architecture for computer vision. In Proceedings of the IEEE Conference on Computer Vision and Pattern Recognition, Las Vegas, NV, USA, 27–30 June 2016; pp. 2818–2826. [Google Scholar]
- Kien, B.H.; Iba, D.; Ishii, Y.; Tsutsui, Y.; Miura, N.; Iizuka, T.; Masuda, A.; Sone, A.; Moriwaki, I. Crack detection of plastic gears using a convolutional neural network pre-learned from images of meshing vibration data with transfer learning. Forsch. Ing. 2019, 83, 645–653. [Google Scholar] [CrossRef]
- Ahmed, K.; Shahidi, T.; Alam, S.; Momen, S. Rice leaf disease detection using machine learning techniques. In Proceedings of the 2019 International Conference on Sustainable Technologies for Industry 4.0 (STI), Dhaka, Bangladesh, 24–25 December 2019; pp. 1–5. [Google Scholar]
- Lu, Y.; Yi, S.; Zeng, N.; Liu, Y.; Zhang, Y. Identification of rice diseases using deep convolutional neural networks. Neurocomputing 2017, 267, 378–384. [Google Scholar] [CrossRef]
- Mamat, N.; Othman, M.; Abdulghafor, R.; Alwan, A.; Gulzar, Y.J.S. Enhancing Image Annotation Technique of Fruit Classification Using a Deep Learning Approach. Sustainability 2023, 15, 901. [Google Scholar] [CrossRef]
- Gulzar, Y.J.S. Fruit Image Classification Model Based on MobileNetV2 with Deep Transfer Learning Technique. Sustainability 2023, 15, 1906. [Google Scholar] [CrossRef]
- Aggarwal, S.; Gupta, S.; Gupta, D.; Gulzar, Y.; Juneja, S.; Alwan, A.A.; Nauman, A. An Artificial Intelligence-Based Stacked Ensemble Approach for Prediction of Protein Subcellular Localization in Confocal Microscopy Images. Sustainability 2023, 15, 1695. [Google Scholar] [CrossRef]
- Liang, W.-J.; Zhang, H.; Zhang, G.-F.; Cao, H.-X. Rice blast disease recognition using a deep convolutional neural network. Sci. Rep. 2019, 9, 2869. [Google Scholar] [CrossRef] [PubMed]
- Qadri, S.; Aslam, T.; Nawaz, S.A.; Saher, N.; Razzaq, A.; Rehman, M.U.; Ahmad, N.; Shahzad, F. Machine Vision Approach for Classification of Rice Varieties Using Texture Features. Int. J. Food Prop. 2021, 24, 1615–1630. [Google Scholar] [CrossRef]
- Irshad, M.S.; Xin, Q.; Arshad, H. Competitiveness of Pakistani rice in the international market and export potential with the global world: A panel gravity approach. Cogent Econ. Financ. 2018, 6, 1486690. [Google Scholar] [CrossRef]
- Chen, J.; Zhang, D.; Nanehkaran, Y.; Li, D. Detection of rice plant diseases based on deep transfer learning. J. Sci. Food Agric. 2020, 100, 3246–3256. [Google Scholar] [CrossRef] [PubMed]
- Yuan, J.Q.; Li, L.; Yan, W. Early Identification of Rice Leaf Blast Based on Hyperspectral Imaging. J. Phys. Conf. Ser. 2021, 1944, 012041. [Google Scholar] [CrossRef]
- Kiratiratanapruk, K.; Temniranrat, P.; Kitvimonrat, A.; Sinthupinyo, W.; Patarapuwadol, S. Using deep learning techniques to detect rice diseases from images of rice fields. In Proceedings of the International Conference on Industrial, Engineering and Other Applications of Applied Intelligent Systems, Shanghai, China, 19–22 July 2023; Springer: Berlin/Heidelberg, Germany, 2020; pp. 225–237. [Google Scholar]
- Sethy, P.K.; Barpanda, N.; Rath, A.; Behera, S.K. Deep feature based rice leaf disease identification using support vector machine. Comput. Electron. Agric. 2020, 175, 105527. [Google Scholar] [CrossRef]
- Zhou, G.; Zhang, W.; Chen, A.; He, M.; Ma, X. Rapid detection of rice disease based on FCM-KM and faster R-CNN fusion. IEEE Access 2019, 7, 143190–143206. [Google Scholar] [CrossRef]
- Yang, H.; Ni, J.; Gao, J.; Han, Z.; Luan, T. A novel method for peanut variety identification and classification by Improved VGG16. Sci. Rep. 2021, 11, 15756. [Google Scholar] [CrossRef] [PubMed]
- Uzair, M.; Sohail, S.; Shaikh, N.; Shan, A. Agricultural residue as an alternate energy source: A case study of Punjab Province, Pakistan. Renew. Energy 2020, 162, 2066–2074. [Google Scholar] [CrossRef]
- Frolking, S.; Qiu, J.; Boles, S.; Xiao, X.; Liu, J.; Zhuang, Y.; Li, C.; Qin, X. Combining remote sensing and ground census data to develop new maps of the distribution of rice agriculture in China. Glob. Biogeochem. Cycles 2002, 16, 38-1–38-10. [Google Scholar] [CrossRef]
- Mohapatra, D.; Tripathy, J.; Patra, T.K. Rice disease detection and monitoring using CNN and Naive Bayes classification. In Soft Computing Techniques and Applications; Springer: Berlin/Heidelberg, Germany, 2021; pp. 11–29. [Google Scholar]
- Joshi, A.A.; Jadhav, B. Monitoring and controlling rice diseases using image processing techniques. In Proceedings of the 2016 International Conference on Computing, Analytics and Security Trends (CAST), Pune, India, 19–21 December 2016; pp. 471–476. [Google Scholar]
- Khan, A.I.; Al-Habsi, S. Machine learning in computer vision. Procedia Comput. Sci. 2020, 167, 1444–1451. [Google Scholar] [CrossRef]
- Kouser, S.; Mushtaq, K. Environmental efficiency analysis of basmati rice production in Punjab, Pakistan: Implications for sustainable agricultural development. Pak. Dev. Rev. 2010, 49, 57–72. [Google Scholar]
- Bashir, K.; Rehman, M.; Bari, M. Detection and classification of rice diseases: An automated approach using textural features. Mehran Univ. Res. J. Eng. Technol. 2019, 38, 239–250. [Google Scholar] [CrossRef]
- Larijani, M.R.; Asli-Ardeh, E.; Kozegar, E.; Loni, R. Evaluation of image processing technique in identifying rice blast disease in field conditions based on KNN algorithm improvement by K-means. Food Sci. Nutr. 2019, 7, 3922–3930. [Google Scholar] [CrossRef]
- Shareef. Rice Leaf Disease Dataset. 2021. Available online: https://www.kaggle.com/datasets/shareef0612/riceleaf-dataset (accessed on 12 March 2023).

Disclaimer/Publisher’s Note: The statements, opinions and data contained in all publications are solely those of the individual author(s) and contributor(s) and not of MDPI and/or the editor(s). MDPI and/or the editor(s) disclaim responsibility for any injury to people or property resulting from any ideas, methods, instructions or products referred to in the content. |
© 2023 by the authors. Licensee MDPI, Basel, Switzerland. This article is an open access article distributed under the terms and conditions of the Creative Commons Attribution (CC BY) license (https://creativecommons.org/licenses/by/4.0/).