Abstract
Targeted pruning techniques may have the potential to shift phenological progression in grapevines. These approaches can be useful to escape late frost (after budburst) and to delay ripening, maintaining yield and berry quality under specific environmental scenarios and for targeted oenological aims. In this work we tested a series of pruning methods (late pruning and different forcing approaches to unlock the para-dormant buds) with the primary objective of delaying phenological onset while increasing must quality components in the Trento DOC basin (Italy) over three field seasons either in cv Chardonnay or cv Pinot noir. Delayed pruning shifted the onset of most of the phenological stages by 3 to 10 days with a general increase in must acidity at harvest over two seasons. Forcing techniques, and in particular forcing vine regrowth (i.e., removing primary productivity along with leaves and secondary shoots to force dormant bud growth), substantially reduced yield per vine (p < 0.001) but significantly (p < 0.001) enhanced total acidity and yeast available nitrogen when compared to winter pruning vines in both Chardonnay and Pinot noir. Different spring pruning for unlocking para-dormant buds aimed at double-cropping in 2022 did not yield a secondary harvest potentially due to lack of vigor in the vineyard (Pinot noir) and unfavorable environmental conditions that putatively anticipated bud pre-dormancy. However, reduced sugar levels in the primary productivity bunches of the treated vines were observed, suggesting that early source limitation (e.g., at fruit set) applied via reduced active photosynthetic leaf area may slow down technological ripening even if compensatory behaviors were observed in the treated plants through enhanced stomatal conductance. Our work provides evidence of the potential usefulness of different pruning approaches for manipulating phenological progression and berry ripening dynamics under climate change scenario in the Trento DOC area and suggests a lack of efficacy and specific drawbacks particularly in dry and hot years.
1. Introduction
The adverse push of climate change (CC) has been particularly evident in recent years. Viticulture has been shown to be significantly vulnerable to CC, with specific detrimental effects associated both with vine physiology and berry composition [1]. Phenological shifts with earlier onset or faster development of individual growth stages are the most prominent effects of CC on vine growth [2,3,4] although direct influences on bud fertility and hence productivity have been also observed, mainly due to the complex interplay between temperature accumulation and water availability [5,6]. This phenological trend, along with increases in average summer temperature, anticipates the dynamics of berry ripening that develops under warmer and drier conditions [7,8]. Inevitably, higher temperature associated with prominent radiative and water stress impacts berry quality with faster sugar accumulation and organic acid reduction, uncoupled ripening progression (sugar vs. phenolic dynamics), and variety-specific effect on wine aroma profile [9,10,11]. Vines destined for sparkling wine production are generally harvested at a relatively low pH, higher titratable acidity, and lower soluble sugars when compared to vines devoted to table wine [12,13]. Considering the above-mentioned effects of CC on berry quality, sparkling wine production is majorly affected by CC, especially due to the early and quick dynamics of sugar accumulation and acidity degradation [10]. In this scenario, the most common strategy implemented by viticulturists is an early harvest [12]; however, this produces a series of logistical and organizational challenges along with sub-optimal berry sugar concentration and aromatic constituents such as volatiles terpenes. Late irrigation strategies may also be useful in some scenarios to slow down the technological ripening [14] although care should be taken as potential opposite effects on total acidity may arise following tartaric acid dilution [15].
Trento DOC (PDO) is the name of the first Certified Brand of Origin for an Italian sparkling wine produced by the traditional method and produced in the Trentino region (Italy) [16]. Pinot noir and Chardonnay are the most common varieties used in Trentino for sparkling wines within the Trento DOC along with Pinot blanc and Pinot Meunier. In recent years, significantly early harvest dates of vineyards devoted to sparkling wines have produced fruits that have not fulfilled the acidity requirements (9–13 g L−1 of titratable acid) and hence, in some cases, required must acidification. Different management techniques have been proposed to delay ripening dynamics and even maintain must acidity (as review by [10,17]). Among these approaches, pruning has been extensively investigated, with several studies providing evidence of the usefulness of delayed winter pruning [18] to postpone bud development by a few days and defer ripening dynamics. In addition, this approach has been shown to effectively defer budburst and hence escape spring frost damage [18]. Another effective yet commercially unexploited approach for inducing delayed ripening in grapevines is the forcing bud growth by double pruning [19]. The technique consists of trimming shoots in the summer to six nodes while removing all secondary shoots and bunches to force the dormant compound bud before entering endo-dormancy. However, this drastic approach is unlikely to be adopted as it requires a large amount of work, can induce significant limitations in carbon allocation and therefore next season’s yield, and bunch removal (primary productivity) would hardly be an accepted approach for farmers. Recently, Poni et al. [20] showed the possibility of unlocking para-dormancy in the dormant bud without total leaf and bunch trimming by following a shoot trimming to the 6th node and secondary shoot removal. This led to a second production (primary and forced) with specific quality traits (higher total acidity) while primary productivity was mostly unaffected when compared to the untreated control. In the proposed scenario focused on sparkling wine, these pruning techniques may contribute to the maintenance of juice acidity while preserving or, in any case, not significantly reducing yield in the next season.
We present a series of field trials in Chardonnay (2019) and Pinot noir (2021 and 2022) with different experimental designs in which a series of delayed pruning and double pruning approaches have been tested. We hypothesized that there will be (1) a significant phenological shift after different late or double pruning techniques and hence (2) a series of preferable berry quality traits in treated vines when compared to control vines, specifically related to acidity levels and yeast available nitrogen. Overall, our work provides a series of pruning approaches carried out in different varieties in the Trento DOC basin, suggesting the feasibility of some of the proposed techniques to postpone budburst phenology and delay ripening dynamics.
2. Materials and Methods
2.1. Field Site and Plant Material
The experiments were carried out in the 2019 (Experiment 1), 2021 (Experiment 2), and 2022 (Experiment 3) field seasons. All field trials were set up in commercial vineyards at the Fondazione Edmund Mach (FEM) in San Michele all’Adige (Italy). Experiment 1 was carried out in the Weizacher vineyard (cv. Chardonnay, clone SMA130 grafted onto SO4) (coordinates: 46°11′33.8″ N 11°08′10.1″ E). The vineyard was planted in 2004 in a field with a 15 to 20% slope and east–west row orientation. An analysis of the soil texture showed the soil to be a loamy soil with 39.8% sand, 48.1% silt, and 12.1% clay. The density of planting was 5000 plants ha−1 (1.00 m × 2.00 m) and the vines are trained to a vertical shoot position, double Guyot system. Experiments 2 and 3 were carried out in the Noderli vineyard (cv Pinot noir clone 828 ENTAV grafted onto Kober 5BB) (coordinates: 46°11′25.5″ N 11°08′18.7″ E). The vineyard was planted in 2018 in a field with a 15–20% slope. The vineyard has west exposure with a calcareous soil, a loam-limestone texture, and is 15% clay. The density of planting was 6250 plants ha−1 (0.80 m × 2.00 m), and vines were pruned to a vertical shoot position, single Guyot system. For each experiment, application of fungicides was carried out by the Fondazione Edmund Mach farm following standard practices in the Trentino region. Daily drip irrigation applied according to vineyard scheduling avoided the development of terminal soil moisture deficit. Environmental conditions were monitored in all the field seasons using a weather station 250 m away from the field site (46°11′00.6″ N 11°07′14.1″ E).
2.2. Experimental Design
All experiments were arranged in randomized block designs in two to three rows. In Experiment 1 (2019, Chardonnay), five treatments were applied in a randomized design. The treatments were a control winter-pruned in a double Guyot according to standard practices (CP, 8 buds per fruiting cane on average), a double-Guyot delayed pruning (GDP), a spur-pruned cordon delayed pruning (CDP), a Guyot forcing pruning (GFP), and a spur-pruned cordon forcing pruning (CFP) (n = 6 to 18 vines per treatment). In Experiment 2 (2021, Pinot noir), four treatments were applied in a randomized block design in which 24 vines represent a block (four blocks, n = 24 per treatment). The treatments were a control pruned according to standard practices (CP, 8 buds per fruiting cane on average), a Guyot delayed pruning (GDP), a Guyot forcing pruning (GFP) and a spur-pruned cordon forcing pruning (CFP). In Experiment 3 (2022, Pinot noir), four treatments were applied in a randomized block design in which 24 vines represent a block (four blocks, n = 24 per treatment). The treatments were a control managed according to standard practices (CP, 8 buds per fruiting cane on average), a forced Guyot five nodes above the bunch (FG5), a forced Guyot three nodes above the bunch (FG3), and a forced Guyot one node above the bunch (FG1).
2.3. Treatments Application
In Experiment 1, winter pruning was applied to CP according to farm practices during dormancy. GDP and CDP were left un-pruned while at BBCH102 for the CP plants (19 April 2019) GDP was pruned as a double Guyot while in CDP the fruiting cane of the previous year was left to generate a spurred cordon with two buds per spur (Figure 1A–C). GFP and CFP were winter pruned as CP. At BBCH75 (19 June 2019), the selected GFP vines were pruned as double Guyots to eight buds per fruiting cane. The new fruiting canes (green shoots) were horizontally wired, and bunches, secondary shoots, and leaves were removed. In CFP, at BBCH75, bunches, secondary shoots and leaves were removed while the primary shoots (eight buds per fruiting cane) were spur-pruned to one bud. In Experiment 2, winter pruning was applied to CP according to farm practices during dormancy but in a single Guyot training system (only one fruiting cane, eight buds). For GDP, a manual shoot topping to 12–13 buds was applied during the winter. At BBCH106 for the CP plants (7 May 2021), GDP was pruned as a single Guyot and fruiting cane adjusted to eight buds. GFP and CFP in Experiment 2 were applied as above (i.e., Experiment 1) and at BBCH75 (29 June 2021). In Experiment 3, the vines were all winter pruned according to farm practices during dormancy. Between BBCH 71 and 73 (around fruit set, 17 June 2022), FG1, FG3, and FG5 were applied by trimming all the main shoots at the defined nodes for each treatment (Figure 1D). At the same time, lateral shoots that were already developed were removed for all the shoots and this was repeated, if needed, every week until mid-July. In Experiment 3, for all the treatments, primary bunch productivity was left untouched.
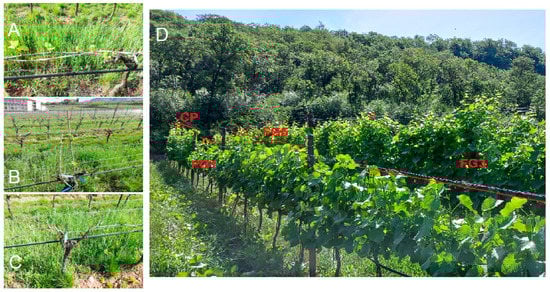
Figure 1.
Examples of treatment applications in Experiment 1 (2019, Chardonnay (A–C)) and Experiment 3 (2022, Pinot noir, (D)). (A) Example of CP at BBCH103; (B) application of GDP; (C) application of CDP; (D) application of shoot topping and relative secondary shoot removal for FG5, FG3, and FG1 and compared to CP.
2.4. Phenology, Morphology, and Physiology
Crop phenology was monitored every week in Experiments 1 and 2 according to the BBCH growth scale [21]. In Experiment 3, stomatal conductance (gs) was measured on fully expanded leaves via a porometer (Li-600, Li-cor, NE, USA) 0, 7, 15, and 35 days after treatment application (DAT) (n = 10–20). In addition, the light-adapted quantum yield of PSII (Fq’/Fm’) was derived from the maximum light-adapted florescence (Fm’) and the minimum fluorescence (Fs) as Fq’/Fm’ = (Fm’−Fs)/Fm’ following saturating flash. The electron transport rate (ETR) was then calculated as ETR = PAR × Fq’/Fm’ × 0.5 × 0.84, where 0.5 and 0.84 are the electron partitionings between PSII and PSI and leaf absorbance, respectively, while PAR represents the photosynthetic active radiation at which the analysis was carried out and collected via a Li-600 PAR sensor. For all the treatments and experiments, the number of inflorescences and then bunches were counted. At harvest (different dates for each treatment, please see section below), total vine yield was assessed by weighing the bunches with a dynamometer. The number of shoots and buds per vine were visually counted. Ravaz Index was calculated as the ratio between the total vine yield and pruning weight collected in the following December for Experiments 2 and 3.
2.5. Berry Quality Analysis
Harvest was carried out according to Fondazione Edmund Mach farm dates for CP, GDP, and CDP (10 September 2019 in Experiment 1 and 8 September 2021 in Experiment 2) as well as FG treatments (2 September 2022, Experiment 3). Since no evaluation of the ripening curve was possible during the experiments, the harvest was carried out at values that were sub-optimal for sparkling wine in CP (2–3 °Brix above and 2 g/L titratable acidity below the optimum) to evaluate the effects of delayed pruning for the same harvest date. GFP and CFP were harvested on 4 November 2019 in Experiment 1 and 3 November 2021 in Experiment 2. At harvest, the bunches for all the treatments were harvested and the resulting bunches were assembled in n = 4 to 16 replicates per treatment depending on the experimental plan. Samples of fresh juice were then analyzed for pH, total soluble solids (TSS) (°Brix), titratable acidity (TA) (g/L as tartaric acid), tartaric and malic acid concentration (g/L), and YAN (mg/L) using a WineScan infrared spectrophotometer (FOSS, Hillerφd, Denmark). The extraction of the anthocyanins and polyphenols of the peel was carried out using the method proposed in [11] and for Experiment 3 only (in n = 3).
2.6. Statistical Analysis
Statistical analyses were carried out using Rstudio (R Core Team 2018, PBC, Boston, MA, USA). All data were checked for normality and homoscedasticity through visual assessment of distribution and residuals versus fitted values. When a skewed distribution was present, the data were log-transformed. All data were then subjected to one-way ANOVA. Li-600 data (gs and ETR) were subjected to two-way ANOVA with treatment and day after treatment application as factors. Mean separation was carried out via Tukey’s test.
3. Results
3.1. Seasonal Weather Pattern
The three growing seasons were characterized by contrasting environmental patterns (Figure 2). In 2022, the average daily temperature, especially in early summer, was significantly higher than in 2019 and 2021 (22.8 °C on average when compared to an average of 21.1 °C and 20.6 °C in 2019 and 2021, respectively) (Figure 2A–C). The total rainfall was higher in 2019 (1306 mm) than 2021 (1074 mm) while a significant reduction in annual rainfall was observed in 2022 (788 mm) (Figure 2D–F) with a decline of 100 mm for March–October 2022 when compared to 2021 and 2019.
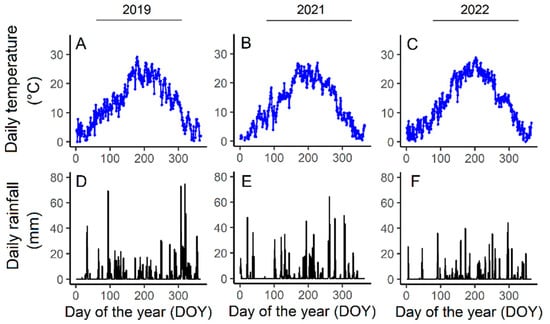
Figure 2.
Average daily temperatures (°C) and daily rainfall (mm) for Experiment 1 (2019, Chardonnay, (A,D)), Experiment 2 (2021, Pinot noir, (B,E)), and Experiment 3 (2022, Pinot noir, (C,F)).
3.2. Phenological Progression
The phenological characterization of treated vs. untreated vines in 2019 showed a general slower vegetative phenological onset (i.e., leaf appearance) in Experiment 1 following GDP and CDP, with the latter shifting leaf developmental phenology by up to 15 days when compared to CP (Figure 3A). Similar differences were also observed between BBCH 53–77 (berries beginning to touch) although from BBCH79 onward a similar phenological progression was observed between CP, GDP, and CDP treatments (Figure 3B). As expected, forcing pruning techniques (GFP and CFP) shifted most of the phenological onsets when compared to CP by up to 60 days between BBCH08 and BBCH109 while a delay of 50 days was observed between BBCH53 and 89 compared to CP (Figure 3A,B). In Experiment 2, GDP slowed down phenological development by a week when compared to CP and from BBCH107 to BBCH109 while no differences were observed between BBCH53 and 89 (Figure 3C,D). Forcing dormant buds (GFP and CFP) delayed both leaf onset and reproductive phenology with the latter showing a general delay of up to 60 days when compared to CP (Figure 3C,D).
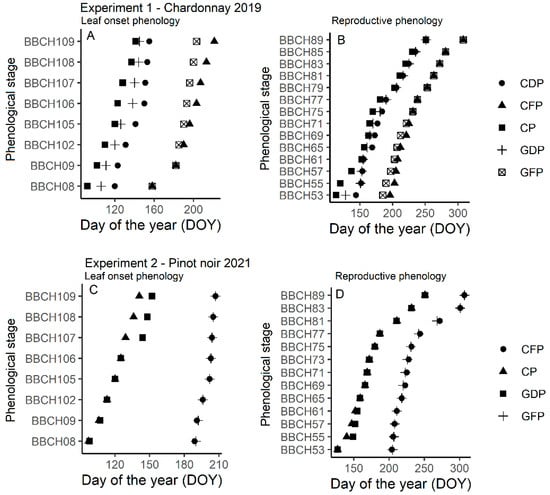
Figure 3.
Phenological progression in Experiment 1 (Chardonnay, 2019, (A,B)) and Experiment 2 (Pinot noir, 2021, (C,D)) as a function of day of the year (DOY) and for control pruning (CP), Guyot delayed pruning (GDP), cordon delayed pruning (CDP), Guyot forcing pruning (GFP), and cordon forcing pruning (CFP) treatments.
3.3. Vine Vegetative Growth, Yield, and Pruning Wood
The vine productivity (kg vine−1) in CP was 2.72 kg in Experiment 1, 1.16 kg in Experiment 2, and 2.79 kg in Experiment 3 (Table 1). The application of delayed pruning (GDP, CDP) significantly reduced the number of shoots per vine and number of bunches per vine (hence fertility) compared to CP (p < 0.001 for Experiments 1 and 2). While no major effects were observed for mean bunch weight, significant reductions in vine productivity by up to 40% were observed when GDP and CDP were applied both in Experiment 1 (GDP and CDP) and Experiment 2 (GDP). Forcing techniques in Experiments 1 and 2 (GFP and CFP, loss of primary productivity) reduced all the vegetative and yield components compared to CP with fewer (p < 0.001) and lighter (p < 0.001) bunches leading to a reduction in productivity by up to 80% (Table 1, p < 0.001). In Experiment 3, no significant differences were found between CP and para-dormant bud forcing approaches (FG5, FG3, and FG1) (Table 1).

Table 1.
Average number of shoots and bunches for Experiments 1 (Chardonnay 2019), 2 (Pinot noir 2021), and 3 (Pinot noir 2022). Fertility and mean bunch weight were calculated values while vine yield (kg) was assessed in vivo. Data are shown as means (n = 4–24) and were analyzed using one-way ANOVA while the standard error of the mean (SEM) and p-values are shown for each trait analyzed. Different letters represent significant differences according to Tukey’s test.
The assessment of pruning weight in Experiment 2 highlighted significant reductions for GFP and CFP compared to CP (p < 0.001, Table 2). Overall, the Ravaz Index was reduced following both delayed and forcing pruning when compared to CP with GFP showing the lowest values. Forcing approaches in 2022 gradually reduced pruning weight when compared to CP and the Ravaz Index increased linearly (but not significant, p = 0.091) with increasing pruning intensity (i.e., FG1) (Table 2).
Table 2.
Average pruning weight (g) and calculated Ravaz Index for Experiments 2 and 3 (2021 and 2022 in Pinot noir). Data are shown as means (n = 4–16) and were analyzed using one-way ANOVA while the standard error of the mean (SEM) and p-values are shown for each analyzed trait. Different letters represent significant differences according to Tukey’s test.
3.4. Leaf Stomatal Conductance and Chlorophyll Fluorescence
In Experiment 3, the dynamics of in vivo stomatal conductance (gs) and light-adapted chlorophyll fluorescence was monitored. Forcing regrowth followed by secondary shoot removal (FG5, FG3, and FG1) significantly reduced the ETR (p < 0.001) at DAT0 (particularly in FG1) while a similar trend was observed for gs (p = 0.072). Conversely, while non-significant differences were observed at DAT 7 and DAT 35, a significant increase in gs was observed for FG3 and FG1 when compared to CP at DAT 15 (p = 0.001) (Figure 4).
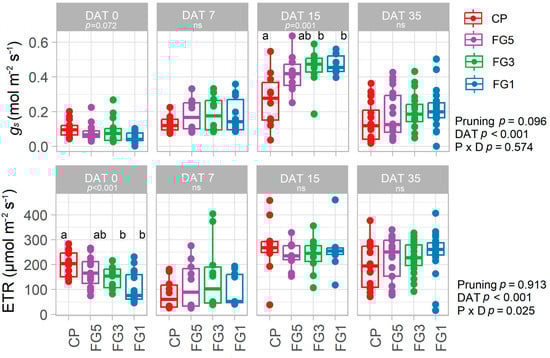
Figure 4.
In vivo stomatal conductance (gs) and electron transport rate (ETR) on DAT 0, 7, 15, and 35 for control pruning (CP), forced Guyot five nodes above the bunch (FG5), forced Guyot three nodes above the bunch (FG3), and forced Guyot one node above the bunch (FG1) treatments (n = 10–20). In the graphs, points represent outliers, horizontal lines within boxes indicate the median, and boxes indicate the upper (75%) and lower (25%) quartiles. Whiskers indicate the ranges of the minimum and maximum values. Data were analyzed using one- and two-way ANOVA with pruning and day after treatment application (DAT) as factors and p-values are shown in the graph. Different letters represent a significant difference between treatments according to Tukey’s test. Data are from Experiment 3.
3.5. Berry Chemical Composition
In Chardonnay (Experiment 1), the total soluble solids of CP plants were 22.3 °Brix, which is slightly above the optimum for sparkling wine harvest. GDP and CDP did not show significant differences compared to CP for °Brix while significantly (p < 0.001) lower values were observed for GFP and CFP (around 20 °Brix on average) (Figure 5A). GDP and CDP showed a reduced juice pH when compared to CP (3.05 vs. 3.18, respectively) and significantly lower values compared to CP, GDP, and CDP were observed for GFP and CFP (around pH 3 on average) (Figure 5C). Similarly, GFP and CFP were characterized by a higher titratable acidity and lower TSS/TA ratio when compared to all the other treatments (Figure 5D, p < 0.001). Tartaric acid levels were higher in CFP when compared to CP (p = 0.028, Figure 5E) while malic acid was significantly higher (8 g/L vs. 3–4 g/L, p < 0.001) in GFP and CFP compared to the other treatments. Yeast available nitrogen levels were enhanced in GFP and CFP (190 mg/L on average) when compared to the other treatments (90 to 100 mg/L on average) (p < 0.001, Figure 5H).
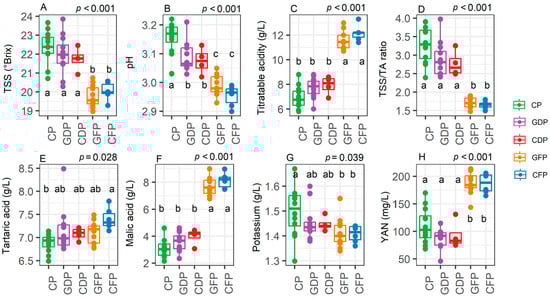
Figure 5.
Levels of total soluble solids (TSS) (A), pH (B), titratable acidity (C), total soluble solids/titratable acidity ratio (D), tartaric acid (E), malic acid (F), potassium (G), and yeast available nitrogen (H) in vines subjected to control pruning (CP), Guyot delayed pruning (GDP), cordon delayed pruning (CDP), Guyot forcing pruning (GFP), and cordon forcing pruning (CFP) (n = 9–16). In the graphs, points represent raw data, horizontal lines within boxes indicate the median, and boxes indicate the upper and lower quartiles. Whiskers indicate the ranges of the minimum and maximum values. Data were analyzed using one-way ANOVA and p-values are shown in the graph. Different letters represent a significant difference between treatments according to Tukey’s test. Data are from Experiment 1.
In Pinot noir (Experiment 2), CP were harvested at a TSS value of 24 °Brix and a titratable acidity value of just above 4 g/L, both considered unsuitable for sparkling wine but potentially optimal for aging wines. GDP significantly reduced the TSS levels compared to CP (p < 0.001) by 2 °Brix although lower values were observed in GFP and CFP (18.5–19 °Brix on average) (Figure 6A). GFP and CFP were also associated with a lower pH when compared to the other treatments (p < 0.001). This was accompanied by an increase in titratable acidity by up to 14 g/L for the GFP and CFP treatments, well above GDP (8 g/L) and CP (Figure 6C, p < 0.001). Indeed, GDP resulted in a significantly higher titratable acidity than CP (p < 0.001, Figure 6C). This led to a significantly lower TSS/TA ratio compared to CP in the forcing regrowth treatments (p < 0.001). All the treatments showed a higher tartaric acid content than CP (p < 0.001, Figure 6E) as well as higher malic acid levels (p < 0.001, Figure 6F) and especially in GFP- and CFP-treated vines (up to 10–11 g/L). Potassium content was higher in GDP than CP while significant reductions were observed in GFP and CFP (p < 0.001, Figure 6G). GFP and CFP displayed a higher YAN content than CP and GDP (300 mg/L vs. 120 mg/L) (p < 0.001, Figure 6H).
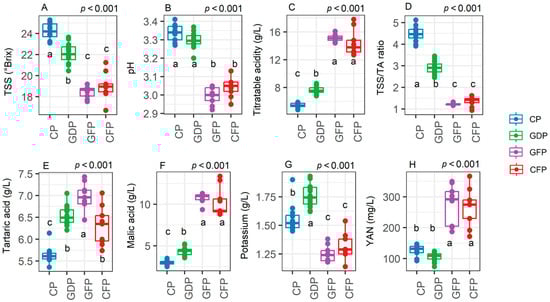
Figure 6.
Levels of total soluble solids (TSS) (A), must pH (B), titratable acidity (C), total soluble solids/titratable acidity ratio (D), tartaric acid (E), malic acid (F), potassium (G), and yeast available nitrogen (H) in vines subjected to control pruning (CP), Guyot delayed pruning (GDP), cordon delayed pruning (CDP), Guyot forcing pruning (GFP), and cordon forcing pruning (CFP) (n = 8). In the graphs, points represent raw data, horizontal lines within boxes indicate the median, and boxes indicate the upper and lower quartiles. Whiskers indicate the ranges of the minimum and maximum values. Data were analyzed using one-way ANOVA and p-values are shown in the graph. Different letters represent a significant difference between treatments according to Tukey’s test. Data are from Experiment 2.
In 2022 Pinot noir (Experiment 3), CP were harvested at a TSS value of 24 and a titratable acidity value of just above 4.5 g/L. Forcing dormant buds yielded a primary productivity that was only characterized by a lower TSS content (p = 0.002, Figure 7A) and pH (p = 0.005, Figure 7B) compared to CP and no differences were observed between FG applications. This led to a lower TSS/TA ratio in the FG-treated vines. No differences were observed for the levels of titratable acidity, tartaric acid, malic acid, potassium, and YAN between treatments (Figure 7).
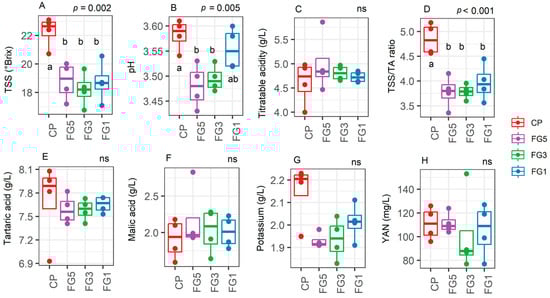
Figure 7.
Levels of total soluble solids (TSS) (A), must pH (B), titratable acidity (C), total soluble solids/titratable acidity ratio (D), tartaric acid (E), malic acid (F), potassium (G), and yeast available nitrogen (H) in vines subjected to control pruning (CP), forced Guyot five nodes above the bunch (FG5), forced Guyot three nodes above the bunch (FG3), and forced Guyot one node above the bunch (FG1) treatments (n = 4). In the graphs, points represent raw data, horizontal lines within boxes indicate the median, and boxes indicate the upper and lower quartiles. Whiskers indicate the ranges of the minimum and maximum values. Data were analyzed using one-way ANOVA and p-values are shown in the graph. Different letters represent a significant difference between treatments according to Tukey’s test. Data are from Experiment 3.
The total anthocyanin level in Experiment 3 were around 600 mg/kg of berries in CP but the application of FG, especially FG1, significantly reduced the total anthocyanin concentration compared to CP (p = 0.035, Figure 8A) while no significant effects were observed for polyphenol levels (p = 0.272, Figure 8B). Indeed, in FG-treated vines, significant early sunburn damage was observed starting from DAT15 (Figure 8C).
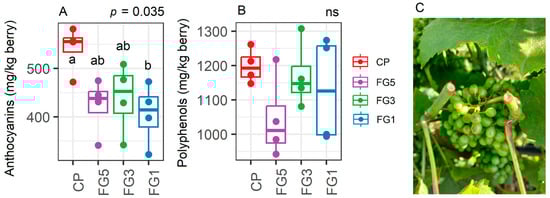
Figure 8.
Levels of total anthocyanins (A) and polyphenols (B) in vines subjected to control pruning (CP), forced Guyot five nodes above the bunch (FG5), forced Guyot three nodes above the bunch (FG3), and forced Guyot one node above the bunch (FG1) treatments (n = 4). In the graphs, points represent raw data, horizontal lines within boxes indicate the median, and boxes indicate the upper and lower quartiles. Whiskers indicate the ranges of the minimum and maximum values. Data were analyzed using one-way ANOVA and p-values are shown in the graph. Different letters represent a significant difference between treatments according to Tukey’s test. Data are from Experiment 3. In (C), an example of sunburn damage on DAT15 in bunches of FG1 vines is shown.
4. Discussion
4.1. The Effectiveness of Delayed Pruning Is Variety- and/or Season-Dependent
The most favorable consequence of a delayed pruning is the induced postponement of bud development that shifts budburst into warmer periods with lower probabilities of spring frost damage. Several studies (recently reviewed by Poni et al. [18]) have shown variable shifts in the phenological progression between 5 [22] and 56 days [23] depending on the growth stage at which the second pruning is carried out and seasonal environmental conditions. In many cases, this phenological reprogramming was also associated with a delay in technological ripening and titratable acidity maintenance by effectively extending maturity into a cooler season [18]. However, most of the work carried out so far has been applied in spur-pruned cordons, while only a few studies focused on applied this approach in cane-pruned vines. In a three-year field trial, Gatti et al. [24] applied delayed pruning to Pinot noir trained to Guyot. This attempt was effective in delayed ripening over two seasons while the yield per vine was reduced by 35% compared to that of control vines mainly because of lower shoot fruitfulness. In our work, GDP and CDP significantly shifted phenological progression in Chardonnay although similar phenological patterns were observed from BBCH77 with CP. Conversely, minimal effects of GDP were observed in Pinot noir and mainly around BBCH53-61. Indeed, the slope of the BBCH vs. DOY relationships was steeper in both experiments for GDP and CDP compared to CP suggesting that (1) the postponed onset of budburst (e.g., up to BBCH75) pushed shoot growth towards warmer periods hence allowing the accumulation of a larger portion of growing degree days compared to the same growth stage development for CP; (2) a photosynthetic compensation occurs either due to optimal environmental conditions or by higher sink carbon requests; and (3) any environmental cue that can speed up phenology (e.g., stress) can close the initially acquired phenological gap between any delayed pruning approach with CP. While temperature dynamics between 2019 and 2021 were similar (Figure 2), 2021 was characterized by a generally lower rainfall pattern than 2019, suggesting the possibility of soil moisture deficit development in 2021 and therefore a shorter interval between phenological stages that nullifies the GDP effects. Other sources of variation may be the inherent variety-specific response to a delayed pruning and the crop load (double Guyot in Experiment 1, single-cane Guyot in Experiment 2) that may have influenced phenological onset via additive or interactive effects with environmental conditions. In addition, at budburst, reserves of carbohydrates and nitrogen are mobilized from the permanent organs of vines to support shoot growth [25]. In GDP and CDP vines the removal of a portion of the shoots in pre-pruned canes may cause considerable loss of these reserves [26]. However, as shown by [24], the amount of stored carbohydrates in the first year of delayed pruning application may not be limiting and they may have been used to fill the phenology gap.
Even so, at harvest, on the same date compared to CP and for both Experiment 1 and Experiment 2, GDP and CDP yielded similar berry chemical parameters between them yet preferable quality traits compared to CP, mainly associated with increased juice acidity. In Experiment 1, an uncoupled °Brix and pH was observed, with a lower must pH in GDP and CDP compared to CP while, in Experiment 2, an uncoupled TSS/TA ratio was evident between GDP and CP. This was mainly due to a higher tartaric and malic acid concentration in GDP berries as well as a higher titratable acidity. These trends were already observed in a few previous studies, and it was speculated that a lower TSS/TA ratio is the result of a shifted maturity towards cooler periods [23,24,27,28]. However, the lack of phenological effects post-veraison in both Experiment 1 and Experiment 2 following delayed pruning and compared to CP indicates that other mechanisms are involved in the TSS/TA reduction thus suggesting the need to further explore the mechanisms underlying this consistently observed trend [18].
4.2. Forcing Vine Regrowth Significantly Postponed Phenological Progression and Improved Juice Quality but Reduced Yield
Forging vine regrowth by reprogramming dormant buds at flowering following (i) trimming canes in the summer to six nodes and (ii) removing all secondary shoots and bunches has been widely proposed in the literature [29]. The general objective of this approach is to be able to produce typical “cool climate” wines with a low pH, high acidity, higher color, and more complex flavor in a warm climate by pushing berry ripening away from hot summer temperatures. Although this method is very tempting and based on robust physiological mechanisms, the approach is unlikely to be applied by farmers because of the potential aversion in eliminating primary productivity. However, assuming an exacerbation of climate change-induced environmental pressures, these approaches may be key in maintaining berry quality parameters in unfavorable years. Our work (Experiments 1 and 2) confirmed a significant reduction in vine yield by up to 80% when GFP and CFP were applied compared to CP. Most of the vegetative and yield components were associated with reduced shoot numbers, bunch numbers, fruitfulness, and bunch weight. The reduction observed in our work is in line (yet slightly higher) with previous work on Cabernet Sauvignon [30] and Tempranillo [31] and likely associated with (i) a drastic decline in the available reserves after the second pruning in early summer and (ii) potential sub-optimal environmental conditions during flowering and fruit set. Nevertheless, for both experiments, GFP and CFP shifted phenology up to 70 days thus significantly postponing ripening to a cooler period. This led to a reduction of 4 °Brix in both Chardonnay and Pinot noir, an enhancement of titratable acidity of 40% and 50% in Chardonnay and Pinot noir, respectively, thus pushing the TSS/TA ratio to around 2 in both years. Interestingly, while a minimal increase in tartaric acid content was noted, malic acid levels increased significantly (up to 12 g/L in both experiments). The initiation of malic acid breakdown seems to be temporally synchronized with sugar accumulation and cool temperatures can inhibit the respiration rate more than photosynthesis, hence delaying or hindering malic acid degradation [32]. This is in line with our findings that provided evidence of a higher malic acid concentration in vines subjected to a shift (up to 70 days) in phenology and hence maturity. An unexpected yet interesting finding was the increase in yeast available nitrogen concentrations in GFP and CFP. A value of 150 mg/L YAN is recommended for trouble-free must fermentation [33] and, in all the experiments of the presented study, the YAN concentration was below the recommended value for CP. Although increasing the concentration of must YAN via oenological additives is possible and despite the fact that increasing YAN by vineyard management following application of mineral N fertilizer is a commonly used approach [34], (i) assimilation of N from ammonium is more energy intensive for the yeast than the direct use of amino acids [35] that, in addition, are direct aroma precursors and (ii) the amount of N fertilizer required to achieve a sufficient YAN in the vineyard has been shown to be high [34] and constrained by several factors (time of application, water availability, and air temperature). Due to the already mentioned effects of climate change, grapevine harvest occurs considerably earlier nowadays with a poor YAN concentration in the must [34] in line with the CP values of our work. The increase in YAN contents in GFP and CFP may be associated with the postponed ripening period that occurred during cooler temperatures and therefore over a period of environmentally induced leaf senescence. Although the remobilized N from the leaf (around 55%) is mainly used for the formation of reserves in permanent organs [36], a substantial amount is relocated to the berry. Indeed, lower YAN values of musts are often observed in defoliated vines [37]. Forcing regrowth, therefore, may be a successful approach to increase YAN contents in the must possibly due to a better synchronization between leaf senescence and ripening. However, this trend is expected to not be consistent over seasons, as part of the plant nitrogen is lost during the hand finishing in early summer thus requiring larger N inputs in the subsequent years. Further work is therefore required to confirm if the trend is also associated with the specific dynamics of primary and secondary aroma molecules in wines.
4.3. Forcing Double Harvest May Be Limited by Constraining Environmental Conditions
Poni et al. [20] showed, for the first time, a possible method to achieve a double harvest in grapevines grown in warm regions. Experiment 3 was carried out during a particularly dry and warm season characterized by a large evaporative demand and limited water availability for crops (Figure 2). In general, although we did not assess leaf development in Experiment 3, most of the vineyard lacked vegetative vigor. This lack of vigor possibly hindered the growth of shoots from the unlocked, former para-dormant, buds thus impeding double production. Additionally, the effect of ABA on the dormancy dynamics of several fruit crops, including grapevines is now well known [38]. ABA is considered a principal regulator of endodormancy in grapevine buds as it can reduce the expression of cell cycle genes linked to mitochondrial respiration and hence interrupt the meristematic activity [38]. Although speculative, the developing drought conditions observed in 2022 may have enhanced stress signals (including ABA) that accelerated pre-dormancy in the para-dormant bud. In addition, our approach aimed to test different pruning methods for inducing double cropping (i.e., FG5 to FG1) and hence, the applied shoot trimming was not strictly applied at the 6th node. Physiological assessment of stomatal functionality revealed two distinct trends following FG application: (1) just after trimming (DAT 0), FG treatments were characterized by a reduction in gs and ETR compared to CP, while (2) starting from DAT 15, an increase in gs was observed for FG vines. It is known that shoot topping in grapevines can induce rapid shoot-to-root signals that contribute to the negative regulation of root hydraulic conductance and hence stomatal water loss via aquaporins modulation [39], in line with our data on DAT 0. This also suggests how application of intense shoot topping techniques during warm periods may be harmful as it may impede canopy evaporative cooling. However, the stomatal compensation found starting from DAT15 (and potentially photosynthetic enhancement as shown by Gatti et al. [24]) was not able to offset the lack of available leaf area and, at harvest, °Brix and pH in FG vines was consistently lower than CP. This confirms the studies previously carried out on diversified shoot trimming/topping to slow down ripening [40,41] although no effects were observed in titratable acidity and tartaric/malic acid concentration. As for the reduction in anthocyanins, it is conceivable that FG plants (and, in particular, FG1, Figure 8C) were subjected to daily radiative overexposure as the lack of apical leaves did not allow the maintenance of an appropriate bunch shading. This led to evident sunburn damage and exacerbated or increase rate of malic acid and anthocyanin degradation. The potential usefulness of radiation-reflecting inert minerals (e.g., kaolin) in combination with severe shoot topping should be investigated [42].
5. Conclusions
Our work provided an evaluation of different pruning techniques aimed at postponing budburst, and shifting phenology and ripening in the Trento DOC basin. While delayed pruning was easily achievable and feasible in Guyot-trained vines, the effectiveness in shifting harvest dates may be minimal, especially under intense abiotic pressures. However, some preferable effects on berry quality parameters were observed consisting of the maintenance of pH and acidity for the same harvest date compared to the control pruned vines. Forcing vine regrowth exasperated the observed shifts in phenology following delayed pruning and the phenological distance with the CP was quite constant thus suggesting that moving specific phenological stages into cooler environments did not allow phenological compensation via higher GDD accumulation (as for the delayed pruning). However, this was achieved by reducing yield in a range between 60% and 80%, an unacceptable level for many viticulturists although the unique must composition achieved (extremely high titratable acidity and malic acid and YAN levels) may be of interest for specific oenological aims. Forcing double production was not possible in a year characterized by high temperatures and low water availability during vegetative growth. However, the retained primary productivity showed a typical delayed ripening chemical composition with high acidity and lower total soluble solid levels. Taken together, we provide a series of pruning approaches carried out in different varieties in the Trento DOC basin, suggesting the feasibility of some of the proposed techniques to postpone budburst phenology and amend ripening dynamics.
Author Contributions
Conceptualization, M.B. and M.F.; methodology, M.B. and M.F.; software, M.B. and M.F.; validation, M.B. and M.F.; formal analysis, M.B. and M.F.; investigation, M.B. and M.F.; resources, M.B. and M.F.; data curation, M.B. and M.F.; writing—original draft preparation, M.F.; writing—review and editing, M.B. and M.F.; visualization, M.B. and M.F.; supervision, M.B.; project administration, M.B.; funding acquisition, M.B. All authors have read and agreed to the published version of the manuscript.
Funding
This research received no external funding.
Data Availability Statement
The data used to support the findings of this study are available from the corresponding author upon request.
Acknowledgments
The author thanks Davide Debole, Alessandro Chistè, Edoardo Tamanini, Nicola Facci, and Tommaso Galvanin for the help during the field work in Experiments 1 and 2. Jacopo Fortuna is thanked for its help during the must analysis in Experiment 3.
Conflicts of Interest
The authors declare that they have no conflict of interest.
References
- Van Leeuwen, C.; Darriet, P. The impact of climate change on viticulture and wine quality. J. Wine Econ. 2016, 11, 150–167. [Google Scholar] [CrossRef]
- Alikadic, A.; Pertot, I.; Eccel, E.; Dolci, C.; Zarbo, C.; Caffarra, A.; De Filippi, R.; Furlanello, C. The impact of climate change on grapevine phenology and the influence of altitude: A regional study. Agric. For. Meteorol. 2019, 271, 73–82. [Google Scholar] [CrossRef]
- Ramos, M.C.; Yuste, J. Grapevine Phenology of White Cultivars in Rueda Designation of Origin (Spain) in Response to Weather Conditions and Potential Shifts under Warmer Climate. Agronomy 2023, 13, 146. [Google Scholar] [CrossRef]
- Venios, X.; Korkas, E.; Nisiotou, A.; Banilas, G. Grapevine responses to heat stress and global warming. Plants 2020, 9, 1754. [Google Scholar] [CrossRef]
- Guilpart, N.; Metay, A.; Gary, C. Grapevine bud fertility and number of berries per bunch are determined by water and nitrogen stress around flowering in the previous year. Eur. J. Agron. 2014, 54, 9–20. [Google Scholar] [CrossRef]
- Ferrara, G.; Mazzeo, A. Potential and Actual Bud Fruitfulness:A Tool for Predicting and Managing the Yield of Table Grape Varieties. Agronomy 2021, 11, 841. [Google Scholar] [CrossRef]
- Fraga, H.; Malheiro, A.C.; Moutinho-Pereira, J.; Santos, J.A. An overview of climate change impacts on European viticulture. Food Energy Secur. 2012, 1, 94–110. [Google Scholar] [CrossRef]
- Keller, M. Managing grapevines to optimise fruit development in a challenging environment: A climate change primer for viticulturists. Aust. J. Grape Wine Res. 2010, 16, 56–69. [Google Scholar] [CrossRef]
- Sadras, V.O.; Moran, M.A. Elevated temperature decouples anthocyanins and sugars in berries of Shiraz and Cabernet Franc. Aust. J. Grape Wine Res. 2012, 18, 115–122. [Google Scholar] [CrossRef]
- Palliotti, A.; Tombesi, S.; Silvestroni, O.; Lanari, V.; Gatti, M.; Poni, S. Changes in vineyard establishment and canopy management urged by earlier climate-related grape ripening: A review. Sci. Hortic. 2014, 178, 43–54. [Google Scholar] [CrossRef]
- Faralli, M.; Zanzotti, R.; Bertamini, M. Maintaining Canopy Density under Summer Stress Conditions Retains PSII Efficiency and Modulates Must Quality in Cabernet Franc. Horticulturae 2022, 8, 679. [Google Scholar] [CrossRef]
- Jones, J.E.; Kerslake, F.L.; Close, D.C.; Dambergs, R.G. Viticulture for sparkling wine production: A review. Am. J. Enol. Vitic. 2014, 65, 407–416. [Google Scholar] [CrossRef]
- Marcuzzo, P.; Gaiotti, F.; Lucchetta, M.; Lovat, L.; Tomasi, D. Tuning potassium fertilization to improve ph and acidity in Glera Grapevine (Vitis vinifera L.) under a Warming Climate. Appl. Sci. 2021, 11, 11869. [Google Scholar] [CrossRef]
- Buesa, I.; Caccavello, G.; Basile, B.; Merli, M.C.; Poni, S.; Chirivella, C.; Intrigliolo, D.S. Delaying berry ripening of Bobal and Tempranillo grapevines by late leaf removal in a semi-arid and temperate-warm climate under different water regimes. Aust. J. Grape Wine Res. 2019, 25, 70–82. [Google Scholar] [CrossRef]
- Intrigliolo, D.S.; Castel, J.R. Effects of irrigation on the performance of grapevine cv. Tempranillo in Requena, Spain. Am. J. Enol. Vitic. 2008, 59, 30–38. [Google Scholar] [CrossRef]
- Carlin, S.; Lotti, C.; Vrhovsek, U.; Bontempo, L.; Mattivi, F. Analysis of Trento DOC sparkling wines using comprehensive two-dimensional gas chromatography ToF-MS with HS-SPME. In Proceedings of the 38th International Symposium on Capillary Chromatography (ISCC) and 11th GCxGC Symposium, Riva del Garda, Italy, 18–23 May 2014; p. 374–K45. [Google Scholar]
- Previtali, P.; Giorgini, F.; Mullen, R.S.; Dookozlian, N.K.; Wilkinson, K.L.; Ford, C.M. A systematic review and meta-analysis of vineyard techniques used to delay ripening. Hortic. Res. 2022, 9, uhac118. [Google Scholar] [CrossRef]
- Poni, S.; Sabbatini, P.; Palliotti, A. Facing spring frost damage in grapevine: Recent developments and the role of delayed winter pruning—A review. Am. J. Enol. Vitic. 2022, 73, 211–226. [Google Scholar] [CrossRef]
- Martínez-Moreno, A.; Sanz, F.; Yeves, A.; Gil-Muñoz, R.; Martínez, V.; Intrigliolo, D.S.; Buesa, I. Forcing bud growth by double-pruning as a technique to improve grape composition of Vitis vinifera L. cv. Tempranillo in a semi-arid Mediterranean climate. Sci. Hortic. 2019, 256, 108614. [Google Scholar] [CrossRef]
- Poni, S.; Gatti, M.; Tombesi, S.; Squeri, C.; Sabbatini, P.; Lavado Rodas, N.; Frioni, T. Double cropping in Vitis vinifera L. pinot noir: Myth or reality? Agronomy 2020, 10, 799. [Google Scholar] [CrossRef]
- Lorenz, D.H.; Eichhorn, K.W.; Bleiholder, H.; Klose, R.; Meier, U.; Weber, E. Growth Stages of the Grapevine: Phenological growth stages of the grapevine (Vitis vinifera L. ssp. vinifera)—Codes and descriptions according to the extended BBCH scale. Aust. J. Grape Wine Res. 1995, 1, 100–103. [Google Scholar] [CrossRef]
- Martin, S.R.; Dunn, G.M. Effect of pruning time and hydrogen cyanamide on bud break and subsequent phenology of Vitis vinifera L. variety Cabernet Sauvignon in central Victoria. Austr. J. Grape Wine Res. 2000, 6, 31–39. [Google Scholar] [CrossRef]
- Friend, A.P.; Trought, M.C.T. Delayed winter spur-pruning in New Zealand can alter yield components of Merlot grapevines. Austr. J. Grape Wine Res. 2007, 13, 157–164. [Google Scholar] [CrossRef]
- Gatti, M.; Pirez, F.J.; Frioni, T.; Squeri, C.; Poni, S. Calibrated, delayed-cane winter pruning controls yield and significantly postpones berry ripening parameters in Vitis vinifera L. cv. Pinot Noir. Aust. J. Grape Wine Res. 2018, 24, 305–316. [Google Scholar] [CrossRef]
- Zapata, C.; Deléens, E.; Chaillou, S.; Magné, C. Partitioning and mobilization of starch and N reserves in grapevine (Vitis vinifera L.). J. Plant Physiol. 2004, 161, 1031–1040. [Google Scholar] [CrossRef]
- Moran, M.A.; Sadras, V.O.; Petrie, P.R. Late pruning and carry-over effects on phenology, yield components and berry traits in Shiraz. Aust. J. Grape Wine Res. 2017, 23, 390–398. [Google Scholar] [CrossRef]
- Petrie, P.R.; Brooke, S.J.; Moran, M.A.; Sadras, V.O. Pruning after budburst to delay and spread grape maturity. Aust. J. Grape Wine Res. 2017, 23, 378–389. [Google Scholar] [CrossRef]
- Palliotti, A.; Frioni, T.; Tombesi, S.; Sabbatini, P.; Cruz-Castillo, J.G.; Lanari, V.; Silvestroni, O.; Gatti, M.; Poni, S. Double-pruning grapevines as a management tool to delay berry ripening and control yield. Am. J. Enol. Vitic. 2017, 68, 412–421. [Google Scholar] [CrossRef]
- Dry, P. How to grow ‘cool climate’grapes in hot regions. Austr. Grapegrow. Winemak. 1987, 283, 25–26. [Google Scholar]
- Gu, S.; Jacobs, S.D.; McCarthy, B.S.; Gohil, H.L. Forcing vine regrowth and shifting fruit ripening in a warm region to enhance fruit quality in ‘Cabernet Sauvignon’ grapevine (Vitis vinifera L.). J. Hortic. Sci. Biotechnol. 2012, 87, 287–292. [Google Scholar] [CrossRef]
- Martinez, F.; Toda, J.G.; Balda, P. Preliminary results on forcing vine regrowth to delay ripening to a cooler period. Vitis 2019, 58, 17–22. [Google Scholar]
- Luchaire, N.; Rienth, M.; Romieu, C.; Nehe, A.; Chatbanyong, R.; Houel, C.; Ageorges, A.; Gibon, Y.; Turc, O.; Muller, B.; et al. Microvine: A new model to study grapevine growth and developmental patterns and their responses to elevated temperature. Am. J. Enol. Vitic. 2017, 68, 283–292. [Google Scholar] [CrossRef]
- Ugliano, M.; Henschke, P.A.; Herderich, M.J.; Pretorius, I.S. Nitrogen management is critical for wine flavour and style. Wine Ind. J. 2007, 22, 24–30. [Google Scholar]
- Hendgen, M.; Schubert, S.; Löhnertz, O. Ethephon-induced leaf senescence increases the concentration of yeast-assimilable nitrogen in grape must (Vitis vinifera cv. Riesling). Aust. J. Grape Wine Res. 2021, 27, 472–482. [Google Scholar] [CrossRef]
- Bell, S.J.; Henschke, P.A. Implications of nitrogen nutrition for grapes, fermentation and wine. Aust. J. Grape Wine Res. 2005, 11, 242–295. [Google Scholar] [CrossRef]
- Schreiner, R.P.; Scagel, C.F.; Baham, J. Nutrient Uptake and Distribution in a MaturePinot noir’Vineyard. HortScience 2006, 41, 336–345. [Google Scholar] [CrossRef]
- Gregan, S.M.; Winefield, C.; Jordan, B. Amino acid metabolism and accumulation in ‘Sauvignon Blanc’grapes-investigating berry composition in response to canopy manipulation. In Proceedings of the X International Symposium on Grapevine Physiology and Biotechnology, Verona, Italy, 13–18 June 2016; pp. 9–14. [Google Scholar]
- Vergara, R.; Noriega, X.; Aravena, K.; Prieto, H.; Pérez, F.J. ABA represses the expression of cell cycle genes and may modulate the development of endodormancy in grapevine buds. Front. Plant Sci. 2017, 8, 812. [Google Scholar] [CrossRef]
- Vandeleur, R.K.; Sullivan, W.; Athman, A.; Jordans, C.; Gilliham, M.; Kaiser, B.N.; Tyerman, S.D. Rapid shoot-to-root signalling regulates root hydraulic conductance via aquaporins. Plant Cell Environ. 2014, 37, 520–538. [Google Scholar] [CrossRef] [PubMed]
- Molitor, D.; Baron, N.; Sauerwein, T.; André, C.M.; Kicherer, A.; Döring, J.; Stoll, M.; Beyer, M.; Hoffmann, L.; Evers, D. Postponing first shoot topping reduces grape cluster compactness and delays bunch rot epidemic. Am. J. Enol. Vitic. 2015, 66, 164–176. [Google Scholar] [CrossRef]
- Lu, H.-C.; Hu, L.; Liu, Y.; Cheng, C.-F.; Chen, W.; Li, S.-D.; He, F.; Duan, C.-Q.; Wang, J. Manipulating the severe shoot topping delays the harvest date and modifies the flavor composition of Cabernet Sauvignon wines in a semi-arid climate. Food Chem. 2023, 405, 135008. [Google Scholar] [CrossRef]
- Teker, T. A study of kaolin effects on grapevine physiology and its ability to protect grape clusters from sunburn damage. Sci. Hortic. 2023, 311, 111824. [Google Scholar] [CrossRef]
Disclaimer/Publisher’s Note: The statements, opinions and data contained in all publications are solely those of the individual author(s) and contributor(s) and not of MDPI and/or the editor(s). MDPI and/or the editor(s) disclaim responsibility for any injury to people or property resulting from any ideas, methods, instructions or products referred to in the content. |
© 2023 by the authors. Licensee MDPI, Basel, Switzerland. This article is an open access article distributed under the terms and conditions of the Creative Commons Attribution (CC BY) license (https://creativecommons.org/licenses/by/4.0/).