Abstract
Understanding the transformation of accumulated phosphorus (P) is vital for P management. However, previous studies are limited to a few sites in Chinese agroecosystems. In this study, to investigate the temporal-spatial differences of transformation from accumulated P to available P (determined by the Olsen method), a dataset was assembled based on 91 national long-term experimental sites across China in the recent 31 years (1988–2018). A boosted regression tree (BRT) and a structural equation model (SEM) were used to analyze the factors influencing the transformation. The results showed that the transformation from accumulated P to available P in South China (1.97 mg kg−1) was significantly higher than that in other regions (0.69–1.22 mg kg−1). Soil properties were the main driving factors with a relative contribution of 81.8%, while climate and management practices explained 7.8% and 10.4% of the variations, respectively. Furthermore, SEM analysis revealed that the soil organic matter (SOM) could positively and directly affect the transformation, whereas the soil pH, soil silt content, and P fertilizer had negative and direct effects on it. For the first time, this study analyzed the transformation from soil accumulated P to available P at a national scale and at multiple sites and quantified the contribution of the main influencing factors. These results help to predict the soil available P content across different agroecosystems based on the input amount of P fertilizer, contributing to the regional precise management of P fertilizer application.
1. Introduction
Phosphorus (P), as an essential macronutrient element for plant growth, has an important nutritional and physiological function in agricultural systems [1]. However, the efficiency of P fertilizer utilization is often less than 25% mainly due to P transformation processes in soils including P adsorption/desorption and precipitation/dissolution [2]. In China, large amounts of fertilizer P has been increasingly applied to agricultural soils to maintain high crop yields [3,4]. However, the excessive P is fixed in soils as surplus P or lost via leaching and drainage runoff, which increases the risk of water eutrophication [5,6]. Based on the statistical data, the soil P surplus increased from 4.6 to 42.1 kg P ha−1 yr−1 between 1980 and 2012 in China’s arable land [7,8,9]. This accumulated soil P has attracted global concerns over soil P management practices [10,11]. Thus, understanding the transformation of accumulated soil P is important for the improvement of regional fertilizer P management in Chinese cropping systems.
Soil available P content transformed from accumulated soil P is one of the most important indicators of soil fertility and expected crop yields. Soil Olsen-P is one type of available P and Olsen-P content is commonly used to determine P fertilizer requirements and for environmental pollution control [12,13]. Previous studies indicated a linear correlation between the soil P surplus and soil P content [14,15,16], in which the slope of the linear regression indicates the transformation of soil Olsen-P from the accumulated P. The soil P transformation efficiency (SPTE, mg·kg−1) was often used to characterize the contribution of soil accumulated P to the increase in soil Olsen-P. In other words, the SPTE referred to the change of soil Olsen-P content when 100 kg P ha−1 was surplus in soil. As a consequence, the SPTE value reflected the ability of transformation from accumulated P to Olsen-P [14,15]. The SPTE varied greatly among regions in China, which was mainly attributed to the differences in soil properties [16], climate conditions [17], and agronomic practices [18].
Soil properties (e.g., pH, soil organic matter (SOM)) have been often considered as the primary factors affecting the SPTE [15,18,19,20]. The effect of pH on the SPTE is mainly through its influence on the P precipitation reaction or dissolution of P associated with calcium (Ca-P), iron (Fe-P), aluminum (Al-P), and other P forms [21]. The SOM is positively correlated with the SPTE because high SOMs can enhance soil Olsen-P content by increasing microbial activity and competing for adsorption to metal (hydr)oxides [14]. Temperature and precipitation are two primary climate indicators [22] that indirectly affect the SPTE by regulating the microbial activity under the P cycle and soil properties [13]. Cao et al. [16] reported that the SPTE values in the middle and lower reaches of the Yangtze River and the southwest regions were high, which was mainly attributed to the high P activation caused by favorable pH (5.5–7.0), high temperature, and precipitation. Agronomic practices (e.g., P fertilizer application, land use, crop type, and tillage) could also affect the SPTE [23,24]. Shen et al. [17] reported that the SPTE under organic manure treatment was higher than that of the chemical fertilizer treatment, which was partially due to the increase in SOC. Extra organic C could decrease the soil fixation of Fe-P and release P into the soil by low-molecular-weight organic acids [25]. Thus, the factors affecting the SPTE are highly dependent on influencing (directly, indirectly, or interactively) the turnover process of the soil P [16]. Therefore, exploring the temporal-spatial differences of the SPTE and its driving factors is crucial for developing appropriate and efficient P nutrient management practices and reducing environmental pollution in China’s croplands.
As outlined above, previous studies of SPTE were mainly based on simple qualitative analyses or a limited number of factors on a farm-size scale and over a short time period. The quantification of the contribution and interaction of these factors to the SPTE remains to be elucidated at regional and national scales. The first aim of this study was to identify the SPTE in different regions of China. The second aim was to explore the effects of climate, agricultural practices, and soil properties on the transformation of accumulated soil P. We hypothesized that the SPTE in the south region is higher than the north region. Furthermore, climate, agricultural practices, and soil properties were hypothesized to jointly effect SPTE, but soil properties play the most prominent role. To test these hypotheses, we systematically investigated the relationship between the change of soil Olsen-P and accumulated soil P in the past 31 years based on 91 national long-term monitoring sites in China. This study will provide a framework for the prediction of Olsen-P contents and the formulation of various P fertilization schemes in different regions of China.
2. Materials and Methods
2.1. Experimental Sites and Designs
The data used in this study were based on the long-term monitoring network of the Ministry of Agriculture in rural areas, with a collection over 31 years (1988–2018). A total of 91 experimental sites were selected in this study (Figure 1). Among them, 16 sites were established in 1988, 32 in 1998, and 43 in 2004. To compare the SPTE in different regions, 91 experimental sites covering 23 provinces were divided into 6 regions based on geographical locations and China’s administrative divisions [26], including northeast China (NE, n = 7, containing Jilin and Heilongjiang Provinces), the Huang-Huai-Hai region (HH, n = 18, Hebei, Shandong, and Henan Provinces), the middle and lower reaches of the Yangtze River (YR, n = 38, Jiangsu, Anhui, Fujian, Hubei, Hunan, and Guangxi Provinces), South China (SC, n = 6, Guangdong and Hainan Provinces), southwest China (SW, n = 7, Sichuan, Guizhou, Yunnan, and Chongqing Provinces), and northwest China (NW, n = 15, Xinjiang, Ningxia, Gansu, Shanxi, Shaanxi, and Qinghai Provinces).
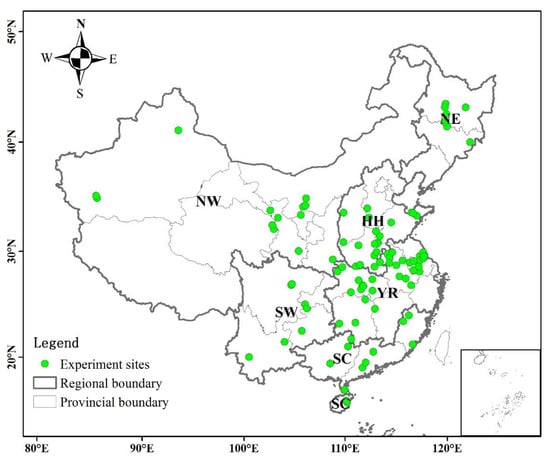
Figure 1.
Distribution of long-term fertilization experiment sites in this study (n = 91). The regional abbreviations shown are NE: northeast China; NW: northwest China; HH: Huang-Huai-Hai region; YR: middle and lower reaches of the Yangtze River; SC: South China and SW; southwest China.
The basic soil physicochemical properties of each monitoring site are shown in Table 1. The 91 experimental sites are distributed in four climatic zones: the middle temperate zone, the warm temperate zone, the subtropical zone, and the tropical zone. The planting systems include mono-cropping, double-cropping, and triple-cropping. The land-use types included paddy, upland, and paddy-upland. Wheat, corn, and rice were the main crops at most sites, while soybean, rape, cotton, green manure crops, tomato, celery, cowpea, peanut, pepper, and potato were planted at others. The designs of all experimental sites were the same, including the control (without fertilizer) and conventional fertilizer treatment (farmers’ fertilization practice). The area of each plot was no less than 334 m2. Except for the fertilizer treatment as mentioned above, all other agronomic practices were identical between the two treatments. The amount of fertilizer P applied is shown in Table 2. The drought index (DI) was calculated as follows [27]:

Table 1.
Summary of experimental site information at different regions.
Table 2.
Fertilizer P information at different regions.
2.2. Soil Sample Collection and Analysis
The soil samples (0–20 cm) of 3 replicates in every experiment site were taken in the autumn every year after harvest and before the fertilizer application. These samples were air-dried and sieved through a 2-mm sieve. The soil pH was measured with a soil/distilled water ratio of 1:2.5. The SOM content was measured by potassium dichromate oxidation (0.167 mol L−1 K2Cr2O7) method. The total nitrogen was extracted and determined by the Kjeldahl method [28]. The concentration of soil Olsen P was measured by the ascorbic acid method with 0.5 M NaHCO3 (soil/solution ratio of 1:20) [29]. The available potassium was extracted with 1.0 M NH4OAc, according to Lu [28]. The grain and straw samples of all crops were collected artificially, dried at 105 °C for 2 h, and then at 80 °C for 72 h. The weight of plants was measured. The plant concentration was measured by the molybdovanado phosphate method after being digested in concentrated H2SO4 and H2O2 [28]. The SoilGrids system (https://soilgrids.org, accessed on 20 March 2022) was used to derive the clay, silt, and sand contents in the 0–15 cm surface layer based on the site location information (longitude and latitude), with a spatial resolution of 250 m [30]. The mean annual temperature and mean annual precipitation data were calculated by collecting meteorological data in China (http://cma.gov.cn/, accessed on 20 March 2022). The soil type was classified as a Eutric Cambisol [31].
In this study, the surplus of soil P was the difference between the P applied as fertilizer (chemical and organic P fertilizer) to the soil surface and the P uptake by crops. The runoff and infiltration of P were relatively small and ignored in the calculations [14]. The equation for the soil P surplus calculation is as follows:
where PF is the P applied through P fertilizer (kg ha−1), and PC is the P removed by crops (kg ha−1). PC is calculated from:
where YG is the grain yield (kg ha−1), CG is the P content in grain (%), YS is the weight of straw (kg ha−1), and CS is the P content in straw (%).
where △Soil P surplus (kg ha−1) is the sum of the apparent P surplus and the deficit during the monitoring period.
Soil P surplus = PF − PC
PC = YG × CG + YS × CS
The change of soil Olsen-P (△AP, mg kg−1) refers to the change of test P from the beginning to the end of the monitoring period.
where APi is the soil Olsen-P content in the end year of the monitoring period, and AP0 is the soil Olsen-P content in the first year of the monitoring period.
△AP = APi − AP0
△AP and △Soil P surplus of each experimental site were fitted, and the slope of the line was the SPTE (mg kg−1), which refers to the change of soil Olsen-P content caused by 100 kg P ha−1 in surplus [15,16].
The Olsen-P content in the future year can be predicted by the current available P content, plus the increase in available P caused by P surplus. Assuming that the apparent P surplus maintains the current value, the accumulated P surplus in any year of future can be calculated. Since the increase in available P caused by the P surplus of 100 kg ha−1 is known as the SPTE, the increase in available P can be obtained according to the accumulative P surplus [15].
2.3. Statistical Analysis
To explore the temporal-spatial variations and avoid the influence of outliers in soil Olsen-P content and soil P surplus, the data were divided into six stages based on every five experimental years. The situ sets were 1988–1992 (5 years), 1993–1997 (10 years), 1998–2002 (15 years), 2003–2007 (20 years), 2008–2012 (25 years), and 2013–2018 (30 years) for 6 stages, respectively. The temporal-spatial patterns of soil Olsen-P and soil P surplus were obtained using linear regression with the least squares method in the software Origin (version 9.0). The spatial distribution of monitored sites was using the GPS coordinates and the distribution of the SPTE were based on the spatial resolution of the SPTE concentration range in the Arc-GIS 10.4.
Based on the theoretical knowledge and the existing database, a total of nine factors (DI, P fertilizer rate, land use, crop rotation, SOM, soil pH, sand, silt, and clay content) were considered to explore their relationships with SPTE. The boosted regression tree model (BRT) was used to explore the effect of climate, agricultural practices, and soil properties on the response variable (SPTE). In the BRT process, the recommended parameters (learning rate (0.01), bag fraction (0.50), cross-validation (10), and tree complexity (5)) were used in this study [32]. Because there were alphabetic variables in environment variables, the Bernoulli method was adopted for determining BRT. The relative importance of each predictor indicated a percentage of the total variations of the model in the dependent variable. The BRT analyses was executed in the GBM package of R version 3.3.3. Global Moran’s I statistic was used to evaluate the spatial structure of residuals in BRT using spdep package version 0.6-8 [33].
Structural equation modeling (SEM) was used to explore the relationship between the external environmental factors and SPTE. In the development of the initial path model, the following paths were assumed. Firstly, the five selected factors (DI, P fertilizer dosage, soil silt content, soil pH, SOM) had a direct impact on the SPTE. Second, the DI and P fertilizer dosage had a direct effect on the soil properties (soil pH, SOM). Third, the soil silt content might indirectly affect the SPTE by affecting the soil pH and SOM. Finally, all significant correlation paths were retained in the framework (Figure A1). SEM analysis was based on the acceptance of the zero hypotheses (p ≤ 0.05). The comparison between model-implied variance and covariance matrix was conducted using the maximum likelihood estimation method with software AMOS 17.0 (IBM SPSS Inc., Chicago, IL, USA). The overall goodness-of-fit of the model was evaluated with the p-value (0.05 < p < 1.00 indicates no statistical difference between the covariance matrices produced by the model fits and the observed covariance matrices) and the root mean square error of approximation (RMSEA) (<0.05 indicates an ideal fit) [34].
3. Results
3.1. Temporal-Spatial Changes in Soil Olsen-P and P Surplus
The soil Olsen-P content was significantly increased (p < 0.01) in the recent 31 years (Figure 2a, Figure A2a). The average soil Olsen-P content in 2013–2018 reached 28.92 mg kg−1, which was 86.0% higher than that in 1988–1992 (15.56 mg kg−1). The average growth rate was 0.45 mg kg−1 yr−1. The soil Olsen-P content in South China and southwest China was significantly higher than those in other regions in the same period (Figure 3). The increased rate of soil Olsen-P content (mg kg−1 yr−1) in different regions is ordered as: southwest China (0.99) > Huang-Huai-Hai region (0.68) > middle and lower reaches of the Yangtze River (0.56) > South China (0.41) > northeast China (0.29) > northwest China (0.28).
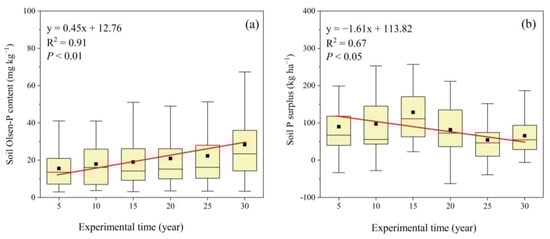
Figure 2.
Soil Olsen-P content (a) and soil P surplus (b) over time under 91 long-term fertilization experiments from 1988 to 2018. The black line and dot, lower and upper edges and bars represent median and mean values, 25th and 75th, and 5th and 95th percentiles of all data, respectively. Probability levels < 0.05 were considered as statistically significant.
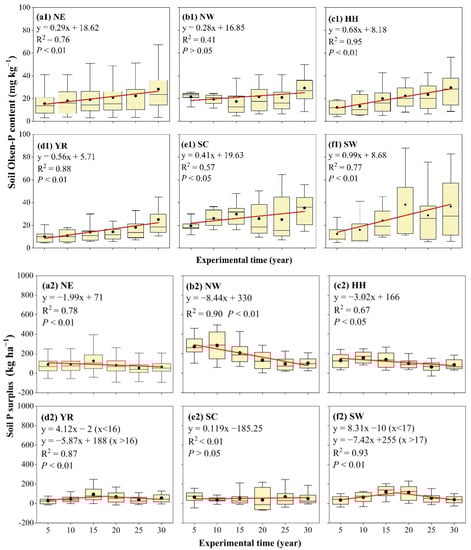
Figure 3.
The temporal-spatial patterns of soil Olsen-P content and apparent soil P surplus across Chinese cropping systems from 1988 to 2018. Regional abbreviations are as in Figure 1. Probability levels < 0.05 were considered as statistically significant.
The soil apparent P surplus showed a significant decreased trend (p < 0.05) in the recent 31 years at the national scale (Figure 2b, Figure A2b), while the accumulated P surplus significantly increased (Figure A3). The soil apparent P surplus varied greatly among regions. It was higher in northwest China and the Huang-Huai-Hai region compared with other areas (Figure 3, Table 2). Furthermore, the decreased rates in northeast China, northwest China, and Huang-Huai-Hai region were −1.99, −8.44, and −3.02 kg ha−1 yr−1, respectively, whereas the soil apparent P surplus in the middle and lower reaches of the Yangtze River and southwest China regions fist increased and then decreased.
3.2. Temporal-Spatial Variation of SPTE and Its Driving Factors
There was significant spatial heterogeneity in the SPTE (Figure 4a). The SPTE and drought index showed a significant positive linear correlation (p < 0.01, Figure 4b). The SPTE in South China (1.97 mg kg−1) was significantly higher than those in northeast China (1.22 mg kg−1), southwest China (1.12 mg kg−1), the middle and lower reaches of the Yangtze River (1.04 mg kg−1), the Huang-Huai-Hai region (0.99 mg kg−1), and northwest China (0.69 mg kg−1) (Figure 4c).
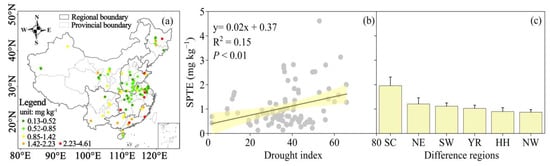
Figure 4.
The spatial pattern of national SPTE (a), the relationship between SPTE and drought index (b), and SPTE at regional scale (c) across Chinese cropping systems. Regional abbreviations are as in Figure 1.
The highest SPTE (1.36 mg kg−1) was observed when the soil pH was in the range of 5.5–6.5 compared to other pH ranges of 4.5–5.5, 6.5–7.5, and 7.5–8.5 (Figure 5a). The SPTE (1.65 mg kg−1) was significantly higher when the SOM was more than 30 g kg−1, compared with the cases when the SOM was between 15 and 30 g kg−1 or lower than 15 g kg−1 (Figure 5b). The SPTE of clay soils (1.44 mg kg−1) was significantly higher compared with sandy and silty soils (Figure 5c). For agricultural practices, the SPTE (1.38 mg kg−1) in the paddy field was substantially higher than the upland and paddy upland rotation (Figure 5d). There was no significant difference in the SPTE among the different cropping systems (mono-cropping, double-cropping, and triple-cropping) (Figure 5e).
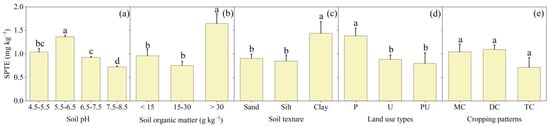
Figure 5.
The differences of SPTE under various soil pH values (a), SOMs (b), soil textures (c), land use types (d), and cropping patterns (e). P, U, and P-U are paddy, upland, and paddy-upland, respectively. MC, DC, and TC are mono-cropping, double-cropping, and triple-cropping, respectively. Different lowercase letters indicate significant differences (p < 0.05) under various soil pH, SOM, soil texture, land use types, and cropping patterns.
The BRT results showed that the climate (drought index), agricultural practices (P fertilizer, land use, and cropping patterns), and soil properties (SOM, soil pH, and soil texture) jointly drive the variation of the SPTE (Figure 6a). The soil properties were the main driving factors, with a relative contribution of 81.8%, while the climate and agronomic practices accounted for 7.8% and 10.4% of the variation, respectively. The BRT model driven by the above variables explained 71% of the variation of the SPTE (Figure 6b).
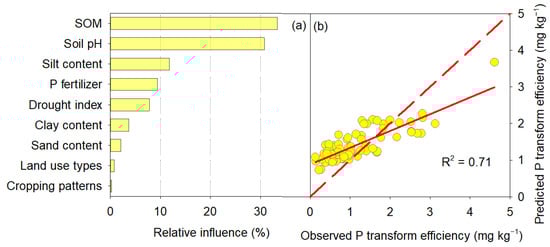
Figure 6.
The relative contributions (%) of climate (drought index), soil properties (soil pH, SOM, and soil texture) and management practices (P fertilizer input, land use types, and cropping patterns) to SPTE, estimated by the boosted regression tree (BRT) model (a). The observed SPTE and those predicted by the boosted regression tree model using various predictors are shown in (b). The dotted line indicates the 1:1 line.
Through SEM analysis, we constructed different pathways of the aforementioned variables on the variation of the SPTE (Figure 7). The soil pH, soil silt content, and P fertilizer amount had negative and direct effects on the SPTE, with path coefficients of −0.42, −0.27, and −0.25, respectively. SOM could positively and directly affect the SPTE, and the path coefficients were 0.43. The drought index could indirectly affect the SPTE by regulating the SOM, silt content, and pH. The P fertilizer amount also indirectly affected the SPTE by regulating SOM. In general, soil properties, agricultural practices, and climate together accounted for 64% of the variation of SPTE.
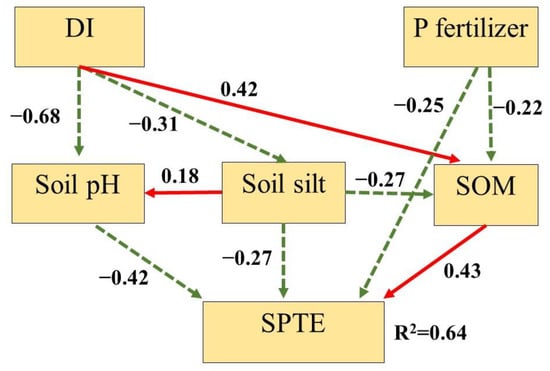
Figure 7.
Path analysis results on the direct and indirect effects of DI, soil pH, SOM, soil silt content, and P fertilizer input on SPTE in 91 long-term fertilization experimental sites across Chinese cropping systems (chi/df = 1.36, P = 0.43; RMSEA = 0.05). DI is drought index. The number indicates the path coefficients. The solid and dashed lines indicate significant positive and negative effects, respectively.
4. Discussion
4.1. Temporal-Spatial Differences of Soil Olsen-P and P Surplus
Our study showed an increasing trend in the Olsen-P content with a slope of 0.45 mg kg−1 yr−1 (0.29–0.99 mg kg−1 yr−1) based on a linear model from 1988 to 2018 in Chinese croplands, which was mainly related to the high input of P fertilizer in recent years. Our results were similar to the findings in previous studies [5,8,9], which showed an annual increase rate of 0.17–1.09 mg kg−1 in the soil Olsen-P content during the past 30 years. In comparison with other regions, the soil Olsen-P content rapidly increased in southwest China mainly due to the higher fertilizer input and lower crop P removal [9]. There was a low increase in the Olsen-P content over time in northwest region and northeast region, which was partially attributed to the low temperature, high pH, and low SOC content [16] (Table A1).
The decreasing trend in the apparent P surplus in our study was highly relevant to the lower P fertilizer (Figure A4) and the increased crop P uptake due to improved yield (Figure A5). What is more, the fertilizer P utilization efficiency, resulting from the improvements in fertilization technology, an increased use of more efficient mechanized fertilization methods, and the increased application of organic P fertilizer [8,35,36], played important roles. The apparent P surplus in the northeast, northwest, and Huang-Huai-Hai regions decreased over time, whereas it increased first and then decreased in the middle and lower reaches of the Yangtze River and southwest regions. The spatial differences of the soil P surplus were mainly related to the regional differences in fertilizer input, soil and climate conditions, and economic development [7,9] (Table A1 and Table A2).
4.2. SPTE and Its Influencing Factors
The relationship of the P surplus and Olsen-P content was defined as the SPTE in our study for evaluating P use efficiency and providing a basis for P management. In the recent 31 years, the SPTE value of South China (1.97 mg kg−1) was significantly higher than in other regions (0.69–1.22 mg kg−1). Our results of SPTE were lower than the values (1.44–16.04 mg kg−1) in previous studies [14,16,17,37]. This is partially due to the fact that the SPTE values were related to P fertilizer management in these earlier studies, where the order of influence was: chemical P fertilizer combined with organic fertilizer > chemical P fertilizer > no P fertilizer [14,16,17]. In our study, the chemical P fertilizer application was the dominant fertilizer type (Table 2), while the previous studies were mostly based on combined organic-inorganic fertilization. In addition, the difference of the SPTE may be related to P test methods. For example, the SPTE value was 0.16 mg L−1 in Messiga et al. [38], based on water-soluble P in Canada, which was significantly lower than that obtained from the Olsen-P method. Another possibility is that the P runoff may occur at the slopping sites, especially those with heavy rainfall during the growing season. Thus, the P surplus may be overestimated in these regions, which leads to an underestimated SPTE.
In the present study, soil properties have been identified as the main driving factors on SPTE, which is consistent with previous studies [17,39]. The SOM and pH explained 33.6% and 31.6% of the variation in the SPTE, respectively (Figure 6a). The SOM was positively correlated with the SPTE, which may be due to SOM reductions in P adsorption to competing adsorption sites by its provision of alternative organic anions and/or a SOM contribution to mineral-P dissolution by its content low-molecular-weight organic acids [40]. Thus, the “promoting P with carbon” technique could be adopted for soils with a low SOM content by increasing the input of organic fertilizers, biochar, or similar practices [41,42]. In contrast, the amount of P fertilizer should be reduced in the soils that contains high SOM content to avoid P leaching and runoff [43]. The effect of soil pH on the SPTE mainly depends on the chemical adsorption and precipitation/dissolution process of P [44]. Based on our results, the highest SPTE was observed in the pH of 5.5–6.5, which was found in the soils of South China (Table 1), and then the SPTE decreased when soil pH changed from 5.5–6.5 to 4.5–5.5, which was partially due to the increase in fixation by iron [45,46]. Additionally, the SPTE decreased when the soil pH changed from 6.5 to 8.5. This could be attributed to the increased fixation by calcium [21]. Therefore, the application of acidic fertilizers or conditioners (e.g., low molecular weight organic acids, humic acids) could be feasible practices to reduce the pH and increase the SPTE in the northern alkaline regions of China [44,47], whereas the addition of lime has been recommended as a means to increase the SPTE in southern regions with low soil pH [48]. Through the above measures, the SPTE and P use efficiency were increased, culminating in reductions in the P fertilizer input and P surplus.
Climate had an impact on the SPTE (contributes 7.8% of the variation), which is consistent with the findings in Shen et al. [17] and Hou et al. [22]. The drought index was used to combine the two climate indicators of temperature and rainfall, which is more conducive to the formulation of guidelines for P fertilizer usage in different regional climates [49]. The drought index was seen to indirectly influence the SPTE by regulating SOM, soil texture, and pH [22,50].
The fertilizer P application had a direct negative effect on the SPTE and an indirect pathway via its negative effect on SOM (Figure 7). By contrast, previous studies have reported a positive correlation between organic P fertilizer usage and SOM content [16,43]. This can possibly be attributed to the focus of our study on the impacts of the long-term application of chemical P fertilizers on SPTE. Continuous chemical P application may significantly decrease the activity of microorganisms, the concentrations of microbial residues, and their contributions to SOM accumulation [51].
The highest SPTE (1.97 mg kg−1) in our study was found in South China soils (Figure 4a,c), which may be attributed to the high SOM content, low pH, low silt content, and high drought index (Table 1, Table A1 and Table A2). Although the BRT and SEM models showed that the interpretation rates of the influencing factors on the SPTE were 71% and 64%, respectively, other important factors including soil sampling depth, soil tillage, topography, and oxalate-extractable Fe/Al (Fe/Al oxides) should be considered in future work [52,53]. For example, the soil sampling depth and soil tillage can also affect SPTE. The soil sampling depth in this research was 0–20 cm for soil Olsen-P determination. Messiga et al. [54] reported that the SPTE at 0–5 cm, 0–10 cm, and 0–15 cm was higher than that in 0–20 cm samples. Compared with tilling by the moldboard plough, no-tillage is more conducive to the accumulation of Mehlich-3 P and Olsen-P [52]. Stratification produces high concentrations of P at the soil surface (0–5 cm) but decreases the concentrations in deeper soil layers [55]. Topography influences the soil available P and SPTE because it affects the runoff, drainage, soil temperature, soil erosion, and soil formation [56]. Additionally, oxalate-extractable Fe/Al (Fe/Al oxides) have been proven to generally play a dominant role in controlling the dynamics of phosphate ions in acidic and non-acidic soils [57]. In BRT and SEM analysis, we integrated the influencing factors of the SPTE across regions. Thus, the main driving factors that affected the mechanism of soil P process were concluded at the national level, but they might be different among regions. This needs to be further investigated when more data are available at the regional level.
4.3. Recommendation of P Fertilizer Based on SPTE
The goal of P management is to ensure an optimum crop yield without causing environmental risks by keeping the Olsen-P content in the range between the agronomic threshold and environmental threshold [12]. Several studies have evaluated the dose and rate of P fertilizer usage in China, mainly based on high yield and high P use efficiency [8], changes in soil Olsen-P [16], or a combination of changes in Olsen-P and agronomic threshold [15]. In this study, the SPTE was used to estimate the soil Olsen-P and establish recommendations for P fertilizer usage based on the agronomic and environmental thresholds. Previous studies showed that the agronomic threshold varied in crops ranging from 11.1 to 28.2 mg kg−1, and the environmental threshold was 40–52 mg kg−1 in Chinese agricultural systems [12,13,58]. In this study, the Olsen-P contents in most regions exceeded the agronomic threshold (Table A3). For example, during the period 2013–2018, the South China region had a high soil Olsen-P content of 37.39 mg kg−1 and a high SPTE of 1.97 mg kg−1 (Figure 3, Table 2), which was close to the environmental threshold [12]. Our results were consistent with Zhou et al. [59], which pointed out that uplands in eastern and southern China had a high risk for elevated soil P loss, particularly, in Guangdong, Fujian, and Zhejiang provinces. The high soil Olsen-P content increased the risk of water eutrophication, which would damage the fishing industry and may pose a serious health hazard to humans [60].
Thus, more attention to the environmental threshold of Olsen-P is required to prevent environmental pollution. The future Olsen-P content in soils can be predicted based on the SPTE, the current P application rate, and the P surplus. In this study, the soil Olsen-P contents in South China and the southwest China regions were relatively high and are predicted to reach the environmental threshold in 4.6–16.1 and 7.5–34.1 years, respectively (Table A3), if the current P fertilizer practices are maintained. Xi et al. [13] also reported that the soil Olsen-P content in northern China would reach the environmental critical P value in 5–41 years, depending on the fertilizer P management procedure utilized. Although the time to reach the critical value is given in this and other studies, such boundaries are hard to predict, and the negative effects may become manifest before the thresholds are crossed. Once the soil Olsen-P content exceeds the environmental threshold, it takes a longer time to return below the environmental threshold [11,61]. Therefore, it is urgent to improve P use efficiency and reduce the fertilizer P amount in the regions which have high potential environmental risks. Overall, the SPTE driving factors based on 91 long-term experimental sites across China, which covers various soil types, climate conditions, and cropping systems, could provide a reference for fertilizer P management in other regions or countries.
5. Conclusions
Based on 91 long-term monitoring sites across Chinese cropping systems, the temporal-spatial patterns of the soil P transformation efficiency (SPTE) were investigated. The SPTEs presented significant regional differences and the highest value of SPTE was found in South China. Based on the BRT and SEM models, thDistribution of long-term fertilization e study confirmed that soil properties, agronomic practices, and climate comprehensively affect SPTE, among which soil properties were the main driving factors with a relative contribution of 81.8%. With regard to the soil properties, the SOM and pH were two vital indicators influencing SPTE, which were mainly due to their impacts on P adsorption/desorption and precipitation/dissolution. These results suggest that the highest SPTE of South China may be attributed to the high SOM, low pH, low silt content, and high drought index. Therefore, for different regions of the world, the SOM and soil pH should be considered firstly for P fertilizer recommendation. In this study, the experimental sites’ distribution did not cover all provinces, which may lead to the uncertainty in the SPTE predication when scaling up from site to region. Additional influencing factors on the SPTE need to be further investigated, including soil tillage, sampling depth, topography, and oxalate-extractable Fe/Al (Fe/Al oxides) in a long-term period. This study suggests that the SPTE can be used to estimate the time when each region will reach the agronomic threshold or environmental threshold of Olsen-P. The SPTE driving factors in this study included various soil types, climate conditions, and cropping systems, which could provide a useful reference for improving P management practices to other regions or countries.
Author Contributions
Conceptualization, S.Z.; methodology, Y.C.; software, W.H.; validation, N.A.A., Y.R. and X.Q.; formal analysis, Y.C.; investigation, N.G.; resources, Y.R. and X.Q.; data curation, S.Z.; writing—original draft preparation, Y.C.; writing—review and editing, Y.C. and N.G.; visualization, W.H.; supervision, S.Z.; project administration, S.Z.; funding acquisition, S.Z. All authors have read and agreed to the published version of the manuscript.
Funding
This research was funded by the National Key Research and Development Program of China (2021YFD1500205) and the National Natural Science Foundation of China (41977103).
Institutional Review Board Statement
Not applicable.
Informed Consent Statement
Not applicable.
Data Availability Statement
The data sets generated and/or analyzed during the current study are available from the corresponding author upon reasonable request.
Acknowledgments
The authors would like to thank the financial support by the National Key Research and Development Program of China (2021YFD1500205) and the National Natural Science Foundation of China (41977103).
Conflicts of Interest
The authors declare no conflict of interest.
Appendix A
Table A1.
Detailed information of field experimental sites.
Table A1.
Detailed information of field experimental sites.
| Site Number | Region | Province | Longitude | Latitude | Yield of Main Crops (kg ha−1) | Soil Properties | ||||||||
|---|---|---|---|---|---|---|---|---|---|---|---|---|---|---|
| Wheat | Maize | Rice | pH | SOM 1 (g/kg) | AK 2 (mg/kg) | Clay (%) | Silt (%) | Sand (%) | Soil Texture | |||||
| 1 | NE 3 | Jilin | 126.5 | 44.8 | 8940 | 6.57 | 30.56 | 25 | 50 | 25 | Loam | |||
| 2 | NE | Jilin | 129.1 | 42.8 | 7350 | 5.93 | 40.48 | 157.07 | 20 | 41 | 39 | Loam | ||
| 3 | NE | Heilongjiang | 126.8 | 46 | 9600 | 6.64 | 33.75 | 265.02 | 31 | 53 | 16 | Silty clay loam | ||
| 4 | NE | Heilongjiang | 126.3 | 45.3 | 9780 | 6.73 | 27.63 | 174.84 | 26 | 42 | 32 | Loam | ||
| 5 | NE | Heilongjiang | 127 | 47 | 7725 | 6.35 | 36.97 | 184.69 | 32 | 49 | 19 | Silty clay loam | ||
| 6 | NE | Heilongjiang | 126.8 | 46.7 | 8100 | 6.29 | 37.29 | 165.37 | 32 | 49 | 19 | Silty clay loam | ||
| 7 | NE | Heilongjiang | 129.7 | 46.2 | 8970 | 7380 | 6.31 | 30.29 | 195.77 | 29.6 | 41 | 29.4 | Clay loam | |
| 8 | HH | Hebei | 114.4 | 37.2 | 4695 | 6375 | 8.06 | 16.81 | 98.43 | 20 | 43 | 37 | Loam | |
| 9 | HH | Hebei | 114.3 | 38.1 | 6075 | 7095 | 8.00 | 20.63 | 123.80 | 17 | 47 | 36 | Loam | |
| 10 | HH | Shandong | 117.1 | 36.5 | 6720 | 9195 | 7.76 | 15.58 | 137.55 | 22 | 47 | 15 | Loam | |
| 11 | HH | Shandong | 115.5 | 35.3 | 6000 | 6945 | 8.04 | 12.93 | 127.83 | 19 | 50 | 31 | Loam | |
| 12 | HH | Shandong | 120.4 | 36.8 | 6510 | 7950 | 7.04 | 14.42 | 114.64 | 22.3 | 33.1 | 44.6 | Loam | |
| 13 | HH | Shandong | 119.8 | 37.2 | 2880 | 4650 | 5.51 | 8.72 | 72.90 | 23 | 35.2 | 41.8 | Loam | |
| 14 | HH | Shandong | 120 | 37.1 | 2940 | 5220 | 5.22 | 8.67 | 70.01 | 23 | 35.2 | 41.8 | Loam | |
| 15 | HH | Henan | 112.3 | 32.6 | 6555 | 6840 | 6.68 | 15.44 | 126.45 | 29 | 44 | 27 | Clay loam | |
| 16 | HH | Henan | 114.1 | 31.2 | 6795 | 5.85 | 21.32 | 92.34 | 30 | 52 | 18 | Silty clay loam | ||
| 17 | HH | Henan | 114.5 | 32.4 | 5850 | 5.48 | 14.14 | 70.42 | 32.3 | 50.4 | 17.3 | Silty clay loam | ||
| 18 | HH | Henan | 112.8 | 34.6 | 4965 | 5475 | 7.97 | 15.67 | 134.30 | 19.7 | 48.3 | 32 | Loam | |
| 19 | HH | Henan | 114.6 | 33.5 | 7605 | 6780 | 6.78 | 17.37 | 156.24 | 31 | 51.3 | 17.7 | Silty clay loam | |
| 20 | HH | Henan | 115.2 | 34.7 | 5235 | 8.04 | 8.37 | 66.39 | 18.8 | 47.9 | 33.3 | Loam | ||
| 21 | HH | Henan | 115.1 | 34.6 | 6360 | 7080 | 8.17 | 12.76 | 81.71 | 18.8 | 47.9 | 33.3 | Loam | |
| 22 | HH | Henan | 114.9 | 33.8 | 6285 | 6120 | 7.95 | 17.02 | 172.29 | 26.7 | 49.1 | 24.2 | Loam | |
| 23 | HH | Henan | 112.8 | 32.7 | 6285 | 5445 | 6.35 | 14.99 | 133.31 | 35.7 | 29.8 | 34.5 | Clay loam | |
| 24 | HH | Henan | 115.1 | 35.8 | 6465 | 8145 | 8.21 | 14.24 | 86.57 | 23.5 | 46.4 | 30.1 | Loam | |
| 25 | HH | Henan | 114.8 | 34.6 | 6360 | 7395 | 8.45 | 9.77 | 79.17 | 19.6 | 50.5 | 29.9 | Silty loam | |
| 26 | YR | Jiangsu | 119.7 | 31.4 | 5625 | 9060 | 5.76 | 25.54 | 92.88 | 29 | 53 | 18 | Silty clay loam | |
| 27 | YR | Jiangsu | 119.7 | 31.9 | 5265 | 8670 | 6.62 | 21.03 | 104.15 | 28 | 57 | 15 | Silty clay loam | |
| 28 | YR | Guangxi | 110.8 | 24.8 | 5910 | 6.95 | 56.36 | 109.81 | 29 | 38 | 33 | Loam | ||
| 29 | YR | Jiangsu | 120 | 32.9 | 5820 | 9345 | 6.93 | 20.08 | 121.03 | 27 | 56 | 17 | Silty loam | |
| 30 | YR | Jiangsu | 120.5 | 33.2 | 6075 | 9705 | 8.09 | 17.21 | 137.45 | 27 | 53 | 20 | Silty clay loam | |
| 31 | YR | Anhui | 116.2 | 33.5 | 6465 | 6552 | 7.10 | 16.30 | 139.41 | 43.1 | 45.5 | 11.4 | Silty clay | |
| 32 | YR | Anhui | 116.4 | 33.1 | 6735 | 7590 | 6.46 | 19.26 | 124.23 | 25 | 47 | 28 | Loam | |
| 33 | YR | Anhui | 117.9 | 32.7 | 5415 | 7650 | 6.28 | 20.49 | 109.17 | 29 | 49 | 22 | Clay loam | |
| 34 | YR | Anhui | 118 | 30.9 | 7830 | 7.64 | 27.70 | 91.94 | 35.8 | 47.3 | 16.9 | Silty clay loam | ||
| 35 | YR | Fujian | 117.8 | 27.3 | 7785 | 5.18 | 40.04 | 81.58 | 29.6 | 27.4 | 43 | Sandy clay loam | ||
| 36 | YR | Fujian | 117.1 | 26.8 | 7260 | 5.26 | 41.71 | 107.36 | 32 | 37 | 31 | Clay loam | ||
| 37 | YR | Hubei | 110.1 | 32.2 | 4050 | 5625 | 6.64 | 14.88 | 115.17 | 21 | 41 | 38 | Loam | |
| 38 | YR | Hubei | 114 | 30.1 | 6210 | 6900 | 6.91 | 28.34 | 98.54 | 26 | 52 | 22 | Silty loam | |
| 39 | YR | Hubei | 112.9 | 30.7 | 2850 | 7.23 | 21.66 | 137.34 | 29.9 | 38.3 | 31.8 | Clay loam | ||
| 40 | YR | Hubei | 112.7 | 30.3 | 3510 | 7815 | 7.32 | 19.57 | 86.90 | 27 | 46 | 27 | Loam | |
| 41 | YR | Jiangsu | 119 | 31.6 | 4770 | 8340 | 6.17 | 25.84 | 114.77 | 35.4 | 47.6 | 17 | Silty clay loam | |
| 42 | YR | Jiangsu | 118.7 | 32.4 | 5310 | 8565 | 6.47 | 22.39 | 111.28 | 32.7 | 49.9 | 17.4 | Silty clay loam | |
| 43 | YR | Jiangsu | 119.2 | 32.5 | 5490 | 7830 | 6.22 | 18.44 | 78.64 | 31.7 | 53.7 | 14.6 | Silty clay loam | |
| 44 | YR | Jiangsu | 120 | 32.5 | 6300 | 8640 | 7.34 | 20.92 | 73.16 | 25.5 | 54.6 | 19.9 | Silty loam | |
| 45 | YR | Jiangsu | 120.4 | 32.6 | 6405 | 9180 | 7.58 | 33.17 | 105.11 | 20 | 56.5 | 23.5 | Silty loam | |
| 46 | YR | Jiangsu | 120.5 | 32.8 | 5985 | 4920 | 9825 | 8.00 | 16.00 | 74.32 | 26.1 | 57.2 | 16.7 | Silty loam |
| 47 | YR | Anhui | 116.8 | 33.6 | 6885 | 7410 | 6.84 | 19.34 | 219.40 | 35.3 | 49.4 | 15.3 | Silty clay loam | |
| 48 | YR | Anhui | 116.3 | 32.6 | 6915 | 6300 | 6.09 | 14.05 | 152.38 | 35.1 | 45.9 | 19 | Silty clay loam | |
| 49 | YR | Anhui | 115.2 | 32.8 | 7890 | 8310 | 6.08 | 16.95 | 155.47 | 35 | 54 | 11 | Silty clay loam | |
| 50 | YR | Anhui | 117.1 | 32.3 | 5715 | 7590 | 6.33 | 13.80 | 99.67 | 27.5 | 56.2 | 16.3 | Silty loam | |
| 51 | YR | Anhui | 117.3 | 31.2 | 6825 | 5.69 | 20.41 | 79.09 | 37.4 | 49.6 | 13 | Silty clay loam | ||
| 52 | YR | Anhui | 118.5 | 30.2 | 7725 | 5.86 | 37.80 | 54.93 | 25.7 | 28.9 | 45.4 | Sandy clay loam | ||
| 53 | YR | Fujian | 117.8 | 24.4 | 6870 | 5.78 | 39.89 | 172.07 | 32.5 | 33 | 34.5 | Clay loam | ||
| 54 | YR | Hubei | 111.5 | 30.1 | 3390 | 7140 | 7.21 | 20.47 | 184.09 | 25.9 | 41.4 | 32.7 | Loam | |
| 55 | YR | Hubei | 112.5 | 31.2 | 4395 | 8970 | 6.83 | 24.35 | 114.98 | 26.6 | 37 | 36.4 | Loam | |
| 56 | YR | Hubei | 110.7 | 32.6 | 3225 | 5475 | 6.81 | 15.83 | 107.39 | 35.8 | 38.6 | 25.6 | Clay loam | |
| 57 | YR | Hubei | 113 | 30.6 | 8460 | 6.43 | 31.67 | 84.52 | 30 | 37.3 | 32.7 | Clay loam | ||
| 58 | YR | Hunan | 114.1 | 28.3 | 6540 | 5.31 | 33.91 | 73.70 | 27.8 | 35.7 | 36.5 | Loam | ||
| 59 | YR | Hunan | 111.8 | 27.1 | 5805 | 4.77 | 18.29 | 200.58 | 36 | 39.8 | 24.2 | Clay loam | ||
| 60 | YR | Hunan | 113.1 | 29.3 | 6375 | 5.72 | 30.97 | 52.35 | 31.4 | 41.3 | 27.3 | Clay loam | ||
| 61 | YR | Hunan | 111.2 | 25.5 | 6315 | 5.93 | 42.33 | 63.73 | 21.9 | 31.2 | 46.9 | Loam | ||
| 62 | YR | Hunan | 110 | 27.1 | 7890 | 5.17 | 40.49 | 74.19 | 29.3 | 46.4 | 24.3 | Clay loam | ||
| 63 | YR | Guangxi | 108.8 | 23.2 | 5700 | 5.63 | 44.85 | 72.27 | 39.7 | 46 | 14.3 | Silty clay loam | ||
| 64 | SC | Guangdong | 110.2 | 20.5 | 5910 | 6.77 | 75.78 | 71.71 | 40 | 27 | 33 | Clay loam | ||
| 65 | SC | Guangdong | 112.2 | 22.6 | 5655 | 5.45 | 42.36 | 65.20 | 24 | 36 | 40 | Loam | ||
| 66 | SC | Guangdong | 113.5 | 24.1 | 6060 | 4.98 | 46.66 | 67.73 | 28.8 | 25.7 | 45.3 | Sandy clay loam | ||
| 67 | SC | Guangdong | 112.6 | 23.1 | 7500 | 5.49 | 33.56 | 107.91 | 30.3 | 48.1 | 21.6 | Clay loam | ||
| 68 | SC | Hainan | 110.4 | 19.2 | 6570 | 5.38 | 28.31 | 50.41 | 35.3 | 30.8 | 33.9 | Clay loam | ||
| 69 | SC | Hainan | 110.3 | 19.4 | 5835 | 5.52 | 28.78 | 60.39 | 35.3 | 30.8 | 33.9 | Clay loam | ||
| 70 | SW | Sichuan | 104.6 | 31 | 2985 | 3810 | 6.58 | 10.30 | 61.52 | 30 | 47 | 23 | Clay loam | |
| 71 | SW | Sichuan | 104.7 | 31.1 | 3315 | 4065 | 8.06 | 15.94 | 113.35 | 30 | 47 | 23 | Clay loam | |
| 72 | SW | Guizhou | 105.8 | 26.5 | 5535 | 5400 | 7.23 | 32.03 | 86.80 | 38 | 41 | 21 | Clay loam | |
| 73 | SW | Yunnan | 103.9 | 25.4 | 2265 | 7365 | 5.65 | 42.67 | 152.46 | 37.2 | 38.4 | 24.4 | Clay loam | |
| 74 | SW | Yunnan | 100.1 | 23.8 | 8235 | 5.56 | 78.08 | 186.29 | 30 | 39.5 | 30.5 | Clay loam | ||
| 75 | SW | Chongqing | 106.2 | 29.1 | 7215 | 5.14 | 25.66 | 146.46 | 25.6 | 35.3 | 39.1 | Loam | ||
| 76 | SW | Chongqing | 106.4 | 28.7 | 7065 | 6.88 | 30.79 | 147.28 | 25.6 | 35.3 | 39.1 | Loam | ||
| 77 | NW | Xinjiang | 79.9 | 37 | 5715 | 5880 | 8.21 | 12.46 | 159.46 | 19 | 43 | 38 | Loam | |
| 78 | NW | Xinjiang | 79.7 | 37.2 | 5550 | 5895 | 8.27 | 13.21 | 162.68 | 22.8 | 42.3 | 34.9 | Loam | |
| 79 | NW | Gansu | 101.9 | 38.2 | 7470 | 8.35 | 19.68 | 314.06 | 16 | 42 | 42 | Sandy loam | ||
| 80 | NW | Gansu | 102.9 | 37.5 | 6000 | 6645 | 8.61 | 8.13 | 120.07 | 15 | 47 | 38 | Loam | |
| 81 | NW | Ningxia | 106.5 | 39.4 | 5040 | 9945 | 8.33 | 17.66 | 213.49 | 20 | 55 | 25 | Silty loam | |
| 82 | NW | Ningxia | 105.8 | 37.8 | 5595 | 8355 | 9675 | 8.30 | 12.97 | 116.78 | 19 | 47 | 24 | Loam |
| 83 | NW | Xinjiang | 88.6 | 45.1 | 4890 | 8310 | 7.50 | 21.21 | 240.29 | 28 | 45 | 27 | Loam | |
| 84 | NW | Ningxia | 106.1 | 38.6 | 13,095 | 8850 | 8.30 | 19.38 | 142.57 | 26.8 | 43 | 30.2 | Loam | |
| 85 | NW | Ningxia | 106.4 | 38.7 | 8955 | 8.23 | 22.09 | 187.63 | 26.8 | 43 | 30.2 | Loam | ||
| 86 | NW | Shanxi | 110.98 | 35.02 | 4710 | 6090 | 8.61 | 13.38 | 123.61 | 20 | 44 | 36 | Loam | |
| 87 | NW | Gansu | 105.5 | 34.3 | 4680 | 8490 | 8.25 | 12.35 | 113.69 | 18 | 47 | 35 | Loam | |
| 88 | NW | Qinghai | 102.4 | 36.4 | 2745 | 8.34 | 11.88 | 198.76 | 18 | 46 | 36 | Loam | ||
| 89 | NW | Qinghai | 102.2 | 36.8 | 4095 | 8.15 | 20.50 | 133.45 | 20 | 45 | 35 | Loam | ||
| 90 | NW | Shaanxi | 109.6 | 33.4 | 4020 | 5745 | 7.85 | 16.50 | 135.87 | 19.6 | 47.6 | 32.8 | Loam | |
| 91 | NW | Shanxi | 111.23 | 37.88 | 7080 | 8.25 | 9.13 | 139.50 | 14 | 43 | 43 | Loam | ||
1 SOM: soil organic matter, g·kg−1. 2 AK: available potassium, mg·kg−1. 3 NE: northeast China, HH: Huang-Huai-Hai region, YR: middle and lower reaches of the Yangtze River, SC: South China, SW: southwest China, NW: northwest China.
Table A2.
Detailed information of field experimental sites.
Table A2.
Detailed information of field experimental sites.
| Site Number | Region | Province | Longitude | Latitude | Climate | Agronomic Practices | Topographic Information | |||||
|---|---|---|---|---|---|---|---|---|---|---|---|---|
| Mean Annual Temperature (℃) | Mean Annual Precipitation (mm) | Drought Index | Climatic Zone | Fertilizer P Rate (kg P2O5 ha−1) | Cropping Pattern | Land Use Type | Slope (°C) | |||||
| 1 | NE 1 | Jilin | 126.5 | 44.8 | 4.0 | 600 | 42.86 | middle temperate zone | 108.19 | mono-cropping | upland | 2–6 |
| 2 | NE | Jilin | 129.1 | 42.8 | 5.5 | 550 | 35.48 | middle temperate zone | 75.22 | mono-cropping | paddy | 0–2 |
| 3 | NE | Heilongjiang | 126.8 | 46 | 3.3 | 505 | 37.97 | middle temperate zone | 95.56 | mono-cropping | upland | 2–6 |
| 4 | NE | Heilongjiang | 126.3 | 45.3 | 4.4 | 481 | 33.40 | middle temperate zone | 85.86 | mono-cropping | upland | 2–6 |
| 5 | NE | Heilongjiang | 127 | 47 | 2.4 | 547 | 44.11 | middle temperate zone | 90.22 | mono-cropping | paddy | 6–15 |
| 6 | NE | Heilongjiang | 126.8 | 46.7 | 2.4 | 547 | 44.11 | middle temperate zone | 65.80 | mono-cropping | paddy | 2–6 |
| 7 | NE | Heilongjiang | 129.7 | 46.2 | 1.2 | 569.1 | 50.81 | middle temperate zone | 74.20 | mono-cropping | paddy-upland | 2–6 |
| 8 | HH | Hebei | 114.4 | 37.2 | 13.9 | 480 | 20.08 | warm temperate zone | 168.44 | double-cropping | upland | 2–6 |
| 9 | HH | Hebei | 114.3 | 38.1 | 13.3 | 536 | 23.00 | warm temperate zone | 219.54 | double-cropping | upland | 2–6 |
| 10 | HH | Shandong | 117.1 | 36.5 | 14.3 | 665.7 | 27.40 | warm temperate zone | 208.34 | double-cropping | upland | 2–6 |
| 11 | HH | Shandong | 115.5 | 35.3 | 14.8 | 640 | 25.81 | warm temperate zone | 167.42 | double-cropping | upland | 2–6 |
| 12 | HH | Shandong | 120.4 | 36.8 | 11.3 | 732 | 34.37 | warm temperate zone | 230.53 | double-cropping | upland | 2–6 |
| 13 | HH | Shandong | 119.8 | 37.2 | 12.5 | 809 | 35.96 | warm temperate zone | 155.96 | double-cropping | upland | 0–2 |
| 14 | HH | Shandong | 120 | 37.1 | 12.5 | 809 | 35.96 | warm temperate zone | 144.94 | double-cropping | upland | 2–6 |
| 15 | HH | Henan | 112.3 | 32.6 | 15.1 | 721 | 28.73 | warm temperate zone | 149.09 | double-cropping | upland | 2–6 |
| 16 | HH | Henan | 114.1 | 31.2 | 15.2 | 1100 | 43.65 | warm temperate zone | 91.61 | double-cropping | upland | 2–6 |
| 17 | HH | Henan | 114.5 | 32.4 | 15.0 | 938 | 37.52 | warm temperate zone | 125.95 | double-cropping | upland | 2–6 |
| 18 | HH | Henan | 112.8 | 34.6 | 14.2 | 570 | 23.55 | warm temperate zone | 174.03 | double-cropping | upland | 2–6 |
| 19 | HH | Henan | 114.6 | 33.5 | 14.5 | 785.1 | 32.04 | warm temperate zone | 145.44 | double-cropping | upland | 0–2 |
| 20 | HH | Henan | 115.2 | 34.7 | 14.1 | 674 | 27.97 | warm temperate zone | 209.78 | double-cropping | upland | 2–6 |
| 21 | HH | Henan | 115.1 | 34.6 | 14.1 | 674 | 27.97 | warm temperate zone | 193.72 | double-cropping | upland | 2–6 |
| 22 | HH | Henan | 114.9 | 33.8 | 14.0 | 740 | 30.83 | warm temperate zone | 139.30 | double-cropping | upland | 2–6 |
| 23 | HH | Henan | 112.8 | 32.7 | 15.2 | 910.1 | 36.12 | warm temperate zone | 174.43 | double-cropping | upland | 2–6 |
| 24 | HH | Henan | 115.1 | 35.8 | 13.4 | 540 | 23.08 | warm temperate zone | 158.03 | double-cropping | upland | 2–6 |
| 25 | HH | Henan | 114.8 | 34.6 | 14.0 | 678.2 | 28.26 | warm temperate zone | 158.57 | double-cropping | upland | 2–6 |
| 26 | YR | Jiangsu | 119.7 | 31.4 | 16.1 | 1300 | 49.81 | subtropical zone | 120.57 | double-cropping | paddy-upland | 2–6 |
| 27 | YR | Jiangsu | 119.7 | 31.9 | 16.5 | 1043 | 39.36 | subtropical zone | 143.67 | double-cropping | paddy-upland | 2–6 |
| 28 | YR | Guangxi | 110.8 | 24.8 | 18.8 | 1894 | 65.76 | subtropical zone | 157.13 | double-cropping | paddy | 2–6 |
| 29 | YR | Jiangsu | 120 | 32.9 | 15.0 | 1032.3 | 41.29 | subtropical zone | 125.42 | double-cropping | paddy-upland | 2–6 |
| 30 | YR | Jiangsu | 120.5 | 33.2 | 14.1 | 1042.2 | 43.24 | subtropical zone | 174.52 | double-cropping | paddy-upland | 2–6 |
| 31 | YR | Anhui | 116.2 | 33.5 | 15.1 | 809.8 | 32.26 | subtropical zone | 115.72 | double-cropping | upland | 2–6 |
| 32 | YR | Anhui | 116.4 | 33.1 | 14.9 | 812 | 32.61 | subtropical zone | 161.83 | double-cropping | upland | 2–6 |
| 33 | YR | Anhui | 117.9 | 32.7 | 14.9 | 1100 | 44.18 | subtropical zone | 158.37 | double-cropping | paddy-upland | 2–6 |
| 34 | YR | Anhui | 118 | 30.9 | 15.0 | 1000 | 40.00 | subtropical zone | 130.91 | double-cropping | paddy-upland | 2–6 |
| 35 | YR | Fujian | 117.8 | 27.3 | 18.1 | 1742 | 61.99 | subtropical zone | 86.68 | double-cropping | paddy | 2–6 |
| 36 | YR | Fujian | 117.1 | 26.8 | 19.2 | 1753 | 60.03 | subtropical zone | 109.95 | double-cropping | paddy | 0–2 |
| 37 | YR | Hubei | 110.1 | 32.2 | 14.0 | 905 | 37.71 | subtropical zone | 148.51 | triple-cropping | upland | 0–2 |
| 38 | YR | Hubei | 114 | 30.1 | 17.0 | 900 | 33.33 | subtropical zone | 155.78 | triple-cropping | paddy-upland | 2–6 |
| 39 | YR | Hubei | 112.9 | 30.7 | 16.2 | 900 | 34.35 | subtropical zone | 149.94 | double-cropping | upland | 2–6 |
| 40 | YR | Hubei | 112.7 | 30.3 | 16.1 | 1200 | 45.98 | subtropical zone | 175.74 | double-cropping | upland | 2–6 |
| 41 | YR | Jiangsu | 119 | 31.6 | 15.6 | 1037.6 | 40.53 | subtropical zone | 130.19 | double-cropping | paddy | 2–6 |
| 42 | YR | Jiangsu | 118.7 | 32.4 | 15.6 | 1100 | 42.97 | subtropical zone | 125.40 | double-cropping | paddy | 2–6 |
| 43 | YR | Jiangsu | 119.2 | 32.5 | 15.8 | 1015 | 39.34 | subtropical zone | 100.66 | double-cropping | paddy | 2–6 |
| 44 | YR | Jiangsu | 120 | 32.5 | 14.5 | 991.7 | 40.48 | subtropical zone | 133.74 | double-cropping | paddy | 2–6 |
| 45 | YR | Jiangsu | 120.4 | 32.6 | 15.8 | 959 | 37.17 | subtropical zone | 103.33 | double-cropping | paddy | 2–6 |
| 46 | YR | Jiangsu | 120.5 | 32.8 | 15.0 | 1061.2 | 42.45 | subtropical zone | 131.93 | double-cropping | paddy | 0–2 |
| 47 | YR | Anhui | 116.8 | 33.6 | 15.3 | 850 | 33.60 | subtropical zone | 190.30 | double-cropping | upland | 2–6 |
| 48 | YR | Anhui | 116.3 | 32.6 | 15.4 | 930 | 36.61 | subtropical zone | 127.10 | double-cropping | upland | 2–6 |
| 49 | YR | Anhui | 115.2 | 32.8 | 15.4 | 890 | 35.04 | subtropical zone | 142.65 | double-cropping | upland | 0–2 |
| 50 | YR | Anhui | 117.1 | 32.3 | 15.0 | 960 | 38.40 | subtropical zone | 152.36 | double-cropping | paddy | 2–6 |
| 51 | YR | Anhui | 117.3 | 31.2 | 16.2 | 1262.9 | 48.20 | subtropical zone | 133.75 | double-cropping | paddy | 2–6 |
| 52 | YR | Anhui | 118.5 | 30.2 | 15.6 | 1430 | 55.86 | subtropical zone | 52.48 | double-cropping | paddy | 0–2 |
| 53 | YR | Fujian | 117.8 | 24.4 | 21.5 | 1563.2 | 49.63 | subtropical zone | 119.92 | double-cropping | paddy | 2–6 |
| 54 | YR | Hubei | 111.5 | 30.1 | 16.2 | 1250 | 47.71 | subtropical zone | 136.70 | double-cropping | upland | 2–6 |
| 55 | YR | Hubei | 112.5 | 31.2 | 16.4 | 987.6 | 37.41 | subtropical zone | 153.45 | double-cropping | paddy | 2–6 |
| 56 | YR | Hubei | 110.7 | 32.6 | 15.4 | 780 | 30.71 | subtropical zone | 138.00 | double-cropping | upland | 0–2 |
| 57 | YR | Hubei | 113 | 30.6 | 16.4 | 960 | 36.36 | subtropical zone | 90.20 | double-cropping | paddy | 2–6 |
| 58 | YR | Hunan | 114.1 | 28.3 | 18.2 | 1395.7 | 49.49 | subtropical zone | 85.43 | double-cropping | paddy | 2–6 |
| 59 | YR | Hunan | 111.8 | 27.1 | 16.6 | 1250 | 46.99 | subtropical zone | 177.40 | double-cropping | upland | 2–6 |
| 60 | YR | Hunan | 113.1 | 29.3 | 16.8 | 1295 | 48.32 | subtropical zone | 114.52 | double-cropping | paddy | 2–6 |
| 61 | YR | Hunan | 111.2 | 25.5 | 18.0 | 1600 | 57.14 | subtropical zone | 119.08 | double-cropping | paddy | 0–2 |
| 62 | YR | Hunan | 110 | 27.1 | 17.0 | 1700 | 62.96 | subtropical zone | 144.80 | double-cropping | paddy | 2–6 |
| 63 | YR | Guangxi | 108.8 | 23.2 | 28.8 | 1589.2 | 40.96 | subtropical zone | 102.25 | double-cropping | paddy | 2–6 |
| 64 | SC | Guangdong | 110.2 | 20.5 | 23.3 | 1364 | 40.96 | subtropical zone | 210.46 | double-cropping | paddy | 6–15 |
| 65 | SC | Guangdong | 112.2 | 22.6 | 21.5 | 1663.7 | 52.82 | subtropical zone | 81.09 | double-cropping | paddy | 2–6 |
| 66 | SC | Guangdong | 113.5 | 24.1 | 19.3 | 1923 | 65.63 | subtropical zone | 101.15 | double-cropping | paddy | 2–6 |
| 67 | SC | Guangdong | 112.6 | 23.1 | 21.2 | 1650 | 52.88 | subtropical zone | 87.90 | double-cropping | paddy | 0–2 |
| 68 | SC | Hainan | 110.4 | 19.2 | 24.1 | 1900 | 55.72 | tropical zone | 163.08 | double-cropping | paddy | 2–6 |
| 69 | SC | Hainan | 110.3 | 19.4 | 24.0 | 1953 | 57.44 | tropical zone | 126.40 | double-cropping | paddy | 6–15 |
| 70 | SW | Sichuan | 104.6 | 31 | 16.7 | 950 | 35.58 | subtropical zone | 169.46 | triple-cropping | upland | 0–2 |
| 71 | SW | Sichuan | 104.7 | 31.1 | 16.7 | 950 | 35.58 | subtropical zone | 170.52 | triple-cropping | upland | 0–2 |
| 72 | SW | Guizhou | 105.8 | 26.5 | 15.1 | 1378.2 | 54.91 | subtropical zone | 72.60 | double-cropping | paddy | 0–2 |
| 73 | SW | Yunnan | 103.9 | 25.4 | 14.5 | 1008 | 41.14 | subtropical zone | 97.12 | double-cropping | upland | 0–2 |
| 74 | SW | Yunnan | 100.1 | 23.8 | 17.9 | 1158 | 41.51 | subtropical zone | 147.37 | double-cropping | upland | 0–2 |
| 75 | SW | Chongqing | 106.2 | 29.1 | 18.0 | 1000 | 35.71 | subtropical zone | 57.30 | double-cropping | paddy | 0–2 |
| 76 | SW | Chongqing | 106.4 | 28.7 | 18.2 | 1034.7 | 36.69 | subtropical zone | 53.80 | double-cropping | paddy | 0–2 |
| 77 | NW | Xinjiang | 79.9 | 37 | 8.9 | 35 | 1.85 | warm temperate zone | 368.49 | double-cropping | upland | 0–2 |
| 78 | NW | Xinjiang | 79.7 | 37.2 | 8.9 | 35 | 1.85 | warm temperate zone | 307.58 | double-cropping | upland | 0–2 |
| 79 | NW | Gansu | 101.9 | 38.2 | 4.8 | 185.1 | 12.51 | warm temperate zone | 158.38 | mono-cropping | upland | 0–2 |
| 80 | NW | Gansu | 102.9 | 37.5 | 5.6 | 300 | 19.23 | warm temperate zone | 132.91 | mono-cropping | upland | 0–2 |
| 81 | NW | Ningxia | 106.5 | 39.4 | 8.9 | 173.2 | 9.16 | middle temperate zone | 219.27 | mono-cropping | upland | 0–2 |
| 82 | NW | Ningxia | 105.8 | 37.8 | 8.5 | 260.7 | 14.09 | middle temperate zone | 151.54 | double-cropping | paddy-upland | 0–2 |
| 83 | NW | Xinjiang | 88.6 | 45.1 | 5.9 | 145 | 9.12 | middle temperate zone | 140.21 | mono-cropping | upland | 0–2 |
| 84 | NW | Ningxia | 106.1 | 38.6 | 8.3 | 210 | 11.48 | middle temperate zone | 102.64 | mono-cropping | paddy | 0–2 |
| 85 | NW | Ningxia | 106.4 | 38.7 | 8.5 | 225 | 12.16 | middle temperate zone | 95.30 | mono-cropping | paddy | 0–2 |
| 86 | NW | Shanxi | 110.98 | 35.02 | 13.6 | 559.3 | 23.70 | warm temperate zone | 150.26 | mono-cropping | upland | 0–2 |
| 87 | NW | Gansu | 105.5 | 34.3 | 10.7 | 531 | 25.63 | warm temperate zone | 132.49 | mono-cropping | upland | 0–2 |
| 88 | NW | Qinghai | 102.4 | 36.4 | 7.3 | 335.4 | 19.39 | warm temperate zone | 232.38 | mono-cropping | upland | 0–2 |
| 89 | NW | Qinghai | 102.2 | 36.8 | 5.8 | 477.4 | 30.22 | warm temperate zone | 177.34 | mono-cropping | upland | 0–2 |
| 90 | NW | Shaanxi | 109.6 | 33.4 | 13.1 | 709 | 30.69 | warm temperate zone | 241.08 | double-cropping | upland | 0–2 |
| 91 | NW | Shanxi | 111.23 | 37.88 | 7.7 | 520 | 29.38 | middle temperate zone | 119.80 | mono-cropping | upland | 0–2 |
1 NE: northeast China, HH: Huang-Huai-Hai region, YR: middle and lower reaches of the Yangtze River, SC: South China, SW: southwest China, NW: northwest China.
Table A3.
A forecast of the time different Chinese regions will reach the environmental P threshold based on SPTE.
Table A3.
A forecast of the time different Chinese regions will reach the environmental P threshold based on SPTE.
| Region | Current Olsen-P Content (mg kg−1) | Current P Surplus (kg ha−1) | SPTE (mg kg−1) | Time Required to Reach Environmental Threshold (Year) |
|---|---|---|---|---|
| NE 1 | 26.63 | 20.44 | 1.22 | 53.6–101.7 |
| HH | 29.55 | 86.9 | 0.91 | 13.2–28.4 |
| YR | 25.12 | 55.72 | 1.04 | 25.7–46.4 |
| SC | 35.27 | 52.6 | 1.97 | 4.6–16.1 |
| SW | 36.6 | 40.38 | 1.12 | 7.5–34.1 |
| NW | 29.21 | 103.53 | 0.87 | 12.0–25.3 |
1 NE: northeast China, HH: Huang-Huai-Hai region, YR: middle and lower reaches of the Yangtze River, SC: South China, and SW: southwest China, NW: northwest China.

Figure A1.
Schematic diagram for structural equation modeling (SEM). DI: drought index. SOM: soil organic matter, g·kg−1. AK: available potassium, mg·kg−1. SPTE: soil P transformation efficiency, mg·kg−1.
Figure A1.
Schematic diagram for structural equation modeling (SEM). DI: drought index. SOM: soil organic matter, g·kg−1. AK: available potassium, mg·kg−1. SPTE: soil P transformation efficiency, mg·kg−1.


Figure A2.
Soil Olsen-P content (a) and apparent P surplus (b) over time under 91 long-term fertilization experiments.
Figure A2.
Soil Olsen-P content (a) and apparent P surplus (b) over time under 91 long-term fertilization experiments.


Figure A3.
Cumulative P surplus over time in 91 experiment sites. The experimental time (year) 5, 10, 15, 20, 25, and 30 refer to the time periods of 1988–1992, 1993–1997, 1998–2002, 2003–2007, 2008–2012, and 2013–2018, respectively.
Figure A3.
Cumulative P surplus over time in 91 experiment sites. The experimental time (year) 5, 10, 15, 20, 25, and 30 refer to the time periods of 1988–1992, 1993–1997, 1998–2002, 2003–2007, 2008–2012, and 2013–2018, respectively.


Figure A4.
P fertilizer amount over time in 91 experiment sites.
Figure A4.
P fertilizer amount over time in 91 experiment sites.


Figure A5.
Yield of main crops in 91 experiment sites.
Figure A5.
Yield of main crops in 91 experiment sites.

References
- Simpson, R.J.; Oberson, A.; Culvenor, R.A.; Ryan, M.H.; Veneklaas, E.J.; Lambers, H.; Lynch, J.P.; Ryan, P.R.; Delhaize, E.; Smith, F.A.; et al. Strategies and agronomic interventions to improve the phosphorus-use efficiency of farming systems. Plant Soil 2011, 349, 89–120. [Google Scholar]
- Withers, P.J.A.; Sylvester-Bradley, R.; Jones, D.L.; Healey, J.R.; Talboys, P.J. Feed the Crop Not the Soil: Rethinking Phosphorus Management in the Food Chain. Environ. Sci. Technol. 2014, 48, 6523–6530. [Google Scholar] [CrossRef]
- Chen, M.; Chen, J.; Sun, F. Agricultural phosphorus flow and its environmental impacts in China. Sci. Total Environ. 2008, 405, 140–152. [Google Scholar] [CrossRef]
- MacDonald, G.K.; Elena, M.B.; Potter, P.A.; Ramankutty, N. Agronomic phosphorus imbalances across the world’s croplands. Proc. Natl. Acad. Sci. USA 2011, 108, 3086–3091. [Google Scholar] [CrossRef]
- Ma, J.C.; He, P.; Xu, X.P.; He, W.T.; Liu, Y.X.; Yang, F.Q.; Chen, F.; Li, S.T.; Tu, S.H.; Jin, J.Y.; et al. Temporal and spatial changes in soil available phosphorus in China (1990–2012). Field Crop. Res. 2016, 192, 13–20. [Google Scholar] [CrossRef]
- Jiang, S.Y.; Hua, H.; Sheng, H.; Jarvie, H.P.; Liu, X.; Zhang, Y.; Yuan, Z.W.; Zhang, L.; Liu, X.W. Phosphorus footprint in China over the 1961–2050 period: Historical perspective and future prospect. Sci. Total Environ. 2019, 650, 687–695. [Google Scholar] [CrossRef]
- Shen, R.P.; Sun, B.; Zhao, Q.G. Spatial and Temporal variability of N, P and K balances for agroecosystems in China. Pedosphere 2005, 15, 347–355. [Google Scholar]
- Li, H.; Huang, G.; Meng, Q.; Ma, L.; Yuan, L.; Wang, E.; Zhang, W.; Cui, Z.; Shen, J.; Chen, X.; et al. Integrated soil and plant phosphorus management for crop and environment in China. A review. Plant Soil 2011, 349, 157–167. [Google Scholar] [CrossRef]
- Ma, J.C.; Liu, Y.X.; He, W.T.; He, P.; Haygarth, P.M.; Surridge, B.W.J.; Lei, Q.L.; Zhou, W. The long-term soil phosphorus balance across Chinese arable land. Soil Use Manag. 2018, 34, 306–315. [Google Scholar]
- Carpenter, S.R. Eutrophication of aquatic ecosystems: Bistability and soil phosphorus. Proc. Natl. Acad. Sci. USA 2005, 102, 10002–10005. [Google Scholar] [CrossRef]
- McDowell, R.; Dodd, R.; Pletnyakov, P.; Noble, A. The ability to reduce soil legacy phosphorus at a country scale. Front. Environ. Sci. 2020, 8, 6. [Google Scholar] [CrossRef]
- Bai, Z.H.; Li, H.G.; Yang, X.Y.; Zhou, B.K.; Shi, X.J.; Wang, B.R.; Li, D.C.; Shen, J.B.; Chen, Q.; Qin, W.; et al. The critical soil P levels for crop yield, soil fertility and environmental safety in different soil types. Plant Soil 2013, 372, 27–37. [Google Scholar] [CrossRef]
- Xi, B.; Zhai, L.M.; Liu, J.; Liu, S.; Wang, H.Y.; Luo, C.Y.; Ren, T.Z.; Liu, H.B. Long-term phosphorus accumulation and agronomic and environmental critical phosphorus levels in Haplic Luvisol soil, northern China. J. Integr. Agric. 2016, 15, 200–208. [Google Scholar] [CrossRef]
- Zhan, X.Y.; Zhang, L.; Zhou, B.K.; Zhu, P.; Zhang, S.X.; Xu, M.G. Changes in Olsen phosphorus concentration and its response to phosphorus balance in black soils under different long-term fertilization patterns. PLoS ONE 2015, 10, e0131713. [Google Scholar] [CrossRef]
- Wu, Q.H.; Zhang, S.X.; Ren, Y.; Zhan, X.Y.; Xu, M.G.; Feng, G. Soil Phosphorus Management Based on the Agronomic Critical Value of Olsen P. Commun. Soil Sci. Plan. 2018, 49, 934–944. [Google Scholar]
- Cao, N.; Chen, X.P.; Cui, Z.L.; Zhang, F.S. Change in soil available phosphorus in relation to the phosphorus budget in China. Nutr. Cycl. Agroecosyst. 2012, 94, 161–170. [Google Scholar] [CrossRef]
- Shen, P.; Xu, M.G.; Zhang, H.M.; Yang, X.Y.; Huang, S.M.; Zhang, S.X.; He, X.H. Long-term response of soil Olsen P and organic C to the depletion or addition of chemical and organic fertilizers. Catena 2014, 118, 20–27. [Google Scholar] [CrossRef]
- Daly, K.; Styles, D.; Lalor, S.; Wall, D.P. Phosphorus sorption, supply potential and availability in soils with contrasting parent material and soil chemical properties. Eur. J. Soil Sci. 2015, 66, 792–801. [Google Scholar] [CrossRef]
- Olsson, R.; Giesler, R.; Loring, J.S.; Persson, P. Enzymatic hydrolysis of organic phosphates adsorbed on mineral surfaces. Environ. Sci. Technol. 2012, 46, 285–291. [Google Scholar] [CrossRef]
- Meyer, G.; Bell, M.J.; Doolette, C.L.; Brunetti, G.; Zhang, Y.Q.; Lombi, E.; Kopittke, P. Plant-Available Phosphorus in Highly Concentrated Fertilizer Bands: Effects of Soil Type, Phosphorus Form, and Coapplied Potassium. J. Agric. Food Chem. 2020, 68, 7571–7580. [Google Scholar] [CrossRef]
- Penn, C.J.; Camberato, J.J. A critical review on soil chemical processes that control how soil pH affects phosphorus availability to plants. Agriculture 2019, 9, 120. [Google Scholar] [CrossRef]
- Hou, E.Q.; Chen, C.R.; Luo, Y.Q.; Zhou, G.Y.; Kuang, Y.W.; Zhang, Y.G.; Heenan, M.; Lu, X.K.; Wen, D.Z. Effects of climate on soil phosphorus cycle and availability in natural terrestrial ecosystems. Glob. Chang. Biol. 2018, 24, 3344–3356. [Google Scholar] [CrossRef]
- Wang, Y.; Zhao, X.; Wang, L.; Zhao, P.H.; Zhu, W.B.; Wang, S.Q. Phosphorus fertilization to the wheat-growing season only in a rice-wheat rotation in the Taihu Lake region of China. Field Crop. Res. 2016, 198, 32–39. [Google Scholar] [CrossRef]
- Khan, A.; Lu, G.Y.; Ayaz, M.; Zhang, H.T.; Wang, R.J.; Lv, F.L.; Yang, X.Y.; Sun, B.H.; Zhang, S.L. Phosphorus efficiency, soil phosphorus dynamics and critical phosphorus level under long-term fertilization for single and double cropping systems. Agric. Ecosyst. Environ. 2018, 256, 1–11. [Google Scholar] [CrossRef]
- Wang, Y.; He, Y.; Zhang, H.; Schroder, J.; Li, C.; Zhou, D. Phosphate mobilization by citric, tartaric and oxalic acids in a clay loam ultisol. Soil Sci. Soc. Am. J. 2008, 72, 1263–1268. [Google Scholar] [CrossRef]
- He, W.T.; Jiang, R.; He, P.; Yang, J.Y.; Zhou, W.; Ma, J.C.; Liu, Y.X. Estimating soil nitrogen balance at regional scale in China’s croplands from 1984 to 2014. Agric. Syst. 2018, 167, 125–135. [Google Scholar] [CrossRef]
- Cai, A.D.; Xu, H.; Duan, Y.H.; Zhang, X.B.; Ashraf, M.N.; Zhang, W.J.; Xu, M.G. Changes in mineral-associated carbon and nitrogen by long-term fertilization and sequestration potential with various cropping across China dry croplands. Soil Tillage Res. 2021, 205, 104725. [Google Scholar] [CrossRef]
- Lu, R.K. Methods of Agricultural Chemical Analysis of Soil; China Agricultural Science and Technology Press: Beijing, China, 2000. (In Chinese) [Google Scholar]
- Olsen, S.R.; Cole, C.V.; Watanabe, F.S.; Dean, L.A. Estimation of Available Phosphorus in Soils by Extraction with Sodium Bicarbonate; USDA Circular: Washington, DC, USA, 1954; Volume 939, p. 19. [Google Scholar]
- Hengl, T.; Jesus, J.M.D.; Heuvelink, G.B.M.; Gonzalez, M.R.; Kilibarda, M.; Blagotić, A.; Wei, S.; Wright, M.N.; Geng, X.; Bauermarschallinger, B. SoilGrids250m: Global gridded soil information based on machine learning. PLoS ONE 2017, 12, e0169748. [Google Scholar] [CrossRef]
- FAO. World reference base for soil resources 2006: A framework for international classification, correlation and communication. World Soil Resour. Rep. 2006, 103, 1–128. [Google Scholar]
- Cai, A.D.; Xu, M.G.; Wang, B.R.; Zhang, W.J.; Liang, G.P.; Hou, E.Q.; Luo, Y.Q. Manure acts as a better fertilizer for increasing crop yields than synthetic fertilizer does by improving soil fertility. Soil Tillage Res. 2019, 189, 168–175. [Google Scholar] [CrossRef]
- Bivand, R. spdep: Spatial Dependence: Weighting Schemes, Statistics and Models; R package Version 0.6-8; 2016. [Google Scholar]
- Grace, J.B.; Anderson, T.M.; Olff, H.; Scheiner, S.M. On the specification of structural equation models for ecological systems. Ecol. Monogr. 2010, 80, 67–87. [Google Scholar] [CrossRef]
- Xin, X.L.; Qin, S.W.; Zhang, J.B.; Zhu, A.N.; Yang, W.L.; Zhang, X.F. Yield, phosphorus use efficiency and balance response to substituting long-term chemical fertilizer use with organic manure in a wheat-maize system. Field Crop. Res. 2017, 208, 27–33. [Google Scholar] [CrossRef]
- Fei, C.; Zhang, S.R.; Feng, X.H.; Ding, X.D. Organic material with balanced C-nutrient stoichiometry and P addition could improve soil P availability with low C cost. J. Plant Nutr. Soil Sci. 2021, 184, 573–584. [Google Scholar] [CrossRef]
- Aulakh, M.S.; Garg, A.K.; Kabba, B.S. Phosphorus accumulation, leaching and residual effects on crop yields from long-term applications in the subtropics. Soil Use Manag. 2007, 23, 417–427. [Google Scholar] [CrossRef]
- Messiga, A.J.; Ziadi, N.; Bélanger, G.; Morel, C. Relationship between soil phosphorus and phosphorus budget in grass sward with varying nitrogen applications. Soil Sci. Soc. Am. J. 2014, 78, 1481–1488. [Google Scholar] [CrossRef]
- Blake, L.; Mercik, S.; Koerschens, M.; Moskal, S.; Poulton, P.R.; Goulding, K.W.T.; Weigel, A.; Powlson, D.S. Phosphorus content in soil, uptake by plants and balance in three European long-term field experiments. Nutr. Cycl. Agroecosyst. 2000, 56, 263–275. [Google Scholar] [CrossRef]
- Fink, J.R.; Vasconcellos, I.A.; Tales, T.; Barrón, V. Iron oxides and organic matter on soil phosphorus availability. Cienc. Agrotecnol. 2016, 40, 369–379. [Google Scholar] [CrossRef]
- Weyers, E.; Strawn, D.G.; Peak, D.; Moore, A.; Baker, L.; Cade-Menun, B. Phosphorus speciation in calcareous soils following annual dairy manure amendments. Soil Sci. Soc. Am. J. 2016, 80, 1531–1542. [Google Scholar] [CrossRef]
- Arif, M.; Ilyas, M.; Riaz, M.; Ali, K.; Shan, K.; Haq, I.U.; Fahad, S. Biochar improves phosphorus use efficiency of organic-inorganic fertilizers, maize-wheat productivity and soil quality in a low fertility alkaline soil. Field Crop. Res. 2017, 214, 25–37. [Google Scholar] [CrossRef]
- Yan, Z.J.; Chen, S.; Dari, B.; Sihi, D.; Chen, Q. Phosphorus transformation response to soil properties changes induced by manure application in a calcareous soil. Geoderma 2018, 322, 163–171. [Google Scholar] [CrossRef]
- Zhang, W.W.; Wang, Q.; Wu, Q.H.; Zhang, S.X.; Zhu, P.; Peng, C.; Huang, S.M.; Wang, B.R.; Zhang, H.M. The response of soil Olsen-P to the P budgets of three typical cropland soil types under long-term fertilization. PLoS ONE 2020, 15, e0230178. [Google Scholar] [CrossRef]
- Barrow, N.J. The effects of pH on phosphate uptake from the soil. Plant Soil 2017, 410, 401–410. [Google Scholar] [CrossRef]
- Wang, X.M.; Hu, Y.F.; Tang, Y.D.; Yang, P.; Feng, X.H.; Xu, W.Q.; Zhu, M.Q. Phosphate and phytate adsorption and precipitation on ferrihydrite surfaces. Environ. Sci. Nano 2017, 4, 2193–2204. [Google Scholar] [CrossRef]
- Wang, X.X.; Liu, S.L.; Zhang, S.M.; Li, H.B.; Maimaitiaili, B.; Feng, G.; Rengel, Z. Localized ammonium and phosphorus fertilization can improve cotton lint yield by decreasing rhizosphere soil pH and salinity. Field Crop. Res. 2018, 217, 75–81. [Google Scholar] [CrossRef]
- Huang, J.; Zhou, L.H.; Liu, S.J.; Han, T.F.; Hayatu, N.G.; Li, D.C.; Zhang, S.X.; Wang, B.R.; Zhang, H.M. Vertical distribution of phosphorus fractions and the environmental critical phosphorus level in acidic red soil under long-term fertilizer and lime application in southern China. J. Plant. Nutr. Soil Sci. 2021, 184, 585–595. [Google Scholar] [CrossRef]
- Mayakaduwage, S.; Mosley, L.M.; Marschner, P. Phosphorus pools in acid sulfate soil are influenced by soil water content and form in which P is added. Geoderma 2021, 381, 114692. [Google Scholar] [CrossRef]
- Tang, X.; Li, J.M.; Ma, Y.B.; Hao, X.Y.; Li, X.Y. Phosphorus efficiency in long-term (15 years) wheat-maize cropping systems with various soil and climate conditions. Field Crop. Res. 2008, 108, 231–237. [Google Scholar] [CrossRef]
- Yuan, Y.; Li, Y.; Mou, Z.J.; Kuang, L.H.; Wu, W.J.; Zhang, J.; Wang, F.M.; Hui, D.F.; Peñuelas, J.; Sardans, J.; et al. Phosphorus addition decreases microbial residual contribution to soil organic carbon pool in a tropical coastal forest. Glob. Chang. Biol. 2020, 27, 454–466. [Google Scholar] [CrossRef]
- Messiga, A.J.; Ziadi, N.; Morel, C.; Grant, C.; Tremblay, G.; Lamarre, G.; Parent, L.E. Long term impact of tillage practices and biennial P and N fertilization on maize and soybean yields and soil P status. Field Crop. Res. 2012, 133, 10–22. [Google Scholar] [CrossRef]
- Yan, X.; Wei, Z.Q.; Wang, D.J.; Zhang, G.; Wang, J. Phosphorus status and its sorption-associated soil properties in a paddy soil as affected by organic amendments. J. Soil Sediment. 2015, 15, 1882–1888. [Google Scholar] [CrossRef]
- Messiga, A.J.; Ziadi, N.; Jouany, C.; Virkajärvi, P.; Suomela, R.; Sinaj, S.; Bélanger, G.; Stroia, C.; Morel, C. Soil test phosphorus and cumulative phosphorus budgets in fertilized grassland. Ambio 2015, 44, 252–262. [Google Scholar] [CrossRef]
- Borges, R.; Mallarino, A.P. Grain yield, early growth, and nutrient uptake of no-till soybean as affected by phosphorus and potassium placement. Agron. J. 2000, 92, 380–388. [Google Scholar]
- Xu, G.C.; Li, Z.B.; Li, P.; Zhang, T.G.; Cheng, S.D. Spatial variability of soil available phosphorus in a typical watershed in the source area of the middle Dan River, China. Environ. Earth Sci. 2014, 71, 3953–3962. [Google Scholar] [CrossRef]
- Achat, D.L.; Pousse, N.; Nicolas, M.; Brédoire, F.; Augusto, L. Soil properties controlling inorganic phosphorus availability: General results from a national forest network and a global compilation of the literature. Biogeochemistry 2016, 127, 255–272. [Google Scholar] [CrossRef]
- Zhong, X.; Zhao, X.; Bao, H.; Li, H.; Lin, Q. The evaluation of phosphorus leaching risk of 23 Chinese soils. I. Leaching criterion. Acta Ecol. Sin. 2004, 24, 2275–2280, (In Chinese with English Abstract). [Google Scholar]
- Zhou, J.; Zhang, Y.F.; Wu, K.B.; Hu, M.P.; Wu, H.; Chen, D.J. National estimates of environmental thresholds for upland soil phosphorus in China based on a meta-analysis. Sci. Total Environ. 2021, 780, 146677. [Google Scholar] [CrossRef]
- Martin, A.; Cooke, G.D. Health risks in eutrophic water supplies. Lake Line 1994, 14, 24–26. [Google Scholar]
- Zhang, W.W.; Zhan XYZhang, S.X.; Khalid, H.M.I.; Xu, M.G. Response of soil Olsen-P to P budget under different long-term fertilization treatments in a fluvo-aquic soil. J. Integr. Agric. 2019, 18, 667–676. [Google Scholar] [CrossRef]


Disclaimer/Publisher’s Note: The statements, opinions and data contained in all publications are solely those of the individual author(s) and contributor(s) and not of MDPI and/or the editor(s). MDPI and/or the editor(s) disclaim responsibility for any injury to people or property resulting from any ideas, methods, instructions or products referred to in the content. |
© 2023 by the authors. Licensee MDPI, Basel, Switzerland. This article is an open access article distributed under the terms and conditions of the Creative Commons Attribution (CC BY) license (https://creativecommons.org/licenses/by/4.0/).