Abstract
The yield potential of switchgrass was verified by testing seven cultivars in a small-scale experiment carried out from 2018 to 2022 on Gleyic Fluvisol under Central European conditions. The treatments are as follows: pre-sowing (i/HA) soil humic preparation Humac AGRO (based on leonardite) with an ameliorative dose of 1000.0 kg ha−1 or (ii/NPK) basic nutrition with a dose of 220.0 kg ha−1 NPK; an annual dose of 70 kg ha−1 N was applied to both treatments (HA, NPK) and compared to (iii/UC) untreated control. A dry matter (DM) yield of 9.02 t ha−1 was achieved in the total average, which varied from 0.05 t ha−1 to 60.64 t ha−1. The yield was affected mainly by years (F-ratio 106.64), then by nutrition (F-ratio 79.03), followed by cultivars (F-ratio 56.87), and finally by replications (F-ratio 0.00). Switchgrass productivity increased according to the utility year; however, the driest year (2020—388 mm, 2021—372 mm, and 2022—288 mm) changed the order of the three full utility years (12.44, 19.13, and 7.73 t ha−1 DM, respectively). HA gives the highest DM yield of 13.69 t ha−1 on average with values of 9.19 and 4.19 for NPK and UC, respectively. The cultivars order was EG 1101 ˃ BO Master ˃ EG 1102 ˃ Kanlow ˃ Alamo ˃ Carthage ˃ NJ Ecotype (21.15, 12.48, 8.14, 7.70, 6.34, 4.47, and 2.89 t ha−1 DM when ranking average yield or 60.64, 45.20, 29.92, 29.15, 17.87, 9.86, and 5.93 t ha−1 DM when ranking maximal yields).
1. Introduction
Switchgrass (Panicum virgatum L.) is a medium- to high-yielding, warm-season perennial grass suitable for low-input growing on marginal soils [1,2,3]. Considered to be one of the most promising energy crops indigenous to North America [4], switchgrass was selected as a candidate bioenergy crop for the USA in the early 1980s, while research on it in Europe started a decade later [5]. However, initial efforts to grow switchgrass for energy purposes in European countries were not very successful due to severe reasons, leading to the low chance of success in establishing the stands. This reasons mainly include seed dormancy, unmanaged protection against problematic grassy weeds in the initial period, and a lack of information regarding the adaptability of cultivars under various growing conditions [6,7]. Currently, the re-introduction of this grass to European countries is supported by the suitability of its phytomass for multifaced use in different 2nd-generation technologies, wherein the re-emerged concept of marginal soils has been met too.
Due to the search for novel energy crops with large increases in phytomass, low habitat requirements, and high resistance to diseases and pests [1], an interest in C4-type plant switchgrass has increased worldwide beyond warm-season areas alone [8]. This is connected with the fact that switchgrass is characterized by a wider ecological amplitude, high suitability for less favorable growing conditions of different nature, and a wide range of commercial cultivars. However, the long-term response of cultivars to low-input management practices is not well documented, especially for prominent newly bred cultivars and hybrids [3]. Another important benefit of the crop, when compared to other perennial energy grasses with high to very high production potential, is the fact that the establishment of the switchgrass stand is possible through simple sowing with no complicated planting needed. In the case of projects with the need for very large volumes of phytomass, the low cost of seeds can become a decisive criterion.
To avoid the former insufficiencies, the re-introduction and cultivation of switchgrass needs to improve the crop management strategies. The establishment of the crop can remain problematic [7] if management practices do not improve switchgrass seedling vigor and emergence, which could result in more successful switchgrass stands due to better competitive advantages of the crop seedlings [9]. A novel candidate for improving the viability of switchgrass stands includes soil humic preparations [10] that can be assumed in ameliorative doses to most probably have long-term impacts. However, there is no direct switchgrass study yet. A great number of research studies document the positive effects of humic preparations on plants or soil environments [10,11,12,13,14,15,16,17,18,19,20,21,22]. Therefore, a serious yield response of switchgrass can be expected, especially considering its widely discussed hormonal activity on crop growth.
Despite the low-input approach typical for switchgrass growing, efforts to increase yields are taking place worldwide [23,24,25,26,27,28,29,30,31,32,33], whereas attempts to address the effect of mineral nutrition, especially N doses [34,35,36,37,38,39], or the choice of well-adapted cultivars, scarcely include newly bred ones [2,7,8,31,40]. Further options to improve switchgrass management strategies, e.g., irrigation, plant protection, and plant growth regulators are still rarely studied.
Based on the lack of cultivation experience with switchgrass in Slovakia [6], an agronomically designed open-field poly-factorial pilot screening experiment was conducted. The main aim of this research was to determine the production potential of this newly-introduced energy crop grown in heavy soil under climatic conditions of Central Europe with switchgrass being alternately treated with soil ameliorative humic amendment or with basic NPK nutrition compared to an untreated low-input control as well.
2. Materials and Methods
2.1. Plant Material, Trial Site, and Agronomy
The small-scale, open-field pilot screening experiment with the newly introduced energy crop switchgrass was established within the internal capabilities of the NPPC-VÚA in Michalovce. The site was located on Eastern Slovakian Lowland under a moderate continental Central European climate at an altitude of 110 m on completely flat land composed of Gleyic Fluvisol, a heavy soil, all under semi-arid to semi-humid climate conditions at latitude N 48.748922 and longitude E 21.9182244.
Soil analyses were conducted prior to the trial with topsoil samples from depths of 0–30 cm taken. The results are presented in Table 1 and Table 2. The trial was established in the spring of 2018 and continued until 2022. Soil tillage was conducted to a depth of 24 cm in the autumn followed by high-quality pre-sowing preparation aimed to achieve optimal soil beds for successful germination and emerging. Due to a drought after sowing in the spring of 2018, it was necessary to ensure optimal soil moisture conditions for plant emergence and initial growth. During the period 2 months after sowing, the trial was regularly irrigated manually with a garden trowel with a total of 10 doses and a one-time dose of 21.33 L of water for each trial member characterized by a net area of 2.133 m2. The total volume of water consumed was 2.560 m3, which is equal to an irrigation dose of 100 mm.

Table 1.
Soil type based on clay content in topsoil layers (0–30 cm).
Table 2.
The average content of nutrients in the soil (0–30 cm) and the initial status of 2017 (autumn).
Seven cultivars of switchgrass were used, including the commercially available Alamo (A), Kanlow (K), Carthage (C), BO Master (BO), and NJ Ecotype as well as the prominent newly bred EG 1101 (H1) and EG 1102 (H3). The sowing date, 30 April 2018, was the same for all cultivars, and the sowing depth was 1 cm. Weeds were controlled manually throughout the trial period, whereas no pests or diseases were recorded throughout the period.
There were three treatments including untreated control (UC) used in the trial with basic pre-sowing treatment performed using mineral fertilizer (NPK) or humic preparation soil ameliorative amendment, while a subsequent dose of N fertilizer was applied annually in the early spring on both treatments (NPK and HA), regularly at the end of March. The tested doses for pre-sowing HA and NPK treatment and annual N nutrition are presented in Table 3. The applied humic preparation HUMAC Agro was based on leonardite, with a guaranteed 62% humic substances content by the manufacturer (HUMAC ltd, Košice, Slovakia). A total of 336 plants were grown with 48 plants for each of the 7 cultivars, and 12 basic trial members were created via 3 treatments in 4 repetitions with a total experimental area of 25.6 m2. Each of the basic trial members consisted of 28 plants, including 4 plants for each of the 7 cultivars. The experimental layout was a randomized block design with 12 blocks being equal to the basic trial members.
Table 3.
The dosage of mineral nutrients NPK (kg ha−1, PK in oxide form) and humic preparation HA (HUMAC Agro, humic substances content of 62%) according to the treatments.
There were four factors considered during the poly-factorial screening trial, including (i) 7 cultivars, (ii) 3 nutrition treatments, (iii) 5 years, and (iv) 4 repetitions. The years were treated as utility years; no repeated yearly establishment of the trial was performed.
2.2. Weather and Soil-Climate Data
Data regarding weather conditions, the soil climate conditions, and the soil’s electrical conductivity are presented in Table 4.Meteorological observation data were obtained from the official meteorological station closest to the experimental site at a distance of 2.2 km from the experiment as the crow flies. The station belongs to the Slovak Hydro-meteorological Institute (SHMÚ) network with guaranteed data.
Table 4.
Data concerning weather and soil conditions during the main vegetation period from April to September.
Soil climate and conductivity data were taken hourly and were measured using an Em50 DECALOG Data Logger installed on the site to record the parameters from two soil layers (topsoil in the depth of 20 cm and subsoil in the depth of 50 cm) during the main vegetation period from April until September 2018–2022.
2.3. Harvest and Laboratory Analyses
Switchgrass was harvested once a year, and optimal maturity was regularly achieved during the end of September. The harvest dates are presented in Table 5. Samples of fresh phytomass for dry matter content analyses were taken at harvest, and dry matter content was determined gravimetrically through laboratory analyses.
Table 5.
Crop harvest dates.
At harvest, soil samples were obtained to determine the most important chemical properties of the soil. The soil samples were taken from topsoil (a depth of 0–30 cm), and each of the treatments was sampled. Soil sampling as well as sample storage and processing were performed according to Slovak Law No. 151/2016, Law Digest 2016 [41]. Laboratory analyses of the soil samples were conducted according to the Mehlich 3 method (the content of P, K, Ca, Mg) [42], total nitrogen (Nt) was determined using the Kjeldahl method [43], soil organic carbon (C-ox) was determined indirectly using Tjurin’s method [44], exchangeable soil reaction (pH/KCl) was determined using the potentiometric method [45], and the ratio of organic carbon to total nitrogen (C/N) was determined through calculations [46]. For soil texture parameters, we applied a standard Novak method [47].
2.4. Statistical Methods
In total, 1260 crop data points (yield, dry matter content, and crop height, including 4 replications) and 162 soil chemical property data points (average values of classical twin analyses) were statistically evaluated, and 1800 daily weather data points and 129,600 soil-climate and conductivity data points (hourly records) were processed.
A multi-factorial analysis of variance (MANOVA) was performed to identify significant factors influencing yield variability using Statgraphics 15.2.14. Valuation for the main effects is presented in Table 6. MANOVA for interactions was performed as well; however, due to the extensive output, the valuation was excluded. Therefore, instead of 10 interactions, the authentic data (excluding the repetitions) are displayed in Figure 1 with assigned standard deviation, and the main average values are displayed in Figure 2 as well. In addition, MANOVA for main effects was performed to identify homogenous groups according to the treatments for DM content at harvest as well as crop height (Figure 3). Moreover, correlation analysis and linear trend analyses were also used for statistical evaluation.
Table 6.
MANOVA of the yield data.
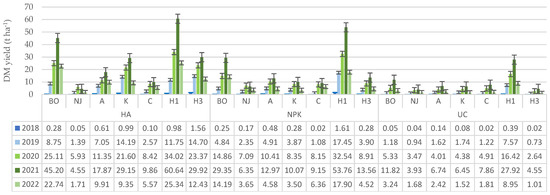
Figure 1.
The dry matter yields according to cultivars and treatments. Authentic data with standard deviation are added.
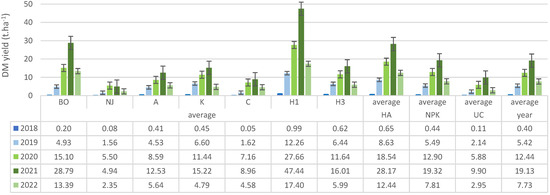
Figure 2.
The dry matter yields according to cultivars and treatments. Average data with standard deviation are added.
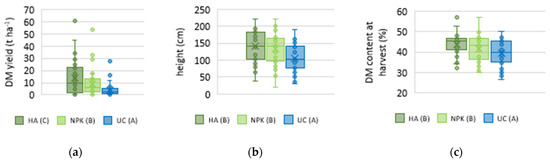
Figure 3.
Box plot for DM yield (a), crop height (b), and DM content at harvest (c) according to the treatments HA, NPK, and UC, displaying the minimum, first quartile, median, mean, third quartile, and maximum. The letters A-B-C indicate homogeneous groups according to the MANOVA procedure for main effects at a 0.05 significance level.
3. Results
3.1. DM Yield and the Main Effects
Data of green phytomass yields are presented in Figure 1 Data were calculated to determine dry matter (DM) yield, and MANOVA of the data is presented in Table 6. Overall, the experiment achieved 9.02 t ha−1 of DM yield in total on average, the yields varied from 0.05 t ha−1 to 60.64 t ha−1, and the phytomass produced in the first year (2018) was quantified and included in the valuation as well. The crop yield was mainly affected by years (F-ratio 106.64, p-value 0.00), then by nutrition (F-ratio 79.03, p-value 0.00), followed by varieties (F-ratio 56.87, p-value 0.00), and finally by replications (F-ratio 0.00, p-value 1.00), which confirms the high quality of the experiment.
Yields concerning the included five years were as follows (average—minimum—maximum):
- 2018: 0.40—0.02—1.61 t ha−1;
- 2019: 5.42—0.73—17.45 t ha−1;
- 2022: 7.73—1.01—25.34 t ha−1;
- 2020: 12.44—2.64—34.02 t ha−1;
- 2021: 19.13—3.93—60.64 t ha−1.
The highest yield was achieved in 2021, while the yield in the last year, 2022, was statistically comparable with the yield in 2019 only, and thus the same homogeneity group was formed by the full-productive utility year and the development year, respectively (Table 6). Switchgrass productivity increased according to the utility year; however, the driest year (2020—388 mm, 2021—372 mm, 2022—288 mm) changed the order of the three full utility years (12.44, 19.13, and 7.73 t ha−1 DM, respectively).
According to the treatments, the highest DM yield of 13.69 t ha−1 was found under HA, while 9.19 t ha−1 was found under NPK, and the lowest DM yield was 4.19 t ha−1 found under UC. However, although that treatment order was typical in general, it was not valid across all the years of the study and cultivars tested.
Despite the effect of cultivars seeming to be the least significant factor, the tested seven cultivars completely differ from one another regarding average DM yield as well as maximal ones. The order of the cultivars was EG 1101 ˃ BO Master ˃ EG 1102 ˃ Kanlow ˃ Alamo ˃ Carthage ˃ NJ Ecotype (21.15, 12.48, 8.14, 7.70, 6.34, 4.47, and 2.89 t ha−1 DM when ranking the average yields or 60.64, 45.20, 29.92, 29.15, 17.87, 9.86, and 5.93 t ha−1 DM when ranking the maximal yields (Table 6 and Figure 1 and Figure 2)).
3.2. Plant Height and DM Content
The harvest was performed once a year (Table 5) regularly at the end of September since this is the optimal time for measuring potential yield. At the harvest, data on plant height was also recorded, and phytomass samples were taken for laboratory quantification of their DM content (Table 7). The average height of the switchgrass was 127 cm with samples ranging from 21 to 223 cm, and average DM content was 41.59% with samples ranging from 26.33–57.10%. Within the three full productive years (2020–2022), the height of switchgrass was 143 cm on average, ranging from 66 to 223 cm, while the DM content was 43.50% on average, ranging from 26.33–57.10%. According to the treatments, the heights and DM contents of switchgrass at harvest were differentiated less than DM yields (Figure 3). Following average values according to years and treatments in order to UC—NPK—HA was achieved:
Table 7.
Plant height and dry matter content at harvest.
- 2018: height: 45—70—80 cm, DM content at harvest: 35.25—35.68—36.49%;
- 2019: height: 110—144—173 cm, DM content at harvest: 37.81—42.85—44.33%;
- 2020: height: 113—170—67 cm, DM content at harvest: 45.27—48.16—46.85%;
- 2021: height: 156—176—177 cm, DM content at harvest: 45.95—45.73—46.25%;
- 2022: height: 84—113—103 cm, DM content at harvest: 32.45—35.08—45.73%.
The yield of switchgrass strongly correlated with crop height (r 0.688) regarding valuation of all the data. The linear course of the dependence of crop yield on plant height is presented according to treatment in Figure 4, and the dependence of crop yield on cultivars according to treatments is presented in Figure 5, while the subfigures are optimized to show the whole data cluster according to cultivars and treatments with the reliability index (R2) included as well. As the yield increased according to treatment in the order of UC—NPK—HA (Table 6), the dependence of yield on plant height decreased (0.4934—0.5285—0.4298 R2 respectively, (Figure 4a)). Similarly, a valid but more reliable order can be observed in the linear trends of cultivars evaluated according to treatment (0.7890—0.7509—0.5165 R2 on average, respectively (Figure 5a–c)).
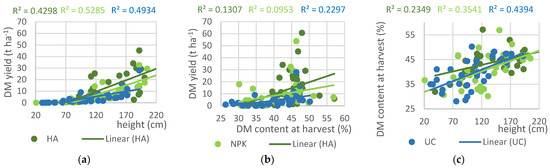
Figure 4.
The linear course of dependence of dry matter yield on crop height (a), dry matter yield on dry matter content (b), and dry matter content on crop height (c) according to treatments HA, NPK, and UC.
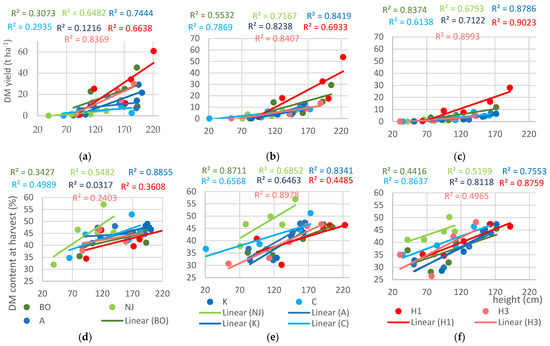
Figure 5.
The linear course of dependence of dry matter yield on crop height (a–c) and dry matter content at harvest on crop height (d–f) according to treatments HA (a,d), NPK (b,e), and UC (c,f).
The yield of switchgrass moderately correlated with DM content at harvest (r 0.400), while the correlation between the DM content at harvest and crop height was also only moderate, but a little bit stronger (r 0.612), regarding the valuation of all the data. As the crop height increased according to treatment in the order UC—NPK—HA (106—135—140 cm), the dependence of DM content at harvest on plant height decreased (0.2297—0.0953—0.1307 R2, respectively (Figure 4b)). Similarly, a valid but more order can be observed in the linear trends of cultivars evaluated according to treatment (0.6807—0.7200—0.4327 R2 on average, respectively (Figure 5d–f)).
The data concerning DM content at harvest (Table 7 and Figure 3a) indicate the crop’s high amount of moisture content in the fresh phytomass under semi-arid to semi-humid conditions of moderate climate. The applied trend analyses (Figure 4c and Figure 5d–f) regarding the treatments and the cultivars according to treatment suggest some practical implications; however, the higher moisture content at harvest can be associated with higher DM yield potential and less senescence, respectively.
3.3. Weather and Soil-Climate Conditions
The experiment was established by sowing under dry conditions in the spring of 2018. Data on weather and soil-climate parameters, which were monitored in the establishment year from April until September, as well as during subsequent years, are presented in Table 4. Regarding weather conditions, the included years varied, while lack of moisture was typical for 2018 and 2022, and sufficient moisture was typical from 2019 to 2021. To ensure the emergence of plants and also initial growth, the entire experiment had to be irrigated regularly in the period of two months after the sowing with a total irrigation water dose of 100 mm. The trial was not irrigated during the following period, in the establishment year, nor in subsequent years.
The crop growth and phytomass yield, respectively, were strongly affected by years (Table 7), especially when considering the comparable three full-production years (2020–2022). Although the weather of 2020–2022 was typical for the continental moderate climate, it also varied by year (Table 4). Therefore, the linear course of the yield dependence on weather conditions is displayed in Figure 6, and the relations are presented according to treatment and cultivars. There is evidence of the positive effect of the sum of precipitation increasing (R2 0.612) and the negative effect of average day temperature increasing (R2 0.721) relative to the crop yield increase, in general. According to treatment, the average reliability index of the relations was similar (0.577—0.668—0.590 R2 in the order HA—NPK—UC, respectively concerning the precipitations, and 0.676—0.765—0.721 R2, respectively, concerning temperature). From this analysis, it follows that the decisive factor that influences increases in yield was sufficient precipitation; a lack of precipitation was a limiting factor.
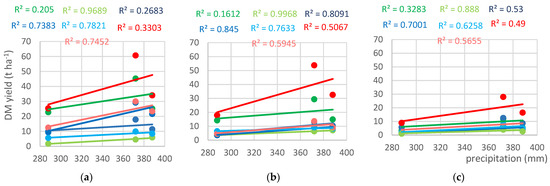
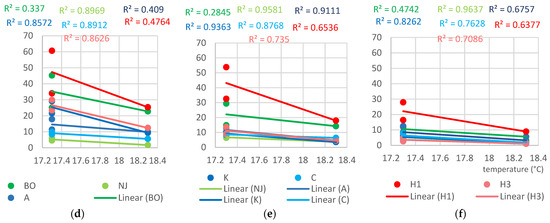
Figure 6.
The linear course of dependence of dry matter yield on precipitation (a–c) and air temperature (d–f) according to treatments HA (a,d), NPK (b,e), and UC (c,f).
A more detailed overview of the time development of soil moisture is provided in Figure 7. The main vegetation period of the three fully productive years and two soil depths are included in the figure, and indicative values of two hydro limits are also assigned, namely the wilting point (WP) and the field water capacity (FWC). WP is characterized by the moisture at which crops are insufficiently supplied with water and die, and FWC is characterized by soil moisture at the boundary between capillary and gravity water. WP usually ranges from 17 to 23% in heavy soils, while FWC usually ranges from 35 to 46% in heavy soils, averaging approximately 20 and 40%, respectively [48,49,50]. It is evident from the figure that sufficient soil moisture was almost optimal in 2021, which was also characterized by the highest DM yield. In contrast, the least favorable course of soil moisture availability occurred in 2022, which was also characterized by the lowest DM yield.
Figure 7.
The time development of soil moisture (hour records) in full-production years at depths of 20 cm (a) and 50 cm (b). Data supplemented with the hydro-limit of field water capacity and wilting point (40 and 20%, respectively, ranging from 35 to 46 and 17 to 23%, respectively in clay-loamy, heavy soils).
Regarding the treatments, the strong influence of the contrasting conditions was the least expressive under the HA treatment (Figure 6). An ameliorative dose of soil preparation based on humic acids was used, which possibly triggered a hormonal effect activated to support root growth, though this needs to be proven in more causality studies. Context connected with the time course of soil moisture in the two depths (Figure 7) supports this assumed effect due to different times and spatial availability of the soil moisture. However, the trend analyses (Figure 6) may indicate a cultivar-specific explanation for the assumed effect.
3.4. Main Chemical Properties and Nutrient Content of the Soil
The selected soil’s main chemical properties were initially determined in the autumn of 2017 (Table 1 and Table 2), then yearly in the autumns of 2018–2022 for each of the treatments. The time development of the following chemical parameters of the soil is presented in Figure 8. Finally, the changing status was calculated as the difference between the final and initial state (2022 minus 2017), and the results are presented in Table 8.
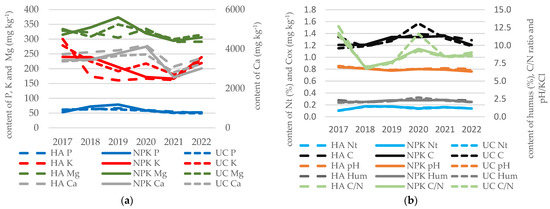
Figure 8.
The time development of selected (a,b) main chemical properties of the soil (the content of Nt, P, K, Ca, Mg, C-ox, and Humus, and pH/KCl and C/N ratio, according to treatment (HA, NPK, and UC).
Table 8.
The changing status (final minus initial state, 2022 vs. 2017) of the content of nutrients in the topsoil (0–30 cm).
When the experiment was established, the soil was characterized by a sufficient content of nutrients, neutral soil reaction, and well-balanced homogeneity. In general, the changing status of the parameters was negative, excluding the content of total nitrogen Nt. The highest change was recorded for the soil’s Ca content (max. −421.3 mg kg−1), which was not supplied, followed by a smaller change concerning K (max. −67.60 mg kg−1), Mg (max. −37.30 mg kg−1), P (max. −12.37 mg kg−1), pH/KCl (max. −0.65 mg kg−1), and Cox (max. −0.056%), while the proportion of Nt increased to a maximum of 0.039%. Regarding the treatments, the causality of the changing status can be associated mainly with increased consumption caused by the increased crop yield; however, the change is a result of more complex activities, which include nutrient-availability processes, and the values can be affected by soil non-homogeneity as well. Therefore, the time development of the chemical parameters of the soil (Figure 8) seems to be more year-specific than treatment-specific. However, this can also be connected with the switchgrass’ strong root activities. Regarding the methodology used, the small-plot screening was not designed for an exact nutrient balance, whereas, regarding the separate humic or NPK treatments, the nutrition management of switchgrass can be optimized through the mixed treatment of mineral and humic amendments.
4. Discussion
4.1. Switchgrass DM Yields
4.1.1. Maximal Yields
One of the main objectives of this paper is to verify the potential of aboveground phytomass of switchgrass, and a DM yield of 9.02 t ha−1 in total average was achieved with the yields varying from 0.05 t ha−1 to 60.64 t ha−1. The maximal DM yield of 60.64 t ha−1 refers to the most productive cultivar of EG 1101 under HA treatment, which was achieved only in a single year (2021) characterized by the most optimal weather conditions. The second- and third-highest DM yields were achieved in the same year, while 53.76 and 45.20 t ha−1 refers to the same cultivar of EG 1101 under NPK treatment and the cultivar of BO Master under HA treatment, respectively. The fourth- and fifth-highest DM yields, 45.20 and 34.02 t ha−1, were achieved in 2020, with the cultivar of EG 1101 in the same sequence of treatments as in 2021 presenting the maximal DM yield and second-highest DM yield, respectively.
The highest DM yield of 44.22 t ha−1, which was discovered by searching through a great number of research papers, is connected with the study of Ma et al. [23] who verified several cultivars of switchgrass regarding their yield potentials and adaptability in five diverse environments on the Loess Plateau of China. In their research, Alamo was the best cultivar with the highest DM yields, while Illinois, USA, and Cave-in-Rock growths achieved DM yields of 10.59 and 9.36 t ha−1, respectively. The second-highest DM yield of 34.6 t ha−1 is documented in the study of Sladden et al. [24] who tested the productivity of eight switchgrass cultivars. In 1989, the DM yields of Alamo and Kanlow were 17.5 and 13.8 t ha−1, respectively, while the yields provided by the other six varieties averaged 8.6 t ha−1. In the following year (1990), DM yield almost doubled for Alamo (34.6 t ha−1) and increased 68% for Kanlow (23.2 t ha−1) over that achieved the previous year. The average yields of the other varieties increased slightly to 9.4 t ha−1. Similarly, according to the results of the study by Liu et al. [25] the yield difference between upland and lowland ecotypes ranged from 0 to 34 t ha−1 DM, while the weighted average yield of the lowland ecotype (20 t ha−1) was significantly higher than the upland type (5 t ha−1). In the experiment by Forster et al. [7] aimed at examining seeding rates and row spacing, cultivar of EG 1101 planted in February and May produced the greatest DM yield: 19.9 and 14.6 t ha−1, respectively. They concluded that upland switchgrass may be successfully planted in autumn in the southern Great Plains, while lowland switchgrass should be planted only in the spring because of seedlings’ susceptibility to freezing. This also confirms the correct agronomy for establishing the presented screening experiment.
4.1.2. Usual Yields
In agreement with the average yield of 9.02 t ha−1 presented in this study, a similar average yield of switchgrass is documented in most of the research papers worldwide. According to Duchemin et al. [26], average DM yields of 9.6 and 9.7 t ha−1 were achieved in Quebec City and Fredericton, respectively, while lower than average DM yields of 10.8, 10.4, and 11.0 t ha−1 were achieved in Saint-Hubert, Ottawa, and London, respectively. In the study by Bekewe et al. [27] on switchgrass treatments, DM yield ranged from 4.2 to 13.1 t ha−1, while in the following year it ranged widely from 0.5 to 14.0 t ha−1. According to the research of Brown et al. [28] carried on marginal lands under low fertility conditions, switchgrass DM yields varied from 5.0 to 10.0 t ha−1. A site reclaimed with topsoil and municipal sludge produced biomass yields of 19.0 t ha−1 for Cave-in-Rock switchgrass after the sixth year, almost double the varieties Shawnee and Carthage, at 10.0 and 5.7 t ha−1, respectively. Switchgrass yields on another site with no topsoil were 1.0 7 t ha−1 after the sixth year with little variation among cultivars. According to similar investigations by Brown et al. [29] carried on marginal lands and on reclaimed surface-mined sites, DM yields for Cave-in-Rock, Shawnee, and Carthage cultivars varied from 4.2 to 13.0 t ha−1 averaged over 6 years at a reclaimed Hampshire site, and fertilization increased yields of Cave-in-Rock at Black Castle and Coal Mac sites from 0.3 to 2 t ha−1 during the first 3 years. According to a study by Baute et al. [30], DM yield of switchgrass ranged from 4.9 to 6.9 t ha−1.
The yield potential of switchgrass presented in this work was achieved based on a small plot screening trial, and it appears to be substantially higher than most of the trials discussed. Regarding nutrition, this agrees with the conclusion of Virgilio et al. [36] who claim that the harvested phytomass of switchgrass is generally much lower than its potential due to several factors including not recovering all the phytomass at harvest, weed competition, potential pests, disease, and spatial variation of soil features. However, achieving such high yields during cultivation is also unlikely for many other reasons, including a range of botanic, agronomic, and environmental causes.
Concerning botanical causes, most of the discussed studies are based on older cultivars, including Kanlow, Alamo, and Carthage, which were included in this paper. This lack of information is typical for newer cultivars and hybrids, which is why cultivars from EG 1101, EG 1102, BO Master, and NJ Ecotype were included in the study.
4.2. Environmental Causes
According to an extensive study by Alexopoulou et al. [31] concerning lowland and upland switchgrass ecotypes compared in Greece, despite similar phytomass productions (9.8 and 10.0 t ha−1 DM for uplands and lowlands, respectively), the upland ecotypes showed significantly higher yield stability (CV of 24 and 32% for uplands and lowlands, respectively) over 17 years (1998–2015). DM yield varied considerably across years and locations; they found a yield of 13.6 t ha−1 DM in the northern Italian environment, which means that the annual yield of switchgrass was 30% higher in the northern compared to southern Mediterranean conditions. Comparable extensive studies, which must come from different continental conditions of Central European sub-regions, have not yet been carried out, and the submitted work is referring to the environment of the Eastern Slovakian Lowland especially.
The Eastern Slovakian Lowland is an area with a moderate continental climate [48,49,50]. During the three fully productive years of the experiment, the driest year (288 mm precipitation from April to September) saw a DM yield of 7.73 t ha−1, and the wettest year (388 mm) saw an average DM yield of 19.13 t ha−1. UC switchgrass achieved DM yields of 2.95 and 9.90 t ha−1 in 2022 and 2021, respectively. In the research of Muir et al. [32], in the drier (340 mm) year, switchgrass produced a DM yield of 2.41 t ha−1, while in the year with 687 mm rainfall, a DM yield of 5.49 t ha−1 was produced. The objective of the study by Stroup et al. [34] was to examine lowland (Alamo and Kanlow) and upland (Blackwell and Caddo) cultivars for differences in response to water deficits and N fertilizer. Cultivars were grown in pots with fritted clay at two water levels: well-watered and deficit conditions (−0.1 and −1.0 MPa) and two N levels (10 and 100 kg ha−1). N determined the growth potential of the cultivars more than water availability, and N proved to have more of an effect on single-leaf photosynthesis rates than water. This conclusion supports the results of this paper.
4.3. Agronomic Causes
Despite the cardinal approach by which switchgrass has a prolific yield and low inputs, making it an attractive crop for biomass feedstock, the presence of a severe yield year response is in agreement with more precise conclusions [33,35]. However, low-input production is desirable, with only residual fertility in the soil and no irrigation, though it is possible to produce the phytomass from perennial grasses with minimal inputs; however, the high nutrient removal rates suggest that this may not be sustainable for long periods. According to the findings of Knoll et al. [35], switchgrass is removed annually at 83 kg ha−1 N and 140 kg ha−1 K. In agreement with the mentioned findings concerning the yield response, Virgilio et al. [36] found significant correlations between DM yields and soil moisture as well as soil content of N, P, and soil pH. Nutrient removal is also important according to the study by Rivera-Chacon et al. [37], which concluded that nutrient removal ranged from 43 to 137, 3.6 to 25.1, and 54 to 213 kg ha−1 for N, P, and K, respectively. According to Hoagland et al. [38], little information exists regarding switchgrass management and production on marginal lands. The objective of their study was to determine the effect of N fertilizer rate (0, 56, 112, 168, and 224 kg ha−1) on DM yield. Results showed a positive response of switchgrass DM to N fertilizer with no yield gain above 112 kg ha−1 of N. Kering et al. [39] tested whether the application of fertilizer to marginal soil increases switchgrass phytomass production. In their field experiment, yield response to K fertilizer (0 and 68 kg ha−1 K) on N-sufficient and N-deficient switchgrass (0 and 135 kg ha−1 N) was evaluated. Switchgrass receiving both N and K produced the greatest DM yield of 19.2 t ha−1.
Later conclusions of Alexopolou et al. [5] were based on the previously mentioned long-term (1998–2015) study on switchgrass that had been carried out on a marginal area in Greece comparing five varieties dealing with increasing nitrogen fertilization rates (0, 75 and 150 kg ha−1 N). They recorded quite satisfactory DM yields of 8.9 t ha−1 even at the establishment year due to successful establishment, while the ceiling yields were recorded in the 2nd year and rose to 20 t ha−1 DM. The tested lowland varieties (Alamo, Kanlow, and Pangburn) were more productive compared to the upland varieties (Blackwell and CIR) with mean dry yields of 12.37 and 11.39 t ha−1, respectively, and showed higher resistance to lodging. From the fourth growing season and onwards, significantly higher yields were recorded under increasing N fertilization up to 150 kg ha−1 N with an average DM yield of 13.9 t ha−1 DM over all varieties and years. The corresponding yields for the other two tested nitrogen rates (0 and 75 kg ha−1 N) were 10.31 and 11.69 t ha−1, respectively. According to the conclusions of Northern European research conducted by Lemežienė et al. [8], ecotypes from North Dakota exhibited a high breeding potential and good prospects in northern regions of Europe due to the genotypic variation of their winter hardiness trait. The Alamo variety and others that originated in warmer climate zones (6–9 hardiness zone) were heavily damaged or completely killed. The worst overwinter survival of plants was recorded after the first winter. The Eastern Slovakian Lowland is an area with a moderate continental climate with the presence of hot and dry summers and wet and cold winters. Therefore, it follows that plants acquire the ability to overwinter through the most critical first winter differently or plants acquire a certain minimum phytomass formed up to the winter coming, which is given by the cultivar itself and also influenced by management practices. The lowest phytomass in the year of sowing (2018) was recorded under the untreated control with a DM yield of 0.11 t ha−1, while 0.65 and 0.44 t ha−1 were recorded under the HA and NPK treatments (Figure 2); therefore the plants entered the first winter more developed. In terms of cultivars, the formation of the lowest phytomass volume equal to a DM yield of 0.02 t ha−1 in the sowing year was recorded for the cultivars EG 1102, Carthage, and NJ Ecotype (Figure 2).
Unfortunately, among the humic amendment studies [10,11,12,13,14,15,16,17,18,19,20,21,22] there is no direct switchgrass paper; the topic is desirable to be studied in the future, especially concerning root growth. The most important assumption of this paper, described above concerning the probable start of the hormonal effect of the humic amendment, could also be influenced by the application of additional irrigation in the period 2 months after sowing, which also needs to be studied more closely. The concentrations of humic substances causing consistent plant biostimulation according to Olaetxea et al. [51] at the level of 150–350 mg L−1 of soil solution can be achieved by the tested ameliorative dose of the humic amendment. However, from the presented time development of soil moisture (Figure 7), it is also evident that other practical agronomic causes play a role. Besides the year-specific option, it is essential that the correct depth of incorporation must be applied. An excessive dilution of humic amendment can occur when working deeper than the germination zone.
4.4. Plant Height and DM Content
Within the three fully productive years, the average height of switchgrass was 143 cm and ranged from 66 to 223 cm, while the average DM content was 41.59% and ranged from 26.33–57.10%. The initial growth of the crop was slow; in the establishment year, the plant height was 45—70—80 cm, with the order UC—NPK—HA. In the research of Madakadze et al. [40] maximum canopy heights were 193, 170, and 178 cm for Cave-in-Rock, Pathfinder, and Sunburst, respectively. The respective end-of-season DM yields were 12.2, 11.5, and 10.6 t ha−1, whereas biomass production among the cultivars appeared to be related to the time of maturation. According to McInthosh et al. [2], in addition to interest in using native warm-season grasses, especially switchgrass, as a phytomass crop, there is the potential to utilize the early growth of these plants as a forage crop (i.e., hay), allowing the regrowth to be harvested as a fibrous energy crop. According to Shinners et al. [33], when switchgrass is harvested as energy phytomass, the crop is more mature and has a much greater yield than when harvested as animal forage. When the crop stand was left standing over winter and harvested in the spring, DM yields were reduced by 17% compared to August. Switchgrass tended to dry faster with drying rates being faster than typically experienced with other energy or forage crops.
5. Conclusions
The influence of humic ameliorative amendment to soil on the yield potential of green phytomass of switchgrass was verified, and the effect of basic mineral nutrition and low-input untreated control were also included in testing seven cultivars under a Central European semi-arid to semi-humid moderate climate from 2018 to 2022. In general, switchgrass productivity increased as the utility years approached; however, the effect of the driest year changed the order of the three full utility years. The humic amendment to the soil was characterized by the highest average yield, most probably due to activating a hormonal effect that supports crop growth, which needs to be proven more closely through a special study aimed at roots. Causally connected with the time course of soil moisture in two followed depths, the different availability of moisture supported this assumed effect. Besides the ameliorative dose of the humic amendment itself, the probable start of the hormonal effect could also be influenced by the application of additional irrigation in the period 2 months after sowing, which also needs to be studied more closely.
Although the effect of the cultivar seems to be statistically the least significant factor, the cultivars significantly differ from one another, achieving multiple differences within the average yield as within the maximal ones. This research on switchgrass is most probably the first screening study conducted in Slovakia. Therefore, the cultivar order EG 1101 ˃ BO Master ˃ EG 1102 ˃ Kanlow ˃ Alamo ˃ Carthage ˃ NJ Ecotype can be important, due to the crop being recognized as a suitable perennial energy crop for long-term cultivation. When growing switchgrass, it is possible to achieve medium-to-high yields of phytomass even in continental Central European conditions. However, for long-term sustainability, correct nutrition management is required, within which it is recommended that researchers study more closely a complementary humic–mineral approach as well. Therefore, further agronomic follow-up studies are desired.
Author Contributions
Conceptualization, Š.T.; methodology, Š.T.; software, Š.T. and Š.D.; validation, Š.T. and Š.D.; formal analysis, Š.T. and Š.D.; investigation, Š.T. and Š.D.; resources, Š.T. and Š.D.; data curation, Š.T. and Š.D.; writing—original draft preparation, Š.T. and Š.D.; writing—review and editing, Š.T. and Š.D.; visualization, Š.T. and Š.D.; supervision, Š.T.; project administration, Š.T.; funding acquisition, Š.T. All authors have read and agreed to the published version of the manuscript.
Funding
This research was funded by the support of (i) HORIZON 2020/FLAGSHIP project BIOSKOH ID: 709557 BBI-FLAG Innovation Stepping Stones for a novel European Second Generation BioEconomy support; (ii) Operational Program Integrated Infrastructure for the project: Support for research, development, and innovation international NPPC projects approved in program H2020 no. 313011W956, co-financed by resources of the European Regional Development Fund; and (iii) Operational Programme Integrated Infrastructure within the project INOVAFERT: Innovative fertilizers with alternative natural sources and their implementation in agrotechnical practices, ID 313011BWL7, co-financed by the European Regional Development Fund.
Data Availability Statement
The datasets generated and analyzed during the current study are available from the authors upon a reasonable request.
Acknowledgments
The authors express their gratitude to the editor and the reviewers for their constructive comments.
Conflicts of Interest
The authors declare no conflict of interest. The funders had no role in the design of the study; in the collection, analyses, or interpretation of the data; in the writing of the manuscript; or in the decision to publish the results.
References
- Brodowska, M.S.; Muszyński, P.; Haliniarz, M.; Brodowski, R.; Kowalczyk-Juśko, A.; Sekutowski, T.; Kurzyna-Szklarek, M. Agronomic aspects of switchgrass cultivation and use for energy purposes. Appl. Ecol. Environ. Res. 2018, 16, 5715–5743. [Google Scholar] [CrossRef]
- McIntosh, D.W.; Bates, G.E.; Keyser, P.D.; Allen, F.L.; Harper, C.A.; Waller, J.C.; Birckhead, J.L.; Backus, W.M. The impact of harvest timing on biomass yield from native warm-season grass mixtures. Agron. J. 2015, 107, 2321–2326. [Google Scholar] [CrossRef]
- Ashworth, A.J.; Keyser, P.D.; Holcomb, E.D.; Harper, C.A. Yield and Stand Persistence of Switchgrass as Affected by Cutting Height and Variety. Forage Grazinglands 2013, 11, 1–7. [Google Scholar] [CrossRef]
- Christian, D.G.; Riche, A.B.; Yates, N.E. The yield and composition of switchgrass and coastal panic grass grown as a biofuel in Southern England. Bioresour. Technol. 2002, 83, 115–124. [Google Scholar] [CrossRef] [PubMed]
- Alexopoulou, E.; Zanetti, F.; Papazoglou, E.G.; Christou, M.; Papatheohari, Y.; Tsiotas, K.; Papamichael, I. Long-term studies on switchgrass grown on a marginal area in Greece under different varieties and nitrogen fertilization rates. Ind. Crop. Prod. 2017, 107, 446–452. [Google Scholar] [CrossRef]
- Tóth, Š. Special Crops 28; NPPC-VÚA: Michalovce, Slovakia, 2020; p. 149. ISBN 978-80-570-1661-8. (In Slovak) [Google Scholar]
- Foster, J.L.; Guretzky, J.A.; Huo, C.; Kering, M.K.; Butler, T.J. Effects of row spacing, seeding rate, and planting date on establishment of switchgrass. Crop Sci. 2013, 53, 309–314. [Google Scholar] [CrossRef]
- Lemežienė, N.; Norkevičienė, E.; Liatukas, Ž.; Dabkevičienė, G.; Cecevičienė, J.; Butkutė, B. Switchgrass from North Dakota—An adaptable and promising energy crop for northern regions of Europe. Acta Agric. Scand. Sect. B Soil Plant Sci. 2015, 65, 118–124. [Google Scholar] [CrossRef]
- Interrante, S.M.; Hancock, D.; Butler, T.J. Switchgrass establishment and biomass yield responses to fungicide and insecticide seed treatments. Crop Forage Turfgrass Manag. 2015, 1, 1–6. [Google Scholar] [CrossRef]
- Tóth, Š.; Šoltysová, B.; Danilovič, M.; Kováč, L.; Hnát, A.; Kotorová, D.; Šariková, D.; Jakubová, J.; Balla, P.; Štyriak, I.; et al. The Meaning and Effect of Different Types of Soil Improvers in Conditions of Different Soil Management Practice, 1st ed.; Centrum výskumu rastlinnej výroby Piešťany: Michalovce, Slovakia, 2013; p. 108. ISBN 978-80-89417-46-9. (In Slovak) [Google Scholar]
- Holatko, J.; Hammerschmiedt, T.; Latal, O.; Kintl, A.; Mustafa, A.; Baltazar, T.; Malicek, O.; Brtnicky, M. Deciphering the Effectiveness of Humic Substances and Biochar Modified Digestates on Soil Quality and Plant Biomass Accumulation. Agronomy 2022, 12, 1587. [Google Scholar] [CrossRef]
- Nardi, S.; Schiavon, M.; Muscolo, A.; Pizzeghello, D.; Ertani, A.; Canellas, L.P.; Garcia-Mina, J.M. Editorial: Molecular characterization of humic substances and regulatory processes activated in plants. Front. Plant Sci. 2022, 139, 851451. [Google Scholar] [CrossRef]
- Tóth, Š.; Szanyi, G.; Vančo, P.; Schubert, J.; Porvaz, P.; Bujňák, P.; Šoltysova, B.; Danielovič, I. The influence of mineral nutrition and humic acids on the intensity of photosynthesis, as well as the yield and quality of seeds, roots, and aboveground phytomass of milk thistle Silybum marianum (L.) Gaertn. in marginal growing conditions. Eur. Pharm. J. 2022, 69, 27–36. [Google Scholar] [CrossRef]
- Baltazar, M.; Correia, S.; Guinan, K.J.; Sujeeth, N.; Bragança, R.; Gonçalves, B. Recent Advances in the Molecular Effects of Biostimulants in Plants: An Overview. Biomolecules 2021, 11, 1096. [Google Scholar] [CrossRef]
- Kołodziejczyk, M. Influence of humic acids, irrigation and fertilization on potato yielding in organic production. Agron. Res. 2021, 19, 520–530. [Google Scholar] [CrossRef]
- Holatko, J.; Hammerschmiedt, T.; Kintl, A.; Danish, S.; Skarpa, P.; Latal, O.; Baltazar, T.; Fahad, S.; Akça, H.; Taban, S.; et al. Effect of carbon-enriched digestate on the microbial soil activity. PLoS ONE 2021, 17, e0274148. [Google Scholar] [CrossRef] [PubMed]
- Wilczewski, E.; Szczepanek, M.; Wenda-Piesik, A. Response of sugar beet to humic substances and foliar fertilization with potassium. J. Cent. Eur. Agric. 2018, 19, 153–165. [Google Scholar] [CrossRef]
- Tóth, Š.; Rysak, W.; Šoltysová, B.; Karahuta, J. Effect of soil conditioner based on humic acids HUMAC Agro on soil and yield and sugar content of sugar beet in context of selected indicators of agriculture system sustainability. Listy Cukrov. A Reparske 2015, 131, 53–58. [Google Scholar]
- Muscolo, A.; Sidari, M.; Nardi, S. Humic substance: Re-lationship between structure and activity, deeper informationsuggests univocal findings. J. Geochem. Explor. 2013, 129, 57–63. [Google Scholar] [CrossRef]
- Trevisan, S.; Francioso, O.; Quaggiotti, S.; Nardi, S. Humic substances biological activity at the plant-soil interface: From environmental aspects to molecular factors. Plant Signal. Behav. 2010, 5, 635–643. [Google Scholar] [CrossRef]
- Nardi, S.; Carletti, P.; Pizzeghello, D.; Muscolo, A. Biological Activities of Humic Substances. In Bio-Physico-Chemical Processes Involving Natural Nonliving OrganicMatter in Environmental Systems; Wiley: Hoboken, NJ, USA, 2009; Chapter 8; pp. 305–339. [Google Scholar] [CrossRef]
- Šimanský, V.; Wójcik-Gront, E.; Horváthová, J.; Pikuła, D.; Lošák, T.; Parzych, A.; Lukac, M.; Aydın, E. Changes in Relationships between Humic Substances and Soil Structure Following Different Mineral Fertilization of Vitis vinifera L. in Slovakia. Agronomy 2022, 12, 1460. [Google Scholar] [CrossRef]
- Ma, Y.; An, Y.; Shui, J.; Sun, Z. Adaptability evaluation of switchgrass (Panicum virgatum L.) cultivars on the Loess Plateau of China. Plant Sci. 2011, 181, 638–643. [Google Scholar] [CrossRef]
- Sladden, S.E.; Bransby, D.I.; Aiken, G.E. Biomass yield, composition and production costs for eight switchgrass varieties in Alabama. Biomass Bioenergy 1991, 1, 119–122. [Google Scholar] [CrossRef]
- Liu, Y.; Hastings, A.; Chen, S.; Faaij, A. The development of a new crop growth model SwitchFor for yield mapping of switchgrass. GCB Bioenergy 2022, 14, 1281–1302. [Google Scholar] [CrossRef]
- Duchemin, M.; Jégo, G.; Morissette, R. Simulating switchgrass aboveground biomass and production costs in eastern Canada with the integrated farm system model. Can. J. Plant Sci. 2019, 99, 785–800. [Google Scholar] [CrossRef]
- Bekewe, P.E.; Castillo, M.S.; Rivera, R. Defoliation management affects productivity, leaf/stem ratio, and tiller counts of ‘performer’ switchgrass. Agron. J. 2018, 110, 1467–1472. [Google Scholar] [CrossRef]
- Brown, C.; Griggs, T.; Keene, T.; Marra, M.; Skousen, J. Switchgrass Biofuel Production on Reclaimed Surface Mines: I. Soil Quality and Dry Matter Yield. Bioenergy Res. 2016, 9, 31–391. [Google Scholar] [CrossRef]
- Brown, C.; Griggs, T.; Holaskova, I.; Skousen, J. Switchgrass Biofuel Production on Reclaimed Surface Mines: II. Feedstock Quality and Theoretical Ethanol Production. Bioenergy Res. 2016, 9, 40–49. [Google Scholar] [CrossRef]
- Baute, K.; Van Eerd, L.L.; Robinson, D.E.; Sikkema, P.H.; Mushtaq, M.; Gilroyed, B.H. Comparing the biomass yield and biogas potential of phragmites australis with miscanthus X giganteus and panicum virgatum grown in Canada. Energies 2018, 11, 2198. [Google Scholar] [CrossRef]
- Alexopoulou, E.; Zanetti, F.; Scordia, D.; Zegada-Lizarazu, W.; Christou, M.; Testa, G.; Cosentino, S.L.; Monti, A. Long-Term Yields of Switchgrass, Giant Reed, and Miscanthus in the Mediterranean Basin. Bioenergy Res. 2015, 8, 1492–1499. [Google Scholar] [CrossRef]
- Muir, J.P.; Foster, J.L.; Bow, J.R. Establishment-year native perennial bunchgrass biomass yields. Crop Sci. 2016, 56, 2827–2832. [Google Scholar] [CrossRef]
- Shinners, K.J.; Boettcher, G.C.; Muck, R.E.; Weimer, P.J.; Casler, M.D. Harvest and storage of two perennial grasses as biomass feedstocks. Trans. ASABE 2010, 53, 359–370. [Google Scholar] [CrossRef]
- Stroup, J.A.; Sanderson, M.A.; Muir, J.P.; McFarland, M.J.; Reed, R.L. Comparison of growth and performance in upland and lowland switchgrass types to water and nitrogen stress. Bioresour. Technol. 2003, 86, 65–72. [Google Scholar] [CrossRef]
- Knoll, J.E.; Anderson, W.F.; Strickland, T.C.; Hubbard, R.K.; Malik, R. Low-Input Production of Biomass from Perennial Grasses in the Coastal Plain of Georgia, USA. Bioenergy Res. 2012, 5, 206–214. [Google Scholar] [CrossRef]
- Virgilio Di, N.; Monti, A.; Venturi, G. Spatial variability of switchgrass (Panicum virgatum L.) yield as related to soil parameters in a small field. Field Crop. Res. 2007, 101, 232–239. [Google Scholar] [CrossRef]
- Rivera-Chacon, R.; Castillo, M.S.; Gannon, T.W.; Bekewe, P.E. Harvest frequency and harvest timing following a freeze event effects on yield and composition of switchgrass. Agron. J. 2022, 115, 222–229. [Google Scholar] [CrossRef]
- Hoagland, K.C.; Ruark, M.D.; Renz, M.J.; Jackson, R.D. Agricultural Management of Switchgrass for Fuel Quality and Thermal Energy Yield on Highly Erodible Land in the Driftless Area of Southwest Wisconsin. Bioenergy Res. 2013, 6, 1012–1021. [Google Scholar] [CrossRef]
- Kering, M.K.; Butler, T.J.; Biermacher, J.T.; Mosali, J.; Guretzky, J.A. Effect of Potassium and Nitrogen Fertilizer on Switchgrass Productivity and Nutrient Removal Rates under Two Harvest Systems on a Low Potassium Soil. Bioenergy Res. 2013, 6, 329–335. [Google Scholar] [CrossRef]
- Madakadze, I.C.; Stewart, K.; Peterson, P.R.; Coulman, B.E.; Smith, D.L.; Zhou, X. Switchgrass biomass and chemical composition for biofuel in eastern Canada. Agron. J. 1999, 91, 696–701. [Google Scholar] [CrossRef]
- Slovak Law No. 151/2016, Law Digest, Decree of the MPRV SR Establishing Details on Agrochemical Testing of Soils and on the Storage and Use of Fertilizers. Available online: https://www.slov-lex.sk/pravne-predpisy/SK/ZZ/2016/151/ (accessed on 15 February 2023).
- Mehlich, A. Mehlich 3 soil test extractant: A modification of Mehlich 2 extractant. Commun. Soil Sci. Plant Anal. 1984, 15, 1409–1416. [Google Scholar] [CrossRef]
- Hraško, J.; Červenka, L.; Facek, Z.; Komár, J.; Němeček, J.; Pospíšil, F.; Sirový, V. Soil Analyses, 1st ed.; Slovak Publish. Pedol. Lit.: Bratislava, Slovakia, 1962; p. 342. [Google Scholar]
- ISO 14235; Soil Quality–Determination of Organic Carbon by Sulfochromic Oxidation. 1st ed. IOS: Geneva, Switzerland, 1998; p. 5.
- ISO 10390; Soil Quality–Determination of pH. 2nd ed. IOS: Geneva, Switzerland, 2005; p. 7.
- Sotáková, S. Organic Matter and Soil Fertility; Príroda: Bratislava, Slovakia, 1982; p. 234. (In Slovak) [Google Scholar]
- Sobocká, J. Morphogenetic Classification System of Soils of Slovakia, 1st ed.; Basal reference taxonomy; Research Institute of Soil Science and Soil Conservation: Bratislava, Slovakia, 2000; p. 76. ISBN 80-85361-70-1. [Google Scholar]
- Kandra, B.; Tall, A.; Gomboš, M.; Pavelková, D. Quantification of Evapotranspiration by Calculations and Measurements Using a Lysimeter. Water 2023, 15, 373. [Google Scholar] [CrossRef]
- Tall, A.; Kandra, B.; Gomboš, M.; Pavelková, D. The influence of soil texture on the course of volume changes of soil. Soil Water Res. 2019, 14, 57–66. [Google Scholar] [CrossRef]
- Gomboš, M.; Tall, A.; Kandra, B.; Balejčíková, L.; Pavelková, D. Geometric factor as the characteristics of the three-dimensional process of volume changes of heavy soils. Environments 2018, 5, 45. [Google Scholar] [CrossRef]
- Olaetxea, M.; De Hita, D.; Garcia, C.A.; Fuentes, M.; Baigorri, R.; Mora, V.; Garnica, M.; Urrutia, O.; Erro, J.; Zamarreño, A.M.; et al. Hypothetical framework integrating the main mechanisms involved in the promoting action of rhizospheric humic substances on plant root- and shoot- growth. Appl. Soil Ecol. 2018, 123, 521–537. [Google Scholar] [CrossRef]
Disclaimer/Publisher’s Note: The statements, opinions and data contained in all publications are solely those of the individual author(s) and contributor(s) and not of MDPI and/or the editor(s). MDPI and/or the editor(s) disclaim responsibility for any injury to people or property resulting from any ideas, methods, instructions or products referred to in the content. |
© 2023 by the authors. Licensee MDPI, Basel, Switzerland. This article is an open access article distributed under the terms and conditions of the Creative Commons Attribution (CC BY) license (https://creativecommons.org/licenses/by/4.0/).