Abstract
Our economic analysis aimed to evaluate the profitability of winter bread wheat production based on two fundamental aspects. The first was the grainprotein content as a criterion for determining grain prices. The other was a comparative simulation of production profitability relying on grain production costs in 2015 and 2022. We used the results of a field experiment conducted in 2014 and 2015 involving winter bread wheat fertilised with nitrogen applied at progressive increments of 40 kg N ha−1 within arange from 0 to 240 N ha−1 with or without fungicide protection. We assumed that experimental factors significantly affected both the yield and the market value of grain, and hence the profitability conditioned by wheat prices on global markets. The working hypothesis of this paper is: wheat production profitability has not changed in the face of a global energy crisis. Our analysis shows that growing bread wheat generates profit when inputs are high: these inputs include high nitrogen rates and full crop protection. The real grain selling price guarantees production profitability. We should consider that, in the circumstances of a global energy crisis, the world should possibly switch to baking products from low-protein flour. Only upon such an assumption can the expenditure on fertilisers and fungicides be significantly reduced.
1. Introduction
In 2050—that is, over the next 28 years—the world population will reach 9–10 billion people [1,2]. To compare, in 1960, the human population was 3 billion and this doubled over the next40 years. Such a dynamic trend raises concerns among economists and environmentalists [3]. Unfortunately, it is estimated that in the present-day world, 800 million people are chronically undernourished and about ½ of the human population suffers from a deficiency inat least one microelement [4,5,6,7]. In contrast, an objective of the food security policy is to provide standard nutrition of 2800–3000 kcal per day−1 per person−1. This can be accomplished, but is associated with the necessity ofincreasing food production, particularly cereal grains that, directly or indirectly through animal production (meat), cover 2/3–3/4 of the human energy requirement and ½ of the protein requirement. About 40% of the grains produced are currently utilised for animal production [8].
In the past century, the size of agricultural production was a function of two factors, namely [9]:
- (1)
- Crop yield;
- (2)
- Surface area of freshly managed soils.
The role of the first predominant factor (>75% share in the growth of food production) stemmed from the joint activity of three main groups of factors, namely (i) biological progress—new cultivars, (ii) nitrogen rate intensification, (iii) intensification of chemical protection of crops [10,11,12,13,14]. Cultivar is very important for intensive crop production, and its efficiency is mainly determined by two factors: water and nitrogen, so-called yield limiting factors [12,13,15]. However, excessive doses of nitrogen and pesticides result in pollution pressure on the environment [16]. In view of food security, neither nitrogen nor pesticides can be eliminated from agricultural production [17,18]. Recently, it has been demonstrated that water and nitrogen are not substitutes in agriculture production [15]. Thus, irrigating agricultural crops without simultaneous adequate dosage of nitrogen and minerals activating the function of nitrogen does not lead to increased yield.
The world’s most essential crop is bread wheat (Triticum aestivum spp. vulgare). It is grown all over the world and has about 50,000 cultivars. The main producers of bread wheat are China, India, the USA, Russia and France. Poland ranks 17th in the world in terms of wheat production. Wheat accounts for 22.3% of Polish grain crops. It is grown over an area of 2,391,000 ha. The mean crop yield in 2021 was 4.46 t ha−1, and the harvest yield amounted to 10,004,000 tonnes [19]. Wheat is a primary consumer grain due to grain composition, including the content of gluten, which is a component determining the suitability of grain, and more specifically flour, for bread making [20,21]. Wheat grain that does not satisfy bread-making specifications is considered fodder grain [22]. The global energy crisis is continuing, affecting the prices of nitrogen fertilisers. Schnitkey et al. [23] report that increased nitrogen prices in 2022 are a response to the COVID-19 pandemic, general inflation, increasing gas prices, the military conflict between Russia and Ukraine and the European fossil fuel policy. These factors affected the global market and contributed to an increase in the prices of both fertilisers and grains. There are some concerns that, in the US, maize crops, which require nitrogen fertilisers, will be replaced by soybean [23].
The literature mentions that the COVID-19 pandemic and the war in Ukraine pose a risk to food security, notably in developing countries. Increasing costs of energy crops and fertilisers gave rise to higher food prices [24,25]. According to UNCTAD, in 2020, Ukraine accounted for 36% of the global export of sunflower oil and seed (Russia supplied 17%), 13% of maize (1%), 11% of rye (12%), 10% of rapeseed (6%) and 9% of wheat (18%). They were mainly exported to developing countries in Africa and the Middle East [26]. The military conflict between Russia and Ukraine, firstly, has ledto a direct increase in the prices of many food products due to their limited supply. Secondly, it has had an intermediate effect on the agri-food market, resulting in an increase in the prices of energy crops. Thirdly, the war reduces the possibility of providing international humanitarian aid and increases costs [27].
The crop yield and grain quality of wheat are also determined by weather conditions in the period of vegetation, soil conditions and agro-technical factors [28]. In order to achieve a high yield of adequate quality wheat grain, along with satisfactory economic effects and ecological security, it is necessary to accurately establish the nitrogen requirement of plants at respective growth and development stages [29]. Nitrogen fertilisers have a significant effect on the protein content of wheat grain and, as a consequence, on wheat prices. The minimum protein content (N × 5.7) for exported bread wheat should be 12.5%, while that of wheat sold on the domestic market is 12.0%. A premium is paid for protein content exceeding 13% [30]. Availability of nutrients supplied with fertilisers, and notably nitrogen fertilisation intensity in combination with crop protection, determines the technological value of wheat grain [31]. Proper cultivar selection is the underlying condition for ensuring the desired technological properties of grain, and intensive crop protection and nitrogen fertilisation make it possible to achieve higher yields and improve the technical quality of flour [32]. Proper nitrogen fertiliser levels affect grain yield [33]. This is due to the fact that nitrogen supplied to plants stimulates crop tillering and hence spike density per unit area and increases grain weight and quantity. In addition, it significantly affects the consumer quality of grain by increasing its protein content [34]. Grain quality depends on many factors, including—next to cultivars and weather conditions—nitrogen fertilisers and fungicide protection. The total protein content is observed to increase at higher N rates [35]. Other studies showed that 120 and 160 kg N∙ha−1 increased the content of protein and wet gluten compared with nitrogen-free crops [34]. Among agrotechnical factors, nitrogen fertilisation has the greatest importance for wheat grain quality [4,22]. The results of many studies indicate that increased nitrogen application causes the content of protein and wet gluten to increase in the grain. However, increased nitrogen application is not always accompanied by an increase in quality. Excessive application of nitrogen increases the proportion of low-molecular-weight gliadins in the protein, which reduces the original properties of gluten [22]. The application of nitrogen in excessive amounts has a detrimental effect on milling properties because a high content of ash is observed in the grain [4].
Increased nitrogen levels in the plants normally trigger an increase in crop susceptibility to pathogens [36,37]. Winter bread wheat is a grain susceptible to fungal diseases. Yield loss induced by pathogens can reach from 20% to 30%, up to 50% [38]. In present-day agriculture, large-scale production is impossible without pesticides protecting crops from agrophages [34]. Other authors reported that infestation of wheat by Gaumannomyces graminis var. Tritici reduced nitrogen uptake (depending on the fertiliser combination) from 46 to 121 kg N ha−1, which reduced the yield for respective fertiliser combinations from 4.1–13.0 t ha−1 to 0.9–4.5 t ha−1 [39].
Fungal diseases are among the key production factors affecting winter bread wheat yield and grain quality [34]. On a global scale, wheat diseases lead to yield loss from 10% to 28% [40]. Studies conducted in Poland corroborated the above-presented trends, and the yield was observed to increase by 35% in conditions of increased nitrogen fertiliser rates and full crop protection [41]. According to some authors, losses induced by diseases can reach up to 45% [42,43,44].
Large-scale farms use three fungicide treatments as a standard, but particularly in years when autumn is long and warm, it is advisable to apply an extra treatment in autumn to eliminate the first infestation of leaves—mainly by powdery mildew of cereals and grasses (Blumeria graminis (DC) (Speer) and septoria tritici blotch of wheat leaves (Zymoseptoria tritici) (Fuckel J. Schröt) [44,45]. Other researchers noted that the rate of fungal infections on the leaves of winter bread wheat in 2011 was 52.8%. The application of fungicides reduced infestation from 42.7% to 66.8%. On average, grain yield increased by 8.5% compared to the control site, ranging from 0.28 t ha−1 to 1.46 t ha−1 [46].
Production technology does affect the yield and quality of agricultural crops [47,48]. However, the final confirmation that a specific technology is suitable for the practical application comes from its economic assessment [49,50,51]. The environmental impacts of certain technologies have recently become highly significant to the development of production technology, so intensive technologies typical, in particular, of farms producing large amounts of grain for sale are criticised [52]. Many farmers believe that higher fertiliser rates positively impact grain yield, and hence the farm’s income. Nevertheless, it is important to achieve an adequate production input and output ratio in the production process, which corresponds to the adequate ratio of the production value to production costs [34,52].
The purpose of our studies was an economic analysis of the profitability of winter bread wheat production based on two fundamental aspects. The first was the grainprotein content as a criterion for determining the unit prices of grain. The other was a simulation of wheat production profitability based on the costs and prices of grain in 2015 and 2022. We used the results of a field experiment conducted in 2014 and 2015 involving winter bread wheat fertilised with nitrogen applied at progressive increments of 40 kg N ha−1 within the range from 0 to 240 N ha−1 with or without fungicide protection. We assumed that experimental factors significantly affected both the yield and the market value of grain, and hence the profitability conditioned by wheat prices on global markets. The working hypothesis of this paper is: wheat production profitability has not changed in the face of a global energy crisis.
2. Materials and Methods
2.1. General Characteristics of the Source of Input Data
Data from a field experiment conducted in two vegetation seasons—2013/2014 and 2014/2015—on a crop breeding farm owned by Hodowla Roślin Smolice, Kobylin commune, Krotoszyn district, Greater Poland voivodeship, Poland (52°42′ N; 17°10′ E). The field experiment site had optimal agronomic features (neutral pH; high availability of assimilable phosphorus; medium availability of potassium; and very high availability of magnesium. The Wydma cultivar of winter bread wheat was grown on the site where winter oilseed rape had previously been grown.
Weather conditions in both years varied mainly in terms of precipitation sums in the critical period from February until June. In the 2013/2014 season, the precipitation sum was 211.5 mm, and in 2014/2015, it amounted to 136.9, which accounted for 92% and 60% of the necessary precipitation sum [14]. The mean air temperature in both seasons was +1.3 °C and +1.6 °C, respectively, which was higher than the multi-annual mean (8.6 °C).
The grain yield and core quality features were determined based on the two-way split-plot field experiment results with four replications. The experimental factors were:
- Fungicide protection (FP):
- Fungicide protection control (FP-0);
- Full fungicide protection (FP-F).
- Nitrogen rates (N), kg N ha−1: 0, 40, 80, 120, 160, 200, and 240 kg N ha−1.
The experiment covered 56 plots with a gross area of 22.5 m2 (1.5 m wide × 15 m long) for every season. Grain yield was determined per 15 m2. The fungicide protection of crops was applied on three dates during spring vegetation of winter bread wheat using the following fungicides:
- First treatment date—BBCH stage 31—Capalo 337.5 SE 1.5 L ha−1;
- Second treatment date—BBCH stage 39–49—Adexar Plus 2.0 L ha−1;
- Third treatment date—BBCH stage 65—Osiris 65 EC 2.0 L ha−1.
Ammonium nitrate fertiliser was used on three dates:
- Before the start of the spring vegetation period up to 80 kg N ha−1;
- At the late tillering stage/early shoot development stage (BBCH 29–31) up to 160 kg N ha−1;
- At the flag leaf stage (BBCH 39) up to 240 kg N ha−1.
Grain for chemical analyses was sampled from each plot during harvest (BBCH 89). Total nitrogen in grain was determined viathe Kjeldahl method (PN-EN ISO 20483:2014-02) [53]. The quality parameters of grain, such as protein (B), gluten (G) and starch (S) content, were determined in an Instalab 600 grain analyser.
2.2. Calculated Parameters
Calculations for the production and economic assessment were made according to the European Union’s methodology, where the calculation model was assumed as the calculation of gross margin in farming and the Farming Products Data Collection system AGROKOSZTY [54].
According to the methodology assumptions of the Farming Accountancy Data Network (FADN), the crop production’s gross margin is the value of crop production per hectare, less the direct costs of such production [55].
2.2.1. Direct Costs and Total Cost
Direct costs include costs attributable to a specific activity. These are the purchase of seeds, mineral fertilisers, organic fertilisers and other costs such as string, film, pots, bags, etc. Production means and materials purchased by the farm from third parties are calculated at buying prices, and those manufactured on the farm at ex-farm selling prices. Indirect costs included services, own machinery, maintenance of buildings, taxes and insurance, other costs and hired labour [56,57]. The total costs of agricultural crop production are calculated as direct cost plus (5%) indirect cost markup (on the whole farm) [58].
2.2.2. Production Value
The value of production is the sum of the main product selling prices. It also includes payments on products and areas (SAPS—single area payment scheme; CAPS–complimentary area payment scheme; and the green direct payment scheme).
When relying on gross margin calculation methods, this paper attempts to assess the production ratios for selected production variants. This assessment involves a comparison of productivity and performance efficiency for the analysed production technology.
The actual results were estimated based on production costs and wheat prices in EUR from 16 December 2015 to 2022. The data were used as the basis for grain prices [59]:
- (a)
- Wheat prices in 2015 (16 December 2015):
- (i)
- Fodder wheat up to (<12.0%)—614 PLN t−1; this price was taken into account for the fertiliser combination with 0, 40, 80 and 120 kg N ha−1;
- (ii)
- Consumer wheat (standard 12.0% protein)—663 PLN t−1; this price was taken into account for the fertiliser combination with 160 kg N ha−1;
- (iii)
- Protein premium > 13% → is standard price; that is, 729 PLN t−1 + 10%; the above-mentioned price was taken into account for the combination with 200 and 240 kg N ha−1.
- (b)
- Wheat grain prices in 2022 (on 16 December 2022):
- (i)
- Fodder wheat up to (<12.0%)—1269 PLN t−1; this price was taken into account for the combination with 0, 40, 80 and 120 kg N ha−1;
- (ii)
- Consumer wheat (standard 12.0% protein)—1334 PLN t−1; this price was taken into account for the combination with 160 kg N ha−1.
- (iii)
- Protein premium > 13% → is standard price; that is, 1467 PLN t−1 + 10% and the above-mentioned price was taken into account for the combination with 200 and 240 kg N ha−1.
2.2.3. Production and Economic Measures
The production and economic analysis was based on the following measures (referring to the unit area) [51,58,60] (Table 1).

Table 1.
Economic indicators of wheat productivity.
2.3. Statistical Analysis
The effects of individual research factors (year, nitrogen variants, plant protection methods) and their interactions on the grain yield and nitrogen productivity ratios were assessed using two-way ANOVA. Means were separated using Tukey’s Honest Significant Difference (HSD) test when the F-test indicated significant factorial effects at the level of p < 0.05. Relationships between the traits were analysed using Pearson’s correlation and linear regression. STATISTICA 12 software was used for all statistical analyses (StatSoft Inc., Polska, Tibco Gold Partner, Chicago, IL, USA, 2013).
3. Results
3.1. Basic Characteristics of Grain
Weather conditions in the study years had a significant impact on the grain yield (Table 2). In both years, the yield increased at higher nitrogen rates (Nf) in line with the quadratic function (Figure A1). The difference in yield between both years increased at higher nitrogen rates, to the benefit of 2015. The nitrogen control (NC) site was +0.627 t ha−1, and the fertiliser combination with 240 kg N ha−1 reached +3.058 t ha−1. The grain yield of winter bread wheat in the experiment, being a primary input source, was significantly determined by the interaction of both experimental factors; that is, fungicide protection and progressive nitrogen rates (FP × N). However, this interaction did not show any variability between the years (Table 2). As implied by Figure 1, on the site without fungicide protection (FP-0), subsequent doses of nitrogen (Nf) significantly increased the grain yield compared with the control site, but only for rates up to 80 kg N ha−1. On the site with fungicide protection (FP-F), the yield increased significantly for nitrogen rates up to 240 kg N ha−1. The difference between nitrogen control (NC) sites was 0.74 t ha−1 to the benefit of the site with fungicide protection. The yield gap increased with increasing nitrogen rates up to 2.363 t ha−1. The above-noted correlations can be described by respective equations (see Figure S1 for details):

Table 2.
Basic characteristics of winter wheat yield in 2014 and 2015 growing seasons.
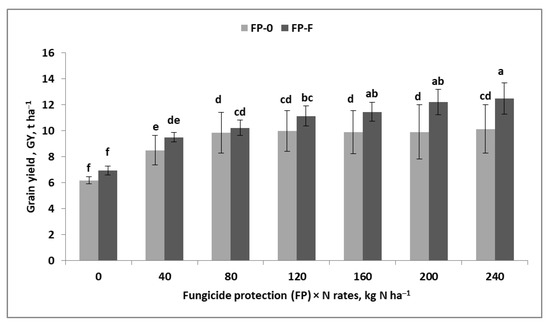
Figure 1.
Effect of winter wheat protection with fungicides and rates of fertiliser nitrogen on grain yield. Similar letters indicate a lack of significant differences using Tukey’s test. The vertical bar in the column refers to the standard error of the mean.
- (1)
- FP-0:
GY = −0.00013N2 + 0.0444N + 6.579 for R2 = 0.91, n = 7, p ≤ 0.01
- (2)
- FP-F:
GY = −0.000093N2 + 0.043N + 7.310 for R2 = 0.97, n = 7, p ≤ 0.01
- (3)
- Yield gap (LP = GY—FP-0—GY—FP-F):
LP = −0.000038N2 + 0.0013N − 0.731 for R2 = 0.86, n = 7, p ≤ 0.01
The cardinal values for equation number (1); that is, maximum grain yield (GYMax) and optimal Nf rate (Nfop) for the FP-0 site, were 10.37 t ha−1 and 170.8 kg N ha−1, respectively. The model does not reflect the real correlation between nitrogen rates and grain yield. A double linear model shows that the maximum grain yield was 9.464 t ha−1 and was achieved for Nf, amounting to 68.3 kg N ha−1. In contrast, the maximum grain yield for FP-F was 12.28 t ha−1, achieved for Nf, amounting to 231.2 kg N ha−1. The minimum yield gap of 0.72 t ha−1 was recorded for a nitrogen rate of 17.1 kg N ha−1. The yield loss increased in line with the quadratic function.
The marginal efficiency of Nf declined with each subsequent rate of nitrogen. The rate of decrease in grain yield, as illustrated by the linear regression coefficient, was significantly higher (by 40%) for a site without fungicide protection (Figure S2). The rate of nitrogen for the zero coefficient on the FP-0 site was 170.7 kg N ha−1 and for the FP-F reached 231.7 kg N ha−1. The coefficient value was negative for FP-0 at nitrogen rates exceeding 160 kg N ha−1 and for FP-F above 200 kg N ha−1.
The protein content of winter bread wheat grain varied significantly between the years and showed a significant interaction with the level of fungicide protection (Table 2). In the 2013/2014 season, a downward trend was observed for the site with fungicide protection. The trend was reversed for 2014/2015 (Figure A2). The effect of increasing nitrogen rates, averaged according to respective years and fungicide protection levels, on the protein content of grain was positive. The difference between the control site (NC) and the fertiliser combination with 240 kg N ha−1 was four percentage points. Despite the lack of significant interaction, it should be emphasised that for both vegetation seasons, the critical protein content of 12% was exceeded only for the fertiliser combination with 160 kg N ha−1. The gluten content of grain was highly variable between the years. The effect of nitrogen on the value of this feature, analogously to protein, was positive, but no interaction with other factors was identified. The difference between AC and the fertiliser combination with 240 kg N ha−1 was 10.2 percentage points. The critical gluten content of 26% in the 2013/2014 season was not achieved for fertiliser combinations with less than 240 kg N ha−1. In the 2014/2015 season, this percentage was achieved at 200 kg N ha−1.
Protein yield (PRY) was significantly determined by grain yield, showing a 90 percent correlation, as shown by the coefficient of determination (R2) for this feature (Table A1). Despite differences in the mean value of respective features, a significant determinant of protein yield was the interaction of Y × N (Table 2). This difference is derived from the difference in grain yield. The interaction of FP × N was significant for the analysis of fungicide protection efficiency, as corroborated by the grain yield. Figure 2 clearly shows that the difference in protein yield between FP-0 and FP-F, up to 160 kg N ha−1, was a trend ranging from −0.03 to −0.17 t ha−1. A significant difference between both sites was recorded for the combinations with the highest rates of nitrogen fertiliser. The trends of changes in PRY, such as the protein yield gap, can be described by simple regression models (see Figure S3 for details):
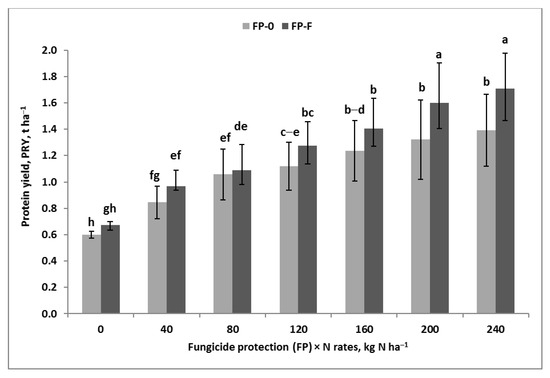
Figure 2.
Effect of winter wheat protection with fungicides and rates of fertiliser nitrogen on protein yield. Similar letters in the column means a lack of significant differences using Tukey’s test; the vertical bar in the column refers to the standard error of the mean.
- (1)
- FP-0:
PRY-FP-0 = 0.0031N + 0.706 for R2 = 0.94, n = 7, p ≤ 0.01
- (2)
- FP-F:
PRY-FP-F = 0.0042N + 0.744 for R2 = 0.99, n = 7, p ≤ 0.01
- (3)
- Differences in protein yield between the sites with full fungicide protection (FP-F) and those without fungicide protection (FP-0) are presented as protein yield gap (PRYgap):
PRYgap = −0.0000052N2 + 0.00021N − 0.081 for R2 = 0.87, n = 7, p ≤ 0.01
The first two equations clearly indicate that the protein yield increased linearly with an increasing rate of nitrogen. The difference between the two sites was generally due to the PRY growth rate in response to increasing nitrogen rates. The efficiency of Nf on the FP-F site, as indicated by the linear regression coefficient in Equation (5), was more than 1/3 (35.5%) higher than that recorded for the FP-0 site. In contrast, the PRY gap was in line with the quadratic function. The minimal difference between the two sites amounting to −0.078 t ha−1 was received for a Nf rate of 19.8 kg N ha−1.
Gluten yield (GLY), analogously to protein yield, was determined at 86% (R2) by grain yield (Table A1). Differences in GLY between the sites, to the benefit of FP-F, occurred throughout the range of the tested nitrogen rates (Figure A3). However, below 160 kg N ha−1, an increase in GLY was a positive trend only. The difference in GLY up to this level of Nf ranged from 0.05 to 0.34 t ha−1. Above this nitrogen rate, an increase in GLY for wheat with fungicide protection was way above 0.5 t ha−1. Analogously to protein, the general trend of GLY in response to increasing Nf rates is best described by the linear regression model (Figure S4).
3.2. Economic Ratios Related to Wheat Production in 2014 and 2015 According to Prices and Costs from 2015
All the analysed economic ratios related to the production of winter bread wheat showed a significant correlation with grain yield (Table A2). Ratios with the highest R2 value included total gross income (GI), net income (NI-0, NI-Sb) and marginal efficiency (ME). Variability in each of these four ratios accounts for at least 88% of grain yield variability. A close correlation between NI and the other two ratios (R2 > 0.92) should be highlighted here. Another ratio—that is, profitability (Prf)—showed a significant correlation with grain yield, but its R2 was low and amounted to 0.59 for Prf-0, and in the subsidised variant (Prf-Sb),it declined below 0.5 (0.48). This ratio showed a considerably higher correlation with NI (R2 = 0.81) and considerably lower marginal efficiency (ME). Lower R2 was noted down for the latter when subsidies were taken into account (0.66 and 0.55, respectively).
The basic ratio—that is, GI—showed a significant response to experimental factors and years, looking at the average values of other experimental factors (Table 3). Both these factors demonstrated a significant correlation over the years. The value of GI was significantly determined by the interaction of Y × N and FP × N, but N × FP did not vary between the years (Y). Analogously to grain yield, only the interaction of FP × N was discussed as significant for explaining the effect of both experimental factors on the economic result of wheat production. The value of GI increased at higher rates of Nf, but the growth model was different for both sites: (Figure S5 for details):

Table 3.
Economic indicators—results for 2014 and 2015 for prices and costs from 2015.
- (1)
- FP-0:
GI = −0.011N2 + 5.99N + 964.7 for n = 7, R2 = 0.96, p ≤ 0.01
- (2)
- FP-F:
GY = 4.71N + 1103.4 for n = 7, R2 = 0.9, p ≤ 0.01
The first equation implies that the maximum gross income of 1780.2 EUR ha−1 was achieved for the theoretical nitrogen rate of 265.1 kg N ha−1. This value indicates that, to the extent of the tested nitrogen rates, this correlation is described by the linear instead of quadratic regression model, as shown by the following model:
GY = 3.27N + 1055.5 for n = 7, R2 = 0.91, p ≤ 0.01
A comparison of both linear models shows that the GI growth dynamics aresignificantly higher on the site with protection than on that without protection. The value of the linear regression coefficient for FP-F was 44% higher than for FP-0. The scale of difference in the efficiency of fungicide protection of winter bread wheat, compared with an unprotected site, is illustrated by the ratio for AC and the fertiliser combination with 240 kg N ha−1; that is, 109 and 413 EUR ha−1, respectively. The relative increase in GI for the site with the highest nitrogen fertiliser rate was 23.4% (Figure 3).
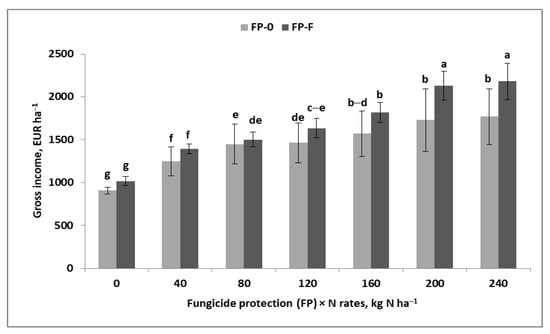
Figure 3.
Effect of winter wheat protection with fungicides and rates of fertiliser nitrogen on gross income. Similar letters in the column means a lack of significant differences using Tukey’s test; the vertical bar in the column refers to the standard error of the mean.
Net income (NI), as a primary indicator of production profitability, was significantly determined by the average values for respective years and nitrogen rates (Table 3). The value of this feature showed a correlation with the same group of interactions between factors and interactions between factors and years as found for GI. The value of NI increased at fixed amounts once subsidies were taken into account. However, this did not affect the significance of experimental factors. The interaction of FP × N significantly varied the amount of NI (without subsidies, NI-0). Nitrogen rates determined the value of NI-0 depending on the level of fungicide protection. For the combinations with Nf, up to 120 kg N ha−1, the NI was higher for the FP-0 site (Figure 4). It was a trend for most fertiliser combinations on that site, and a significantly higher value, amounting to 144 EUR ha−1, was noted down for the fertiliser combination with 80 kg N ha−1. With higher nitrogen rate combinations, higher NI was recorded for FP-F. The difference was the highest for the combination with 240 kg N ha−1 and amounted to 228 EUR ha−1, 24.3% more than for FP-0. The trends of changes in NI-0 in response to the tested nitrogen rates can be presented as regression models (see Figure S6 for details):
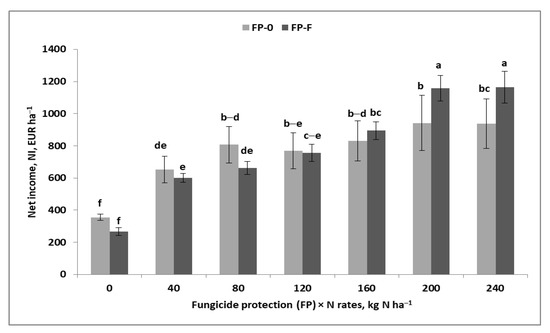
Figure 4.
Effect of winter wheat protection with fungicides and rates of fertiliser nitrogen on net income. Similar letters in the column means a lack of significant differences using Tukey’s test; the vertical bar in the column refers to the standard error of the mean.
- (1)
- FP-0:
NI-0 = −0.0114N2 + 4.83N + 413.4 for n = 7, R2 = 0.91 and p ≤ 0.01
- (2)
- FP-F:
NI-0 = 3.62N + 352.5 for n = 7, R2 = 0.91 and p ≤ 0.01
Equation (10) clearly implies that the maximum value of NI—that is, 925 EUR ha−1—was achieved for the nitrogen rate of 211.8 kg N ha−1. The net income for FP-F increased linearly as the nitrogen rate increased. However, Figure 4 shows that this feature stabilised at 240 kg N ha−1. The point of intersection of the two curves—that is, 143.4 N ha−1—informs us that above this point, higher NI was noted down for the FP-F site, while stagnation was recorded for FP-0.
Net profitability (Net Prf) of winter bread wheat production without subsidies (Prf-0) showed identical correlations with the experimental factors, as discussed earlier for GI-0 and NI-0 (Table 2). Analysis of Figure 5 leads to a clear conclusion that the fungicide protection level determined the effect of increasing nitrogen rates on wheat production profitability. As regards nitrogen rates from 0 to 160 kg N ha−1, the values of this ratio were significantly higher for FP-0. The maximal difference between the two sites (+25 percentage points) was recorded for the combination with 80 kg N ha−1. Combinations with the highest nitrogen fertiliser rates did not show any difference between the sites. It should be highlighted that differences in the value of the said ratio for the FP-0 site increased for nitrogen rates of up to 80 kg N ha−1 and then decreased progressively.
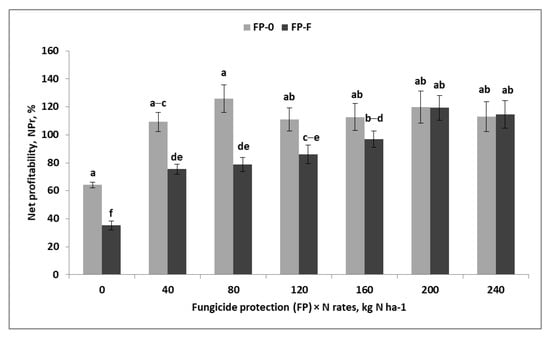
Figure 5.
Effect of winter wheat protection with fungicides and rates of fertiliser nitrogen on profitability of grain production. Similar letters in the column means a lack of significant differences using Tukey’s test; the vertical bar in the column refers to the standard error of the mean.
Profitability trends, analogously to the above-discussed economic ratios, can be presented as regression models in relation to nitrogen rates (Figure A4). The Pfr trend for FP-0 showed the best match with the 3° equation model. The maximal Pfr was 122.3% and was achieved for an Nf rate of 99.1 N ha−1. The linear model best illustrates the Pfr trend for the FP-F site. According to this model, Pfr increased linearly as the nitrogen fertiliser rate increased. In fact, as shown in Figure 5, this feature increased only for nitrogen rates below 200 kg N ha−1.
Subsidies increased the value of this ratio but did not change the trends for experimental factors (Table 3). The most characteristic effect of subsidies was an increase in the profitability of winter bread wheat production on the site without fungicide protection and for AC and fertiliser combinations with low nitrogen rates.
Marginal efficiency (ME) of expenditure on nitrogen fertilisation in winter bread wheat production increased irrespective of the level of fungicide protection, along with the increasing nitrogen rates (Figure 6). The growth trend for this ratio varied between the analysed sites (Figure S7):
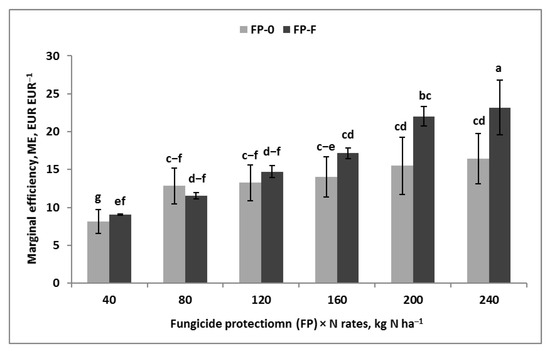
Figure 6.
Effect of winter wheat protection with fungicides and rates of fertiliser nitrogen on marginal efficiency of grain production. Similar letters in the column means a lack of significant differences using Tukey’s test; the vertical bar in the column refers to the standard error of the mean.
- (1)
- FP-0:
ME = −0.00016N2 + 0.082N + 5.89 for n = 7, R2 = 0.99 and p ≤ 0.01
- (2)
- FP-L:
ME = 0.75N + 5.83 for n = 7, R2 = 0.92 and p ≤ 0.01
On the site without fungicide protection, the maximum ME was 26.3 EUR per 1.0 EUR of nitrogen cost at 249.3 kg N ha−1. Despite the different trends, differences between sites increased at higher nitrogen rates and reached the highest value for the fertiliser combination with 240 kg N ha−1 (Figure 6). The value of ME was significantly correlated with grain yield (r = 0.97). Despite similar trends, this ratio showed a much smaller correlation with profitability (r = 0.74 and 0.68 for Pfr-0 and Pfr-Sb)) (Table A2).
The profitability of direct costs per unit (GI to DC ratio) showed a significant but varied efficiency of increasing nitrogen rates in relation to the level of fungicide protection (Figure A5). Trends for this ratio looked different for both sites (Figure S8 for details):
- (1)
- FP-0:
ME = −4 × 10⁻⁷N3 − 0.00016N2 + 0.018N + 3.02 for n = 7, R2 = 0.82 and p ≤ 0.01
- (2)
- FP-L:
ME = 0.003N + 2.38 for n = 7, R2 = 0.78 and p ≤ 0.01
The maximum return on capital invested directly in nitrogen fertiliser was EUR 3.68 and was achieved for the nitrogen rate of 77.3 kg N ha−1. The largest difference between the two sites occurred for the combination with 80 kg N ha−1. The differences were slightly smaller for the NC site and the fertiliser combination with 40 kg N ha−1. The rate of Nf increased above the critical value, causing a linear decrease in the productivity of the incurred direct costs. This ratio showed a low correlation with grain yield (r = 0.50) and with GI (r = 0.44) (Table A2). In contrast, the highest correlation was noted down for profitability (r = 0.93 and 0.97, respectively, for Prf-0 and Prf-Sb).
3.3. Simulation of Economic Ratios Related to Wheat Production in 2014 and 2015 Based on the Costs and Prices of Grain in 2022
The simulation of economic ratios from 2014 and 2015 based on grain prices and winter bread wheat production costs in 2022 revealed a significant correlation with grain yield (Table A3). Analogously to 2015, yield predictors with the highest R2 included GI, NI-0, NI-Sb and ME. Grain yield variability accounts for at least 83% of the variability in these four ratios. Besides yield, NI was significantly and strongly correlated with GI and Me (R2 > 0.83). Another ratio—profitability (Prf)—showed a significant, though moderate correlation with grain yield. This ratio showed a considerably higher correlation with NI (R2 = 0.77), particularly for Unit DC (0.92). The correlations, except Prf, were always lower in the subsidised variant.
The GI ratio showed a significant response to experimental factors and years in relation to average values of other experimental factors (Table 4, Figure 7). Both these factors were significantly correlated with years. The value of GI was significantly determined by the interaction of experimental factors with years, but—analogously to 2015—the interaction of both factors did not vary between the years (Y). The discussed interaction of FP × N is the key to explaining the effect of both factors on the economic result of wheat production. The value of GI increased at higher rates of Nf, but the growth model was different for both sites: (Figure S9 for details):

Table 4.
Economic indicators—simulation of 2014 and 2015 for costs from 2022.
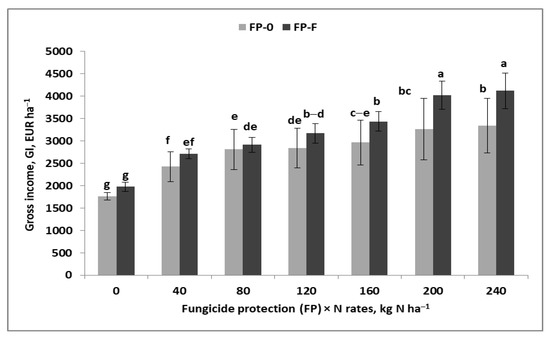
Figure 7.
Effect of winter wheat protection with fungicides and rates of fertiliser nitrogen on gross income. Similar letters in the column means a lack of significant differences using Tukey’s test; the vertical bar in the column refers to the standard error of the mean.
- (1)
- FP-0:
GI = −0.024N2 + 11.5N + 1876 for n = 7, R2 = 0.96, p ≤ 0.01
- (2)
- FP-F:
GY = 8.55N + 2161.8 for n = 7, R2 = 0.9, p ≤ 0.01
For FP-0, the maximum gross income of 1878.62 EUR ha−1 was achieved for the nitrogen rate of 239.6 kg N ha−1. In contrast, the site’s GI increased linearly at higher nitrogen rates. The significance of fungicide protection is illustrated by the difference between GI values for the NC site and the fertiliser combination with 240 kg N ha−1. In the first case, this difference amounted to 211 EUR ha−1 and reached 1091.8 EUR ha−1 for the maximal nitrogen rate, to the benefit of the site with fungicide protection.
Net income (NI), as a fundamental indicator of production profitability, was discussed for the interaction of FP × N (Table 4, Figure 8). The ratio constantly increased once subsidies were taken into account. However, this did not affect the significance of experimental factors. The interaction of FP × N significantly varied the amount of NI (without subsidies, NI-0). For the FP-0 site, nitrogen rates up to 120 kg N ha─1 determined the value of NI-0 (Figure 8). The trends of changes in NI-0 in response to nitrogen rates were compiled as regression models (see Figure S10 for details):
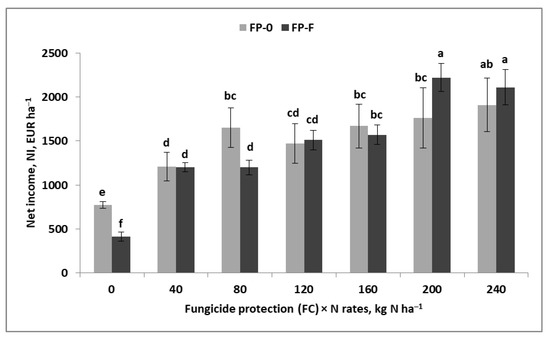
Figure 8.
Effect of winter wheat protection with fungicides and rates of fertiliser nitrogen on net income. Similar letters in the column means a lack of significant differences using Tukey’s test; the vertical bar in the column refers to the standard error of the mean.
- (1)
- FP-0:
NI-0 = −0.0182N2 + 8.41N + 861.5 for n = 7, R2 = 0.91 and p ≤ 0.01
- (2)
- FP-F:
NI-0 = 6.69N + 657.9 for n = 7, R2 = 0.91 and p ≤ 0.01
Equation (18) implies that the maximum NI value of 1833 EUR ha−1 corresponds to the nitrogen rate of 232.3 kg N ha−1. For the FP-F site, this value increased linearly at higher nitrogen rates. The point of intersection of the two curves—that is, 163.2 N ha−1—informs us that above this nitrogen rate, higher NI was noted down for the FP-F site, while stagnation was recorded for FP-0.
Profitability of winter bread wheat production (Prf) showed a response to experimental factors analogous to that observed for GI and NI (Table 4, Figure 9). Profitability trends, analogously to the above-discussed economic ratios, were compiled as regression models in relation to nitrogen rates (Figure S11). The Pfr trend for FP-0 showed the best match with the 3° equation model. The maximal Pfr was 138.2% and was achieved for an Nf rate of 119.9 N ha−1. The values for the FP-F site increased linearly as the nitrogen rates increased. In fact, as shown in Figure 9, this feature increased only for nitrogen rates below 200 kg N ha−1.
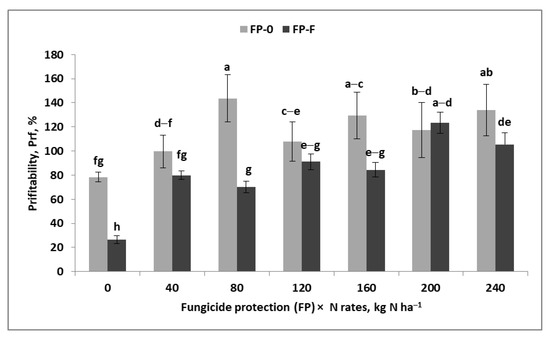
Figure 9.
Effect of winter wheat protection with fungicides and rates of fertiliser nitrogen on net profitability of wheat production. Similar letters in the column means a lack of significant differences using Tukey’s test; the vertical bar in the column refers to the standard error of the mean.
Figure 10 presents the marginal efficiency of expenditure on nitrogen fertiliser, including nitrogen rates. The growth trend for this ratio varied between the analysed sites (Figure S12):
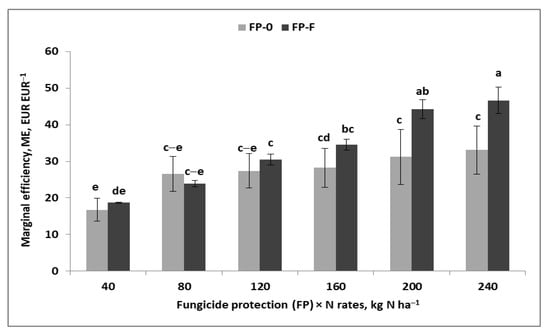
Figure 10.
Effect of winter wheat protection with fungicides and rates of fertiliser nitrogen on marginal efficiency of wheat production. Similar letters in the column means a lack of significant differences using Tukey’s test; the vertical bar in the column refers to the standard error of the mean.
- (1)
- FP-0:
ME = −0.00034N2 + 0.165N + 5.89 for n = 7, R2 = 0.99 and p ≤ 0.01
- (2)
- FP-F:
ME = 0.15N + 12.6 for n = 7, R2 = 0.92 and p ≤ 0.01
On the FP-0 site, the maximum ME was 25.9 EUR per 1.0 EUR of nitrogen cost at 242.6 kg N ha−1. Despite the different trends, differences between the sites increased at higher nitrogen rates and reached 14 EUR EUR−1 for the fertiliser combination with 240 kg N ha−1 (Figure 10). Marginal efficiency was significantly determined by yield (R2 = 0.94). This ratio showed the strongest correlation with NI (R2 = 92) and a considerably lower one with Prf (Table A3).
The profitability of direct costs per unit (Unit DC) showed a significant but varied effect of increasing nitrogen rates in relation to the level of fungicide protection (Figure 11). Trends for this ratio looked different for the sites with fungicide protection (see Figure S13 for details):
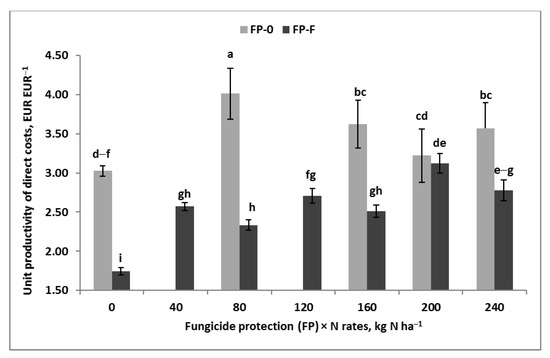
Figure 11.
Effect of winter wheat protection with fungicides and rates of fertiliser nitrogen on unit productivity of direct costs. Similar letters in the column means a lack of significant differences using Tukey’s test. The vertical bar in the column refers to the standard error of the mean—simulation 2022.
- (1)
- FP-0:
ME = −7 ×10⁻⁷N3 − 0.0003N2 + 0.03N + 3.02 for n = 5, R2 = 0.82 and p ≤ 0.05
- (2)
- FP-F:
ME = 0.004N + 2.07 for n = 7, R2 = 0.78 and p ≤ 0.01
The maximum return on capital invested directly in wheat production was 4.04 EUR EUR−1 and was achieved for the nitrogen rate of 79 kg N ha−1. The differences were slightly lower for the NC site. On the FP-0 site, the rate of Nf increased above the critical value, causing a linear decrease in the productivity of the incurred direct costs. This ratio showed a low correlation with grain yield (r = 0.44) and with gross income (r = 0.44) (Table A3). In contrast, the highest correlation was noted down for profitability (R2 = 0.92 and 0.96, respectively, for Prf-0 and Prf-Sb).
4. Discussion
The paper presents a productive performance, quality and economic assessment of winter bread wheat. The results of a field experiment with two fungicide protection systems (zero protection, full protection) and seven nitrogen rates (from 0 to 240 kg N ha−1) were used to measure grain yield and the protein and gluten content of grain. Direct, indirect and total costs of winter bread wheat production were calculated. This provided the basis for calculating the gross and net income and furthered the profitability and marginal costs of the used nitrogen. In addition, a simulation of the value of grain was carried out based on the relation between grain yield and protein content of the grain as a criterion of the selling price of fodder or consumer grain in 2015 and 2022; that is, before and during the energy crisis.
A review of literature and data from our own field experiment testify to the fact that high yield and quality of the product (wheat grain) are guaranteed by:
- -
- Growing site (richness of soil);
- -
- Forecrop (reducing the impact of diseases);
- -
- Adequately high nitrogen rate (ensuring the desired quantity and quality of protein);
- -
- Full fungicide protection of wheat crops [12,14,16,31,61,62].
4.1. Grain Quality
In our study, 170.7 kg N ha−1 was the nitrogen rate most efficient for wheat without fungicide protection, and in the fungicide protection variant, the most efficient nitrogen rate was 200 kg N ha−1.However, the yield significantly increased on the site without fungicide protection at nitrogen rates above 80 kg N ha−1. Thus, nitrogen fertiliser should be used as required by the agricultural crop and its cultivar, and agricultural treatments applied at relevant rates, proportions and dates [63,64,65,66].
The yield and technological quality of the wheat grain and, more specifically, protein content, are the determinants of the production value of this crop for the farm [61]. The yield levels of winter bread wheat grain in the test experiment were very high. The yield of 9.464 t ha−1 on the site without fungicide protection, at only 68.3 kg N ha−1, suggests that winter oilseed rape grown as a forecrop before winter bred wheat has a very high productive potential. On the site with fungicide protection, grain yield amounted to 12.28 t ha−1, so it was, on average, 2.816 t ha−1 higher, but it was achieved at an Nf rate of 231.2 kg N ha−1. This clearly points to a large disparity in the productivity of Nf amounting to 138.6 and 53.1 kg of grain kg−1 Nf (respectively) for the maximum yield on the sites without and with fungicide protection. On a global scale, this ratio, known as the Partial Factor Productivity of N fertiliser (PFP-Nf), ranges from 40 to 70 kg grain kg−1 Nf [67]. The site with fungicide protection fell within this standard range. The value of PFP-Nf for the site without fungicide protection was two times higher than the upper limit of the above-mentioned standard range. This is due to a low rate of Nf as well as the forecrop value. In this case, such a high yield was determined by the controlled pH reaction and richness of the soil in essential nutrients—that is, phosphorus and potassium—on the site prepared for winter oilseed rape. The response of wheat to these nutritional factors is fully compliant with the crop production management strategy known as Soil Fertility Clock [68].
The main determinant for a high grain yield and high protein content of grain is the intensive use of nitrogen fertiliser [14,61]. Higher nitrogen rates mainly increase yield, and more specifically, starch yield, which results in nitrogen dilution; that is, a decrease in grain protein content. Simultaneously, the unit value of grain declines. However, achieving high grain yield is not possible with high nitrogen rates alone. As discussed above, winter bread wheat grain yieldis genetically predisposed to accumulate protein stabilised at 68.3 kg N ha−1. However, the content and hence the yield of protein did not decrease. The latter increased linearly at higher nitrogen rates, irrespective of fungicide protection levels (Figure 2). It is important that protein yield is largely determined by grain yield and less by the protein content of grain [29]. This correlation was fully corroborated for the experimental site. Here, we should focus on the necessary nitrogen rate after the critical 12% protein content is exceeded [30]. On such a good site, this value was only exceeded for the fertiliser combination with 160 N ha−1. As a matter of fact, our results show that protein yield determines the winter bread wheat production value.
4.2. Economic and Comparative Analysis of Economic Ratios Related to Wheat Production in 2015 and 2022
The market value of wheat grain depends on several quality parameters [29,69,70], protein content being the main one on the local (Polish) and global markets [30,71,72].
The previous rules have been disrupted due to the war in Ukraine, which triggered a crisis inthe global markets. As reported in reference literature and shown by our own research, the energy crisis due to the pandemic of COVID and the conflict between Russia and Ukraine gave rise to an increase in the prices of the means of production (mainly nitrogen), affecting the profitability of production of agricultural crops, including wheat. However, our research shows that the profitability of winter bread wheat production was higher in 2022 than in 2015. A fundamental reason behind this process was the increase in grain prices on the global market. This phenomenon is corroborated in the paper written by [23,24]. Poland, next to Russia, the USA, Canada, France and Argentina, is an important exporter of wheat grain and other grains [25].
Using nitrogen fertilisers is the main factor stimulating and, simultaneously, limiting crop production. Not only does it affect and determine the efficiency of production, but it leaves an environmental footprint typical of an agricultural system depending on the fertiliser type, rate and application method [70]. According to Statistics Poland [19], the production and use of mineral nitrogen fertilisers in Poland remains at a constant level, with small seasonal variations. Statistics Poland [19] reports that, in 2015, the price of ammonium nitrate per 1 dt of wheat was 2.1%, and in 2021 this ratio declined to 1.7% per 1 dt of wheat.
Table A4 shows the dynamics of changes in economic ratios in 2022 compared with 2015 (2015 = 100). Our own calculations imply that the value of winter bread wheat grain sold in 2022 was, on average, 91.2% higher than in 2015. Simultaneously, the direct costs of production in 2022 were two times higher than in 2015, and they increased due to the costs of fungicide protection and the price of nitrogen fertilisers. On average, indirect costs in 2022 increased by 71.7% in relation to those in 2015, and their distribution was similar, depending on the level of the analysed factors. The total cost of grain production in 2022 was higher by 90.8% than in 2015 and increased due to the use offungicide protection and nitrogen fertiliser.
Net income without subsidies (NI-0) and with subsidies (NI-Sb) in 2022 was, on average higher, by 91.5% and 78.3%, respectively than NI in 2015. The profitability of production without direct payments in 2022, compared to 2015, was similar and was only 1.5% higher than in the reference year. At the same time, a 7.3% increase in production profitability was observed on sites without fungicide protection, and fungicide treatment decreased it by 4.3%. Grain production profitability was also observed to decline at the lowest nitrogen fertiliser rate; that is, 40 kg N ha−1. For other nitrogen rates in 2022, profitability improved from 0.7% to 5.2% compared to 2015. When subsidies are taken into account, the profitability ratio in 2022 decreased compared to 2015, meaning that subsidies in 2015 had a greater impact on the profitability ratio than in 2022. The unit productivity of direct costs (gross income (GI) to direct inputs (DC)) was identical for sites without fungicide protection, while after fungicide treatment, it decreased by 10.7% in 2022 compared to 2015. At different nitrogen rates, it was found that the application of the control rate—0 N, 40 N and 120 kg N ha−1—in 2022 decreased the unit productivity of direct costs compared to 2015, and only the rate of 240 kg N ha−1 increased the productivity per DC unit by 3.2% compared to 2015. On average, marginal efficiency in 2022 was two times higher than in 2015. For both fungicide protection and any nitrogen fertiliser rate, the maximum return on capital invested directly in wheat production in 2022 was more than two times higher than in 2015. This means that the wheat production technology used was two times more efficient in economic terms than in 2015. Although the direct costs of production doubled in 2022, and the indirect and total costs increased significantly, income from grain sales was, on average, 91.1% higher than in 2015. This improved some economic ratios (profitability of production without subsidies and marginal efficiency) in 2022 compared with 2015.
In summation, the increase in the cost of fertilisers, crop protection products, fuel and other cost components can increase production profitability if grain selling prices are sufficiently high. Schnitkey et al. [23] described the phenomenon of increasing grain prices when the costs of fertiliser are high on the global market in 2022. From the point of view of nitrogen fertiliser efficiency, integrated technologies were more efficient, and in the economic assessment, the advantage of a particular technology depends on how effectively plant vegetation conditions can be predicted [48]. Full fungicide protection should only be considered if the grain is sold to consumers, as it generates very high costs and is not necessary for fodder grain. Similar observations are often described in the reference literature [36,37,41]. Each nitrogen rate was economically justified, and 120 kg N ha−1 was found to be the economically optimal rate. Other researchers [73] reported similar findings. As illustrated by Table A5, based on the quadratic equation, the production profitability ratio was 122.3% in 2015 after the application of nitrogen fertiliser at 99.1 kg N ha−1 without fungicide protection. Incontrast, in 2022, production profitability reached 138.2% at 119.9 kg N ha−1 with fungicide protection. This means that, given the high cost of nitrogen fertilisers and fungicide protection coupled with a good grain selling price, growing wheat that satisfies the quality requirements is profitable.
5. Conclusions
In conclusion to our research, consumer wheat growing is profitable but requires high inputs, including a sufficiently high rate of nitrogen fertiliser (above 120 kg N ha−1) and full fungicide protection of the crops (three treatments). On a good site and with good forecrops (winter oilseed rape in the presented study), full crop protection is not worth using, as it is economically unjustified. We demonstrated that high income is possible with low inputs; that is, at low nitrogen rates (40–80 kg N ha−1) and with zero fungicide protection. Payments from the EU on products and areas (SAPS—single area payment scheme; CAPS—complimentary area payment scheme; and green direct payment scheme) are also significant to income.
The grain selling price guarantees production profitability, which translates into operating income and the production profitability ratio. However, without nitrogen fertiliser and wheat crop protection, it is impossible to produce grain that can be used for bread flour. Therefore, a question arises whether, in the face of the energy crisis and market turmoil, the world should switch to low-protein flour for breadmaking. Such flour can be obtained without high expenditure on nitrogen fertilisers and full fungicide protection.
Supplementary Materials
The following supporting information can be downloaded at: https://www.mdpi.com/article/10.3390/agronomy13030861/s1, Figure S1: Regression models of grain yield response to increasing rates of fertilizer nitrogen on the backgroung of winter wheat protection with fungicides; Figure S2: Regression models of marginal efficiency increasing rates of fertilizer nitrogen on the backgroung of winter wheat protection with fungicides; Figure S3: Regression models of protein yield response to increasing rates of fertilizer nitrogen on the backgroung of winter wheat protection with fungicides; Figure S4: Regression models of gluten yield response to increasing rates of fertilizer nitrogen on the backgroung of winter wheat protection with fungicides; Figure S5: Regression models of gross income response to increasing rates of fertilizer nitrogen on the backgroung of winter wheat protection with fungicides; Figure S6: Regression models of net income response to increasing rates of fertilizer nitrogen on the backgroung of winter wheat protection with fungicides; Figure S7: Regression models of marginal efficiency response to increasing rates of fertilizer nitrogen on the backgroung of winter wheat protection with fungicides; Figure S8: Regression models of unit productivity of direct costs response to increasing rates of fertilizer nitrogen on the backgroung of winter wheat protection with fungicides; Figure S9: Regression models of gross income response to increasing rates of fertilizer nitrogen on the backgroung of winter wheat protection with fungicides.—simulation 2022; Figure S10: Regression models of net income response to increasing rates of fertilizer nitrogen on the backgroung of winter wheat protection with fungicides.—simulation 2022; Figure S11: Regression models of net profitability response to increasing rates of fertilizer nitrogen on the backgroung of winter wheat protection with fungicides.—simulation 2022; Figure S12: Regression models of marginal efficiency response to increasing rates of fertilizer nitrogen on the backgroung of winter wheat protection with fungicides;—simulation 2022; Figure S13: Effect of winter wheat protection with fungicides and rates of fertilizer nitrogen on unit productivity of direct costs. Similar letters in the column means a lack of significant differences using Tukeys’ test; The vertical bar in the column refers to the standard error of the mean;—simulation 2022.
Author Contributions
Conceptualization, H.K. and W.S.; methodology, H.K.; software, H.K.; validation, H.K. and W.S.; formal analysis, H.K.; investigation, H.K.; resources, H.K.; data curation, H.K.; writing—original draft preparation, H.K.; writing—review and editing, H.K.; visualization, H.K.; supervision, W.S.; project administration, H.K.; funding acquisition, W.S. All authors have read and agreed to the published version of the manuscript.
Funding
This research received no external funding.
Data Availability Statement
Not applicable.
Conflicts of Interest
The authors declare no conflict of interest.
Appendix A

Table A1.
Correlation matrix of basic properties of winter wheat and grain yield (n = 28).
Table A1.
Correlation matrix of basic properties of winter wheat and grain yield (n = 28).
| Traits | PR | GL | PRY | GLY |
|---|---|---|---|---|
| YG | 0.74 ** | 0.73 ** | 0.95 *** | 0.93 *** |
| PR | 1.00 | 0.99 ** | 0.91 *** | 0.93 *** |
| GL | 1.00 | 0.91 *** | 0.93 *** | |
| PRY | 1.00 | 1.00 *** |
***, ** indicate significant differences at p < 0.001, and p < 0.01, respectively; ns—non significant. Legend: GY—grain yield; PR—protein content; GL—gluten content; PRY—protein yield; GLY—gluten yield.

Table A2.
Correlation matrix of basic economic indices of winter wheat and grain yield, 2015 costs, n = 28.
Table A2.
Correlation matrix of basic economic indices of winter wheat and grain yield, 2015 costs, n = 28.
| Indicators | GI | DC | IC | TC | NI-0 | NI-Sb | Prf-0 | Prf-Sb | GI/1euroDC | ME |
|---|---|---|---|---|---|---|---|---|---|---|
| GY | 0.96 *** | 0.69 *** | 0.52 ** | 0.67 *** | 0.94 *** | 0.94 *** | 0.77 *** | 0.69 *** | 0.50 ** | 0.96 *** |
| GI | 1.00 | 0.75 *** | 0.57 ** | 0.74 *** | 0.96 *** | 0.96 *** | 0.75 *** | 0.66 *** | 0.45 * | 0.98 *** |
| DC | 1.00 | 0.93 *** | 0.99 *** | 0.54 ** | 0.54 ** | 0.14 | 0.02 | −0.23 | 0.67 *** | |
| IC | 1.00 | 0.94 *** | 0.32 | 0.32 | −0.08 | −0.20 | −0.42 * | 0.46 * | ||
| TC | 1.00 | 0.52 ** | 0.52 ** | 0.12 | −0.01 | −0.25 | 0.65 *** | |||
| NI-0 | 1.00 | 1.00 | 0.90 *** | 0.84 *** | 0.68 *** | 0.97 *** | ||||
| NI-Sb | 1.00 | 0.90 *** | 0.84 *** | 0.68 *** | 0.97 *** | |||||
| Prf-0 | 1.00 | 0.99 *** | 0.93 *** | 0.81 *** | ||||||
| Prf-sb | 1.00 | 0.97 *** | 0.74 *** | |||||||
| GI/1euroDC | 1.00 | 0.55 ** |
***, **, * indicate significant differences at p < 0.001, p < 0.01, and p < 0.05, respectively; Legend: GI—gross income; DC—direct costs; IC—indirect costs;. TC—Total costs; NI—net income; Prf—profitability; 0, Sb—without and with included subsidies; ME—marginal efficiency.

Table A3.
Correlation matrix of basic economic indices of winter wheat and grain yield, simulation for 2022, n = 28.
Table A3.
Correlation matrix of basic economic indices of winter wheat and grain yield, simulation for 2022, n = 28.
| Indicators | GI | DC | IC | TC | NI-0 | NI-Sb | Prf-0 | Prf-Sb | GI/1euroDC | ME |
|---|---|---|---|---|---|---|---|---|---|---|
| GY | 0.97 *** | 0.56 ** | 0.77 *** | 0.61 ** | 0.91 *** | 0.91 *** | 0.67 *** | 0.61 *** | 0.44 * | 0.97 *** |
| GI | 1.00 | 0.59 ** | 0.84 *** | 0.64 *** | 0.94 *** | 0.94 *** | 0.67*** | 0.60 ** | 0.43 * | 0.98 *** |
| DC | 1.00 | 0.70 *** | 0.99 *** | 0.27 | 0.27 | −0.20 | −0.28 | −0.46 * | 0.49 * | |
| IC | 1.00 | 0.75 *** | 0.69 *** | 0.69 *** | 0.35 | 0.28 | 0.12 | 0.83 *** | ||
| TC | 1.00 | 0.32 | 0.32 | −0.14 | −0.22 | −0.41 * | 0.54 ** | |||
| NI-0 | 1.00 | 1.00 | 0.88 *** | 0.84 *** | 0.72 *** | 0.96 *** | ||||
| NI-Sb | 1.00 | 0.88 *** | 0.84 *** | 0.72 *** | 0.96 *** | |||||
| Prf-0 | 1.00 | 0.99 *** | 0.96 *** | 0.74 *** | ||||||
| Prf-sb | 1.00 | 0.98 *** | 0.68 *** | |||||||
| GI/1euroDC | 1.00 | 0.53 ** |
***, **, * indicate significant differences at p < 0.001, p < 0.01, and p < 0.05, respectively; Legend: GI—gross income; DC—direct costs; IC—indirect costs; TC—total costs; NI—net income; Prf—profitability; 0, Sb—without and with included subsidies; ME—marginal efficiency.

Table A4.
Dynamics of economic indicators—for costs 2015 and 2022, where 2015 = 100.
Table A4.
Dynamics of economic indicators—for costs 2015 and 2022, where 2015 = 100.
| Factor | Factor | GI | DC | IC | TC | NI-0 | NI-Sb | Prf-0 | Prf-Sb | UNIT DC | ME |
|---|---|---|---|---|---|---|---|---|---|---|---|
| Level | EUR ha−1 | % | EUR EUR−1 | EUR EUR−1 | |||||||
| Year (Y) | 2014 | 191.1 | 200.9 | 171.7 | 190.8 | 191.7 | 175.6 | 102.1 | 93.2 | 96.3 | 204.1 |
| 2015 | 191.1 | 200.9 | 171.7 | 190.8 | 191.3 | 180.2 | 102.7 | 95.9 | 97.1 | 202.5 | |
| Fungicide | FP-0 | 191.2 | 189.7 | 175.8 | 184.5 | 197.3 | 182.7 | 107.3 | 99.1 | 100.0 | 202.6 |
| Protection (FP) | FP-F | 191.0 | 209.0 | 168.0 | 195.7 | 185.8 | 174.0 | 95.7 | 89.3 | 89.3 | 202.1 |
| Nitrogen | 0 | 193.7 | 221.1 | 157.2 | 194.9 | 191.2 | 166.3 | 105.4 | 90.7 | 92.3 | 0.0 |
| Rates kg N ha−1 | 40 | 193.7 | 212.8 | 166.3 | 194.9 | 192.4 | 176.7 | 97.3 | 89.5 | 87.5 | 205.8 |
| (N) | 80 | 193.7 | 206.3 | 170.1 | 193.2 | 194.3 | 180.0 | 104.5 | 96.6 | 100.0 | 206.6 |
| 120 | 193.7 | 200.8 | 175.5 | 192.0 | 195.5 | 181.4 | 101.1 | 93.8 | 93.5 | 206.4 | |
| 160 | 188.6 | 196.3 | 176.0 | 189.6 | 187.7 | 176.4 | 102.0 | 95.7 | 100.0 | 201.3 | |
| 200 | 188.6 | 192.4 | 177.6 | 187.6 | 189.5 | 179.6 | 100.7 | 95.4 | 100.0 | 201.6 | |
| 240 | 188.6 | 188.9 | 178.4 | 185.7 | 191.2 | 181.0 | 105.2 | 99.5 | 103.2 | 201.5 | |
Legend: GI—gross income; DC—direct costs; IC—indirect costs; TC—total costs; NI—net incom; Prf—profitability; 0, Sb—without and with included subsidies; ME—marginal efficiency.

Table A5.
Comparative analysis of selected economic indicators of winter wheat production in 2015 and 2022.
Table A5.
Comparative analysis of selected economic indicators of winter wheat production in 2015 and 2022.
| Indicator | Regression Model | Year | Fungicide Protection | Indicator Value, EUR ha−1, % | N Optimum kg N ha−1 |
|---|---|---|---|---|---|
| Gross Income | Linear | 2015 | FP-0 | 1707.4 | 240 |
| Linear | FP-F | 3335.1 | 240 | ||
| Quadratic | 2022 | FP-0 | 3253.6 | 239.5 | |
| Linear | FP-F | 4113.3 | 240 | ||
| Net Income | Quadratic | 2015 | FP-0 | 925.0 | 211 |
| Linear | FP-F | 1318.4 | 240 | ||
| Quadratic | 2022 | FP-0 | 1833 | 231 | |
| Linear | FP-F | 2210.8 | 240 | ||
| Net profitability | Cubic | 2015 | FP-0 | 122.3% | 99.1 |
| Linear | FP-F | 140% | 200 | ||
| Cubic | 2022 | FP-0 | 138.2% | 119.9 | |
| Linear | FP-F | 123% | 200 | ||
| Unit DCproductivity | Cubic | 2015 | FP-0 | 3.68 | 77.3 |
| Linear | FP-F | 3.10 | 200 | ||
| Cubic | 2022 | FP-0 | 4.04 | 79 | |
| Linear | FP-F | 3.12 | 200 |
Appendix B
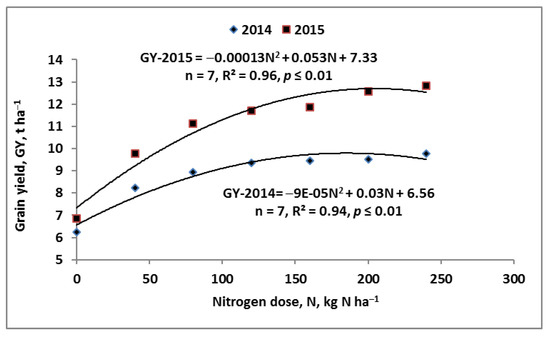
Figure A1.
Response of winter wheat grain yield to the increasing rates of nitrogen fertiliser (consecutive).
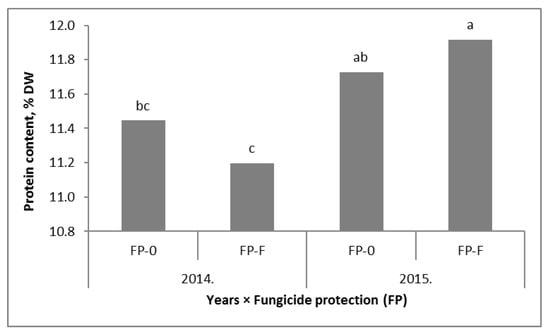
Figure A2.
The content of protein in winter wheat grain in consecutive years of study on the background of plant protection. Similar letters in the column means a lack of significant differences using Tukey’s’ test. The vertical bar in the column refers to the standard error of the mean.
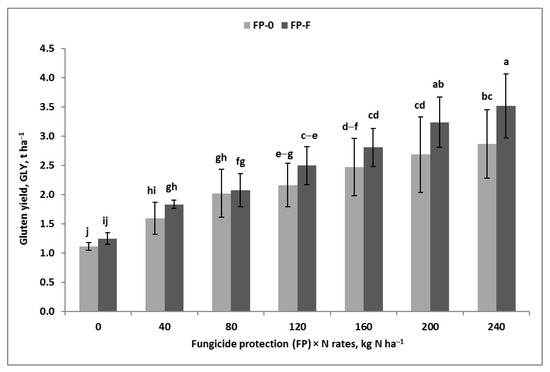
Figure A3.
Effect of winter wheat protection with fungicides and rates of fertiliser nitrogen on gluten yield. Similar letters in the column means a lack of significant differences using Tukey’s’ test. The vertical bar in the column refers to the standard error of the mean.
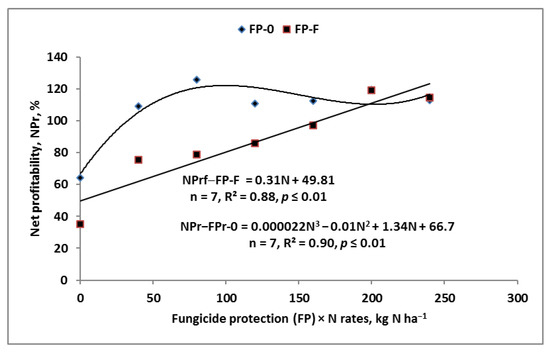
Figure A4.
Regression models of net profitability response to increasing rates of fertiliser nitrogen on the background of winter wheat protection with fungicides.
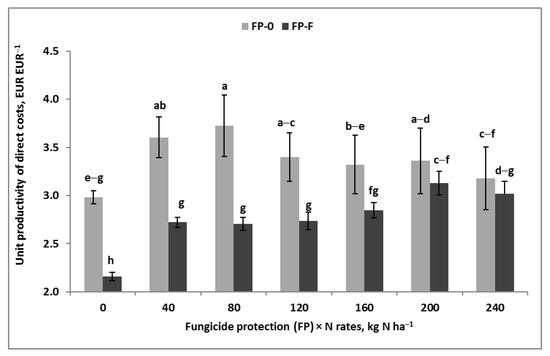
Figure A5.
Effect of winter wheat protection with fungicides and rates of fertiliser nitrogen on unit productivity of direct costs. Similar letters in the column means a lack of significant differences using Tukey’s’ test. The vertical bar in the column refers to the standard error of the mean.
References
- Hunter, M.C.; Smith, R.G.; Schipanski, M.E.; Atwood, L.W.; Mortensen, D.A. Agriculture in 2050: Recalibrating targets for sustainable intensification. BioScience 2017, 67, 386–391. [Google Scholar] [CrossRef]
- Le Mouël, C.; Forslund, A. How can we feed the world in 2050? A review of the responses from global scenario studies. Eur. Rev. Agric. Econ. 2017, 44, 541–591. [Google Scholar] [CrossRef]
- Röös, E.; Bajželj, B.; Smith, P.; Patel, M.; Little, D.; Garnett, T. Greedy or needy? Land use and climate impacts of food in 2050 under different livestock futures. Glob. Environ. Chang. 2017, 47, 1–12. [Google Scholar] [CrossRef]
- Klikocka, H.; Cybulska, M. Sulphur and Nitrogen Fertilization of Spring Wheat. Mineral Fertilization of Spring Wheat. Sarrbrucken, LAP Lambert Academic Publishing: Saarbrűcken, Germany, 2014; p. 122. ISBN 978-3-659-61515-3. [Google Scholar]
- Klikocka, H.; Marks, M. Sulphur and nitrogen fertilization as a potential means of agronomic biofortyfication to improve the content and uptake of microelements in spring wheat grain DM. J. Chem. 2018, 18, 1–12. [Google Scholar] [CrossRef]
- Klikocka, H.; Marks, M.; Barczak, B.; Szostak, B.; Podleśna, A.; Podleśny, J. Response of spring wheat to NPK and S fertilization. The content and uptake of macronutrients and the value of ionic ratios. Open Chem. 2018, 16, 1059–1065. [Google Scholar] [CrossRef]
- Klikocka, H.; Podleśna, A.; Podleśny, J.; Narolski, B.; Haneklaus, S.; Bloem, E.; Schnug, E. Improvement of the Content and Uptake of Micronutrients in Spring Rye Grain DM Through Nitrogen and Sulfur Supplementation. Agronomy 2020, 10, 35. [Google Scholar] [CrossRef]
- Poutanewn, K.S.; Karlund, A.O.; Gomez-Gallego, C.; Johansson, D.P.; Scheers, N.M.; Marklinder, I.M.; Eriksen, A.K.; Silventoinen, P.C.; Nordlund, E.; Sozer, N.; et al. Grains—A major source of sustainable protein for health. Nutr. Rev. 2022, 80, 1648–1663. [Google Scholar] [CrossRef]
- Ray, D.K.; Mueller, N.D.; West, P.C.; Foley, J.A. Yield trends are insufficient to double global crop production by 2050. PLoS ONE 2013, 8, e66428. [Google Scholar] [CrossRef]
- Smith, P.; Gregory, P.J.; van Vuuren, D.; Obersteiner, M.; Havlík, P.; Rounsevell, M.; Woods, J.; Stehfest, E.; Bellarby, J. Competition for land. Phil. Trans. R. Soc. B 2010, 365, 2941–2957. [Google Scholar] [CrossRef]
- Taiz, L. Agriculture, plant physiology, and human population growth: Past, present, and future. Theor. Exp. Plant Physiol. 2013, 25, 167–181. [Google Scholar] [CrossRef]
- Grzebisz, W.; Łukowiak, R. Nitrogen gap amelioration is a core for sustainable intensification of agriculture—A concept. Agronomy 2021, 11, 419. [Google Scholar] [CrossRef]
- Grzebisz, W.; Łukowiak, R.; Kotnis, K. Evaluation of nitrogen fertilization systems based on the in-season variability of the nitrogenous growth factors and soil fertility factors—A case of winter oil seed rape (Brassica napus L.). Agronomy 2020, 10, 1701. [Google Scholar] [CrossRef]
- Szczepaniak, W.; Grzebisz, W.; Potarzycki, J. Yield Predictive Worth of Pre-Flowering and Post-Flowering Indicators of Nitrogen Economy in High Yielding Winter Wheat. Agronomy 2023, 13, 122. [Google Scholar] [CrossRef]
- Grafton, R.Q.; Williams, J.; Jiang, Q. Food and water gaps to 2050: Preliminary results from the global food and water systems (GFWS) platform. Food Sec. 2015, 7, 209–220. [Google Scholar] [CrossRef]
- Rockström, J.; Williams, J.; Daily, G.; Noble, A.; Matthews, N.; Gordon, L.; Wetterstrand, H.; DeClerck, F.; Shah, M.; Steduto, P.; et al. Sustainable intensification of agriculture for human prosperity and global sustainability. Ambio 2017, 46, 4–17. [Google Scholar] [CrossRef]
- Smith, P. Delivering food security without increasing pressure on land. Global Food Sec. 2013, 2, 18–23. [Google Scholar] [CrossRef]
- Spiertz, J.H.J. Nitrogen, sustainable agriculture and food security. A review. Agron. Sustain. Dev. 2010, 30, 43–55. [Google Scholar] [CrossRef]
- GUS. Rocznik Statystyczny Rzeczypospolitej Polskiej. Dział XVI. Rolnictwo—Statistical Yearbook of the Republic of Poland. Section XVI. Agriculture. Available online: http://www.stat.gov.pl (accessed on 15 January 2023).
- Nucia, A. Białka gluteninowe—Charakterystyka i ich wpływ na właściwości reologiczne pszenicy. Agron. Sci. 2018, 73, 5–16. [Google Scholar] [CrossRef]
- Rachoń, L.; Krochmal-Marczak, B.; Cebulak, T. Przydatność ziarna jarej pszenicy zwyczajnej, twardej i orkiszowej do produkcji pieczywa w zależności od intensywności technologii produkcji. Agron. Sci. 2020, 75, 25–36. [Google Scholar] [CrossRef]
- Bielski, S.; Budzyński, W.; Dubis, B.; Głąb, L.; Michalski, T.; Sowiński, J.; Szempliński, W. Rośliny Zbożowe. Cz. IV; Uprawa Roślin, T., II, Red Kotecki, A., Eds.; Wyd. UP: Wrocław, Poland, 2020; pp. 15–108. [Google Scholar]
- Schnitkey, G.; Paulson, N.; Zulauf, C.; Swansin, K.; Colussi, J.; Baltz, J. Nitrogen fertilizer prices and supply in light of the Ukraine-Russia conflict. Farmdocdaily 2022, 12, 45. [Google Scholar]
- Aday, S.; Aday, M.S. Impact of COVID-19 on the food supply chain. Food Qual. Saf. 2020, 4, 167–180. [Google Scholar] [CrossRef]
- Bentley, A.R.; Donovan, J.; Sonder, K.; Baudron, F.; Lewis, J.M.; Voss, R.; Rutsaert, O.; Poole, N.; Kamoun, S.; Saunders, D.G.O.; et al. Near-to long-term measures to stabilize global wheat supplies and food security. Nat. Food 2022, 3, 483–486. Available online: https://www.nature.com/natfood (accessed on 15 January 2023).
- UNCTAD. The Impact on Trade and Development of the War in Ukraine. UNCTAD Rapid Assesment. 16 March 2022. Available online: https://unctad.org/system/files/official-document/osginf2022d1_en.pdf (accessed on 15 January 2023).
- Behnassi, M.; El Haiba, M. Implications of the Russia–Ukraine war for global food security. Nat. Hum. Behav. 2022, 6, 754–755. [Google Scholar] [CrossRef]
- Dmowski, Z.; Dzieżyc, H.; Nowak, L. Ocena wpływu wybranych parametrów opadu i gleby na plonowanie pszenicy jarej w rejonie południowo-zachodnim Polski. Acta Agroph. 2008, 11, 613–622. [Google Scholar]
- Klikocka, H.; Cybulska, M.; Nowak, A. Efficiency of fertilization and utilization of nitrogen and sulphur by the spring wheat. Pol. J. Environ. Stud. 2017, 26, 2029–2036. [Google Scholar] [CrossRef]
- Available online: http://www.bioagrochem.pl/parametry-skupowe-zboz-konsumpcyjnych.html (accessed on 15 January 2023).
- Iwańska, M.; Paderwski, J.; Stępień, M.; Rodrigues, P.C. Adaptation of winter wheat cultivars to different environments: A case study in Poland. Agronomy 2020, 10, 632. [Google Scholar] [CrossRef]
- Ellmann, T. Wpływ poziomu ochrony roślin, nawożenia azotem i terminu zbioru na plonowanie pszenicy ozimej. Fragm. Agron. 2011, 28, 15–25. [Google Scholar]
- Sułek, A.; Podolska, G.; Leszczyńska, D.; Noworolnik, K. Reakcja zbóż na nawożenie azotem. Stud. I Rap. IUNG-PIB 2007, 9, 29–36. [Google Scholar]
- Podolska, G.; Sułek, A. Wpływ intensywności uprawy na plon i cechy struktury plonu odmian pszenicy ozimej. Pol. J. Agron. 2012, 11, 41–46. [Google Scholar]
- Cacak-Pietrzak, G.; Sułek, A. Wpływ poziomu nawożenia azotem na plonowanie i jakość technologiczną ziarna pszenicy jarej. Biul. IHAR 2007, 245, 47–55. [Google Scholar]
- Huber, D.M.; Haneklaus, S. Managing nutrition to control plant disease. LanbauforschungVölkenrode 2007, 4, 313–322. [Google Scholar]
- Piekarczyk, M.; Lemańczyk, G. Wpływ nawożenia azotem na zdrowotność wybranych odmian pszenicy ozimej uprawianych na glebie lekkiej. Prog. Plant Prot./PostępyW Ochr. Roślin 2013, 53, 494–497. [Google Scholar]
- Jaczewska-Kalicka, A. Grzyby patogeniczne dominujące w uprawie pszenicy ozimej w latach 1999–2001. Acta Agrobot. 2002, 55, 89–96. [Google Scholar] [CrossRef]
- MacDonald, A.J.; Gutterdge, R.J. Effectsoftake-all (Gaeumannonycesgraminis var. tritici) on crop N uptake and residual mineral N in soil at harvest of winter wheat. Plant Soil 2012, 350, 253–260. [Google Scholar] [CrossRef]
- Figueoroa, M.; Hammond-Kosack, K.E.; Solomon, P.S. A review of wheat diseaes—A field perspective. Mol. Plant Pathol. 2018, 19, 1523–1536. [Google Scholar] [CrossRef]
- Kulig, B.; Kania, S.; Szafrański, W.; Zając, T. Reakcja wybranych odmian pszenicy ozimej na intensywność uprawy. Biul. IHAR. 2001, 218/219, 117–126. [Google Scholar]
- Nowak, W.; Sowiński, J.; Pietr, S.; Kita, W. Wpływ sposobów ochrony pszenicy ozimej na jakość ziarna konsumpcyjnego. Pam. Puł. 2005, 139, 117–127. [Google Scholar]
- Zaima, O.A.; Derhachov, O.L. Yield and quality of soft winter wheat grain under different types of crops treating with fungicides. Plant Var. Stud. Prot. 2019, 15, 135–142. [Google Scholar]
- Borecki, Z.; Schollenberger, M. Polskie nazwy chorób roślin uprawnych. Pol. Tow. Fito. Wyd. 2 Uzup. 2017, 160, 96–100. [Google Scholar]
- Brachaczek, A.; Kaczmarek, J.; Niemann, J.; Jędryczka, M. Wpływ stosowania fungicydów w fazie T1 (BBCH 30–32) na zdrowotność i plonowanie pszenicy ozimej. Prog. Plant Prot./PostępyW Ochr. Roślin 2015, 55, 49–57. [Google Scholar]
- Kaniuczak, Z.; Noworól, M. Skuteczność oraz wskaźniki ekonomiczne chemicznego zwalczania szkodników i chorób w pszenicy ozimej na Podkarpaciu. Prog. Plant Prot./PostępyW Ochr. Roślin 2012, 52, 211–217. [Google Scholar]
- Nowak, A.; Haliniarz, M.; Kwiatkowski, C. Aspekty ekonomiczne wybranych technologii produkcji pszenicy jarej. Rocz. Nauk. SERiA 2013, 6, 200–205. [Google Scholar]
- Grabiński, J. Efekty produkcyjne i ekonomiczne intensywnej i integrowanej technologii produkcji pszenicy ozimej i jęczmienia jarego. Rocz. Nauk. SERiA 2015, 7, 94–99. [Google Scholar]
- Harasim, A. Wybrane elementy technologii produkcji roślinnej. In Kształtowanie Środowiska Rolniczego Polski Oraz Zrównoważony Rozwój Produkcji Rolniczej; Program wieloletni 2005–2010; Studia I Raporty IUNG PIB: Puławy, Poland, 2007; Volume 7. [Google Scholar]
- Harasim, A. Rachunek Ekonomiczny W Gospodarstwie Rolniczym; IUNG-PIB: Puławy, Poland, 2012; 30p. [Google Scholar]
- Harasim, E. Studia Nad Plonowaniem Jakością Ziarna i Opłacalnością Produkcji Ozimej Formy Pszenicy Zwyczajnej i Twardej; Wyd. IUNG-PIB: Puławy, Poland, 2018; 134p. [Google Scholar]
- Syp, A. Ocena efektywności ekonomicznej i środowiskowej uprawy pszenicy ozimej. Rocz. Nauk. SERiA 2015, 7, 314–318. [Google Scholar]
- PN-EN ISO 20483:2014-02; Cereal Grains and Pulses—Determination of Nitrogen Content and Conversion to Crude Protein—Kjeldah Method. Polski Komitet Normalizacyjny: Warsaw, Poland, 2015; 24p.
- Skarżyńska, A.; Ziętek, I. Standardowa nadwyżka bezpośrednia “2002” i zasady klasyfikacji gospodarstw rolnych według UE. ZagadnieniaEkon. Rolnej 2006, 1, 49. [Google Scholar]
- FADN. An A to Z of Methodology; Office for Official Publications of the European Communities: Luxemburg, 1989.
- Kamionka, J. Wpływ techniki na efektywność pogłównego nawożenia zbóż. Rozprawahabilitacyjna 19. InżynieriaRol 2005, 9, 43–57. [Google Scholar]
- Muzalewski, A. Koszty Eksploatacji Maszyn. IBMER: Warszawa, Poland, 2009. [Google Scholar]
- Chotkowski, J. Kalkulacje kosztów produkcji ziemniaków skrobiowych. Red. J. Chotkowski. WieśJutraWarszawa 2002, 47–53. [Google Scholar]
- Available online: https://www.topagrar.pl/notowania/zboza (accessed on 15 January 2023).
- Skarżyńska, A. Zagadnienia Metodyczne Rachunku Kosztów Ekonomicznych na Przykładzie Działalności Produkcji Roślinnej. IERGiŻ. 2010, p. 18. Available online: https//biobliotekanauki.pl/articles/879313.pdf (accessed on 15 January 2023).
- Klikocka, H.; Cybulska, M.; Barczak, B.; Narolski, B.; Szostak, B.; Kobiałka, A.; Nowak, A.; Wójcik, E. The effect of sulphur and nitrogen on grain yield and technological quality of spring wheat. Plant Soil Environ. 2016, 62, 230–236. [Google Scholar] [CrossRef]
- Oleksy, A.; Szmigiel, A.; Kołodziejczyk, M. Wpływ intensywności uprawy na zawartość i plon białka odmian pszenicy ozimej. Acta Sci. Pol. Agric. 2008, 7, 47–56. [Google Scholar]
- Gąsiorowska, B.; Makarewicz, A. Wpływ nawożenia azotowego na plonowanie pszenicy jarej. Ann. UMCS 2004, 59, 713–719. [Google Scholar]
- Gąsiorowska, B.; Makarewicz, A.; Nowosielska, A.; Rymuza, K. Efektywność produkcyjna nawożenia azotem różnych odmian pszenicy jarej. Pam. Puł. 2006, 142, 117–125. [Google Scholar]
- Kocoń, A. Nawożenie jakościowej pszenicy jarej i ozimej a plon i jakość ziarna. Pam. Puł. 2005, 139, 55–64. [Google Scholar]
- Sułek, A.; Mazurek, J. Wpływ podstawowych czynników agrotechnicznych na plon i cechy plonotwórcze nowych odmian pszenicy jarej. Biul. IHAR 2001, 220, 59–67. [Google Scholar]
- Doberman, A.R. Nitrogen Use Efficiency—State of the Art; Agronomy & Horticulture—Faculty Publications. University of Nenraska Lincoln, USA: 2005; Volume 316. Available online: https://digitalcommons.unl.edu/agronomyfacpub/316 (accessed on 15 January 2023).
- Grzebisz, W.; Niewiadomska, A.; Przygocka-Cyna, K. Nitrogen Hotspots on the Farm-A Practice-Oriented Approach. Agronomy 2022, 12, 1305. [Google Scholar] [CrossRef]
- Woźniak, A.; Nowak, A.; Gawęda, D. The Effect of the Three-Field Crop Rotation System and Cereal Monoculture on Grain Yield and Quality and the Economic Efficiency of Durum Wheat Production. Pol. J. Environ. Stud. 2021, 30, 5297–5305. [Google Scholar] [CrossRef]
- Wu, L.; Zhang, X.; Chen, H.; Wang, D.; Nawaz, M.M.; Danso, F.; Chen, J.; Deng, A.; Song, Z.; Jamali, H.; et al. Nitrogen Fertilization and Straw Management Economically Improve Wheat Yield and Energy Use Efficiency, Reduce Carbon Footprint. Agronomy 2022, 12, 848. [Google Scholar] [CrossRef]
- Enghiad, A.; Ufer, D.; Countryman, A.M.; Thilmany, D.D. An Overview of Global Wheat Market Fundamentals in an Era of Climate Concerns. Hindawi Int. J. Agron. 2017, 2017, 3931897. [Google Scholar] [CrossRef]
- Pan, W.L.; Kidwell, K.K.; McCracken, V.A.; Bolton, R.P.; Allen, M. Economically Optimal Wheat Yield, Protein and Nitrogen Use Component Responses to Varying N Supply and Genotype. Front. Plant Sci. 2020, 10, 1790. [Google Scholar] [CrossRef]
- Jarecki, W.; Bobrecka-Jamro, D.; Jarecka, A. Reakcja pszenicy jarej na zróżnicowane nawożenie azotowe oraz dokarmianie dolistne. Acta Agrophys. 2016, 23, 39–50. [Google Scholar]
Disclaimer/Publisher’s Note: The statements, opinions and data contained in all publications are solely those of the individual author(s) and contributor(s) and not of MDPI and/or the editor(s). MDPI and/or the editor(s) disclaim responsibility for any injury to people or property resulting from any ideas, methods, instructions or products referred to in the content. |
© 2023 by the authors. Licensee MDPI, Basel, Switzerland. This article is an open access article distributed under the terms and conditions of the Creative Commons Attribution (CC BY) license (https://creativecommons.org/licenses/by/4.0/).
