Article

Evolution of Maize Compost in a Mediterranean Agricultural Soil: Implications for Carbon Sequestration

by
Layla M. San-Emeterio
1,2,
José M. De la Rosa
1,
Heike Knicker
1,
Rafael López-Núñez
1 and
José A. González-Pérez
1,*
1
Instituto de Recursos Naturales y Agrobiología de Sevilla (IRNAS-CSIC), Avenida Reina Mercedes 10, 41012 Sevilla, Spain
2
Med_Soil Research Group, Facultad de Química, Universidad de Sevilla, C/Profesor García González, 1, 41012 Seville, Spain
*
Author to whom correspondence should be addressed.
Agronomy 2023, 13(3), 769; https://doi.org/10.3390/agronomy13030769
Submission received: 26 January 2023 / Revised: 27 February 2023 / Accepted: 4 March 2023 / Published: 7 March 2023

Abstract

:
Compost amendments, apart from improving fertility and the general characteristics of agricultural soils, have known implications for global C cycling and sequestration in soils. Their effects are usually assessed via the quantification of soil organic carbon (SOC) pools, usually labile (fast) and recalcitrant (slow) pools, with varying intrinsic decomposition rates and distinct resident times. However, the real C-sequestration potential of organic additions to soil is still under discussion. In this study, a field trial and a lab incubation experiment were designed to study the C-sequestration mechanism in an agricultural Mediterranean soil. Soil with a history of C3 photosystem crop was amended with two maize composts from maize harvesting surpluses (C4 photosystem) with different maturity stages (AC: aged compost; NC: new, less mature compost). The evolution of SOM was monitored for 6 months using complementary analytical techniques, including analysis of stable C isotopes (IRMS), thermogravimetry (TG) and C-stock and priming effect (PE) modelling. Based on the natural C-isotope labelling, the proportion of new C was calculated. More than 50% of the C added to the soil with the compost was incorporated into the SOM in only 6 months. However, the application of maize compost did not always enhance soil C-sequestration capacity. The addition of compost caused a general PE, enhancing SOM decay and reducing the fast (labile) SOM mean residence time (MRT) (11.2 days). This was more pronounced with the addition of a higher dose of AC, causing a PE up to a 718%. On the other hand, a higher MRT (54.4 days) occurred in soils with NC applied, likely due to its deleterious effects, limiting heterotrophic activity. Despite that, the average MRT of the slow (recalcitrant) SOM pool was lower than usually reported. The application of higher doses of both composts generally showed greater MRT values compared to control (1.7 years vs. 3.8 and 2.9 years for NC and AC, respectively), leading to an increase in this more stable C pool and effective soil C sequestration. The results described in this work may help readers to better understand SOM dynamics and may be of use in designing appropriate management strategies for improving OM quantity and quality and to optimize C storage in Mediterranean soils.

1. Introduction

Compost from agricultural surpluses has been widely used to enhance the chemical, physical and microbiological aspects of soil quality [1], as well as to ensure an increase in organic matter (OM) content and the abundance of humic fractions [2]. These increases are usually assessed via the quantification of soil organic carbon (SOC), which generally accounts for two pools with varying intrinsic decomposition rates and reactivity, primarily labile and recalcitrant [3]. Fast or labile SOC fractions degrade quickly (within days or months), whereas slow or recalcitrant fractions degrade slowly (over years), as described in [4]. Hence, SOC has major implications for global C cycling and the sequestration of carbon in soils. However, there is a lack of research on the real potential of organic input for C sequestration and its contribution to the so-called recalcitrant pool, which is primarily composed of humic-like stable substances. Conversely, this input becomes part of the microbial-derived soil substance pool (labile pool) that is consumed by soil heterotroph microorganisms and released as CO2, thus increasing greenhouse gas emissions [5]. The assessment of SOM recalcitrance and its functionality requires a better understanding of the degradation and humification mechanisms involved as well as its chemical composition and structure.
Likewise, soil changes caused by organic amendments will depend on the chemical composition of the compost, its origin and nature, as well as the environmental conditions [6]. This significantly conditions the soil’s decomposition rate and diverse contribution to the labile and recalcitrant SOM fractions. Therefore, the highest environmental quality is usually associated with an equilibrium between resilient SOM, which is usually more humified, chemically complex and aromatic, and the labile forms [7,8]. However, it is evident that the evolution of C content after the application of organic amendments does not necessarily involve greater C stabilization. More research is needed on the so-called “priming effect” (PE), based on the idea that new C inputs to the soil, far from increasing the C content, may induce the decomposition of existing SOC in the short term [9]. Therefore, the microbial processes causing this PE are different from those causing the stabilization of the new C inputs. Hence, the process of C sequestration in soils is complex, and it is important that we develop a better understanding of the dynamics and the molecular composition of the OM provided by compost and its implications for soil C-sequestration potential.
Considering its intrinsic molecular complexity, a combination of advanced analytical tools has been successfully employed to investigate SOM’s molecular structure. On the one hand, soil incubation experiments represent a widely used, common tool to evaluate the process of SOM’s transformation into diverse C pools [10]. Soil incubation aims to evaluate biological activity primarily via the measurement of CO2 evolution under controlled conditions in microcosm experiments [11]. This type of experiment is usually combined with further physical and/or chemical soil analysis for an improved, more accurate characterization of the incubation outcomes. Thermal analysis methods, specifically thermogravimetry–differential scanning calorimetry (TG-DSC), have been previously used to characterize chemical changes in SOM fractions and compost [12,13,14]. This technique uses a continuous temperature ramp that progressively decomposes (oxidates) the organic compounds in the soil [15]. This temperature increase is coupled with weight loss measurement, known as thermogravimetry (TG). The thermal stability of organic compounds in the soil depends upon their chemical characteristics and possible organo–mineral associations [16]. Weight loss below 190–200 °C reflects the release of free and bound water. At c. 300 °C, an exothermic decomposition of the more labile aliphatic and carboxyl groups occurs, while the aromatic C—which is more refractory—is decomposed at >450 °C [17]. Therefore, this technique also allows for the comparison of the proportion between labile and recalcitrant SOM fractions under different soil management strategies, such as the addition of organic amendments [18].
In this study, a combination of different methods is applied to shed light on soil C-sequestration mechanisms. This may be particularly informative in the study of agricultural Mediterranean soils, that are characterized by a very low SOM content retention (usually <1% w/w) even with frequent organic amendment additions. For this, a combined field and lab incubation experiment was designed in order to evaluate (1) which processes drive C turnover via mineralization or humification; (2) at what extent C remains in soils in the short term; and (3) to which the SOM fraction (labile or recalcitrant) compost amendments with different characteristics contribute. The application of compost at different doses in agricultural soils is believed to enhance soil C content, particularly the most recalcitrant pool, by increasing the input of humified OM and promoting microbial activity. We hypothesize that higher doses of compost will result in higher increases in the most recalcitrant pool of soil C, and that this increase will be proportional to the maturity of the added compost. To the best of our knowledge, this study is unique in that it encompasses a range of analytical techniques providing complementary information to enlighten relevant aspects of OM dynamics in C-depleted agricultural soils.

2. Materials and Methods

2.1. Study Area and Experimental Setup

The experiment was set at “La Hampa”, an experimental farm that belongs to the Institute of Natural Resources and Agrobiology of Seville (IRNAS-CSIC). The farm is in the Coria del Río municipality (37°16′54′′ N, 6°3′47′′ W), 13 km SW of the city of Seville (Spain), with a typical Mediterranean climate. The average temperature during the duration of the experiment was 12.2 °C during winter and 25.8 °C during the spring–summer season, with a mild rainy winter (496 mm mean annual rainfall) (data from the farm’s agroclimatic station). The soil is classified as a Calcaric Cambisol [19] with a sandy clay loam texture (60% sand; 25% lime; 15% clay) and is characterized by low fertility in the first 30 cm of soil and a low organic matter content (an average of 1.5%).
Two parallel experiments were set up: one in the field and the other, an incubation experiment, under controlled conditions (Figure 1):
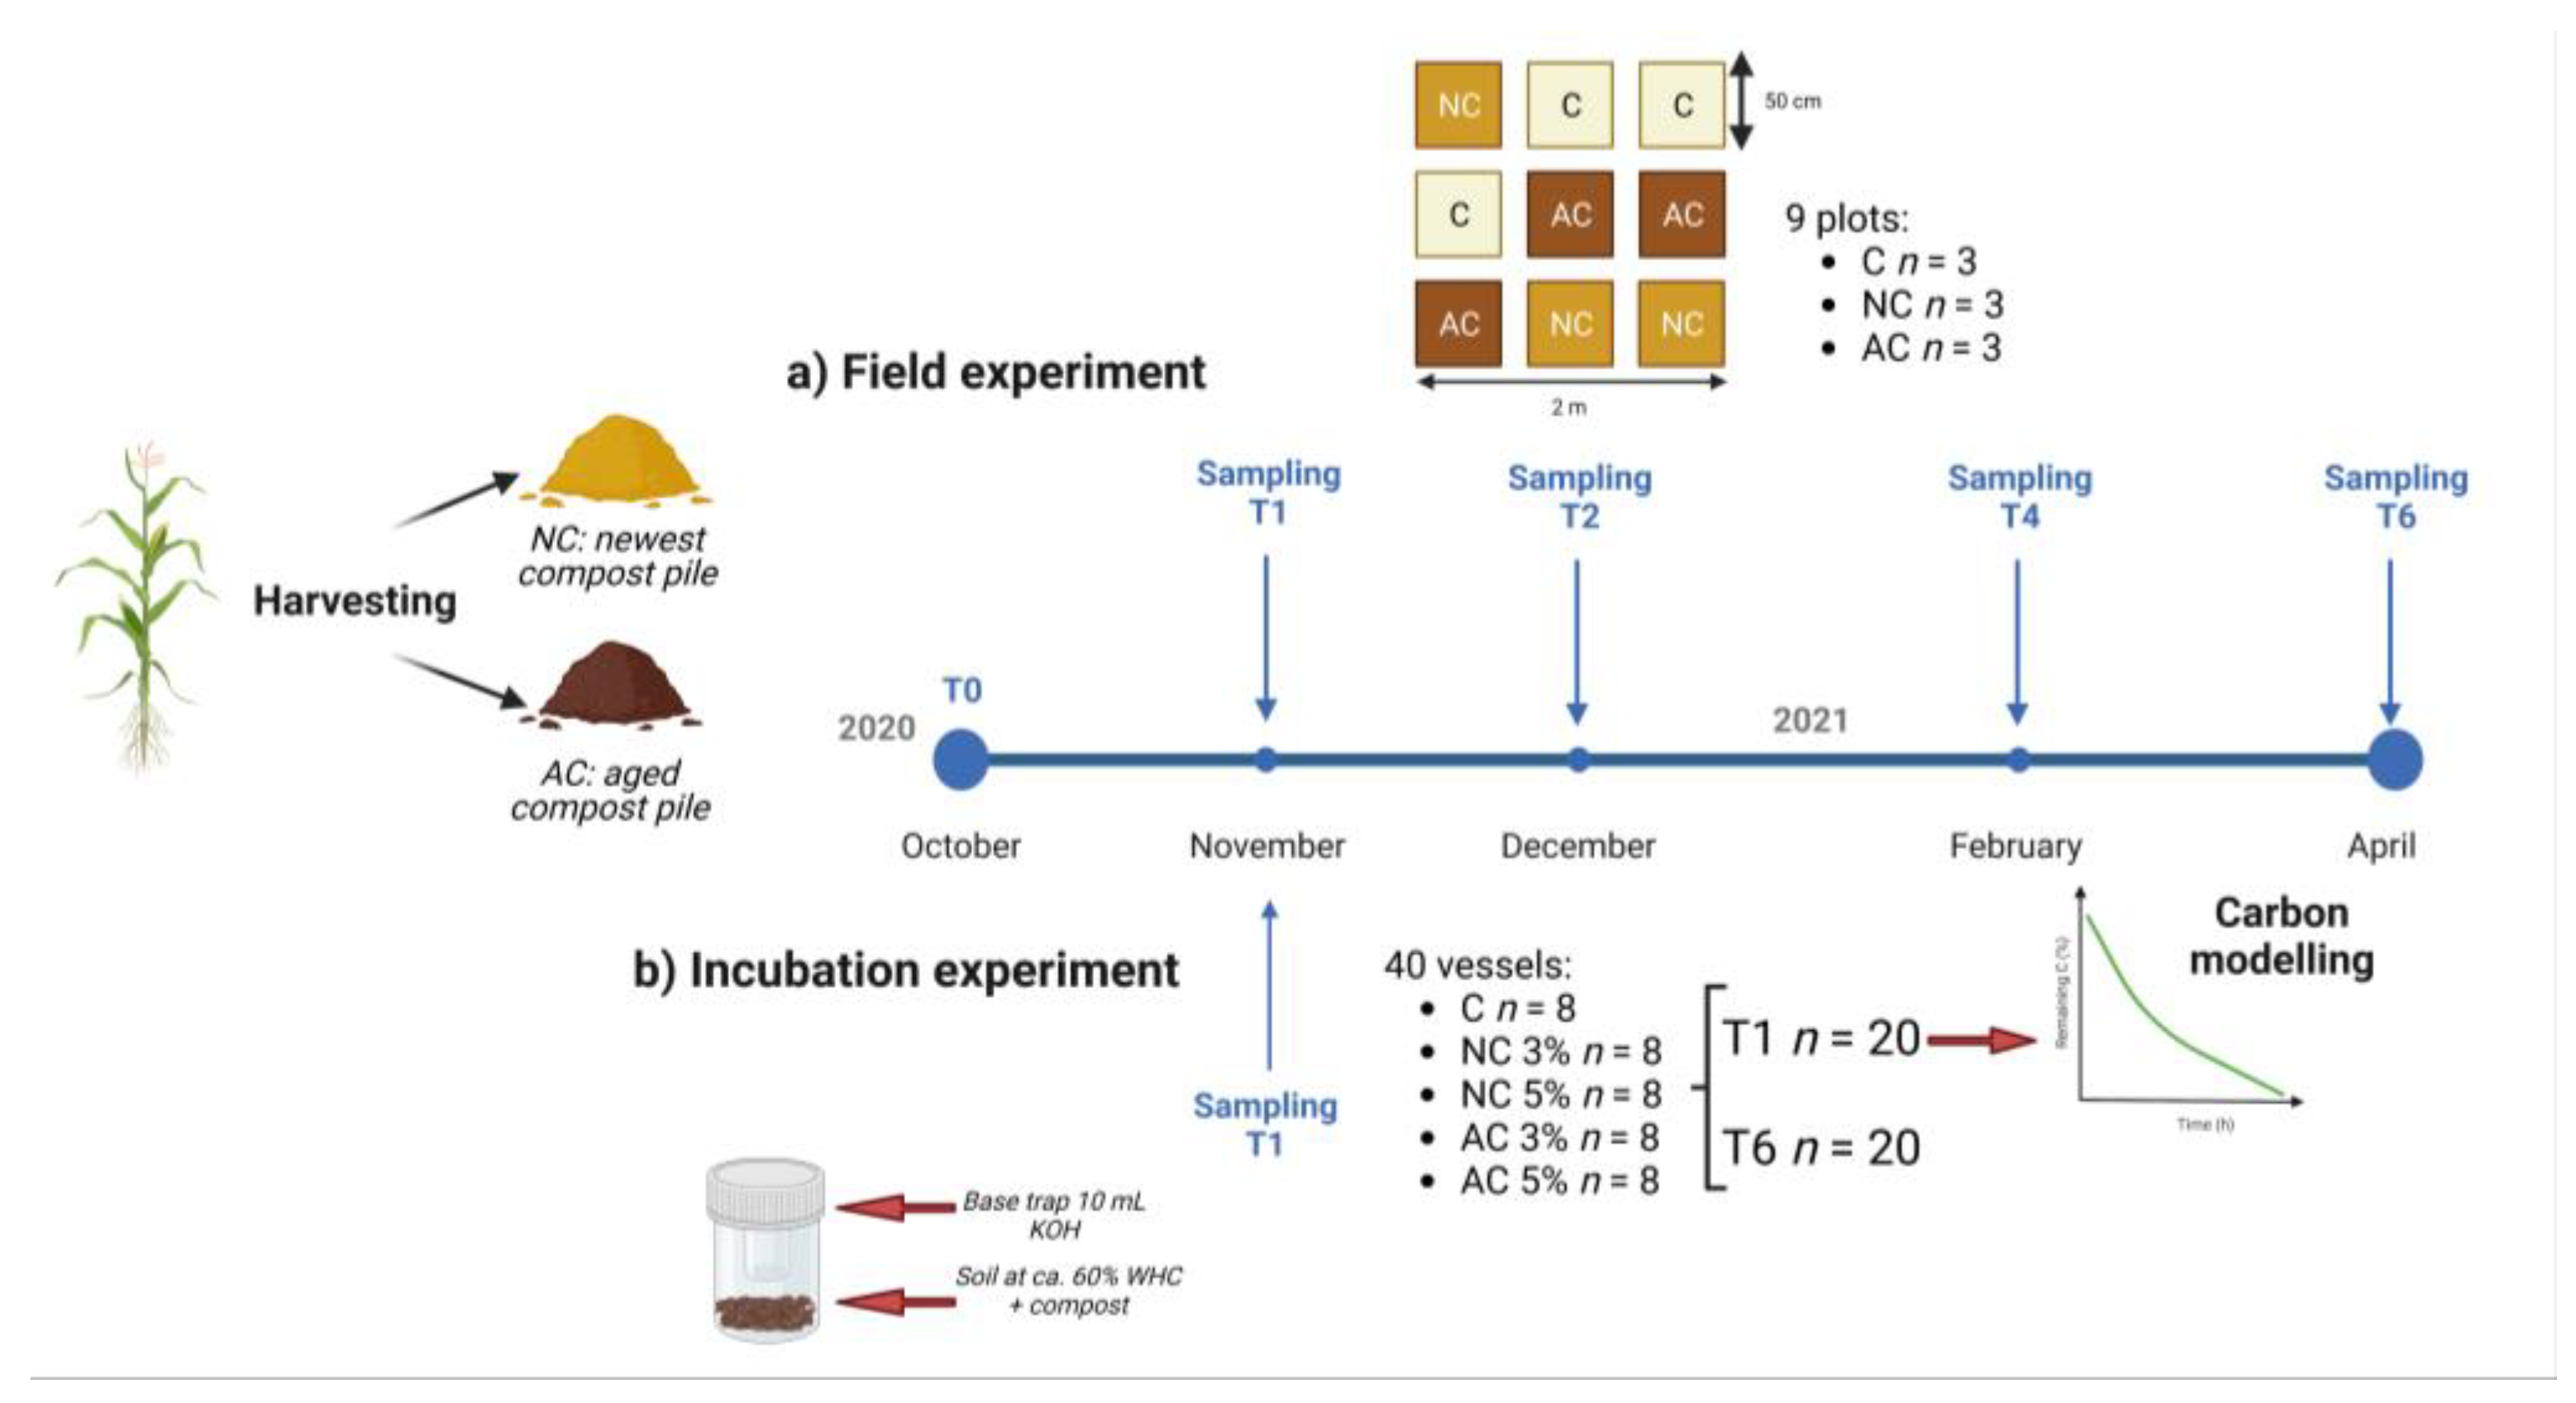
  • The field experiment (Figure 1a) consisted of a factorial field study with a completely randomized block design. This included three treatments and three repetitions per treatment with a total of nine plots (0.25 m2 each). The treatments involved the application of 2 Kg m−2 of a 2.9-year-aged compost amendment, hereafter called “AC”, and a “younger”, newer compost, “NC” (obtained after 1.7 years of composting). Additionally, an untreated control, “C”, was included.
  • The laboratory incubation experiment (Figure 1b) was used to study the first stages of SOM transformation and the PE that may occur after compost amendment. Forty samples incubated for one month were included. After 1 month, 20 samples intended for C modelling were retired, and the other 20 were maintained in incubation for an additional 5 months. These were later used for thermogravimetric and C stable isotope studies. Detailed technical aspects are described in Section 2.5 and Section 2.8.

2.2. Soil Sampling

For the field experiment, composite soil samples (0–15 cm depth) were randomly collected from each plot (3 sub-samples per plot). In total, 9 samples were taken at each sampling time. Prior to any analysis, the air-dried samples were sieved to fine earth (<2 mm). Any appreciable organic debris and biomass rests (i.e., fine roots) were removed.
For the incubation experiment, soil was collected from untreated areas surrounding the field experiment (not defined within the experimental design but with the same physicochemical properties). The samples were prepared, air-dried and sieved as described before.

2.3. Chemical and Physical Analysis

In the field experiment, soil cores of 200 cm3 from each plot were dried and used to calculate the bulk density at 5–10 cm at each designated sampling time, as in [20]. The pH was measured in triplicate in the supernatant of 1:2.5 (w/v) soil–water ratio, and a compost–water mix at a 1:5 (w/v) ratio after 30 min of shaking and 30 min of resting, using a CRISON glass electrode (pH measured using a Basic 20). Electrical conductivity was also measured in the filtered supernatant using a CRISON Micro CM 2201.
The analysis of organic C and N was carried out via dry combustion in an elemental analyser (EA), as described in Section 2.6. Given their high carbonate content (approximately 27%), the soils were treated with HCl 1M for 24 h at room temperature [21] before the analysis and acid rests were eliminated via repeated washes with distilled water until pH 5-6 was reached. The soil C/N ratio evolution was calculated for all treatments with the intention of estimating the organic matter mineralization of the amendment added to the soil.

2.4. Compost Samples

Surpluses of maize were collected after harvesting and formed into an outdoor 2 m3 composting pile of maize biomass in November 2017. These surpluses included various parts, such as stalks, leaves, husks and roots. To avoid altering the natural 13C abundance of the maize (C4 photosystem), no other type of biomass was included in the compost. Further details on the mechanical composting process, as well as the composts’ molecular characterization, are provided in [6]. Two composts were prepared for this experiment, as described above, and sampled in September 2020: the “AC” aged compost established in November 2017 (35 months) and the “NC” most recent compost established in February 2019 (20 months). The main characteristics of the composts are shown in Table 1.

2.5. Soil Incubation

A Respicond IV conductimetric automated respirometer (Nordgren Innovations, Sweden) was used for the continuous monitoring of CO2 released during the incubation experiment in an accelerated ageing process of amended soil samples, as previously described in [22]. Fast or labile and slow or recalcitrant SOC fractions were estimated based on the calculated turnover time using a double exponential decay model.
Before incubation, the water content of each soil sample was adjusted to ca. 60% of its maximum water holding capacity (WHC). Later, the controlled microbial degradation experiment was prepared as follows. For each treatment and compost dose, 100 mL glass beakers (n = 3) were randomly distributed at the respirometer with 20 g of compost-amended soil, using 0.6 g for the low dose (3%) and 1.0 g for high dose (5%), along with the corresponding untreated control soils. All soils were inoculated with 1 ml of a microbial suspension obtained from the extraction of gardening soil with deionized water and subsequent filtering (5 µm pore size). In addition, three vessels were prepared as blanks without any sample to monitor possible alterations during the incubation.
To allow optimal conditions for the development of microorganisms and accelerate organic matter degradation, the incubation temperature was kept constant at 25 °C via the samples’ immersion in a covered water bath for the entire duration of the experiment (6 months). All the glass beakers were placed into closed vessels (250 mL). The CO2 produced during the incubation was measured every 6 h for one month, as described in [23], by measuring the shift in conductivity in the 10 mL of 0.6 M KOH solution contained in a small vial attached to the lid of the 250 mL jar.
The amount of CO2 released was calculated by normalizing the CO2 production to the C content of each sample and using a calibration constant provided by the instrument manufacturer. This constant converts the decrease in the electrical conductance to accumulated CO2 at a constant temperature (25 °C). The remaining C calculated was plotted against the incubation time and fitted to a double exponential decay model, as defined in [24], using the following Equation (1):
C ( t ) = A f a s t · e k f a s t × t + A s l o w · e k s l o w × t
where C(t) is the remaining C as a % of the total carbon; Afast and Aslow are the amount of C relatively labile and more stable against mineralization as a % of the total C, respectively; kfast and kslow are the degradation constants (curve slopes) corresponding to the labile and the more stable pools in years−1, respectively; and t is the incubation time.
The two mean residence times (MRTs) for the labile and more stable pools, MRTfast and MRTslow, were calculated according to Equation (2):
M R T = 1 k

2.6. Elemental (EA) and Stable Isotope Analyses (EA-IRMS)

Soil C and N (%) content and stable isotope composition (δ13C ‰) were analysed simultaneously in decarbonated soil samples (2.5 mg). The samples were placed into tin capsules and analysed in duplicate (n = 3). The analysis was performed using an EA IsoLink™ IRMS System (Thermo Fisher Scientific, Bremen, Germany). The EA was equipped with a combustion furnace set to 1020 °C and coupled via a ConFlo IV Interface unit to a continuous-flow Delta V Advantage isotope ratio mass spectrometer (IRMS) for measuring δ13C. Isotopic values were corrected using appropriate standards recognized by the International Atomic Energy Agency (IAEA).
The stable isotope abundances are reported in the delta (δ) notation (e.g., δ13C) in variations relative to an international standard. The isotope value is defined as in [25], according to Equation (3).
δ 13 C s a m p l e = R   ( C 13 C 12 ) s a m p l e ( C 13 C 12 ) s t a n d a r d 1
where “R” is the molar ratio of heavy (13C) to light (12C) and was used to determine the most abundant isotope of carbon. The “δ” values are reported in per mil (‰). The stable isotope standard used for reporting carbon measurements was the Vienna Pee Dee Belemnite limestone (VPDB scale). The analytical precision of bulk δ13C values was typically less than ± 0.2 (standard deviation). The total C and total N contents were determined with the dry combustion method using the same instrument specified above (EA IsoLink) in the CN analyser mode using appropriate soil standards (Elemental Microanalysis, Ltd., Okehampton, UK) for C and N content.
Finally, as the incorporation of C into the soil—which has previously only been carried out for C3 photosystem plant cultivation—along with the application of compost amendments was naturally labelled as heavy C from the maize (C4 photosystem) biomass, the C in the amended soil could be calculated using a mixing model, as proposed in [26], using Equation (4).
f C 4 ( c o m p o s t ) = δ 13 C s o i l + c o m p o s t δ 13 C s o i l   ( C 3 ) δ 13 C c o m p o s t   ( C 4 ) δ 13 C s o i l   ( C 3 )

2.7. Priming Effect

The absolute priming effect (or primed soil CO2C) with the addition of compost was calculated as in [27] using Equation (5):
P r i m e d   s o i l   C O 2 C   ( μ g C · g 1 s o i l ) = C O 2 C t r e a t m e n t C O 2 C c o n t r o l
where CO2C treatment is the non-isotopically labelled CO2C evolved from compost-amended soil, CO2–C control is the total CO2C evolved from the control.
The priming effect of soil organic C, expressed as the % increase compared to CO2C evolved from the control, was calculated from Equation (6):
P r i m i n g   e f f e c t   ( % ) = 100 × ( C O 2 C t r e a t m e n t C O 2 C c o n t r o l ) C O 2 C c o n t r o l

2.8. Thermal Analysis

Thermogravimetric (TG) analysis was carried out in a Discovery SDT 650 Simultaneous TG-DSC (TA Instruments, New Castle, Delaware, USA). Briefly, for each sample, 10 mg of dry ground soil sample, as well as pure compost material, was placed in previously tared open alumina crucibles under a N2 flux (flow rate, 50 mL min−1; 10 mL min−1 at the micro-furnace), then heated and scanned at a rate of 20 K min−1 from 50 to 900 °C. The total weight loss in TGtot (%) was determined by integrating the TG curves (in Wg−1) over the region (105–600 °C). The derivative of weight loss (DTg; Tg−1) allowed us to distinguish 3 distinct regions in the compost samples representing different degrees of resistance to thermal oxidation [28]: (i) 105–200 °C; (ii) 200–425 °C; and (iii) 425–600 °C. The resulting partial weights were designated W1 (moisture and labile OM), W2 (intermediate OM) and W3 (recalcitrant OM).

2.9. Statistical Analysis

The IBM SPSS Statistics 26.0 (SPSS, Chicago, IL, USA) software was used to analyse data before and after incubation. For testing data normality and homoscedasticity, Shapiro–Wilk and Levene tests, respectively, were used. Multivariate factorial analysis of variance (ANOVA) and Tukey’s honestly significant difference (HSD) test were performed to study the differences between control and amended soils and the effect of composting dose on the incubation experiment. The Kruskal–Wallis test followed by the Dunn’s Test for significant difference between factors were performed in case normality and homoscedasticity were not met. For all analyses, the significance level was p < 0.05. The software Sigmaplot 14 (Systat Software Inc., Urbana, IL, USA) was used for fitting the curves of remaining carbon versus incubation time according to Equation (1). All obtained curves showed coefficients of determination of R2 > 0.994.

3. Results and Discussion

3.1. Effect of Compost Application on Physicochemical Properties of Soils

The main physicochemical variables for the untreated control and amended soils are shown in Table 2. A significant increase in the C:N ratio with composting time was observed, especially with the AC showing a higher C:N ratio. Generally, higher C:N values have been proven to foster more favourable soil biological properties in previous studies [29]. Indeed, this large increased soil C:N ratio after the AC addition may indicate a favorable incorporation of carbon to soil microbes, because of the large input of high-quality aboveground litter [30]. Considering that an optimal C:N ratio for compost material should be between 20–30, where mineralization and immobilization rates are balanced [31], these agree with C:N ratios from maize compost (Table 1). Indeed, higher C:N values under the AC pile are observed along with a relative lower C:N ratio (21.5 vs. 32.4), whereas the NC pile showing a greater C:N ratio could fit to less accessibility to soil microbes, hence a relative greater nutrient immobilization [32].
Moreover, the application of compost showed a significant increase in the EC and a decrease in pH. These exerted changes agree with a possible improvement in soil structure related to increased TOC [33]. Finally, values of bulk density significantly decreased in amended soils, which correlated well with an increase in organic matter and may indicate an improvement in soil quality [34].
In the field experiment (Figure 2a), the application of maize compost clearly increased SOC content over time. Consequently, the bulk carbon isotope composition showed more enriched values with the application of compost, especially from T4 onwards (after 4 months; Figure 2b). It is notable how the application of the AC caused a significant 13C enrichment from the beginning of the experiment (Figure 2b) as well as an early increase in SOC content compared to when NC was applied (Figure 2c).
During the incubation experiment under controlled conditions, the SOC content significantly increased after the application of both compost piles and at all doses (Figure 2c). Smaller differences, although not statistically significant, may be attributed to the maturity of the compost, as discussed later. Regarding the differences observed in 𝛿13C values (Figure 2d), significant changes were observed with the application of maize compost, causing an enrichment in 13C. After 6 months of incubation, a significant enrichment occurred for all treatments, including the control, and a further significant enrichment was observed at the higher amendment dose for both types of composts. This effect was most likely due to the heterotrophic activity reworking SOM that is usually seen in 𝛿13C enrichments [6,35,36].

3.2. Degradation of Compost into SOC Pools

The data corresponding to the evolution of the remaining C in each sample over one month of incubation are the result of an exponential decay model with two components fitted to the samples’ mean CO2 production. The curves of amended soil samples’ remaining carbon (% initial C content) vs. incubation time (h) fitted well to a double exponential model (R2 > 0.99) (Figure 3).
The contribution of the composts to both “slow” and “fast” pools at two different doses (3%, 5%) is shown in Table 3. The amount of C lost changed with the application of both types of composts, especially under the high dose of AC. This significant increase, observed after only one month, could be attributed to the presence of a minor C pool with high microbial accessibility, in accordance with the greater maturity of this material as confirmed by the polysaccharide:lignin ratio of the AC compost (Table 1)
The C in the labile fraction at T1 ranged from 1.7 in the control to 14.1 at AC-5% of the TC content. The biochemical degradability, as seen in the incubation experiment, showed that the amended soils contained higher proportions of labile C pool relative to the recalcitrant pool. This may indicate that the control soils were subjected to intense microbial activity that consumed the labile C pool [37]. However, a remarkable increase in this fraction was observed for the low-dose NC (3%) treatment. It was also noticeable that, in contrast to the higher NC dose, the higher AC dose produced a larger C labile fraction. This is later explained in terms of the PE and possible allelopathic effects of immature composts.
The most recalcitrant “slow” C fraction, likely composed of lignin, varied from 86.0% for AC at the higher dose and 98.3% of TC for the control (Table 3). The amended soils generally showed lower values when compared to control soils, although significant differences were found only for the soils amended with AC. The highest dose of applied compost caused greater values, especially for the NC treatment. Low doses of both compost piles caused the same effect: a lower, stable C proportion. High doses of NC (5%) did not affect this fraction compared to the control.
With regard to the estimated carbon mean resident times (MRTs), the control soils showed similar MRTfast values to those reported by other authors for unamended agricultural soils [38,39]. The MRTfast was significantly higher with the application of the NC at both doses—especially at a low dose, being up to 54.4 days—in contrast with AC, which did not cause any remarkable changes compared to the control. Significantly lower MRTfast could be related to intense microbial activity that quickly degrades labile C. The MRTslow values in control soils (1.7 yr ± 0.1) indicate that the non-labile pool of organic matter was unstable under the extreme conditions of our incubation experiment [40]. Nonetheless, this could also indicate that MRTslow values are due to the organic amendment as, in the short term, an increase was observed with higher doses of both compost piles.

3.3. Compost-Derived Carbon Contribution

The proportions of newly incorporated C (as C4) in the field and incubation experiments are shown in Figure 4. Approximately 30% of C was replaced by new carbon associated with the application of compost.
This increase was observed after only one month of the experiment, with similar values in both field and incubation trials. This rapid incorporation of new carbon could be firstly attributed to the rapid, high biomass incorporation, and secondly by the incorporation of carbon in the labile form [41], as later confirmed by the incubation results (Table 3). After six months, roughly 60% of new carbon was already incorporated in soils under field conditions; greater values were observed under controlled conditions. The latter indicates that the conditions used in the Respicond accelerate OM dynamics and are suitable as a simulator for SOM degradation [42,43]. Indeed, nearly all the carbon was reworked and incorporated in soils when the higher dose of both compost piles was applied in the Respicond. No differences were spotted between the two different compost piles.

3.4. Priming Effect

A PE was observed during the first few hours after the application of both compost piles (Figure 5). This could be explained by the well-known boost of microbial activity caused by the addition of exogenous organic matter, primarily in the short term [44]. In this respect, the PE caused by the application of a high dose of AC is noteworthy. This microbial response could be due to an accelerated metabolism, with soil microorganisms moving from a dormant to an active growth state, a “triggering effect” caused by the presence of certain low-molecular-weight compounds added to the soil with the amendment [45].
Lower PE were observed for soils amended with NC application, which were almost unappreciable at the higher dose. This could be explained by a lower accessibility of soil microorganisms to the compost material, likely due to the lower maturity of the compost pile [46]. This phenomenon may be also related to the presence of allelopathic substances (phenolics, hydroxamic acids or short-chain fatty acids) present in immature composts that may act as inhibitors of microbial activity, especially when applied above the regular dose [47,48].
On the other hand, a remarkable high priming effect in soils amended with the highest dose of AC (5%) was observed. This notable priming effect is also confirmed by the changes in the labile organic carbon pool (Afast in Table 3); higher Afast values were obtained for the higher dose of AC amendment. This significant rate of primed CO2 may be indicating an immediate bloom of microbial activities after the addition of an appropriate source of exogenous OM [49]. This greater C input from higher doses of plant material is compensated by faster C turnover due to this accelerated microbial growth, metabolism and respiration [50]. This is even more pronounced when the addition of material implies an increase in labile C input [51,52], as confirmed by modelling data. This is of a special interest in agroecosystems such as cropland soils, as microorganism are more strongly C limited and respond intensively to fresh C inputs [53]. Thus, this significant PE with the application of a more mature compost material indicates that this practice may stimulate soil microbial activation by greater C availability [9,54]; however, this may not necessarily involve an enhance in soil C sequestration.

3.5. Thermal Alteration in SOM during Degradation

The results of the thermal analyses are shown in Table 4, and the TG curves can be found in Supplementary Figures S1 and S2 for soils and compost samples, respectively. The interpretation of TG analysis follows the partitioning of the thermograms according to the diverse biogenic groups of compounds. Usually, the signal in the first part of the thermogram (W1) corresponds to the loss of water, carbohydrate dehydration and the release of other loosely bound compounds, such as amino acids and aliphatic and simple lipids. This is related to the SOM fraction most prone to degradation and pore water. Likewise, signals at higher temperatures (W3) correspond to the thermal decomposition of more recalcitrant organic matter, usually composed of lignin polyphenols and other condensed aromatic compounds, characteristic of a more stable and humified SOM [12,55].
First and foremost, both organic amendments (AC and NC) displayed very similar compositions, dominated by intermediate OM, which suggests that they were composed primarily of lignin derivatives and cellulose. Despite this, the AC showed a slightly greater recalcitrant fraction than NC, with a relatively greater labile fraction. These differences matched what was expected according to the respective maturity of both compost piles; in AC, a greater fraction of the labile fraction was degraded, as confirmed via a detailed previous qualitative and semi-quantitative chemical characterization of both compost piles [6].
The thermograms of the soils from the field experiment show a higher abundance of OM in the compost-amended soils, indicated by the greater total weight loss compared to the control soils. At T1, the addition of compost increased the total weight loss in all cases, especially in the field experiment, in comparison with the soils from the control plots (2.5 vs. 4.1 in field experiment at T1, and 2.9 vs. 5.0 in incubation experiment at T6). This increase corresponded to a greater abundance of intermediate and recalcitrant OM fractions (W2 and W3, respectively) in all cases.
It was observed that, in the field experiment, the control soils presented a significant relative abundance of the most stable fraction (W3) with no changes over time. Comparatively, the amendment increased the presence of labile OM (relative abundances up to 21% to 24%) after one month of application. Nevertheless, at T6, that labile fraction was lost, while the relative abundance of the recalcitrant OM increased until values resembling those of control soils were attained. This may indicate that the added labile OM had already degraded after six months.
In the incubation experiment carried out in the Respicond, the results are similar. Soils amended with compost showed a higher presence of intermediate OM (W2) than the control, which was almost exclusively composed of stable OM (W3). Over time, from T1 to T6, the relative abundance of the recalcitrant OM of soils amended by both composts increased at the expense of W2. However, these absolute changes were small and do not imply a change in relative abundance.

4. Conclusions

The application of maize compost as an amendment to agricultural soils under the Mediterranean climate caused the rapid incorporation of biomass to the soil and produced changes in the labile and recalcitrant SOM fractions. This incorporation was slowed when using immature compost (NC) and much faster when using mature compost (AC). However, it must be noted that the models for estimating slow and fast C pools and their decay rates in lab incubation experiments may not entirely reflect real SOM dynamics. The addition of AC, which was more beneficial for the soil microbial community, caused a pronounced short-term priming effect (PE), enhancing SOM decay and reducing the fast (labile) SOM mean residence time (MRT). On the contrary, higher MRTs were observed for the fast carbon pool in the soils amended with NC, likely due to the activity of agents in the NC that limit bacterial growth and PE. Regarding the effect of amendments in the slow (recalcitrant) SOM, the AC and control treatments showed similarly low MRT values, and higher MRTs were observed for both compost types when applied at higher doses. However, the degradation of this slow C fraction was lower (higher MRTs) than in the control soils, leading to an increase in this more stable C pool.
The obtained results may help readers to better understand SOM dynamics and when designing appropriate management strategies for improving SOM quantity and quality. This is of particular interest for agricultural Mediterranean soils, which usually retain a low C content and where C mineralization is accelerated by extreme climatic and edaphic characteristics. This study is of agronomic interest since the application of organic amendments, a recurrent practice in Mediterranean agroecosystems, may also enhance C-storage potential in soil. However, the quality (i.e., maturity degree) of the applied amendment should be considered; this is critical for directing C dynamics towards a more recalcitrant, slower-release C pool and an effective sequestration of C in the soil.
Further studies on the microbial processes involved in C dynamics under Mediterranean conditions are being conducted, including several exploring C, N and H stable isotope analysis, extracted PLFA biomarkers and microbial profiling via 16S rDNA sequencing. Moreover, effects of compost amendment based on detailed soil physical properties (i.e., soil aggregation, porosity and hydraulic conductivity) are greatly encouraged, primarily attending to the clay and loam proportion.

Supplementary Materials

The following supporting information can be downloaded at: https://www.mdpi.com/article/10.3390/agronomy13030769/s1, Figure S1: Thermograms (weight loss -green- and derivative weight/temperature -red-) for the temperature interval 50–600 °C of soil samples taken 1 month (T1) and 6 months (T6) after the amendment. Figure S2: Thermograms (weight loss -green- and derivative weight/temperature -red-) for the temperature interval 50–600 °C of compost piles AC (aged compost) and NC (new compost).

Author Contributions

L.M.S.-E.: Methodology, Formal analysis, Data curation, Visualization, Writing—review and editing, Writing—original draft. J.M.D.l.R.: Supervision, Methodology, Data curation, Supervision, Writing—review and editing. H.K.: Methodology, Data curation, Supervision, Writing—review and editing. R.L.-N.: Methodology, Data curation, Supervision, Writing—review and editing. J.A.G.-P.: Conceptualization, Methodology, Data curation, Resources, Supervision, Funding acquisition, Writing—review and editing. All authors have read and agreed to the published version of the manuscript.

Funding

Authors thank the 2nd call of the European Joint Programme “EJP SOIL” from the EU Horizon 2020 research and innovation programme for funding the subprojects EOM4SOIL, MIXROOT-C and MAXROOT-C (Grant agreement Nº 862695). L.M. San Emeterio thanks Ministerio de Ciencia Innovación y Universidades (MICIU) for INTERCARBON project (CGL2016-78937-R) and funding FPI research grants (BES-2017-07968).

Data Availability Statement

Data is available upon request.

Acknowledgments

D. Monis, A.M. Carmona and M. Velasco are acknowledged for technical assistance.

Conflicts of Interest

There is no conflict of interest for this research. The funders had no role in the design of the study; in the collection, analyses, or interpretation of data; in the writing of the manuscript, or in the decision to publish the results.

References

  1. Odlare, M.; Pell, M.; Svensson, K. Changes in soil chemical and microbiological properties during 4 years of application of various organic residues. Waste Manag. 2008, 28, 1246–1253. [Google Scholar] [CrossRef] [PubMed]
  2. Silva, J.R.; Silva, D.J.; Gava, C.A.T.; Oliveira, T.C.T.D.; Freitas, M.D.S.C.D. Carbon in humic fractions of organic matter in soil treated with organic composts under mango cultivation. Rev. Bras. Ciênc. Solo 2016, 40. [Google Scholar] [CrossRef] [Green Version]
  3. Wang, X.; Sheng, L.; Li, Y.; Jiang, H.; Lv, Z.; Qi, W.; Luo, W. Soil labile organic carbon indicating seasonal dynamics of soil organic carbon in northeast peatland. Ecol. Indic. 2022, 138, 108847. [Google Scholar] [CrossRef]
  4. Zou, X.M.; Ruan, H.H.; Fu, Y.; Yang, X.D.; Sha, L.Q. Estimating soil labile organic carbon and potential turnover rates using a sequential fumigation–incubation procedure. Soil Biol. Biochem. 2005, 37, 1923–1928. [Google Scholar] [CrossRef]
  5. Fangueiro, D.; Chadwick, D.; Dixon, L.; Bol, R. Quantification of priming and CO2 emission sources following the application of different slurry particle size fractions to a grassland soil. Soil Biol. Biochem. 2007, 39, 2608–2620. [Google Scholar] [CrossRef]
  6. San-Emeterio, L.M.; López-Núñez, R.; González-Vila, F.J.; González-Pérez, J.A. Evolution of composting process in maize biomass revealed by analytical pyrolysis (Py-GC/MS) and pyrolysis compound specific isotope analysis (Py-CSIA). Appl. Sci. 2021, 11, 6684. [Google Scholar] [CrossRef]
  7. Arias, M.E.; González-Pérez, J.A.; González-Vila, F.J.; Ball, A.S. Soil health: A new challenge for microbiologists and chemists. Int. Microbiol. 2005, 8, 13–21. [Google Scholar]
  8. Teutscherova, N.; Vázquez, E.; Santana, D.; Navas, M.; Masaguer, A.; Benito, M. Influence of pruning waste compost maturity and biochar on carbon dynamics in acid soil: Incubation study. Eur. J. Soil Biol. 2017, 78, 66–74. [Google Scholar] [CrossRef]
  9. Kuzyakov, Y. Priming effects: Interactions between living and dead organic matter. Soil Biol. Biochem. 2010, 42, 1363–1371. [Google Scholar] [CrossRef]
  10. Gasser, A.A.; Diel, J.; Nielsen, K.; Mewes, P.; Engels, C.; Franko, U. A model ensemble approach to determine the humus building efficiency of organic amendments in incubation experiments. Soil Use Manag. 2022, 38, 179–190. [Google Scholar] [CrossRef]
  11. Hilscher, A.; Knicker, H. Carbon and nitrogen degradation on molecular scale of grass-derived pyrogenic organic material during 28 months of incubation in soil. Soil Biol. Biochem. 2011, 43, 261–270. [Google Scholar] [CrossRef]
  12. De la Rosa, J.M.; González-Pérez, J.A.; González-Vázquez, R.; Knicker, H.; López-Capel, E.; Manning, D.A.C.; González-Vila, F.J. Use of pyrolysis/GC–MS combined with thermal analysis to monitor C and N changes in soil organic matter from a Mediterranean fire affected forest. Catena 2008, 74, 296–303. [Google Scholar] [CrossRef]
  13. De la Rosa, J.M.; Faria, S.R.; Varela, M.E.; Knicker, H.; González-Vila, F.J.; González-Pérez, J.A.; Keizer, J. Characterization of wildfire effects on soil organic matter using analytical pyrolysis. Geoderma 2012, 191, 24–30. [Google Scholar] [CrossRef]
  14. Prats, S.A.; Merino, A.; Gonzalez-Perez, J.A.; Verheijen, F.G.A.; De la Rosa, J.M. Can straw-biochar mulching mitigate erosion of wildfire-degraded soils under extreme rainfall? Sci. Total Environ. 2021, 761, 143219. [Google Scholar] [CrossRef]
  15. Kuzyakov, Y.; Mitusov, A.; Schneckenberger, K. Effect of C3–C4 vegetation change on δ13C and δ15N values of soil organic matter fractions separated by thermal stability. Plant Soil 2006, 283, 229–238. [Google Scholar] [CrossRef]
  16. Chen, C.; Leinweber, P.; Eckhardt, K.U.; Sparks, D.L. The composition and stability of clay-associated organic matter along a soil profile. Soil Syst. 2018, 2, 16. [Google Scholar] [CrossRef] [Green Version]
  17. Leinweber, P.; Schulten, H.R.; Jancke, H. New evidence for the molecular composition of soil organic matter in Vertisols. Soil Sci. 1999, 164, 857–870. [Google Scholar] [CrossRef]
  18. Lopez-Capel, E.; Sohi, S.P.; Gaunt, J.L.; Manning, D.A. Use of thermogravimetry–differential scanning calorimetry to characterize modelable soil organic matter fractions. Soil Sci. Soc. Am. J. 2005, 69, 136–140. [Google Scholar] [CrossRef]
  19. IUSS Working Group WRB. World Reference Base for Soil Resources. In International Soil Classification System for Naming Soils and Creating Legends for Soil Maps; World Soil Resources Reports, 106; FAO: Rome, Italy, 2015; pp. 1–203. [Google Scholar]
  20. Grossman, R.B.; Reinsch, T.G. Bulk Density and Linear Extensibility: Core Method. In Methods of Soil Analysis. Part 4, Physical Methods; John Wiley & Sons Ltd.: Hoboken, NJ, USA, 2002; pp. 201–228. [Google Scholar]
  21. Cheng, X.; Luo, Y.; Chen, J.; Lin, G.; Chen, J.; Li, B. Short-term C4 plant Spartina alterniflora invasions change the soil carbon in C3 plant-dominated tidal wetlands on a growing estuarine Island. Soil Biol. Biochem. 2006, 38, 3380–3386. [Google Scholar] [CrossRef]
  22. Knicker, H.; González-Vila, F.J.; González-Vázquez, R. Biodegradability of organic matter in fire-affected mineral soils of Southern Spain. Soil Biol. Biochem. 2013, 56, 31–39. [Google Scholar] [CrossRef]
  23. Nordgren, A. Apparatus for the continuous, long-term monitoring of soil respiration rate in large numbers of samples. Soil Biol. Biochem. 1988, 20, 955–957. [Google Scholar] [CrossRef]
  24. Knicker, H.; Hilscher, A.; De la Rosa, J.M.; González-Pérez, J.A.; González-Vila, F.J. Modification of biomarkers in pyrogenic organic matter during the initial phase of charcoal biodegradation in soils. Geoderma 2013, 197, 43–50. [Google Scholar] [CrossRef] [Green Version]
  25. Coplen, T.B. Guidelines and recommended terms for expression of stable-isotope-ratio and gas-ratio measurement results. Rapid Commun. Mass Spectrom. 2011, 25, 2538–2560. [Google Scholar] [CrossRef]
  26. Derrien, D.; Amelung, W. Computing the mean residence time of soil carbon fractions using stable isotopes: Impacts of the model framework. Eur. J. Soil Sci. 2011, 62, 237–252. [Google Scholar] [CrossRef]
  27. Luo, Y.; Durenkamp, M.; De Nobili, M.; Lin, Q.; Brookes, P.C. Short term soil priming effects and the mineralisation of biochar following its incorporation to soils of different pH. Soil Biol. Biochem. 2011, 43, 2304–2314. [Google Scholar] [CrossRef]
  28. De la Rosa, J.M.; Knicker, H.; López-Capel, E.; Manning, D.A.C.; Gonzalez-Perez, J.A.; González-Vila, F.J. Direct detection of black carbon in soils by Py-GC/MS, carbon-13 NMR spectroscopy and thermogravimetric techniques. Soil Sci. Soc. Am. J. 2008, 72, 258–267. [Google Scholar] [CrossRef] [Green Version]
  29. Tejada, M.; Hernandez, M.T.; Garcia, C. Soil restoration using composted plant residues: Effects on soil properties. Soil Tillage Res. 2009, 102, 109–117. [Google Scholar] [CrossRef]
  30. Wan, X.; Huang, Z.; He, Z.; Yu, Z.; Wang, M.; Davis, M.R.; Yang, Y. Soil C: N ratio is the major determinant of soil microbial community structure in subtropical coniferous and broadleaf forest plantations. Plant Soil 2015, 387, 103–116. [Google Scholar] [CrossRef]
  31. Brust, G.E. Management strategies for organic vegetable fertility. In Safety and Practice for Organic Food; Academic Press: Cambridge, MA, USA, 2019; pp. 193–212. [Google Scholar]
  32. Howell, J. Soil Basics Part III: Organic Matter: Key to Soil Management. University of Massachusetts Amherst. 2013. Available online: https://ag.umass.edu/vegetable/fact-sheets/soil-basics-part-iii-organic-matter-key-to-management (accessed on 25 February 2023).
  33. Miralles, I.; Ortega, R.; Almendros, G.; Sánchez-Marañón, M.; Soriano, M. Soil quality and organic carbon ratios in mountain agroecosystems of South-east Spain. Geoderma 2009, 150, 120–128. [Google Scholar] [CrossRef]
  34. Chaudhari, P.R.; Ahire, D.V.; Ahire, V.D.; Chkravarty, M.; Maity, S. Soil bulk density as related to soil texture, organic matter content and available total nutrients of Coimbatore soil. Int. J. Sci. Res. Publ. 2013, 3, 1–8. [Google Scholar]
  35. Zech, W.; Senesi, N.; Guggenberger, G.; Kaiser, K.; Lehmann, J.; Miano, T.M.; Miltner, A.; Schroth, G. Factors controlling humification and mineralization of soil organic matter in the tropics. Geoderma 1997, 79, 117–161. [Google Scholar] [CrossRef]
  36. Schweizer, M.; Fear, J.; Cadisch, G. Isotopic (13C) fractionation during plant residue decomposition and its implications for soil organic matter studies. Rapid Commun. Mass Spectrom. 1999, 13, 1284–1290. [Google Scholar] [CrossRef]
  37. De la Rosa, J.M.; Rosado, M.; Paneque, M.; Miller, A.Z.; Knicker, H. Effects of aging under field conditions on biochar structure and composition: Implications for biochar stability in soils. Sci. Total Environ. 2018, 613, 969–976. [Google Scholar] [CrossRef] [Green Version]
  38. Leal, O.D.A.; Dick, D.P.; de la Rosa, J.M.; Leal, D.P.B.; González-Pérez, J.A.; Campos, G.S.; Knicker, H. Charcoal fine residues effects on soil organic matter humic substances, composition, and biodegradability. Agronomy 2019, 9, 384. [Google Scholar] [CrossRef] [Green Version]
  39. Campos, P.; Knicker, H.; Velasco-Molina, M.; De la Rosa, J.M. Assessment of the biochemical degradability of crop derived biochars in trace elements polluted soils. J. Anal. Appl. Pyrolysis 2021, 157, 105186. [Google Scholar] [CrossRef]
  40. De Gerenyu, V.O.L.; Kurganova, I.N.; Kuzyakov, Y. Carbon pool and sequestration in former arable Chernozems depending on restoration period. Ekologija 2008, 54, 232–238. [Google Scholar] [CrossRef]
  41. Wiesenberg, G.L.; Schwarzbauer, J.; Schmidt, M.W.; Schwark, L. Source and turnover of organic matter in agricultural soils derived from n-alkane/n-carboxylic acid compositions and C-isotope signatures. Org. Geochem. 2004, 35, 1371–1393. [Google Scholar] [CrossRef]
  42. Diels, J.; Vanlauwe, B.; Van der Meersch, M.K.; Sanginga, N.; Merckx, R. Long-term soil organic carbon dynamics in a subhumid tropical climate: 13C data in mixed C3/C4 cropping and modeling with ROTHC. Soil Biol. Biochem. 2004, 36, 1739–1750. [Google Scholar] [CrossRef]
  43. Gargouri, K.; Masmoudi, M.; Rhouma, A. Influence of olive mill wastewater (OMW) spread on carbon and nitrogen dynamics and biology of an arid sandy soil. Commun. Soil Sci. Plant Anal. 2014, 45, 1–14. [Google Scholar] [CrossRef]
  44. Blagodatskaya, Е.; Kuzyakov, Y. Mechanisms of real and apparent priming effects and their dependence on soil microbial biomass and community structure: Critical review. Biol. Fertil. Soils 2008, 45, 115–131. [Google Scholar] [CrossRef]
  45. Kuzyakov, Y.; Bol, R. Sources and mechanisms of priming effect induced in two grassland soils amended with slurry and sugar. Soil Biol. Biochem. 2006, 38, 747–758. [Google Scholar] [CrossRef]
  46. Wichuk, K.M.; McCartney, D. Compost stability and maturity evaluation—A literature review. Can. J. Civ. Eng. 2010, 37, 1505–1523. [Google Scholar] [CrossRef]
  47. Senesi, N. Composted materials as organic fertilizers. Sci. Total Environ. 1989, 81, 521–542. [Google Scholar] [CrossRef]
  48. Ciavatta, C.; Centemero, M.; Toselli, M.; Zaccone, C.; Senesi, N. Compost in Agriculture Production, Analysis and Applications. In Multi-Scale Biogeochemical Processes in Soil Ecosystems: Critical Reactions and Resilience to Climate Changes; John Wiley & Sons: Hoboken, NJ, USA, 2022; pp. 297–321. [Google Scholar]
  49. Federici, E.; Massaccesi, L.; Pezzolla, D.; Fidati, L.; Montalbani, E.; Proietti, P.; Nasini, L.; Regni, L.; Scargetta, S.; Gigliotti, G. Short-term modifications of soil microbial community structure and soluble organic matter chemical composition following amendment with different solid olive mill waste and their derived composts. Appl. Soil Ecol. 2017, 119, 234–241. [Google Scholar] [CrossRef]
  50. Kuzyakov, Y.; Horwath, W.R.; Dorodnikov, M.; Blagodatskaya, E. Review and synthesis of the effects of elevated atmospheric CO2 on soil processes: No changes in pools, but increased fluxes and accelerated cycles. Soil Biol. Biochem. 2019, 128, 66–78. [Google Scholar] [CrossRef]
  51. Terrer, C.; Vicca, S.; Stocker, B.D.; Hungate, B.A.; Phillips, R.P.; Reich, P.B.; Finzi, A.C.; Prentice, I.C. Ecosystem responses to elevated CO 2 governed by plant–soil interactions and the cost of nitrogen acquisition. New Phytol. 2018, 217, 507–522. [Google Scholar] [CrossRef] [Green Version]
  52. Terrer, C.; Phillips, R.P.; Hungate, B.A.; Rosende, J.; Pett-Ridge, J.; Craig, M.E.; van Groeningen, K.J.; Keenan, T.F.; Sulman, B.N.; Stocker, B.D.; et al. A trade-off between plant and soil carbon storage under elevated CO2. Nature 2021, 591, 599–603. [Google Scholar] [CrossRef]
  53. Siles, J.A.; Díaz-López, M.; Vera, A.; Eisenhauer, N.; Guerra, C.A.; Smith, L.C.; Buscot, F.; Reitz, T.; Breitkreuz, C.; van den Hoogen, J.; et al. Priming effects in soils across Europe. Glob. Chang. Biol. 2022, 28, 2146–2157. [Google Scholar] [CrossRef]
  54. Sánchez-Monedero, M.A.; Cayuela, M.L.; Sánchez-García, M.; Vandecasteele, B.; D’Hose, T.; López, G.; Martínez-Gaitán, C.; Kuikman, P.J.; Sinicco, T.; Mondini, C. Agronomic evaluation of biochar, compost and biochar-blended compost across different cropping systems: Perspective from the European project FERTIPLUS. Agronomy 2019, 9, 225. [Google Scholar] [CrossRef] [Green Version]
  55. Fernández, J.M.; Plaza, C.; Polo, A.; Plante, A.F. Use of thermal analysis techniques (TG–DSC) for the characterization of diverse organic municipal waste streams to predict biological stability prior to land application. Waste Manag. 2012, 32, 158–164. [Google Scholar] [CrossRef]
Figure 1. Scheme and timeline of the experimental design of the (a) field experiment with the in situ application of both compost piles and (b) incubation experiment (microcosm), where C: control soil; NC: newest, most recent compost pile; AC: aged compost pile. Numbers after “T” indicates sampling time in months.
Agronomy 13 00769 g001
Figure 2. Changes in SOC content and 𝛿13C in the field (a,b) and incubation (c,d) experiment. Uppercase letters denote significant differences between treatments and lowercase letters indicate significant differences between sampling times; “*” indicates differences between amendment doses ((Two-way ANOVA, Tukey HSD, p < 0.05; means n = 3 ± standard error). Numbers after “T” indicates sampling time in months.
Agronomy 13 00769 g002
Figure 3. Remaining carbon (% of initial C content) as a function of incubation time (h) for the studied control and compost-amended soils at different doses. Dashed lines indicate confidence interval of 95% for treatment of the same colour.
Agronomy 13 00769 g003
Figure 4. Proportion of C4-derived carbon (fC4) in the field (a) and in the incubation experiment (b). Uppercase letters denote significant differences between treatments and lowercase letters indicate significant differences between sampling times (T1: one month after the addition; T6: six months after the addition). (Two-way ANOVA, Tukey HSD p < 0.05, means n = 3 ± standard error).
Agronomy 13 00769 g004
Figure 5. Relative changes in primed CO2 (expressed in µg C g−1 TC- h−1; AC: aged compost, greenish lines; NC: new compost, brownish lines), and priming effect (%; boxplot) induced by the addition of both compost piles at both doses (3%, 5% w/w). TC = total carbon. Letters in boxplot indicate significant differences among treatments (Kruskal-Wallis, Dunn’ Test, p < 0.05).
Agronomy 13 00769 g005
Table 1. Physicochemical properties of composts (means n = 3 ± standard error).
NCAC
C content (%)35.6 ± 0.230.1 ± 0.0
N content (%)1.1 ± 0.11.4 ± 0.3
C:N ratio32.421.5
Lignin/polysaccharide ratio *2.22.3
δ13C−17.5 ± 0.0 −18.1 ± 0.1
δ15N9.4 ± 0.49.6 ± 0.3
pH (1:5 w/v)7.9 ± 0.06.1 ± 0.0
EC (µS/cm)422.5 ± 0.7413 ± 1.5
* Data retrieved from [6].
Table 2. Physicochemical properties of control and amended soils in the field after 6 months (T6). Letters indicate significant differences between treatments (retrieved from ANOVA, p < 0.05, means n = 3 ± standard error).
ControlNCAC
C:N ratio11.7 ± 1.2 a13.2 ± 1.1 b16.0 ± 3.0 c
pH (1:2.5 w/v)8.7 ± 0.0 b8.2 ± 0.0 a8.1 ± 0.0 a
EC (µS/cm)201.0 ± 1.2 a315.8 ± 4.8c295.3 ± 9.4 b
Bulk density (g·cm−3)1.6 ± 0.1 b1.3 ± 0.3 a1.4 ± 0.2 a
EC: electrical conductivity. significant NC: newest compost; AC: aged compost. Different letters (a,b,c) indicate significant differences among treatments (Two-way ANOVA, Tukey HSD Test p < 0.05).
Table 3. Parameters calculated by the incubation experiment. Carbon loses, C fast and slow pools (Afast, Aslow), degradation constants (kfast, kslow) and the respective mean residence time (MRTfast, MRTslow) of control and amended soils.
C Loss (mg)Total C Loss
(% of TC)
Afast (% of TC)Kfast (year−1)MRTfast
(days)
Aslow (% of TC)Kslow (year−1)MRTslow (years)
Control9.6 ± 0.4 a4.7 ± 0.3 a1.7 ± 0.4 a38.5 ± 9.1 b10.8 ± 2.0 a98.3 ± 0.4 b0.58 ± 0.02 a1.7 ± 0.1 b
NC-3%23.2 ± 2.6 b6.2 ± 0.7 b7.9 ± 1.7 b7.0 ± 1.0 a54.4 ± 8.1 c,*92.2 ± 1.7 a,b0.99 ± 0.09 b,*1.2 ± 0.2 a
NC-5%24.5 ± 1.5 b6.0 ± 0.2 b4.2 ± 1.0 b16.9 ± 3.0 b,*23.5 ± 3.6 b96.0 ± 1.1 b,*0.44 ± 0.14 a3.8 ± 1.7 c,*
AC-3%32.2 ± 2.7 b9.4 ± 0.8 c8.5 ± 3.9 b27.2 ± 6.1 b11.2 ± 1.0 a91.6 ± 4.0 a0.74 ± 0.20 a,b1.6 ± 0.3 b
AC-5%54.6 ± 2.5 c,*11.6 ± 0.6 c14.1 ± 2.4 b,*32.2 ± 4.3 b12.0 ± 1.6 a86.0 ± 2.4 a0.41 ± 0.09 a2.9 ± 0.8 c,*
TC: total carbon. Lowercase letters indicate differences between treatments. “*” indicates differences between doses within the same treatment (compost pile) (Two-way ANOVA, Tukey HSD, p < 0.05; means n = 8 ± standard error).
Table 4. Comparative thermogravimetry (TG) parameters in samples, summarizing total weight loss for the temperature interval 105–600 °C, weight losses and relative weight losses for the temperature intervals of 105–200 °C, 200–425 °C and 425–600 °C.
Field SoilsIncubated Soils
T1T6T1T6
Temp. (°C)ControlNCACControlNCACControlNCACControlNCAC
Weight Loss (%)105–600 2.54.13.92.83.13.12.64.44.12.94.85.0
Moisture and Labile OM-W1105–2000.20.94.00.30.20.30.20.20.20.30.40.3
Intermediate OM-W2200–4251.01.51.31.01.31.20.92.01.81.22.12.4
Recalcitrant OM-W3425–6001.21.71.71.51.51.61.52.12.01.42.32.3
Relative Weight Loss (%)
Moisture and Labile OM105–20092110112811966986
Int OM-W2200–425413733354237364645424448
Recalcitrant OM-W3425–600494243535052554849484846
Where NC: new compost; AC: aged compost; T1: one month of application; T6: six months of application.
Disclaimer/Publisher’s Note: The statements, opinions and data contained in all publications are solely those of the individual author(s) and contributor(s) and not of MDPI and/or the editor(s). MDPI and/or the editor(s) disclaim responsibility for any injury to people or property resulting from any ideas, methods, instructions or products referred to in the content.

