Abstract
The accurate acquisition of safflower filament information is the prerequisite for robotic picking operations. To detect safflower filaments accurately in different illumination, branch and leaf occlusion, and weather conditions, an improved Faster R-CNN model for filaments was proposed. Due to the characteristics of safflower filaments being dense and small in the safflower images, the model selected ResNeSt-101 with residual network structure as the backbone feature extraction network to enhance the expressive power of extracted features. Then, using Region of Interest (ROI) Align improved ROI Pooling to reduce the feature errors caused by double quantization. In addition, employing the partitioning around medoids (PAM) clustering was chosen to optimize the scale and number of initial anchors of the network to improve the detection accuracy of small-sized safflower filaments. The test results showed that the mean Average Precision (mAP) of the improved Faster R-CNN reached 91.49%. Comparing with Faster R-CNN, YOLOv3, YOLOv4, YOLOv5, and YOLOv6, the improved Faster R-CNN increased the mAP by 9.52%, 2.49%, 5.95%, 3.56%, and 1.47%, respectively. The mAP of safflower filaments detection was higher than 91% on a sunny, cloudy, and overcast day, in sunlight, backlight, branch and leaf occlusion, and dense occlusion. The improved Faster R-CNN can accurately realize the detection of safflower filaments in natural environments. It can provide technical support for the recognition of small-sized crops.
1. Introduction
Safflower is a specialty cash crop globally. The cultivated area of safflower in the world is 8 × 10⁵ hm2 with a production of 6.5 × 10⁵ tons [1]. Safflower filaments are the main product of safflower. China is one of the major safflower filaments producers in the world [2]. Safflower filaments have a wide range of applications in the fields of medicine, feed, natural pigments, and dyes [3,4]. However, the current harvesting method of safflower filaments mainly relies on manual work, which is time-consuming and inefficient. In the production of filaments, the picking of filaments is more and more suited to mechanization and artificial intelligence. Due to the small size of safflower filaments and the interference of the natural environment such as weather, illumination variation, and branch and leaf occlusion, the color and texture features of the filaments are difficult to extract, resulting in easy misdetection and omission [5,6]. Therefore, improving the detection accuracy of safflower filaments in natural environments is conducive to the development of robotic automated picking.
Detection of objects is mainly based on one or more combinations of color, shape, and texture features [7,8,9,10]. Convolutional Neural Networks (CNN) extract different levels of features from shallow to deep in the input image through convolutional, pooling, and fully connected layers to achieve image detection [11]. The model has been applied to target detection [12,13,14]. Dias et al. [15] proposed end-to-end residual CNN for apple flower detection. The apple flower features are extracted and individual hyper pixels are classified using Clarifai CNN architecture with accuracy and recall close to 80%. Farjon et al. [16] used the Faster R-CNN model with improved anchor boxes to detect apple flowers with an average detection accuracy of 68%. Gogul et al. [17] designed a flower recognition system based on CNN and migration learning with Rank-1 accuracies of 82.32% on the flower dataset. Sun et al. [18] finetuned the semantic segmentation network DeepLab-ResNet using the apple flower dataset in different environments and obtained an F1 value of 80.9% for the CNN model. Zhao et al. [19] proposed a cascaded CNN-based detection method for the tomato flowering period with an accuracy of 76.67% in a glass greenhouse environment. Xia et al. [20] proposed a Faster R-CNN classification detection model with attention and multiscale feature fusion. The accuracy of detecting hydroponic kale buds with different maturity levels could be maintained above 90%. Li et al. [21] used High Resolution Network (HRNet) as the backbone network to detect hydroponic lettuce seedlings. The mAP of the hydroponic lettuce seedlings is 86.2%.
The above studies demonstrated the feasibility and effectiveness of deep learning methods applied to safflower filament detection, providing a reference for filament detection. However, the main objects of the current methods were the detection of apple blossom, tomato, and hydroponic lettuce. They had larger object sizes than safflower filaments and sparser target distributions than filaments. Meanwhile, these methods did not consider the interference of the natural environments on target detection. In reality, safflower filaments are small and dense, with severe branch and leaf occlusion. In addition, different weather and illumination conditions can affect detection in the natural environment. Therefore, there is still the problem of inefficient performance in practical applications. The detection of safflower filaments has many particularities and faces the following problems in natural environments. Firstly, safflower filaments are small in size, dense, and unevenly distributed. Since detecting small objects is a difficult task, most object detection models have a tough time dealing with small objects [22]. Secondly, densely planted safflower was severely shaded by branches and leaves, leading to missed inspections. Thirdly, detection can be interfered with by weather and illumination variations in natural environments, making the color and texture characteristics of filaments unevenly represented and leading to misdetection.
To effectively solve the detection problems with the small size of the filaments, and the weather and occlusion interference, avoiding misdetection and omission, images of safflower were collected in different natural environments to construct datasets for model training and evaluation. Combining with ResNeSt-101 and ROI Align, and optimizing the anchor boxes in Faster R-CNN, safflower filament detection was explored in natural environments. The following is a list of the key contributions of this study:
- (1)
- Aiming at addressing the interference problem of the natural environment, ResNeSt-101 used the Split Attention module to carry out multi-scale effective feature extraction. Meanwhile, enhancing the ability of local feature extraction improved the detection accuracy and avoided leakage and false detection.
- (2)
- Based on the size of safflower filaments, the anchor box size in the region generation network was optimized using the PAM clustering algorithm. The anchor box size matched with the filaments size more closely, leading to improved accuracy in detecting small sizes.
- (3)
- ROI Align was used instead of ROI Pooling to reduce the feature error of safflower filaments caused by double quantization. The target bounding box was depicted more accurately, improving the detection accuracy.
This article is structured as follows. Section 2 describes the safflower-picking robot and the safflower image dataset used. Section 3 proposes a framework structure of the improved Faster R-CNN for safflower filament detection. Section 4 describes the evaluation indicators of the network model. Section 5 conducts multiple sets of experiments and evaluates and comparatively analyzes the results. Section 6 gives the conclusions of this article and the directions of future work.
2. Materials
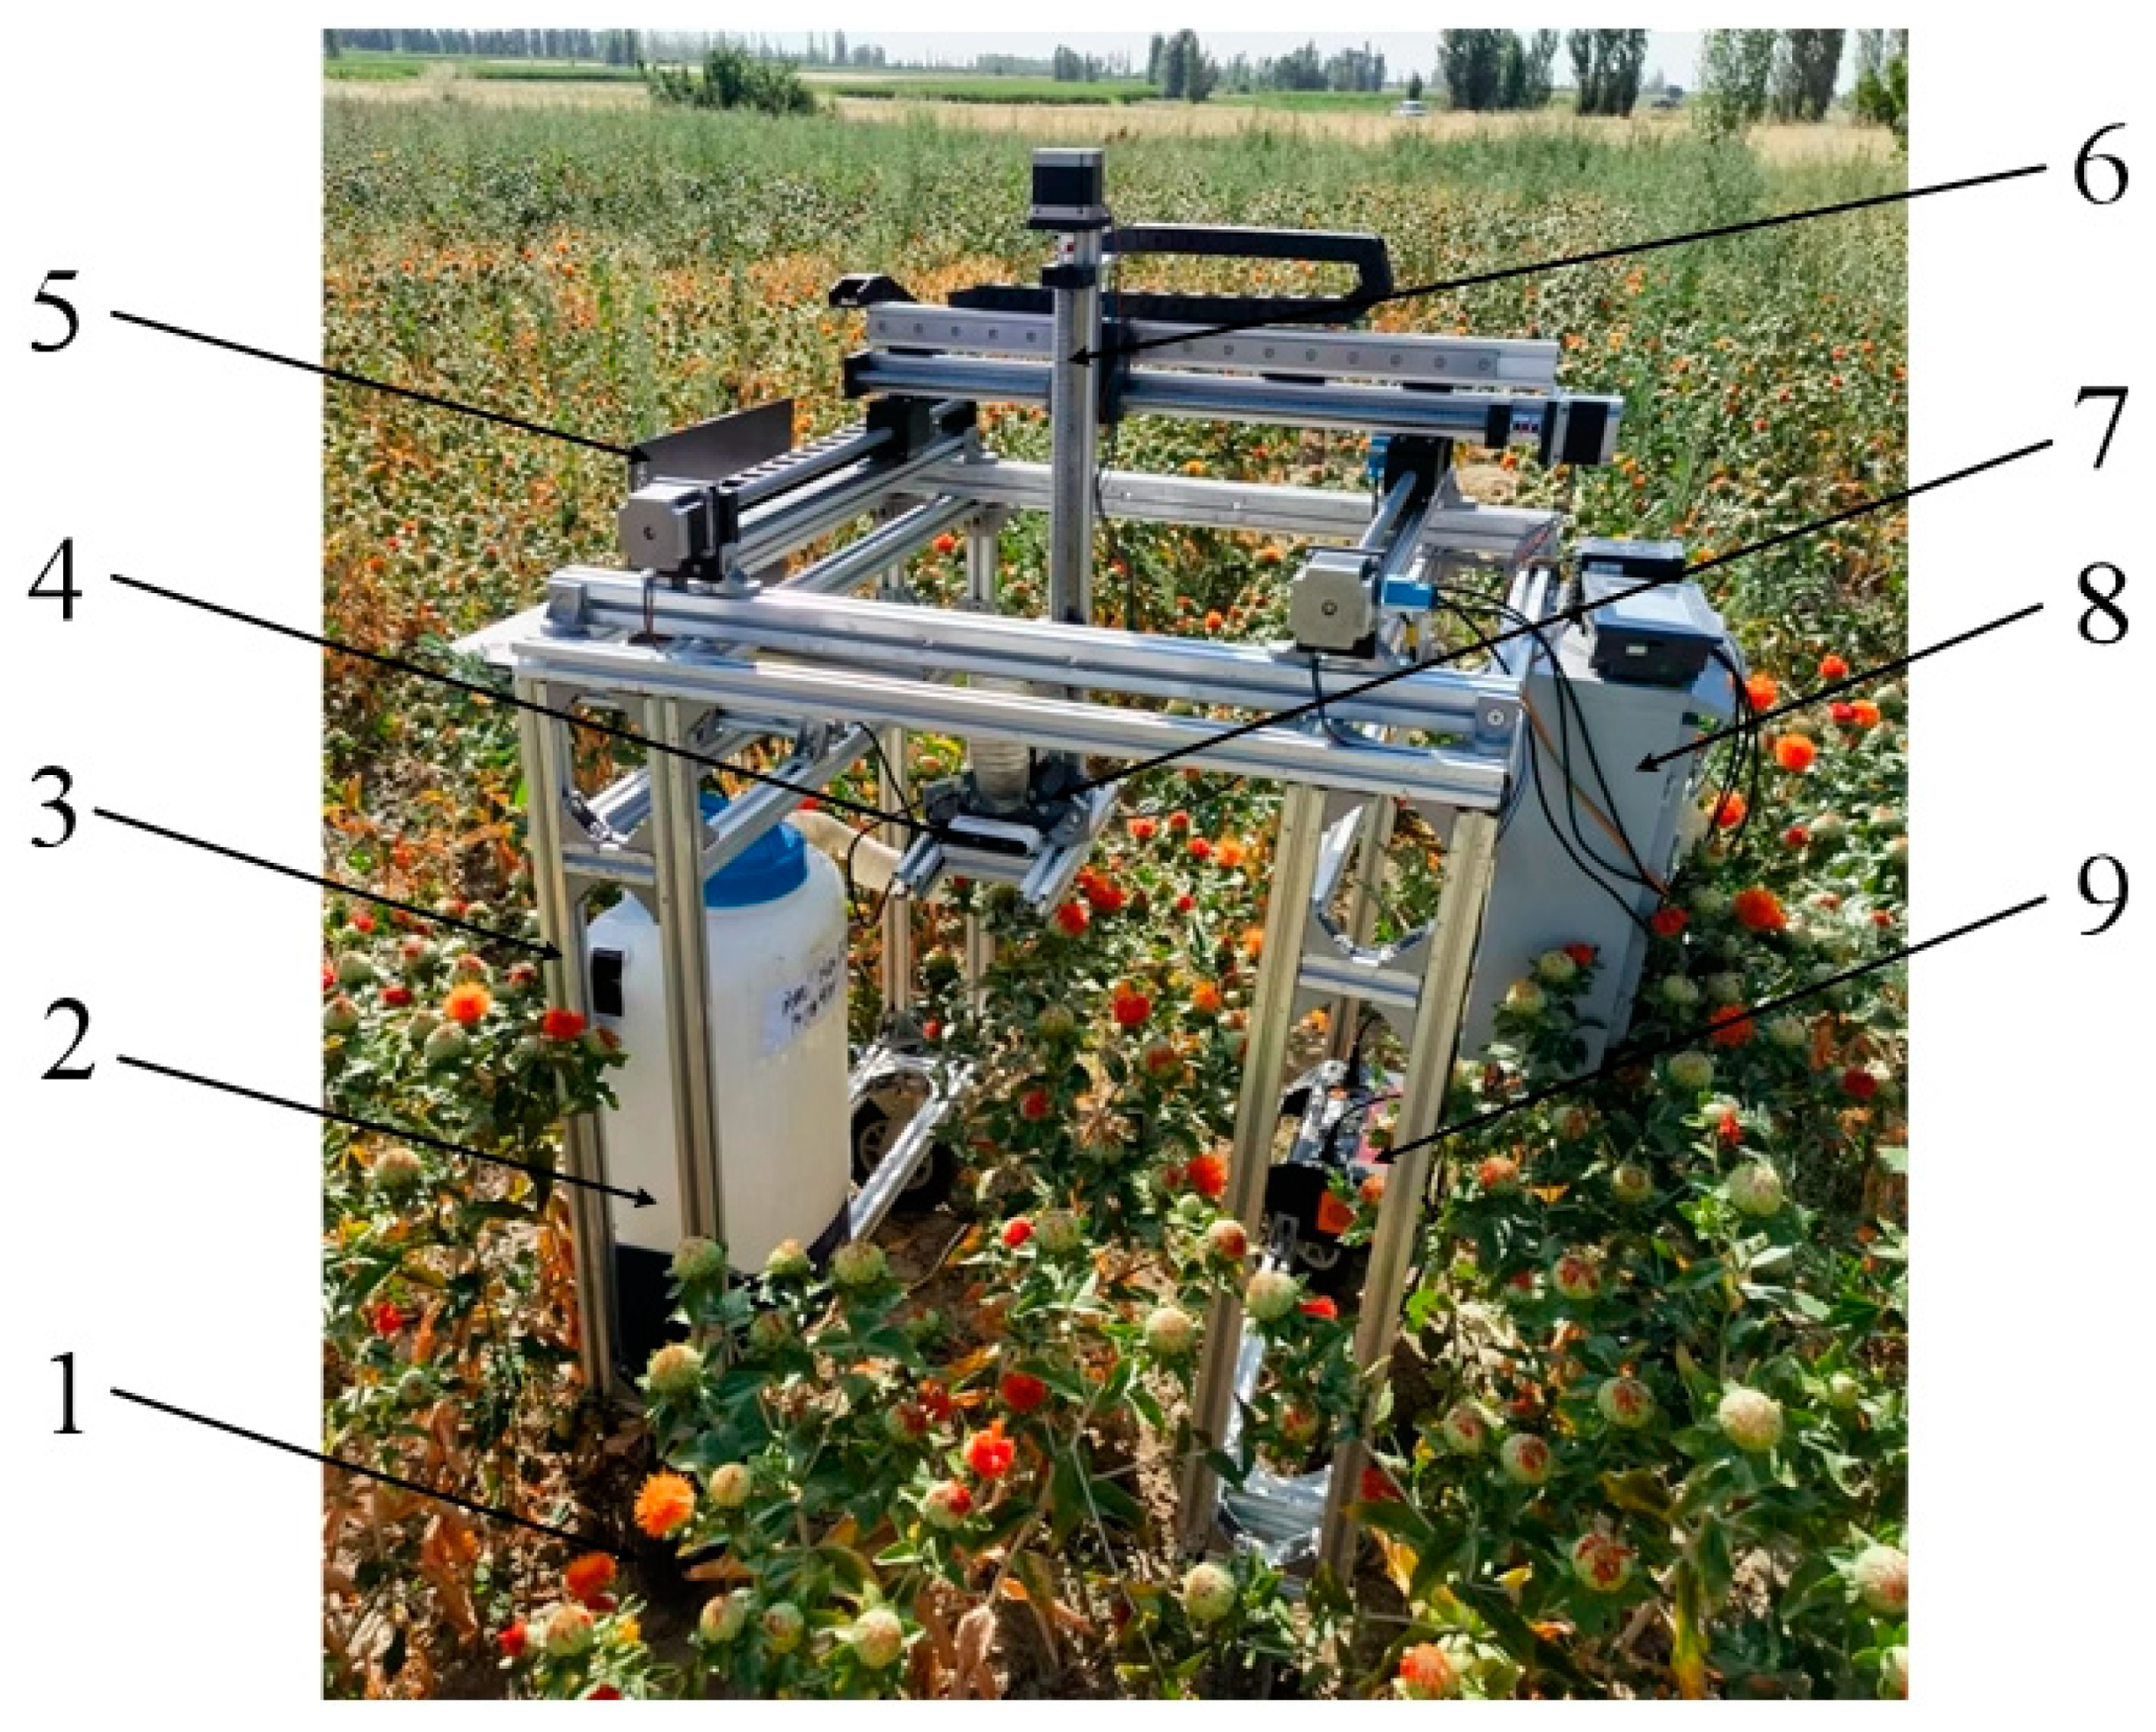
2.1. The Overall Structure of a Safflower-Picking Robot
The safflower-picking robot is mainly composed of a visual recognition system, a three-axis linear slide, an electronic control box, an end-effector, a calculator, and a machine frame. The overall structure is shown in Figure 1. The safflower-picking robot moves at a speed of 0.2 m/s in the field. The vision system uses an Intel Realsense D435i RGB-D (Intel Corporation, Attn: Corp. Quality, 2200Mission College Blvd, Santa Clara, CA, USA) depth camera to capture the safflower image and obtain the positional information of the safflower filaments. The controller drives the end-effector to move to the picking position based on the obtained filament information.
Figure 1.
The overall structure of the safflower-picking robot. 1. Walking device; 2. collecting box; 3. machine frame; 4. visual recognition system; 5. calculator; 6. three-axis linear slide; 7. end-effector; 8. electronic control box; 9. mobile power.
2.2. Image Acquisition
The safflower images were obtained from a safflower plantation in Ili Kazakh Autonomous Prefecture, China. The shooting equipment was the Intel Realsense D435i RGB-D depth camera and Canon E700D camera, during the actual safflower filament opening period from 15 July 2023 to 27 July 2023. The planting pattern is standardized to 50 cm spacing between rows of safflower and 20 cm spacing between plants per row of safflower. The image acquisition process simulates the natural environments of the safflower-picking robot during field operations, capturing images of different weather, light, and shade conditions. The shooting process constantly changes the shooting angle and distance to improve the diversity of the data. The original image format was JPG. To meet the requirements of model training on the scale and diversity of the dataset, the data expansion method was used to process the image in the safflower filament dataset. Expansion methods mainly include random scaling, flip transformation, and color dithering. The total amount of the expanded safflower filament dataset reaches 4500 images. The number of images under sunny, cloudy, and overcast conditions was 2260, 1083, and 1167, respectively. The number of images under sunlight and backlight conditions was 1272 and 988, respectively. The number of images under dense occlusion and branch and leaf occlusion was 903 and 1197, respectively. Some representative images are shown in Figure 2.
Figure 2.
Examples of safflower images under natural environments: (a) sunny day; (b) cloudy day; (c) overcast day; (d) sunlight; (e) backlight; (f) branch and leaf occlusion; and (g) dense occlusion.
2.3. Construct of Safflower Image Dataset
The obtained 4500 images were manually labeled with the safflower filaments in the images using the LabelImg in PASCAL VOC (LabelImg 1.8.1) annotation format. According to the morphology and color of the safflower filaments in different growth periods, the filaments were classified into two categories: the opening period and the flower-shedding period [23]. The smallest outer rectangle of the filaments was used as the ground-truth box when labeling.
According to the ratio of 7:2:1, the safflower image dataset was randomly shuffled and divided into training sets, validation sets, and test sets, respectively. The training sets and validation sets were used for improved Faster R-CNN training and evaluation. The test sets were used to evaluate the improved Faster R-CNN detection effect on safflower filaments.
3. Methods
3.1. Faster R-CNN Network
Faster R-CNN is a two-stage target detection network. It has a low recognition error rate and a low omission rate [24]. YOLO and SSD are one-stage target detection networks. These network models are characterized by rapidity, but the accuracy is slightly lower compared to two-stage target detection networks [25]. Therefore, the Faster R-CNN network model is selected to achieve the detection of filaments. The Faster R-CNN model mainly consists of the main feature extraction network, region proposal network (RPN), region of interest (ROI Pooling), and classification and regression.
Faster R-CNN extracts features from the image using the feature extraction network VGG16 and obtains the feature map. The feature map is input to the RPN network. The RPN network generates 9 anchor boxes of different sizes and maps the anchor boxes to the feature map. A certain number of anchors are selected using a set threshold and regression correction is performed on the selected anchors to obtain the target prediction boxes. The ROI Pooling module performs maximum pooling on the target prediction boxes and adjusts it to a fixed size. The target prediction box of fixed size is fed into the fully connected layer and softmax classifier to obtain the prediction box position and classification confidence [26,27].
3.2. Improved Faster R-CNN
Because of the small size and large number of safflower filaments, the detection is easily affected by weather, illumination, and occlusion in natural environments. To address the problem that it was difficult to detect small-sized safflower filaments with Faster R-CNN, a Faster R-CNN-S101 network model for small-sized safflower filament detection was proposed in natural environments.
Faster R-CNN-S101 used ResNest-101 as the backbone feature extraction network. The Split Attention module in ResNest-101 was used to distribute information across feature map groups to improve feature extraction for small-sized safflower filaments. ROI Align was used to improve ROI Pooling to reduce the feature quantization error and to more accurately portray the target bounding box. The PAM clustering algorithm was used to optimize the scale and number of the initial prediction boxes of the network. The accuracy detection of the model for small-sized filaments was improved. The structure of the Faster R-CNN-S101 model is shown in Figure 3.
Figure 3.
Faster R-CNN-S101 network structure diagram.
3.2.1. Backbone of Faster R-CNN-S101 Model
To improve the ability of the model to extract the feature information of safflower filaments in natural environments, ResNeSt-101 was used as the backbone network for extracting the image features in Faster R-CNN. Zhang [28] used ResNeSt to compare with the other neural networks in target detection, resulting in the highest accuracy rate of ResNeSt. ResNeSt was a ResNet variant network structure incorporating a distractor attention mechanism. In ResNeSt Block, the input safflower filament image was divided into k cardinals based on the channel dimension. Meanwhile, each cardinal was split into r subgroups. Each subgroup was subjected to a 1 × 1 + 3 × 3 convolution operation. Then, the split attention operation was performed on the r subgroups. Global average pooling was applied to obtain the weights of each cardinal. The introduction of the split attention mechanism allowed the network to extract more comprehensive and accurate feature information through the attention mechanism and fusion of multiple sets of features. The network structure of ResNeSt-101 is shown in Figure 4.
Figure 4.
Network structure of (a) ResNeSt block; (b) ResNeSt-101; (c) split attention.
3.2.2. Optimizing the Size of Anchor Boxes
The dataset of safflower filaments was passed through a feature extraction network for feature extraction. The resulting feature map was fed into the RPN network. The RPN network selected a 3 × 3 convolutional kernel as a sliding window for feature map traversal work. The sliding window slides to each position. The center of the region at this location consisted of nine anchor boxes in three sizes (1282, 2562, 5122) and three aspect ratios (0.5, 1, 2) to obtain the candidate region [29].
The statistics of the dimensions of the filaments in the safflower image dataset are shown in Figure 5a. The horizontal and vertical coordinates were the width and height of the dimensions of the filaments, respectively. It can be seen that the width and height of the filaments are centrally distributed between 0 and 200 pixels. The aspect ratio of the filament can be obtained from the size of the filament. The statistical results are shown in Figure 5b. The aspect ratio of the filaments was mostly concentrated between 0.5 and 1.5. From the above data, there was a large difference between the size or aspect ratio of the filigree and the initial predicted box size generated in the Faster R-CNN network. Large anchor boxes tend to miss identifying small-sized safflower filaments in the image. To optimize the scale of the initial prediction boxes of the Faster-RCNN network, using the Partitioning Around Medoids (PAM) algorithm clustered the filament sizes according to the size and aspect ratio of the filaments. Each color represented a cluster, and there were 5 clusters in total. In addition, according to the clustering results, the optimized initial prediction boxes were obtained with sizes of 322, 752, 1282, 2002, and 3002, and aspect ratios of 0.7, 0.9, 1.2, and 1.5.
Figure 5.
Safflower filament statistics of (a) filament size; (b) aspect ratio.
3.2.3. ROI Align
There are two quantization processes for ROI Pooling in Faster R-CNN networks. Firstly, the boundaries of the safflower filament candidate boxes were quantized into integer coordinate values. Secondly, the coordinate values were pooled in the feature map to get the final fixed-size feature map. Feature deviation caused by rounding operation occurs after two quantizations. Due to the small-sized filaments, which correspond to fewer feature pixels, the feature deviation would appear as the disappearance of feature pixels, affecting the detection accuracy. Therefore, to address the bias problem caused by double quantization, drawing on the network design idea of Mask R-CNN [30], ROI Align was used to improve ROI Pooling in the network.
ROI Align traversed each feature extraction region and kept the floating point boundaries unquantized. The feature extraction region was partitioned into k × k bins. The resulting boundary points were not quantized. Then, each bin was divided into 4 mini bins. The pixel value at the center of 4 mini bins was calculated using the bilinear interpolation algorithm. Meanwhile, the maximum of these 4 eigenvalues was taken as the eigenvalue of the bin. Finally, k × k eigenvalues were obtained. The result of the ROI Align feature map did not have the situation of ROI Pooling feature bias, which was more in line with the needs of the detection of safflower filaments.
4. Network Training
4.1. Training Platform
The computer system was Windows 10, with an Intel Core(TM) i9-13900KF CPU @ 3.0 GHz as the processor model and GeForce GTX4070 as the graphics card. The framework for deep learning was PyTorch 1.7.1. The programming platform was Visual Studio Code, and the programming language was Python 3.7. The trained procedure used NVIDIA CUDA 11.0. The CUDNN V8.0.5.39 was selected as a deep neural network acceleration library.
4.2. Evaluation Indicators of the Network Model
The Precision rate (P), the Recall rate (R), the F1 score, the Average Precision (AP), and the mean Average Precision (mAP) were chosen as the metrics of filament recognition precision [31,32]. The F1 score is the reconciled mean of precision and recall. AP is the area formed by the precision–recall curve and the coordinate axis. The mAP is the average value of the AP for different categories. The evaluation indicator is calculated as [33]:
where TP represents the number of correctly detected safflower filaments; FP represents the number of incorrectly detected safflower filaments; FN represents the number of missed safflower filaments; P represents the ratio of correctly detected safflower filaments to all prediction boxes, %; R represents the ratio of correctly detected safflower filaments to all safflower filaments, %; F1 represents the reconciled average of the precision rate and the recall rate; AP represents the mean precision value of the same type of safflower filaments, %; and mAP represents the mean value of the average precision of the filaments during the opening period and the flower-shedding period, %.
5. Results and Discussion
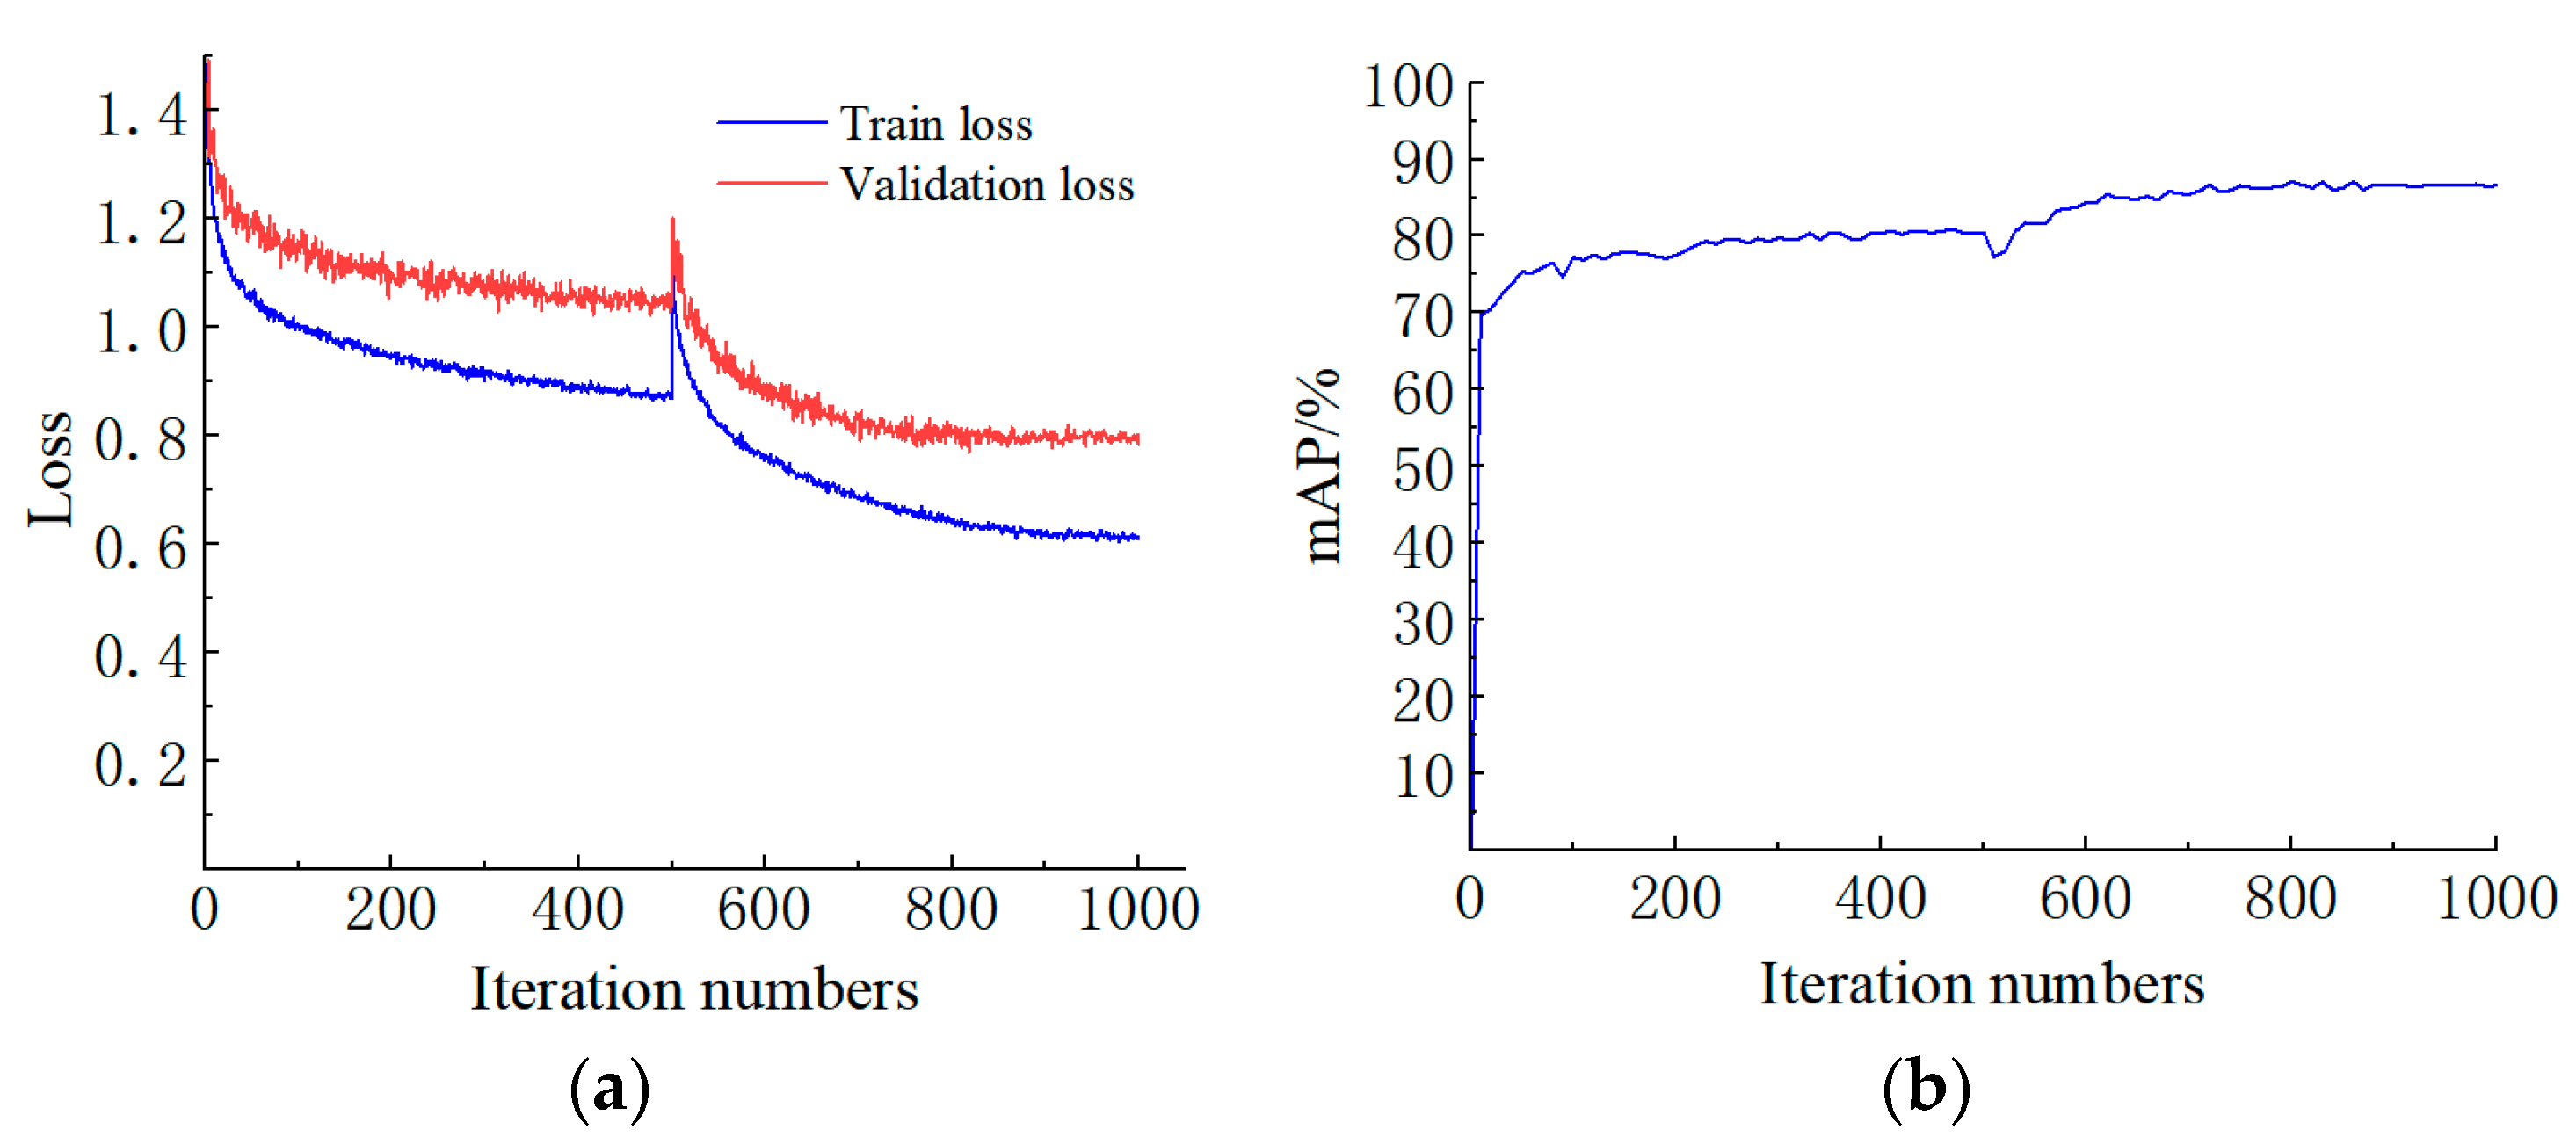
5.1. Training Results
The Faster R-CNN-S101 was trained for 1000 epochs. To accelerate the training speed and prevent the weights from being corrupted, the first 500 epochs were trained by freezing and the initial learning rate was 0.001. The last 500 epochs were trained using unfreezing with a learning rate of 0.0001. The feature extraction network was unfrozen to continuously optimize the training parameters. The training process used the adaptive moment estimation (Adam) optimization model to improve the model. The momentum factor was set to 0.9. The weights file was saved after every five epochs of training. The weights file with the highest accuracy was finally saved and displayed for safflower filament prediction.
The Faster R-CNN-S101 training results are shown in Figure 6. The loss value was used to check the training effect, and mAP was used to evaluate the detection accuracy mean of the model. The curve of loss value oscillated at 500 iterations due to the change in the training method. As the number of iterations increased, the loss value gradually stabilized around 0.61. The mAP was 89.14%.
Figure 6.
Training results of (a) loss curve; (b) mAP.
5.2. Comparison of Other Object Detection Models
To evaluate the effectiveness of the Faster R-CNN-S101 network for safflower filament detection, under the same conditions, the YOLOv3 [34], YOLOv4 [35], YOLOv5 [36], YOLOv6 [37], Faster R-CNN [38], and Faster R-CNN-S101 detection models were trained using the safflower filament training set. The safflower filament test set was used to evaluate the detection effect of the above six detection models. The performance comparisons between these six detection models are listed in Table 1.
Table 1.
Performance of six target detection models.
To evaluate the performance of the Faster R-CNN-S101 model, we report quantitative comparison results, as shown in Table 1. Faster R-CNN-S101 had a precision of 86.75%, a recall of 92.19%, an AP of 93.19% in the opening period, an AP of 89.93% in the flower-shedding period, and a mAP of 91.49%. All values of Faster R-CNN-S101 were higher than those of YOLOv3, YOLOv4, YOLOv5, and Faster R-CNN, where the mAP was improved by 2.49%, 5.95%, 3.56%, and 9.52%, respectively. The results showed that the overall improvement of Faster R-CNN-S101 could better detect small-sized safflower filaments and increase the mAP of detection. Compared with YOLOv6, Faster R-CNN-S101 showed a lower detection precision by 0.37%, but a higher recall by 7.56%, a higher AP by 3.57% in the opening period, a higher AP by 0.02% in the flower-shedding period, and a higher mAP by 1.47%. Especially, the recall rate and the AP of filaments in the blooming period were improved significantly. This showed that Faster R-CNN-S101 could extract richer feature information, distinguish filaments from branches, leaves, and background areas, and reduce false and missed detections.
The results showed that the Faster R-CNN-S101 model’s values of recall, AP, and mAP were significantly higher than other models. The Faster R-CNN-S101 model was better than other models in small-sized safflower filaments detection, with excellent comprehensive detection performance.
5.3. Ablation Experiment
To address the problem of detecting safflower filaments with small sizes, the Faster R-CNN model was improved in this paper. An improved Faster R-CNN model was proposed with ResNeSt-101 as a backbone network, optimized anchor box size, and feature mapping using ROI Align. Four sets of ablation tests were performed separately for validation. The ablation test results are shown in Table 2.
Table 2.
Comparison of performance of ablation tests.
Experiment Ⅰ was the original Faster R-CNN model. The mAP for safflower filaments detection was 81.97%; experiment Ⅱ used ResNeSt-101 as the backbone network. The mAP was improved by 5.7% compared with the original network. This indicated that ResNeSt-101 could effectively enhance the feature extraction ability for small-sized safflower filaments and improve the recognition accuracy of the network for safflower filaments. Experiment III used ROI Align to replace ROI Pooling for feature mapping, and the model’s mAP was improved by 2.4% compared with the ROI Pooling network. The results showed that ROI Align could reduce the feature quantification error of ROI Pooling using the bilinear interpolation calculation method. The accuracy of safflower filament detection was also improved. Experiment IV optimized the anchor box size and improved the mAP of the network model by 1.42%. This indicated that optimizing the anchor box size was a way to improve the detection accuracy of small-sized safflower filaments. The mAP of the Faster R-CNN-S101 model was improved by 9.52% compared with the Faster R-CNN model. This fully demonstrated that using ResNeSt-101 as the backbone network, using ROI Align instead of ROI Pooling, and optimizing the anchor box size could improve the network performance.
5.4. Confidence Test
Five groups of images containing different numbers of safflower filaments were selected to test the Faster R-CNN and Faster R-CNN-S101 models. The comparison of confidence quantities is shown in Table 3. The typical detection results of group 2 in Table 3 are shown in Figure 7.
Table 3.
Comparison of confidence quantities in five groups.
Figure 7.
Comparison of confidence for (a) Faster R-CNN; (b) Faster R-CNN-S101.
The confidence test results are displayed in Table 3. The Faster R-CNN-S101 model correctly detects the number of 9, 10, 13, 13, and 17. The Faster R-CNN model correctly detects the number of 9, 8, 11, 10, and 14. As shown in Figure 6, the missed and misdirected areas are marked with yellow arrows in the figure. The confidence level of the safflower filaments was mostly above 0.9. The Faster R-CNN-S101 model had higher confidence than the Faster R-CNN model in the corresponding detection boxes and detected a larger number of safflower filaments. The reason was that the Faster R-CNN-S101 model could extract richer feature information and had a more fitting predictive anchor box scale, which enabled the feature map to obtain better detection results. Therefore, the Faster R-CNN-S101 model enhances the confidence level of the detected safflower filaments with better detection ability.
5.5. Safflower Image Test for Detection in Natural Environments
To verify the adaptability and effectiveness of the Faster R-CNN-S101 model in natural environments, the classification of natural scenes according to different weather, lighting, and occlusion conditions and the detection of safflower images in different scenes under the same experimental conditions were carried out. The detection data under different scenes are listed in Table 4 as a means of evaluating each performance of the Faster R-CNN-S101 model.
Table 4.
Detection accuracy of models in different scenarios.
5.5.1. Effect of Detection in Different Weather Conditions
The precision of the Faster R-CNN-S101 model in detecting safflower filaments under sunny, cloudy, and overcast weather was 89.75%, 89.58%, and 89.61%, respectively. The Faster R-CNN-S101 detection results were higher than the Faster R-CNN model by 10.91%, 10.72%, and 10.63%, respectively. The mAP was 91.62%, 91.48%, and 91.56%, which was 9.7%, 9.67%, and 9.68% higher than that of the Faster R-CNN model. The detection effect is shown in Figure 8. Missed and misdetected safflower filaments were marked with arrows in the Faster R-CNN-S101 detection. Due to changes in the weather, the light intensity was changed. The color and texture features of filaments were altered by weak light intensity on cloudy days, resulting in the similarity of filament features to the soil background color. It was difficult to extract filament features. Because of the uneven illumination in cloudy weather, the color and texture features of safflower filaments were unevenly expressed. It was easy to cause misdetection and omission. The Faster R-CNN-S101 used ResNet101 as a feature extraction network. The split attention module was introduced to enhance feature extraction while weakening background interference through the attention mechanism and multiple feature fusion. Therefore, the Faster R-CNN-S101 model could be better applied to the detection of safflower filaments under different weather conditions.
Figure 8.
Recognition results under different weather conditions: (a) sunny day; (b) cloudy day; (c) overcast day.
5.5.2. Effect of Detection in Different Illumination Conditions
The precision of the Faster R-CNN-S101 model was 89.68% and 89.65% in sunlight and backlight. The Faster R-CNN-S101 detection results were higher than the Faster R-CNN model by 10.37% and 10.5%, respectively. The mAP was 91.69% and 91.66%, which was 9.64% and 9.76% higher than that of the Faster R-CNN model. The detection effect is shown in Figure 9. Missed and misdetected safflower filaments were marked with arrows in the Faster R-CNN-S101 detection. Because of the uneven illumination under the backlight, the safflower filaments became dark and unclear, resulting in blurred filament color and texture, and the features were difficult to extract. The filaments of the opening period were similar to the yellowed leaves which were easily misdetected. The results showed that the Faster R-CNN-S101 model could more accurately detect safflower filaments under different illumination intensities with high confidence.

Figure 9.
Recognition results under different illumination conditions: (a) sunlight; (b) backlight.
5.5.3. Effect of Detection in Different Occlusion Conditions
The precision of the Faster R-CNN-S101 model in detecting safflower filaments under the conditions of branch and leaf occlusion and dense occlusion was 89.59% and 89.64%, respectively. The Faster R-CNN-S101 detection results were higher than the Faster R-CNN model by 10.28% and 10.4%, respectively. The mAP was 91.53% and 91.50%, respectively, which was 9.91% and 10.02% higher than the Faster R-CNN model. The detection effect is shown in Figure 10. Missed and misdetected safflower filaments were marked with arrows in the Faster R-CNN-S101 detection. Because of the dense planting pattern, branches and leaves could shade some of the safflower filament features, resulting in the display of insufficient features for the model to make correct detection. There were more missed detections. Faster R-CNN detection maps showed significantly more misdetections and omissions than Faster R-CNN-S101. Comprehensively, the Faster R-CNN-S101 model had better anti-interference ability and feature extraction ability. The detection effect was better than that of the Faster R-CNN model.
Figure 10.
Recognition results under different occlusion conditions: (a) branch and leaf occlusion; (b) dense occlusion.
6. Conclusions and Future Work
To address the difficulty of accurately recognizing small-sized safflower filaments in natural environments, an improved Faster R-CNN model for filaments detection was proposed. ResNeSt-101 was used as the backbone network to improve the feature extraction ability for small-sized safflower filaments. According to the size of safflower filaments, the anchor box sizes were optimized using the PAM clustering algorithm to improve detection. The feature map was aligned using ROI Align to reduce feature quantization errors and improve the recognition accuracy of the model in the original detection boxes. The test results showed that the Faster R-CNN-S101 model detects safflower filaments with an accuracy of 89.94%. The AP of safflower filament detection was 93.19% and 89.93% in the opening and flower-shedding periods, respectively. The mAP was 91.49%. Compared with Faster R-CNN, YOLOv3, YOLOv4, YOLOv5, and YOLOv6, the Faster R-CNN-S101 model had a higher mAP by 9.52%, 2.49%, 5.95%, 3.56%, and 1.47%, respectively. Moreover, Faster R-CNN-S101 can better recognize safflower filaments under different weather, light, and shading conditions. Overall, the proposed method for safflower filament detection can obtain a better mAP, and has better robustness.
In the next steps of this research, more types of safflower images will be collected to increase the diversity of the dataset. Meanwhile, the Faster R-CNN model will be improved and optimized according to the detection tasks in other scenes, leading to the expansion of the Faster R-CNN-S101 model. In addition, there is a gap between the Faster R-CNN-S101 model and the one-stage object detection model in terms of detection speed. The above issues will continue to be researched and explored in future research work.
Author Contributions
Conceptualization, Z.Z., R.S. and Z.X.; methodology, R.S. and Z.X.; software, R.S.; validation, Q.G. and C.Z.; formal analysis, Z.Z.; investigation, R.S.; resources, Z.X.; data curation, R.S.; writing—original draft preparation, R.S.; writing—review and editing, Z.Z., R.S. and Z.X.; visualization, R.S.; supervision, Z.Z.; project administration, R.S. All authors have read and agreed to the published version of the manuscript.
Funding
This research was funded by the National Natural Science Foundation of China under Grant 52265041 and 31901417, and in part by Open Subjects of Zhejiang Provincial Key Laboratory for Agricultural Intelligent Equipment and Robotics, China, under Grant 2022ZJZD2202.
Data Availability Statement
All new research data were presented in this contribution.
Conflicts of Interest
The authors declare no conflict of interest.
References
- Zhang, H.; Ge, Y.; Sun, C.; Zeng, H.F.; Liu, N. Picking path planning method of dual rollers type safflower picking robot based on improved ant colony algorithm. Processes 2022, 10, 1213. [Google Scholar] [CrossRef]
- Guo, H.; Luo, D.; Gao, G.M.; Wu, T.L.; Diao, H.W. Design and experiment of a safflower picking robot based on a parallel manipulator. Eng. Agric. 2022, 42, e20210129. [Google Scholar] [CrossRef]
- Barreda, V.D.; Palazzesi, L.; Tellería, M.C.; Olivero, E.B.; Raine, J.I.; Forest, F. Early evolution of the angiosperm clade Asteraceae in the Cretaceous of Antarctica. Proc. Natl. Acad. Sci. USA 2015, 112, 10989–10994. [Google Scholar] [CrossRef]
- Ma, Q.; Ruan, Y.Y.; Xu, H.; Shi, X.M.; Wang, Z.X.; Hu, Y.L. Safflower yellow reduces lipid peroxidation, neuropathology, tau phosphorylation and ameliorates amyloid β-induced impairment of learning and memory in rats. Biomed. Pharmacother. 2015, 76, 153–164. [Google Scholar] [CrossRef] [PubMed]
- Zhang, Z.G.; Guo, J.X.; Yang, S.P. Feasibility of high-precision numerical simulation technology for improving the harvesting mechanization level of safflower filaments: A Review. Int. Agric. Eng. J. 2019, 29, 139–150. [Google Scholar]
- Zhang, Z.G.; Zhao, M.Y.; Xing, Z.Y.; Liu, X.F. Design and test of double-acting opposite direction cutting end effector for safflower harvester. Trans. Chin. Soc. Agric. Mach. 2022, 53, 160–170. [Google Scholar] [CrossRef]
- Thorp, K.R.; Dierig, D.A. Color image segmentation approach to monitor flowering in lesquerella. Ind. Crops Prod. 2011, 34, 1150–1159. [Google Scholar] [CrossRef]
- Saddik, A.; Latif, R.; El Ouardi, A. Low-Power FPGA Architecture Based Monitoring Applications in Precision Agriculture. J. Low Power Electron. Appl. 2021, 11, 39. [Google Scholar] [CrossRef]
- Chen, Z.; Su, R.; Wang, Y.; Chen, G.; Wang, Z.; Yin, P.; Wang, J. Automatic Estimation of Apple Orchard Blooming Levels Using the Improved YOLOv5. Agronomy 2022, 12, 2483. [Google Scholar] [CrossRef]
- Saddik, A.; Latif, R.; Taher, F.; El Ouardi, A.; Elhoseny, M. Mapping Agricultural Soil in Greenhouse Using an Autonomous Low-Cost Robot and Precise Monitoring. Sustainability 2022, 14, 15539. [Google Scholar] [CrossRef]
- Tang, Y.; Chen, M.; Wang, C.; Luo, L.; Li, J.; Lian, G.; Zou, X. Recognition and localization methods for vision-based fruit picking robots: A review. Front. Plant Sci. 2020, 11, 510. [Google Scholar] [CrossRef]
- Li, Y.; He, L.; Jia, J.; Lv, J.; Chen, J. In-field tea shoot detection and 3D localization using an RGB-D camera. Comput. Electron. Agric. 2021, 185, 106149. [Google Scholar] [CrossRef]
- Parvathi, S.; Selvi, S.T. Detection of maturity stages of coconuts in complex background using Faster R-CNN model. Biosyst Eng. 2021, 202, 119–132. [Google Scholar] [CrossRef]
- Jia, W.; Tian, Y.; Luo, R.; Zhang, Z.; Lian, J.; Zheng, Y. Detection and segmentation of overlapped fruits based on optimized Mask R-CNN application in apple harvesting robot. Comput. Electron. Agric. 2020, 172, 105380. [Google Scholar] [CrossRef]
- Dias, P.; Tabb, A.; Medeiros, H. Apple flower detection using deep convolutional networks. Comput. Ind. 2018, 99, 17–28. [Google Scholar] [CrossRef]
- Farjon, G.; Krikeb, O.; Hillel, A.B.; Alchanatis, V. Detection and counting of flowers on apple trees for better chemical thinning decisions. Precis. Agric. 2020, 21, 503–521. [Google Scholar] [CrossRef]
- Gogul, I.; Kumar, V.S. Flower species recognition system using convolution neural networks and transfer learning. In Proceedings of the 2017 Fourth International Conference on Signal Processing, Communication and Networking (ICSCN), Chennai, India, 16–18 March 2017; pp. 1–6. [Google Scholar] [CrossRef]
- Sun, K.; Wang, X.; Liu, S.; Liu, C. Apple, peach, and pear flower detection using semantic segmentation network and shape constraint level set. Comput. Electron. Agric. 2021, 185, 106150. [Google Scholar] [CrossRef]
- Zhao, C.J.; Wen, C.W.; Lin, S.; Guo, W.Z.; Long, J.H. Tomato florescence recognition and detection method based on cascaded neural network. Trans. Chin. Soc. Agric. Eng. 2020, 36, 143–152. [Google Scholar] [CrossRef]
- Xia, H.M.; Zhao, K.D.; Jiang, L.H.; Liu, Y.J.; Zhen, W.B. Flower bud detection model for hydroponic Chinese kale based on the fusion of attention mechanism and multi-scale feature. Trans. Chin. Soc. Agric. Eng. 2021, 37, 161–168. [Google Scholar] [CrossRef]
- Li, Z.; Li, Y.; Yang, Y.; Guo, R.; Yang, J.; Yue, J.; Wang, Y. A high-precision detection method of hydroponic lettuce seedlings status based on improved Faster RCNN. Comput. Electron. Agric. 2021, 182, 106054. [Google Scholar] [CrossRef]
- Nguyen, N.D.; Do, T.; Ngo, T.D.; Le, D.D. An evaluation of deep learning methods for small object detection. J. Electr. Comput. Eng. 2020, 2020, 3189691. [Google Scholar] [CrossRef]
- Cao, W.B.; Yang, S.P.; Li, S.F.; Jiao, H.B.; Lian, G.D.; Niu, C.; An, L.L. Parameter optimization of height limiting device for comb-type safflower harvesting machine. Trans. Chin. Soc. Agric. Eng. 2019, 35, 48–56. [Google Scholar] [CrossRef]
- Zhao, S.; Liu, J.; Wu, S. Multiple disease detection method for greenhouse-cultivated strawberry based on multiscale feature fusion Faster R-CNN. Comput. Electron. Agric. 2022, 199, 107176. [Google Scholar] [CrossRef]
- Parico, A.I.B.; Ahamed, T. An Aerial Weed Detection System for Green Onion Crops Using the You Only Look Once (YOLOv3) Deep Learning Algorithm. Eng. Agric. Environ. 2020, 13, 42–48. [Google Scholar] [CrossRef] [PubMed]
- Mu, Y.; Feng, R.; Ni, R.; Li, J.; Luo, T.; Liu, T.; Li, X.; Gong, H.; Guo, Y.; Sun, Y.; et al. A Faster R-CNN-Based Model for theIdentification of Weed Seedling. Agronomy 2022, 12, 2867. [Google Scholar] [CrossRef]
- Song, P.; Chen, K.; Zhu, L.; Yang, M.; Ji, C.; Xiao, A.; Jia, H.Y.; Zhang, J.; Yang, W. An improved cascade R-CNN and RGB-D camera-based method for dynamic cotton top bud recognition and localization in the field. Comput. Electron. Agric. 2022, 202, 107442. [Google Scholar] [CrossRef]
- Zhang, H.; Wu, C.; Zhang, Z.; Zhu, Y.; Lin, H.; Zhang, Z.; Sun, Y.; He, T.; Mueller, J.; Manmatha, R.; et al. Resnest: Split-attention networks. In Proceedings of the IEEE/CVF Conference on Computer Vision and Pattern Recognition, New Orleans, LA, USA, 18–24 June 2022; pp. 2736–2746. [Google Scholar]
- Noon, S.K.; Amjad, M.; Qureshi, M.A.; Mannan, A. Use of deep learning techniques for identification of plant leaf stresses: A review. Sustain. Comput. Inform. Syst. 2020, 28, 100443. [Google Scholar] [CrossRef]
- He, K.; Gkioxari, G.; Dollár, P.; Girshick, R. Mask r-cnn. In Proceedings of the IEEE International Conference on Computer Vision (ICCV), Venice, Italy, 22–29 October 2017; pp. 2961–2969. [Google Scholar]
- Teimouri, N.; Jørgensen, R.N.; Green, O. Novel Assessment of Region-Based CNNs for Detecting Monocot/Dicot Weeds in Dense Field Environments. Agronomy 2022, 12, 1167. [Google Scholar] [CrossRef]
- Saddik, A.; Latif, R.; El Ouardi, A.; Alghamdi, M.I.; Elhoseny, M. Improving Sustainable Vegetation Indices Processing on Low-Cost Architectures. Sustainability 2022, 14, 2521. [Google Scholar] [CrossRef]
- Hu, G.; Wei, K.; Zhang, Y.; Bao, W.; Liang, D. Estimation of tea leaf blight severity in natural scene images. Precis. Agric. 2021, 22, 1239–1262. [Google Scholar] [CrossRef]
- Redmon, J.; Farhadi, A. Yolov3: An incremental improvement. arXiv 2018, arXiv:1804.02767. [Google Scholar] [CrossRef]
- Bochkovskiy, A.; Wang, C.Y.; Liao, H.Y.M. Yolov4: Optimal speed and accuracy of object detection. arXiv 2020, arXiv:2004.10934. [Google Scholar] [CrossRef]
- Wang, Z.; Jin, L.; Wang, S.; Xu, H. Apple stem/calyx real-time recognition using YOLO-v5 algorithm for fruit automatic loading system. Postharvest Biol. Technol. 2022, 185, 111808. [Google Scholar] [CrossRef]
- Li, C.; Li, L.; Jiang, H.; Weng, K.; Geng, Y.; Li, L.; Ke, Z.; Li, Q.; Cheng, M.; Wei, X. YOLOv6: A single-stage object detection framework for industrial applications. arXiv 2022, arXiv:2209.02976. [Google Scholar] [CrossRef]
- Ren, S.; He, K.; Girshick, R.; Sun, J. Faster r-cnn: Towards real-time object detection with region proposal networks. Adv. Neural Inf. Process. Syst. 2015, 28, 1137–1149. [Google Scholar] [CrossRef] [PubMed]
Disclaimer/Publisher’s Note: The statements, opinions and data contained in all publications are solely those of the individual author(s) and contributor(s) and not of MDPI and/or the editor(s). MDPI and/or the editor(s) disclaim responsibility for any injury to people or property resulting from any ideas, methods, instructions or products referred to in the content. |
© 2023 by the authors. Licensee MDPI, Basel, Switzerland. This article is an open access article distributed under the terms and conditions of the Creative Commons Attribution (CC BY) license (https://creativecommons.org/licenses/by/4.0/).