Abstract
Physalis macrophysa (PMA) and Physalis ixocarpa (PIX) have significant economic, medicinal, and ornamental value and are often used in the fields of edible fruits, medicinal herbs, and ornamental plants. In the present study, we obtained the complete chloroplast (cp) genome sequences of PMA and PIX, compared to the cp genome sequences of 10 Physalis species, and constructed the phylogenetic tree among the tribe Physaleae. The results showed that the cp genomes of PMA and PIX consisted of a large single copy (LSC) region (87,115 bp and 87,103 bp, respectively), a small single copy (SSC) region (18,412 bp and 18,420 bp, respectively), and a pair of same-length inverted-repeat (IRa and IRb) regions (25,604 bp and 25,674 bp, respectively). The two species contained 132 genes, including 87 encoding proteins, eight encoding ribosomal RNAs (rRNAs), and 37 encoding transfer RNAs (tRNAs), which indicated that the two species have strong similarities with respect to genome structure and gene content. PMA and PIX contained repeat sequences (35 and 40, respectively) and simple-sequence repeats (SSRs) (61 and 60, respectively). Nine regions with considerable nucleotide divergence were found, most of which were located in the LSC and SSC regions. The gene selective pressure analysis indicated that eight genes were affected by positive selection, the Ka/Ks values of which were greater than one. Our phylogenetic results indicated that PMA and PIX had the closest genetic relationship and are closely adjacent to Physalis philadelphica (PPH) in the subtribe Physalinae. Our analysis of the cp genomes in both Physalis species will be beneficial for further research into species identification, phylogeny, evolution, and the potential for germplasm resource exploitation in Physalis.
1. Introduction
Physalis, one of the largest genera of the Solanacae, consist of approximately 90 species, most of which have important economic, medicinal, or ornamental value [1,2]. For example, PPH, PMA, PIX, Physalis pubescens (PPU), and Physalis peruviana (PPE) are widely cultivated for their edible fruits, whereas Physalis alkekengi var. franchetii (PAF), Physalis angulata (PAN), and Physalis minima (PMI) are often used in the treatment of certain disorders due to their excellent anti-inflammatory and anti-tumor activities and their ability to lower blood pressure [3,4,5,6]. At the same time, some species of Physalis are often cultivated as ornamental plants, because of their highly inflated calyces, similar in shape to Chinese lanterns [7], such as PAF and PMA.
The tribe Physaleae contains three subtribes, namely Iochrominae, Physalinae and Withaninae [8,9]. Compared with other tribes in the Solanacae, tribe Physaleae, containing Physalis, has greater genus-level diversity [1,8,9]. Traditionally, species in the Physaleae were classified on the basis of morphological characters [10]. However, the morphological characteristics of the tribe Physaleae members are relatively similar, which provides little information on the phylogenetic relationships among several genera of the tribe [1,9]. With respect to the tribe Physaleae, there is some debate about the genetic relationship between the genus Physalis and other genera [10,11]. In addition, species classification and genetic relationships within the genus Physalis are also the focus of research [1,12,13]. In the early stage of these studies, some conventional DNA markers, such as ribosomal DNA internal transcribed spacer (ITS) sequences [1,13,14], chloroplast DNA fragment data (ndhF, trnlF and psbA–trnH) [8,9,12], a few single-copy genes (waxy, etc.) [1,15], and simple sequence repeat (SSR) markers [15,16], were used to study species identification and the genetic relationship between Physalis and other related genera in the tribe Physaleae. However, the genetic information achieved by these methods was relatively limited, so it is difficult to fully and accurately clarify the genetic relationships among the genus Physalis and its relatives. Therefore, it is necessary to seek more reliable, effective, and abundant markers, etc. for subsequent research.
The chloroplast genome (cp genome) is found only in cells of plants and eukaryotic algae and plays important roles in carbon fixation and stress response. For most land plants, cp genomes have characteristic, highly conserved structures, being circular DNA molecules that consist of a large single copy (LSC) region, a small single copy (SSC) region and two inverted repeat (IRa and IRb) regions. Cp genome size varies from species to species, mainly ranging from 120 to 170 kb [17,18]. As sequencing technology has improved and the cost of sequencing has decreased (the first cp genomes were sequenced in 1986), more than 37,500 complete cp genome sequences have been released to the National Center for Biotechnology Information (NCBI) organelle genome database up to September 2022. Compared with nuclear genome sequences, most plant cp genomes contain highly conserved genome structures and gene content [19,20]. In addition, many studies have found that expansion, contraction, reversal, or gene rearrangement events occur in angiosperm cp genomes as a result of differences in rates of insertions/deletions (indels) and substitutions during plant evolution [21,22,23]. These results indicate that the cp genomes can provide significant quantities of genetic information which can be used for the identification of plant species, the development of DNA markers and the resolution of taxonomic and phylogenetic relationships at the chloroplast genome level [24,25,26,27]. By August 2022, the chloroplast genomes of only eight Physalis species, including PAN, PPU, PMI, PPH, PPE, Physalis chenopodiifolia (PCH), Physalis pruinosa (PPR), and PAF, had been sequenced and uploaded to the NCBI database, a figure which is inadequate as a Physalis chloroplast genome resource. In addition, there are no reports of phylogenetic analysis of the tribe Physaleae based on the cp genomes.
In this study, we selected two important Physalis species (PMA and PIX), with definite differences in morphological characters and different habitats, to expand valuable plastid genomic resources for the genus Physalis, and thence to investigate chloroplast genome variation in the genus. First, we sequenced, assembled, and annotated the complete chloroplast genomes of PMA and PIX, and characterized their genome structure, gene content, repeat sequences and other characteristics. Then, we compared the two genomes with eight previously reported Physalis chloroplast genomes and discussed the mechanism of expansion of the cp genomes of the Physalis genus. Ultimately, we analyzed the evolutionary dynamics and phylogenetic relationships through a comparative analysis with the chloroplast genomes of other species in the tribe Physaleae.
2. Materials and Methods
2.1. Sampling, DNA Extraction and Genome Sequencing
Fresh leaves were collected from PMA and PIX cultivated at Hangzhou Normal University, Zhejiang Province, China (30°17′27.77″ N, 120°0′39.47″ E). The voucher specimens of PMA and PIX were deposited at the Zhejiang Provincial Key Laboratory for Genetic Improvement and Quality Control of Medicinal Plants, Hangzhou Normal University, China (voucher specimens HZN19PHM and HZN19PHI, respectively).
The Plant Genomic DNA Extraction Kit (Shanghai Sangon Biological Engineering Technology and Service Co., Ltd., Shanghai, China) was used to extract total genomic DNA, according to the manufacturer’s protocol. The purified DNA was then fragmented by mechanical disruption using the sonication method. Then, the paired-end (PE) libraries were constructed using the whole-genome shotgun (WGS) strategy. Finally, the qualified libraries were sequenced using next-generation sequencing (NGS), based on the Illumina HiSeq Sequencing platform, according to the paired-end PE150 sequencing strategy. The sequencing work was conducted by Shanghai Personal Biotechnology Co., Ltd. (Shanghai, China).
2.2. Assembly and Annotation of the Cp Genome
The raw reads were filtered by Trimmomatic version 0.32 (http://www.usadellab.org/cms/index.php?page=trimmomatic; accessed on 10 July 2022) [28] under the default settings, and the quality of the filtered data were assessed using FastQC (http://www.bioinformatics.babraham.ac.uk/progects/fastqc; accessed on 15 July 2022). The cp genomes of PMA and PIX were assembled, using SPAdesv3.9.0 (http://bioinf.spbau.ru/spades; accessed on 15 July 2022) [29], A5-MiSeq (http://sourceforge.net/projects/ngopt; accessed on 15 July 2022) [30], and SOAPdenovo2 (ftp://public.genomics.org.cn/BGI/SOAPdenovo2; accessed on 15 July 2022) [31], using the selected, high quality, clean reads, with careful error correction and a k-mer of 17. According to the sequencing depth extraction of spliced sequences and the result of BLASTN (BLAST V2.2.31+, https://blast.ncbi.nlm.nih.gov/Blast.cgi; accessed on 15 July 2022) comparison with nt library on NCBI, the cp genome sequences of each spliced sequence were selected. Collinearity analysis was performed on the cp splicing results obtained from the above-mentioned software and the reference genome (PPE, GenBank accession number: MH019242), using mummerv3.1 (http://www.tigr.org/software/mummer; accessed on 15 July 2022) [32] software to determine the position relationship between contigs, and to fill the gap between contigs. After assembly, the improvement of the draft assembly genome was carried out using pilon v1.18 (http://github.com/broadinstitute/pilon/releases/; accessed on 15 July 2022) to obtain the final chloroplast sequence [33].
The complete cp genome sequences were uploaded to the Geseq web server (https://chlorobox.mpimp-golm.mpg.de/geseq.html, 20 July 2022) for functional annotation according to the default parameters [34]. The start and stop codons of protein-coding genes and intron/exon boundaries were checked manually based on the cp genome sequence of PPE from GenBank. The tRNAscan-SE v2.0 (https://github.com/UCSC-LoweLab/tRNAscan-SE; accessed on 20 July 2022) [35] software was used to correct the tRNA genes. Organellar Genome Draw (OGDRAW) (https://chlorobox.mpimp-golm.mpg.de/OGDraw.html; accessed on 20 July 2022) [36] was used to draw the maps of the cp genomes.
2.3. Codon Usage Bias and Repeat Sequence Analysis
Perl scripts were used to screen the coding sequences (CDS) (one copy were selected), and CodonW 1.4.2 software(https://sourceforge.net/projects/codonw/; accessed on 25 July 2022) was used to examine the relative synonymous codon usage (RSCU) values [37]. The long repeats, containing forward, reverse, palindromic, and complementary sequences, were detected by the REPuter software (https://bibiserv.cebitec.uni-bielefeld.de/reputer; accessed on 25 July 2022) with the following parameters: cut-off n ≥ 30 bp, a Hamming distance of 3 and a 90% similarity among repeat units [38]. SSR loci in the two Physalis cp genomes were searched using the Perl script MIcroSAtellite (MISA) software (http://pgrc.ipk-gatersleben.de/misa/misa.html; accessed on 25 July 2022) with the following settings: the motif sizes were 1–6 nucleotides, and the minimum number was defined as 10 for mononucleotide repeats, 5 for dinucleotide repeats, 4 for trinucleotide repeats, and 3 for tetra-, penta-, and hexanucleotide SSR repeats [39].
2.4. Chloroplast Genome Comparison
Eight reported Physalis cp genome sequences, namely PAN (GenBank accession number MH045574), PPU (MH045576), PMI (MH045577), PPH (MN192191), PPE (MH019242), PCH (MN508249), PPR (MH019243), and PAF (MH045575), were downloaded from the NCBI database. The homology and collinearity analysis were conducted using Mauve software (http://gel.ahabs.wisc.edu/mauve; accessed on 25 July 2022) [40], and the homologous sequences were compared using MAFFT software (https://mafft.cbrc.jp/alignment/software/; accessed on 25 July 2022) [41]. DnaSP 6.0 (http://www.ub.edu/dnasp/; accessed on 30 July 2022) was used to calculate the Pi (nucleotide variability) value of each gene [42]. The boundary information of LSC/IRs and SSC/IRs regions was visualized by using IRscope software (https://github.com/Limpfrog/irscope; accessed on 30 July 2022) [43]. The genomic variation among Physalis species was compared using mVISTA in the global alignment Shuffle-LAGAN mode (https://genome.lbl.gov/vista/mvista/about.shtml; accessed on 25 July 2022) [44].
2.5. Adaptive Evolution and Phylogenetic Analyses
The Ka/Ks values for each protein-coding gene were calculated by KaKs_Calculator 2.0 (https://sourceforge.net/projects/kakscalculator2/; accessed on 12 August 2022) with the default settings [45]. The heatmap for the evolutionary dynamics of the protein-coding genes among the 10 Physalis cp genomes was conducted by TBtools v1.106 (https://github.com/CJ-Chen/TBtools/releases; accessed on 24 December 2022) [46]. In order to investigate the genetic relationship of the tribe Physaleae, phylogenetic analyses were performed using the complete cp genome sequences of 33 species (including the 10 Physalis species), representing eight genera, three main subtribes of the tribe Physaleae. Three Capsicum species, including C. annuum, C. chinense and C. lycianthoides, were used as outgroup species based on previous studies (Table S1) [1,8,9]. Multiple sequence alignment was carried out using MAFFT v7.427 (https://mafft.cbrc.jp/alignment/server/add_sequences.html; accessed on 20 August 2022) with default settings [47]. Phylogenetic analyses were conducted with MEGA X (www.megasoftware.net; accessed on 20 August 2022) based on the maximum likelihood (ML) method [48]. The GTR + G + I model (General Time Reversible model, Gamma Distributed with Invariant Sites) was applied for the ML tree, based on the results from jModelTest 2.1.0 (http://darwin.uvigo.es; accessed on 20 August 2022) [49]. A continuous gamma distribution with 1000 bootstrap replicates was used for the ML analysis.
3. Results
3.1. Features of Chloroplast Genomes
Using the Illumina HiSeq 2500 system, a total of 21,505,084 and 20,322,498 reads was generated from PMA and PIX, respectively. Among them, 18,707,364 and 17,366,082 high quality pair-end reads were obtained from both genotypes, respectively (Table S2).
The size of the cp genome for PMA was 156,735 bp, whereas that for PIX was 156,871 bp (Table 1 and Figure 1). The two cp genomes exhibited a typical quadripartite structure, including one LSC region (87,115 bp and 87,103 bp for PMA and PIX, respectively), one SSC region (18,412 bp and 18,420 bp, respectively), and a pair of IR regions (25,604 bp and 25,674 bp, respectively). The GC content in the two cp genomes was similar, with 37.53% and 37.51% overall for PMA and PIX, respectively, and more than 35%, 31% and 43% obtained in the LSC, SSC and IR regions for both species (Table 1). The cp genomes of PMA and PIX contained the same set of 132 genes (consisting of 114 different genes and 18 genes duplicated in the IR regions), encoding 87 proteins, eight ribosomal RNAs (rRNAs) and 37 transfer RNAs (tRNAs) (Table 1 and Table S3). All the genes were annotated and grouped into four types: genes for photosynthesis, self-replication-related genes, genes of unknown function and other genes (Table S3). Twelve genes (trnL-UAA, trnV-UAC, trnI-GAU, trnA-UGC, trnG-GCC, trnK-UUU, rpoC1, rpl2, atpF, ndhB, ndhA and rps16) had one intron each and three genes (ycf3, clpP, and rps12) had two introns each (Table S4). The smallest intron (496 bp) was located in the trnL-UAA gene, and the largest intron (2509 bp) was found in the trnK-UUU gene, which harbored the entire matK gene (Figure 1 and Table S4).

Table 1.
Summaries of complete cp genomes of PMA and PIX.
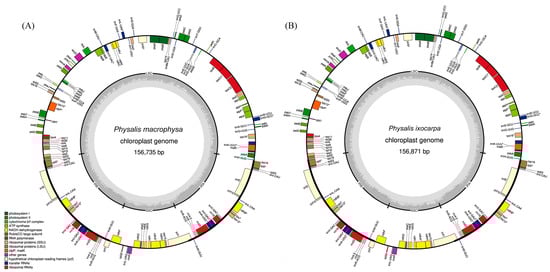
Figure 1.
Gene map of the cp genomes of PMA (A) and PIX (B). Genes outside the circles are transcribed in a counter-clockwise direction, and genes inside the circles in a clockwise direction. Known functional genes are color coded. AT and GC contents are denoted by light and dark gray in the inner circle, respectively. LSC: large single copy region, SSC: small single copy region, IRa and IRb: inverted repeat regions.
3.2. Codon Usage Bias
The protein-coding genes present a total of 23,931 codons in the cp genomes of PMA and PIX, respectively (Table S5). Interestingly, leucine (Leu) was the most abundant amino acid, with 2693 codons (11.3% of the total codons), in PMA, whereas serine (Ser) was the most abundant amino acid in PIX, with 2429 codons (10.2% of the total codons) (Table S5 and Figure 2A). The second most abundant amino acid in PMA was isoleucine (Ile) (with 1991 codons, representing 8.3% of the total codons). Otherwise, the second most abundant amino acid in PIX was leucine (Leu) (with 1965 codons, representing 8.2% of the total codons). The least abundant amino acid in both species was methionine, with only 545 (2.28%) and 367 (1.53%) codons in PMA and PIX, respectively. RSCU is a combination result of natural selection, genetic drift, and species mutation. AUG was the most preferred codon, which encoded methionine (Met) with 1.91 and 2.06 RSCU in PMA and PIX, respectively (Table S5 and Figure 2B). Among the codons, 31 (48.4%) and 29 (45.3%) exhibited codon bias (RSCU > 1). Among these codons, 28 and 26 preferred codons ended in A/U in PMA and PIX, respectively. The amino acids tryptophan (Trp) and methionine (Met) did not exhibit codon bias (RSCU = 1) in either species.
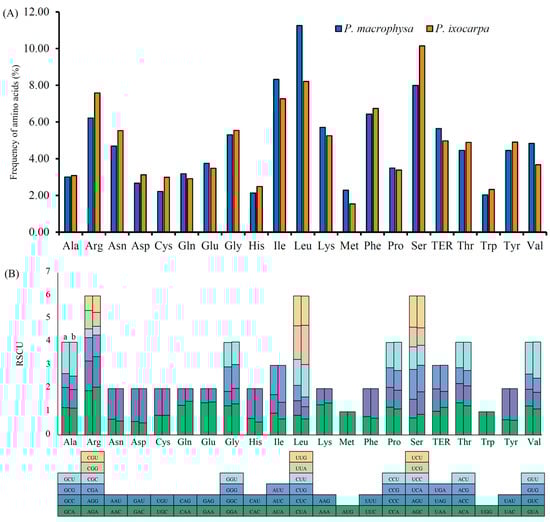
Figure 2.
The frequency of amino acids (A) and the number of RSCU of amino acids (B) in the cp genomes of PMA and PIX. (a) PMA, (b) PIX.
3.3. Repeat Sequence Analysis
In total, 35 repeat sequences, consisting of 19 forward, 13 palindromic, and three reverse repeats, were detected in PMA, five fewer than in PIX (with a total of 40 repeat sequences, comprising 22 forward repeats, 16 palindromic repeats and two reverse repeats) (Figure 3A, Tables S6 and S7). Most of the repeats present in both species (77.1% in PMA, compared with 77.5% in PIX) had sizes of 30–39 bp (Figure 3B, Tables S6 and S7). Most of the repeats (repeat location 1 of the repeats was used for statistics) were distributed in the LSC region (19 in both species), followed by IRs (12 and 17 in PMA and PIX, respectively), and the SSC region (four in both species) (Figure 3C). Additionally, the repeats located in protein coding genes (PCGs) represented the majority (17 and 18 in PMA and PIX, respectively), and the repeats that located in the intergenic spacers (IGSs) were in the minority (14 and 18 in PMA and PIX, respectively) (Figure 3D).
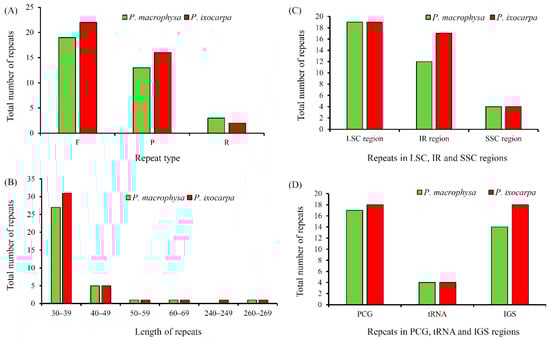
Figure 3.
The repeat sequences in cp genomes of PMA and PIX. (A), repeat type; (B), length of repeats; (C), repeats in LSC, SSC and IR regions; (D), repeats in PCG, tRNA and IGS regions.
In total, 61 and 60 SSRs were found for PMA and PIX, respectively (Figure 4A–F, Tables S8–S11). The SSRs in PMA comprised 43 mononucleotide repeats, six dinucleotide, five trinucleotide and seven tetranucleotide repeats (Figure 4A). The SSRs in PIX consisted of 42 mononucleotide repeats, six dinucleotide, five trinucleotide, and seven tetranucleotide repeats (Figure 4D). The mononucleotide SSRs contained poly-A, poly-T, and poly-C repeats, of which the A and T bases constituted the majority (67.2% and 68.3% in PMA and PIX, respectively). The SSRs located in the LSC region were the most (77.1% in PMA, 76.7% in PIX), followed by the IR regions (13.1% PMA, 13.3% in PIX), and the SSC region (9.8% and 10.0% in PMA and PIX, respectively) (Figure 4B,E). In addition, the results also showed that most SSRs were found in the intergenic spacer (IGS) regions (67.2% and 66.7% in PMA and PIX, respectively), followed by PCGs (26.2% and 26.7% in PMA and PIX, respectively), and tRNA genes (6.6% and 6.6% in PMA and PIX, respectively) (Figure 4C,F).
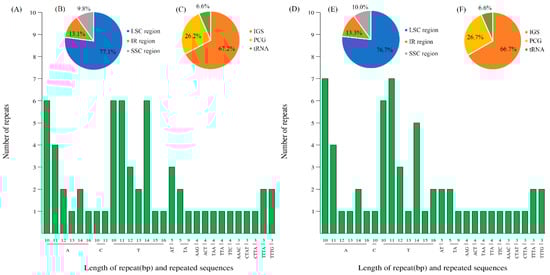
Figure 4.
Simple-sequence repeat (SSR) types, distribution and presence in PMA and PIX. (A), the types of SSR motifs detected in the PMA cp genome; (B,C), the frequency of SSRs in different regions (IRa, IRb, LSC, and SSC), and in IGS, PCG and tRNA, respectively; (D), the types of SSR motifs detected in the PIX cp genome; (E,F), the frequency of SSRs in different regions (IRa, IRb, LSC, and SSC), and in IGS, PCG and tRNA, respectively.
3.4. Analysis of IR Expansion and Contraction
The LSC/IR and SSC/IR of PMA and PIX cp genomes were compared with eight other closely related species of Physalis, namely PAN, PPU, PMI, PPH, PPE, PCH, PPR, and PAF (Figure 5). The rps19 gene was present in the LSC/IRb borders of PMA, PIX, PPU, PMI, PPH, PCH, and PAF, as well as in shared 24–72 bp sequences in the IRb region adjacent to the rpl2 gene. In contrast, the PAN rps19 gene was completely shifted to the LSC region close to LSC/IRb border. The most interesting point was that rps19 gene was far from or missing from the LSC/IRb borders of PPE and PPR, with the rpl2 gene instead straddling the LSC/IRb borders and extending to the LSC region by 717 bp and 737 bp in PPE and PPR, respectively. In addition, an intact copy of the rpl2 gene was present in the IRa region near the LSC/IRa borders of PMA, PIX, PAN, PPU, PMI, and PAF. The ycf1 gene was present in the IRa/SSC border of all of the cp genomes analyzed. Similarly, the entire ndhF gene was present in the SSC region of all 10 cp genomes. Compared with the ycf1 of SSC/IRb of the other nine species, the length of the ycf1 gene of PPH was the longest and extended to SSC region by 36 bp. The trnH gene was located in the LSC region close to the IRa/LSC border in most species, although it was missing in PPE and PPR.
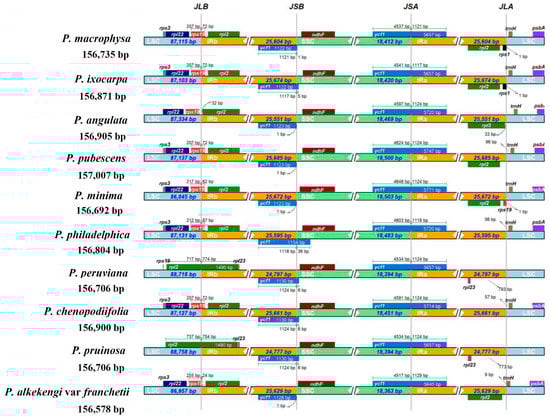
Figure 5.
Comparison of the borders of the IR, SSC and LSC regions among the 10 Physalis cp genomes.
3.5. Sequence Variability and Divergent Hotspot Identification
To elucidate the overall sequence identity and divergent regions in Physalis, the complete cp genome sequences of the 10 Physalis species (PMA, PIX, PAN, PPU, PMI, PPH, PPE, PCH, PPR and PAF) were compared and plotted using CGview and mVISTA analyses. The cp genomes of PMA and PIX had high synteny and gene order conservation with respect to the other eight Physalis cp genome sequences (Figure 6). However, there was still some sequence diversity among the 10 Physalis chloroplast genomes. Compared with IRs, the SC regions (LSC and SSC) were more variable. In addition, the non-coding regions showed higher sequence diversity compared with the coding regions (Figure 6).
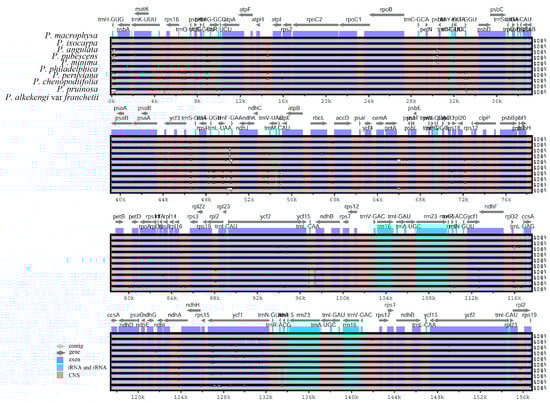
Figure 6.
Complete cp genome sequence alignments of 10 Physalis species using the mVISTA program, with the cp genome of PMA as reference. The horizontal axis indicates the coordinates within the cp genomes. The vertical scale indicates the percentage identity within 50–100%.
To further clarify the level of sequence divergence and to identify the divergent hotspots, the nucleotide diversity (Pi) values within 800 bp in the 10 Physalis cp genomes were calculated with DnaSP 6.0 software (http://www.ub.edu/dnasp/; accessed on 30 July 2022). Among the 10 Physalis species, these Pi values varied from 0 to 0.024 with a mean of 0.00235 (Figure 7 and Table S12). Nine highly divergent regions were detected, namely psbA, trnT-GGU–psbD, trnL-UAA–ndhJ, rbcL–accD, petA–psbF, rpl23–trnI-CAU, rpl32–ccsA, ycf1, and rpl2, with the nucleotide diversity (Pi) values ranging from 0.00725 (petA–psbF) to 0.024 (psbA) (Figure 7 and Table S13). Six of these divergent regions (psbA, trnT-GGU–psbD, trnL-UAA–ndhJ, rbcL–accD, petA–psbF and rpl23–trnI-CAU) were located in the LSC region, two (rpl32–ccsA and ycf1) were located in the SSC region, and one (rpl2) in the IRa region.
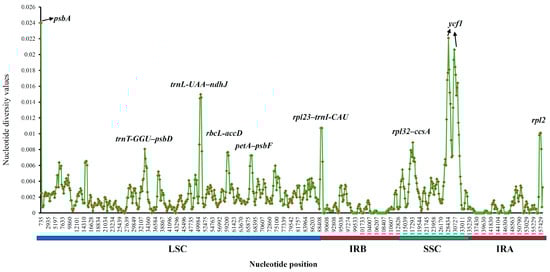
Figure 7.
Nucleotide diversity (Pi) values calculated among the 10 Physalis species. X-axis: the position in the genome; Y-axis: Pi value.
3.6. Gene Selective Pressure Analysis
Synonymous and non-synonymous substitutions in the 10 Physalis chloroplast genomes were calculated to analyze the selection patterns imposed on protein coding genes, using PMA as the reference genome. In total, the Ka/Ks values of 76 protein coding genes were calculated and compared. The results showed that 48 genes had values of zero or were uncalculatable, which therefore were excluded from the next analysis (Table S14). Among the 28 genes with Ka/Ks values larger than zero, 20 genes showed values less than one (Figure 8 and Table S15). However, eight genes showed values greater than 1.0, including clpP (PMA vs. PPR), ndhF (PMA vs. PMI), rpoA (PMA vs. PPR), rpoC2 (PMA vs. PMI), rps15 (PMA vs. PPR), rps16 (PMA vs. PAN, PMA vs. PPU, PMA vs. PMI, PMA vs. PPH, PMA vs. PPE, PMA vs. PCH, PMA vs. PPR and PMA vs. PAF), ycf1 (PMA vs. PAN, PMA vs. PPU, PMA vs. PMI, PMA vs. PPH, PMA vs. PPE, PMA vs. PCH and PMA vs. PPR) and ycf2 (PMA vs. PMI and PMA vs. PAF). The results also indicated that the Ka/Ks values of most genes between PMA and PPR were relatively high (Figure 8 and Table S15).
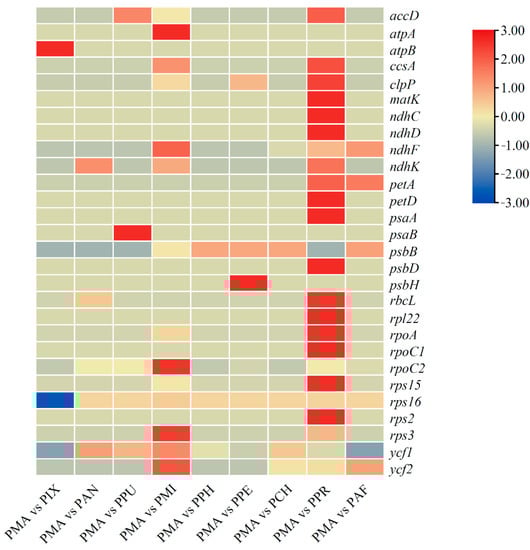
Figure 8.
The heatmap for the evolutionary dynamics of the protein-coding genes among the 10 Physalis cp genomes. Genes with value of Ka/Ks = 0 or uncalculatable are not shown.
3.7. Phylogenetic Analysis
Phylogenetic tree analysis showed that all species formed three major clusters, which corresponded to the three subtribes (Figure 9). In the ML tree, cluster I comprised 20 species of six genera from subtribe Iochrominae, including 10 Iochroma species, five Dunalia species, two Eriolarynx species, and one each from the genera Acnistus, Saracha, and Vassobia. The 10 test Physalis species belonging to the subtribe Physalinae, namely PMA, PIX, PAN, PPU, PMI, PPH, PPE, PCH, PPR, and PAF, were grouped into cluster II. Cluster III included three Withania species (Withania coagulans, Withania adpressa and Withania riebeckii) from the subtribe Withaninae. In addition, the results showed that PMA, PIX, and PPH were closely related to one another, while PAF was distantly related to other Physalis species.
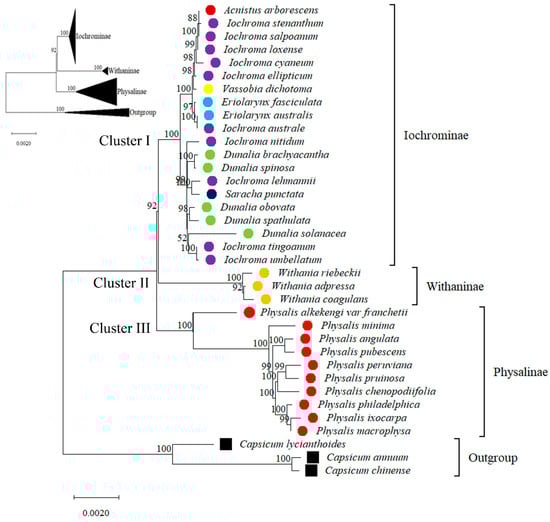
Figure 9.
The maximum likelihood (ML) phylogenetic tree of complete cp genomes from PMA, PIX and 31 other species of the tribe Physaleae. Numbers above branches indicate bootstrap support levels. Three Capsicum species, namely C. annuum, C. chinense and C. lycianthoides, were used as the outgroup.
4. Discussion
In the present study, we sequenced and assembled the cp genome sequences of PMA and PIX, performed a comprehensive comparative analysis of eight other published Physalis and constructed a phylogenetic tree of the tribe Physaleae.
As with most angiosperms, the cp genomes of PMA and PIX consist of a typical quadripartite structure, including a pair of IR regions (IRa and IRb) and one each of an SSC region and a LSC region. In our study, the results indicated that the cp genomes of PMA and PIX both had 132 genes, containing 87 protein-coding genes, eight rRNA genes and 37 tRNA genes. Moreover, the cp genomes of PMA and PIX were similar in length, 156,735 bp and 156,871 bp, respectively, which is consistent with most angiosperms, including other members of the tribe Physaleae. The overall GC contents of PMA (37.53%) and PIX (37.51%) cp genomes were similar to those of the other Physalis species in previous studies [50,51,52]. The results revealed a high level of similarity between PMA and PIX in terms of genome structure, gene content, and gene arrangements, although the cp genomes of the two species showed marked differences from those of PAN, PMI, and PAF in terms of the LSC/IR boundary, from PPH in terms of the SSC/IR boundary, and from PPE and PPR in terms of the contraction of IRs to expand part of rpl2 to LSCs. These results indicated that most of the variations in the cp genome structure in the Physalis genus occurred due to the contraction and expansion of the IR region.
Synonymous codon usage bias is important in shaping gene expression and cellular function [53]. RSCU is the result of the natural selection, genetic drift, and mutation [53,54,55]. In the present study, we found that methionine was the least represented amino acid in the gene products of the cp genomes of both PMA and PIX, a finding similar to the results from PAN, PPU, PMI, and PAF [50]. More interestingly, we found that the most abundant amino acids in the gene products of the cp genomes of PMA and PIX were leucine and serine, respectively. In addition, a preference for codons ending with A/U was observed in the cp genomes of both species, a finding which is consistent with that from the Fabaceae family members Trifolium spp. [53] and Medicago sativa [56], but different from the results obtained from Apocynum pictum [55] and Leptodermis scabrida [57].
Repetitive sequences can be used not only to study genome recombination and rearrangement, but also to study plant population and phylogeny [50]. In our study, 35 repeat sequences were detected in PMA cp genome, which was five fewer than the number of repeats detected in the cp genome of PIX. The lengths of most repeats in the two species (77.1% in PMA and 77.5% in PIX) were between 30 and 39 bp, a finding consistent with that of most other Physaleae cp genomes [50,58]. Interestingly, most of the repeats in the cp genomes of the two species were distributed in the LSC region, whereas the number of repeats distributed in the PCG was more than that in the IGS and tRNA. This information on the repeat sequences will provide us with specific insights into the evolutionary dynamics and phylogeny of Physalis species. SSRs are a type of short repeat with motifs of 1–6 nucleotides, which are widely distributed in eukaryotic cp genomes (cpSSRs). As more and more cp genomes have been sequenced and published, the development and application of cpSSRs have been widely adopted. In recent years, cpSSR markers have been widely used in plant germplasm identification, genetic diversity assessment, and phylogenetic analysis [59,60,61,62]. In our study, 61 SSR loci in PMA were identified, containing 67.2% located in IGS region, 26.2% in PCG region, and 6.6% among tRNA genes. Similarly, 60 SSR loci was found in PIX, containing 66.7% located in IGS region, 26.7%% in PCG region, and 6.7% among tRNA genes. The results showed that there were many polymorphisms in IGS regions, which was similarly with the findings from previous studies [20,57,63].
Expansion and contraction are universal phenomena in the IR regions and considered to represent a critical factor in determining size differences among cp genomes [57,64,65]. The difference in size of the cp genomes among the 10 Physalis species was not significant (156,578 bp–157,007 bp), which may be a result of similar expansions and contractions in the regions, except for PPE and PPR. Compared with the eight other Physalis species, the LSCs of PPE and PPR were the longest (88,718 bp and 88,758 bp, respectively), but their IRs were the shortest (24,797 bp and 24,777 bp, respectively), which may be related to the size expansion of rpl2 in the LSC regions and the size contraction of rpl2 in the IR regions. Expansion or contraction of the IR regions in these Physalis species is supposed to be related to the generation of pseudogenes, the duplications of genes, and the deletion of single copies of genes during evolution [20,66].
On the basis of comparisons among PMA, PIX, and the eight other Physalis species, the most sequence variations were found within the SSC and LSC regions, especially in the LSC regions. The genes with most divergent regions were psbA, ycf1, and rpl2, while the most divergent non-coding regions were trnT-GGU–psbD, trnL-UAA–ndhJ, rbcL–accD, petA–psbF, rpl23–trnI-CAU, and rpl32–ccsA. These results indicated that the variations mainly occurred in the non-coding regions of cp genomes, a finding which is consistent with results from most angiosperms [63,67,68]. Those genes and spacers are considered to be hotspots for nucleotide divergence, which can be used as potential DNA markers for species identification and phylogenetic analysis in Physalis.
The ratio of Ka to Ks is usually interpreted in terms of the selection effect of genes. Ka/Ks greater than one indicates a positive selection effect, while Ka/Ks less than one indicates a purification (negative) selection effect [69]. Our study showed that the Ka/Ks ratio between PMA, PIX, and the eight other Physalis species was less than one for most genes, showing that purifying selection played an important role in the 10 Physalis species. However, our analysis revealed that eight genes, namely clpP, ndhF, rpoA, rpoC2, rps15, rps16, ycf1, and ycf2, had Ka/Ks values >1, which suggested that these genes are positively selected to adapt to the environment of growth. Positive selection of some of these genes, such as ndhF, rpoA, rpoC2, and ycf1, was also reported in some previous studies [53,55,70]. Interestingly, the Ka/Ks value of clpP was found to be higher than one in our study, while it was very low in other species [70,71], which may reflect the species-specific evolution rate of the clpP gene [72].
In the past, a few DNA fragments (such as rDNA ITS, matK, and rbcL, etc.) were often used for phylogenetic analysis, which might cause phylogenetic errors and thus result in incongruent topology among different DNA fragments [50,63]. Therefore, the use of a small number of DNA fragments alone for plant phylogenetic studies might be inadequate and inappropriate. The cp genome sequence has a high level of variable characters, so it is of tremendous potential advantage for plant phylogenetic reconstruction. Thus, we performed phylogenomic analyses for Physalis species and its related species within tribe Physaleae based on whole cp genome sequences. Our phylogenetic studies showed that the species from subtribes Iochrominae, Physalinae, and Withaninae cluster into separate groups with strong support (BS = 100%), findings which were similar to the results of previous studies [8,9]. Among them, species from subtribe Iochrominae had the most complex relationships in the current study, especially those from genera Iochroma and Dunalia, which intermingled with species from other genera, and supported similar findings from previous studies [8,9,50]. Our phylogenetic studies also showed that, for the genus Physalis within the subtribe Physalinae, PMA and PIX were the closest relatives and were adjacent to PPH. In contrast, PAF was genetically distant from other Physalis species, especially from PMA and PIX. These findings reinforced the conclusions of our previous studies [12,13,50]. At the genomic level, our current study reconstructed phylogenetic relationships for as many species from the tribe Physaleae as possible, including Physalis species. However, the cp genomes of many species within the tribe Physaleae have not yet been sequenced or published. Further efforts of cp genome research within the Physaleae should provide more evidence to clarify the relationships and evolution of this diverse tribe.
5. Conclusions
In this study, we firstly sequenced and published the complete cp genome sequences of PMA and PIX and compared them with those of eight more Physalis species. The cp genomes of PMA and PIX were similar to those of the other eight Physalis species in terms of genome structure, gene content, and gene sequences. However, some hotspots for nucleotide divergence were detected, which could be used as potential DNA markers for subsequent species identification and phylogenetic analysis of Physalis. Our phylogenetic studies of the tribe Physaleae have provided new insights at the cp genomic level for the first time. Our study not only provides two new Physalis cp genomes, but could also provide important reference data for Physalis species identification, phylogenetic analysis, and the protection of resources.
Supplementary Materials
The following supporting information can be downloaded at: https://www.mdpi.com/article/10.3390/agronomy13010135/s1, Table S1. The 33 species belonging to eight genera of tribe Physaleae, and three species used as outgroups; Table S2. Sequencing data statistics of PMA and PIX; Table S3. Gene composition in the cp genomes of PMA and PIX; Table S4. Genes with intron in the cp genomes of PMA and PIX, and length of exons and introns; Table S5. Coding capacity of protein coding genes (PCGs) and relative synonymous codon usage (RSCU); Table S6. The information on repeat sequences detected in the PMA cp genome; Table S7. The information on repeat sequences detected in the PIX cp genome; Table S8. The information on all SSR loci in the PMA cp genome; Table S9. The information on all SSR loci in the PIX cp genome; Table S10. Statistical analysis of all SSR types of the PMA cp genome; Table S11. Statistical analysis of all SSR types of the PIX cp genome; Table S12. The nucleotide variability (Pi) values in the ten Physalis cp genomes; Table S13. The information of the nine most divergent regions; Table S14. The Ka/Ks values of the 76 protein-coding genes among ten Physalis chloroplast genomes; Table S15. The information on protein-coding genes with Ka/Ks values greater than zero between PMA and the other nine Physalis species.
Author Contributions
S.F. and H.W. conceived and designed the experiments, participated in the analysis, and drafted the manuscript. Z.Z., Y.Z., Y.J. and Y.G. performed the experiments. Q.Y., J.L. and X.Z. performed the statistical analysis. S.F., C.S. and H.W. collected the plant samples and revised the paper. All authors have read and agreed to the published version of the manuscript.
Funding
This work was funded by the National Natural Science Foundation of China (31970346); the Zhejiang Provincial Natural Science Foundation of China (LY20H280012); the key project at the central government level for the ability establishment of sustainable use for valuable Chinese medicine resources (2060302), the Zhejiang Provincial Key Research & Development Project Grants (2018C02030).
Data Availability Statement
The datasets presented in this study can be found in online repositories. The names of the repository/repositories and accession number(s) can be found in the article/Supplementary Materials.
Conflicts of Interest
The authors declare no conflict of interest.
References
- Whitson, M.; Manos, P.S. Untangling Physalis (Solanaceae) from the Physaloids: A Two-Gene Phylogeny of the Physalinae. Syst. Bot. 2005, 30, 216–230. [Google Scholar] [CrossRef]
- Zhang, W.N.; Tong, W.Y. Chemical constituents and biological activities of plants from the genus Physalis. Chem. Biodivers. 2016, 13, 48–65. [Google Scholar] [CrossRef] [PubMed]
- Ji, L.; Yuan, Y.; Luo, L.; Chen, Z.; Ma, X.; Ma, Z.; Cheng, L. Physalins with anti-inflammatory activity are present in Physalis alkekengi var. franchetii and can function as Michael reaction acceptors. Steroids 2012, 77, 441–447. [Google Scholar] [CrossRef] [PubMed]
- Cardenas-Castro, A.P.; Zamora-Gasga, V.M.; Alvarez-Parrilla, E.; Ruiz-Valdiviezo, V.M.; Venema, K.; Sayago-Ayerdi, S.G. In vitro gastrointestinal digestion and colonic fermentation of tomato (Solanum lycopersicum L.) and husk tomato (Physalis ixocarpa Brot.): Phenolic compounds released and bioconverted by gut microbiota. Food Chem. 2021, 360, 130051. [Google Scholar] [CrossRef] [PubMed]
- Zhang, C.R.; Khan, W.; Bakht, J.; Nair, M.G. New antiinflammatory sucrose esters in the natural sticky coating of tomatillo (Physalis philadelphica), an important culinary fruit. Food Chem. 2016, 196, 726–732. [Google Scholar] [CrossRef]
- Yang, J.; Sun, Y.; Cao, F.; Yang, B.; Kuang, H. Natural products from Physalis alkekengi L. var. franchetii (Mast.) Makino: A review on their structural analysis, quality control, pharmacology, and pharmacokinetics. Molecules 2022, 27, 695. [Google Scholar] [CrossRef]
- He, C.; Tian, Y.; Saedler, R.; Efremova, N.; Riss, S.; Khan, M.R.; Yephremov, A.; Saedler, H. The MADS-domain protein MPF1 of Physalis floridana controls plant architecture, seed development and flowering time. Planta 2010, 231, 767–777. [Google Scholar] [CrossRef][Green Version]
- Olmstead, R.G.; Bohs, L.; Migid, H.A.; Santiago-Valentin, E.; Garcia, V.F.; Collier, S.M. A molecular phylogeny of the Solanaceae. Taxon 2008, 57, 1159–1181. [Google Scholar] [CrossRef]
- Li, H.Q.; Gui, P.; Xiong, S.Z.; Averett, J.E. The generic position of two species of tribe Physaleae (Solanaceae) inferred from three DNA sequences: A case study on Physaliastrum and Archiphysalis. Biochem. Syst. Ecol. 2013, 50, 82–89. [Google Scholar] [CrossRef]
- Axelius, B. The phylogenetic relationships of the physaloid genera (Solanaceae) based on morphological data. Am. J. Bot. 1996, 83, 118–124. [Google Scholar] [CrossRef]
- Martínez, M. Revision of Physalis section Epeteiorhiza (Solanaceae). Ann. Ins. Biol. Bot. 1998, 69, 71–117. [Google Scholar] [CrossRef][Green Version]
- Feng, S.; Jiao, K.; Zhu, Y.; Wang, H.; Jiang, M.; Wang, H. Molecular identification of species of Physalis (Solanaceae) using a candidate DNA barcode: The chloroplast psbA-trnH intergenic region. Genome 2018, 61, 15–20. [Google Scholar] [CrossRef]
- Feng, S.; Jiang, M.; Shi, Y.; Jiao, K.; Shen, C.; Lu, J.; Ying, Q.; Wang, H. Application of the ribosomal DNA ITS2 region of Physalis (Solanaceae): DNA barcoding and phylogenetic study. Front. Plant Sci. 2016, 7, 1047. [Google Scholar] [CrossRef]
- Garcia, C.C.; Wahlert, G.; Orozco, C.I.; Barboza, G.E.; Bohs, L. Phylogeny of the Andean genus Deprea (Physalideae, Solanaceae): Testing the generic circumscription. Phytotaxa 2015, 238, 71–81. [Google Scholar] [CrossRef]
- Wei, J.; Hu, X.; Yang, J.; Yang, W. Identification of single-copy orthologous genes between Physalis and Solanum lycopersicum and analysis of genetic diversity in Physalis using molecular markers. PLoS ONE 2012, 7, e50164. [Google Scholar] [CrossRef]
- Simbaqueba, J.; Sanchez, P.; Sanchez, E.; Nunez Zarantes, V.M.; Chacon, M.I.; Barrero, L.S.; Marino-Ramirez, L. Development and characterization of microsatellite markers for the Cape gooseberry Physalis peruviana. PLoS ONE 2011, 6, e26719. [Google Scholar] [CrossRef]
- Diekmann, K.; Hodkinson, T.R.; Wolfe, K.H.; van den Bekerom, R.; Dix, P.J.; Barth, S. Complete chloroplast genome sequence of a major allogamous forage species, perennial ryegrass (Lolium perenne L.). DNA Res. 2009, 16, 165–176. [Google Scholar] [CrossRef]
- Tian, S.; Lu, P.; Zhang, Z.; Wu, J.Q.; Zhang, H.; Shen, H. Chloroplast genome sequence of Chongming lima bean (Phaseolus lunatus L.) and comparative analyses with other legume chloroplast genomes. BMC Genom. 2021, 22, 194. [Google Scholar] [CrossRef]
- Dong, S.; Zhang, S.; Zhang, L.; Wu, H.; Goffinet, B.; Liu, Y. Plastid genomes and phylogenomics of liverworts (Marchantiophyta): Conserved genome structure but highest relative plastid substitution rate in land plants. Mol. Phylogenet. Evol. 2021, 161, 107171. [Google Scholar] [CrossRef]
- Guo, Y.Y.; Yang, J.X.; Li, H.K.; Zhao, H.S. Chloroplast genomes of two species of Cypripedium: Expanded genome size and proliferation of AT-biased repeat sequences. Front. Plant. Sci. 2021, 12, 609729. [Google Scholar] [CrossRef]
- Jansen, R.K.; Wojciechowski, M.F.; Sanniyasi, E.; Lee, S.B.; Daniell, H. Complete plastid genome sequence of the chickpea (Cicer arietinum) and the phylogenetic distribution of rps12 and clpP intron losses among legumes (Leguminosae). Mol. Phylogenet. Evol. 2008, 48, 1204–1217. [Google Scholar] [CrossRef] [PubMed]
- Millen, R.S.; Olmstead, R.G.; Adams, K.L.; Palmer, J.D.; Lao, N.T.; Heggie, L.; Kavanagh, T.A.; Hibberd, J.M.; Gray, J.C.; Morden, C.W.; et al. Many parallel losses of infA from chloroplast DNA during angiosperm evolution with multiple independent transfers to the nucleus. Plant Cell 2001, 13, 645–658. [Google Scholar] [CrossRef] [PubMed]
- Miao, H.Y.; Bao, J.B.; Li, X.L.; Ding, Z.J.; Tian, X.M. Comparative analyses of chloroplast genomes in ‘Red Fuji’ apples: Low rate of chloroplast genome mutations. Peerj 2022, 10, e12927. [Google Scholar] [CrossRef] [PubMed]
- Nguyen, V.B.; Park, H.S.; Lee, S.C.; Lee, J.; Park, J.Y.; Yang, T.J. Authentication markers for five major Panax species developed via comparative analysis of complete chloroplast genome sequences. J. Agric. Food Chem. 2017, 65, 6298–6306. [Google Scholar] [CrossRef] [PubMed]
- Li, B.; Liu, T.; Ali, A.; Xiao, Y.; Shan, N.; Sun, J.; Huang, Y.; Zhou, Q.; Zhu, Q. Complete chloroplast genome sequences of three aroideae species (Araceae): Lights into selective pressure, marker development and phylogenetic relationships. BMC Genom. 2022, 23, 218. [Google Scholar] [CrossRef]
- Park, I.; Yang, S.; Kim, W.J.; Song, J.H.; Lee, H.S.; Lee, H.O.; Lee, J.H.; Ahn, S.N.; Moon, B.C. Sequencing and comparative analysis of the chloroplast genome of Angelica polymorpha and the development of a novel indel marker for species identification. Molecules 2019, 24, 1038. [Google Scholar] [CrossRef]
- Wen, J.; Xie, D.F.; Price, M.; Ren, T.; Deng, Y.Q.; Gui, L.J.; Guo, X.L.; He, X.J. Backbone phylogeny and evolution of Apioideae (Apiaceae): New insights from phylogenomic analyses of plastome data. Mol. Phylogenet. Evol. 2021, 161, 107183. [Google Scholar] [CrossRef]
- Bolger, A.M.; Lohse, M.; Usadel, B. Trimmomatic: A flexible trimmer for Illumina sequence data. Bioinformatics 2014, 30, 2114–2120. [Google Scholar] [CrossRef]
- Bankevich, A.; Nurk, S.; Antipov, D.; Gurevich, A.A.; Dvorkin, M.; Kulikov, A.S.; Lesin, V.M.; Nikolenko, S.I.; Pham, S.; Prjibelski, A.D.; et al. SPAdes: A new genome assembly algorithm and its applications to single-cell sequencing. J. Comput. Biol. 2012, 19, 455–477. [Google Scholar] [CrossRef]
- Coil, D.; Jospin, G.; Darling, A.E. A5-miseq: An updated pipeline to assemble microbial genomes from Illumina MiSeq data. Bioinformatics 2015, 31, 587–589. [Google Scholar] [CrossRef]
- Luo, R.B.; Liu, B.H.; Xie, Y.L.; Li, Z.Y.; Huang, W.H.; Yuan, J.Y.; He, G.Z.; Chen, Y.X.; Pan, Q.; Liu, Y.J.; et al. SOAPdenovo2: An empirically improved memory-efficient short-read de novo assembler. Gigascience 2012, 1, 18. [Google Scholar] [CrossRef]
- Kurtz, S.; Phillippy, A.; Delcher, A.L.; Smoot, M.; Shumway, M.; Antonescu, C.; Salzberg, S.L. Versatile and open software for comparing large genomes. Genome Biol. 2004, 5, R12. [Google Scholar] [CrossRef]
- Walker, B.J.; Abeel, T.; Shea, T.; Priest, M.; Abouelliel, A.; Sakthikumar, S.; Cuomo, C.A.; Zeng, Q.; Wortman, J.; Young, S.K.; et al. Pilon: An integrated tool for comprehensive microbial variant detection and genome assembly improvement. PLoS ONE 2014, 9, e112963. [Google Scholar] [CrossRef]
- Tillich, M.; Lehwark, P.; Pellizzer, T.; Ulbricht-Jones, E.S.; Fischer, A.; Bock, R.; Greiner, S. GeSeq—Versatile and accurate annotation of organelle genomes. Nucleic Acids Res. 2017, 45, W6–W11. [Google Scholar] [CrossRef]
- Chan, P.P.; Lin, B.Y.; Mak, A.J.; Lowe, T.M. tRNAscan-SE 2.0: Improved detection and functional classification of transfer RNA genes. Nucleic Acids Res. 2021, 49, 9077–9096. [Google Scholar] [CrossRef]
- Lohse, M.; Drechsel, O.; Kahlau, S.; Bock, R. OrganellarGenomeDRAW--a suite of tools for generating physical maps of plastid and mitochondrial genomes and visualizing expression data sets. Nucleic Acids Res. 2013, 41, W575–W581. [Google Scholar] [CrossRef]
- Sharp, P.M.; Li, W.H. Codon usage in regulatory genes in Escherichia coli does not reflect selection for ‘rare’ codons. Nucleic Acids Res. 1986, 14, 7737–7749. [Google Scholar] [CrossRef]
- Kurtz, S.; Choudhuri, J.V.; Ohlebusch, E.; Schleiermacher, C.; Stoye, J.; Giegerich, R. REPuter: The manifold applications of repeat analysis on a genomic scale. Nucleic Acids Res. 2001, 29, 4633–4642. [Google Scholar] [CrossRef]
- Beier, S.; Thiel, T.; Munch, T.; Scholz, U.; Mascher, M. MISA-web: A web server for microsatellite prediction. Bioinformatics 2017, 33, 2583–2585. [Google Scholar] [CrossRef]
- Darling, A.C.; Mau, B.; Blattner, F.R.; Perna, N.T. Mauve: Multiple alignment of conserved genomic sequence with rearrangements. Genome Res. 2004, 14, 1394–1403. [Google Scholar] [CrossRef]
- Katoh, K.; Standley, D.M. MAFFT multiple sequence alignment software version 7: Improvements in performance and usability. Mol. Biol. Evol. 2013, 30, 772–780. [Google Scholar] [CrossRef] [PubMed]
- Rozas, J.; Ferrer-Mata, A.; Sanchez-DelBarrio, J.C.; Guirao-Rico, S.; Librado, P.; Ramos-Onsins, S.E.; Sanchez-Gracia, A. DnaSP 6: DNA sequence polymorphism analysis of large data sets. Mol. Biol. Evol. 2017, 34, 3299–3302. [Google Scholar] [CrossRef] [PubMed]
- Amiryousefi, A.; Hyvonen, J.; Poczai, P. IRscope: An online program to visualize the junction sites of chloroplast genomes. Bioinformatics 2018, 34, 3030–3031. [Google Scholar] [CrossRef] [PubMed]
- Frazer, K.A.; Pachter, L.; Poliakov, A.; Rubin, E.M.; Dubchak, I. VISTA: Computational tools for comparative genomics. Nucleic Acids Res. 2004, 32, W273–W279. [Google Scholar] [CrossRef] [PubMed]
- Wang, D.; Zhang, Y.; Zhang, Z.; Zhu, J.; Yu, J. KaKs_Calculator 2.0: A toolkit incorporating gamma-series methods and sliding window strategies. Genom. Proteom. Bioinform. 2010, 8, 77–80. [Google Scholar] [CrossRef]
- Chen, C.J.; Chen, H.; Zhang, Y.; Thomas, H.R.; Frank, M.H.; He, Y.H.; Xia, R. TBtools: An integrative toolkit developed for interactive analyses of big biological data. Mol. Plant 2020, 13, 1194–1202. [Google Scholar] [CrossRef]
- Katoh, K.; Rozewicki, J.; Yamada, K.D. MAFFT online service: Multiple sequence alignment, interactive sequence choice and visualization. Brief Bioinform. 2017, 20, 1160–1166. [Google Scholar] [CrossRef]
- Kumar, S.; Stecher, G.; Li, M.; Knyaz, C.; Tamura, K. MEGA X: Molecular evolutionary genetics analysis across computing platforms. Mol. Biol. Evol. 2018, 35, 1547–1549. [Google Scholar] [CrossRef]
- Posada, D. jModelTest: Phylogenetic model averaging. Mol. Biol. Evol. 2008, 25, 1253–1256. [Google Scholar] [CrossRef]
- Feng, S.; Zheng, K.; Jiao, K.; Cai, Y.; Chen, C.; Mao, Y.; Wang, L.; Zhan, X.; Ying, Q.; Wang, H. Complete chloroplast genomes of four Physalis species (Solanaceae): Lights into genome structure, comparative analysis, and phylogenetic relationships. BMC Plant Biol. 2020, 20, 242. [Google Scholar] [CrossRef]
- Zamora-Tavares, M.D.; Sandoval-Padilla, I.; Chavez Zendejas, A.; Perez-Alquicira, J.; Vargas-Ponce, O. Complete chloroplast genome of Physalis chenopodifolia Lam. (Solanaceae). Mitochondrial DNA B 2020, 5, 162–163. [Google Scholar] [CrossRef]
- Sandoval-Padilla, I.; Perez-Alquicira, J.; Zamora-Tavares, M.D.P.; Rodriguez, A.; Cortes-Cruz, M.; Alcala-Gomez, G.; Vargas-Ponce, O. Complete sequence of wild Physalis philadelphica chloroplast genome. Mitochondrial DNA B Resour. 2019, 4, 3295–3297. [Google Scholar] [CrossRef]
- Xiong, Y.; Xiong, Y.; He, J.; Yu, Q.; Zhao, J.; Lei, X.; Dong, Z.; Yang, J.; Peng, Y.; Zhang, X.; et al. The Complete chloroplast genome of two important annual clover species, Trifolium alexandrinum and T. resupinatum: Genome structure, comparative analyses and phylogenetic relationships with relatives in Leguminosae. Plants 2020, 9, 478. [Google Scholar] [CrossRef]
- Fu, N.; Ji, M.; Rouard, M.; Yan, H.F.; Ge, X.J. Comparative plastome analysis of Musaceae and new insights into phylogenetic relationships. BMC Genom. 2022, 23, 223. [Google Scholar] [CrossRef]
- Zheng, C.; Fan, J.; Caraballo-Ortiz, M.A.; Liu, Y.; Liu, T.; Fu, G.; Zhang, Y.; Yang, P.; Su, X. The complete chloroplast genome and phylogenetic relationship of Apocynum pictum (Apocynaceae), a Central Asian shrub and second-class national protected species of western China. Gene 2022, 830, 146517. [Google Scholar] [CrossRef]
- Tao, X.; Ma, L.; Zhang, Z.; Liu, W.; Liu, Z. Characterization of the complete chloroplast genome of alfalfa (Medicago sativa) (Leguminosae). Gene Rep. 2017, 6, 67–73. [Google Scholar] [CrossRef]
- Zhang, Y.; Wang, Z.; Guo, Y.; Chen, S.; Xu, X.; Wang, R. Complete chloroplast genomes of Leptodermis scabrida complex: Comparative genomic analyses and phylogenetic relationships. Gene 2021, 791, 145715. [Google Scholar] [CrossRef]
- De-la-Cruz, I.M.; Nunez-Farfan, J. The complete chloroplast genomes of two Mexican plants of the annual herb Datura stramonium (Solanaceae). Mitochondrial DNA B Resour. 2020, 5, 2823–2825. [Google Scholar] [CrossRef]
- Lopez-Caamal, A.; Ferrufino-Acosta, L.F.; Diaz-Maradiaga, R.F.; Rodriguez-Delcid, D.; Mussali-Galante, P.; Tovar-Sanchez, E. Species distribution modelling and cpSSR reveal population history of the Neotropical annual herb Tithonia rotundifolia (Asteraceae). Plant Biol. 2019, 21, 248–258. [Google Scholar] [CrossRef]
- Li, S.; Liu, S.L.; Pei, S.Y.; Ning, M.M.; Tang, S.Q. Genetic diversity and population structure of Camellia huana (Theaceae), a limestone species with narrow geographic range, based on chloroplast DNA sequence and microsatellite markers. Plant Divers. 2020, 42, 343–350. [Google Scholar] [CrossRef]
- Cui, B.; Deng, P.; Zhang, S.; Zhao, Z. Genetic diversity and population genetic structure of ancient Platycladus orientalis L. (Cupressaceae) in the middle reaches of the Yellow River by chloroplast microsatellite markers. Forests 2021, 12, 592. [Google Scholar] [CrossRef]
- Xiong, Y.; Xiong, Y.; Shu, X.; Yu, Q.; Lei, X.; Li, D.; Yan, J.; Bai, S.; Ma, X. Molecular phylogeography and intraspecific divergences in Siberian Wildrye (Elymus sibiricus L.) wild populations in China, inferred from chloroplast DNA sequence and cpSSR markers. Front. Plant Sci. 2022, 13, 862759. [Google Scholar] [CrossRef] [PubMed]
- Liu, C.K.; Lei, J.Q.; Jiang, Q.P.; Zhou, S.D.; He, X.J. The complete plastomes of seven Peucedanum plants: Comparative and phylogenetic analyses for the Peucedanum genus. BMC Plant Biol. 2022, 22, 101. [Google Scholar] [CrossRef] [PubMed]
- Wang, N.; Chen, S.; Xie, L.; Wang, L.; Feng, Y.; Lv, T.; Fang, Y.; Ding, H. The complete chloroplast genomes of three Hamamelidaceae species: Comparative and phylogenetic analyses. Ecol. Evol. 2022, 12, e8637. [Google Scholar] [CrossRef] [PubMed]
- Nguyen, P.A.; Kim, J.S.; Kim, J.H. The complete chloroplast genome of colchicine plants (Colchicum autumnale L. and Gloriosa superba L.) and its application for identifying the genus. Planta 2015, 242, 223–237. [Google Scholar] [CrossRef]
- Han, H.J.; Qiu, R.; Liu, Y.F.; Zhou, X.Y.; Gao, C.P.; Pang, Y.Z.; Zhao, Y. Analysis of chloroplast genomes provides insights into the evolution of Agropyron. Front. Genet. 2022, 13, 832809. [Google Scholar] [CrossRef]
- Jiang, K.; Miao, L.Y.; Wang, Z.W.; Ni, Z.Y.; Hu, C.; Zeng, X.H.; Huang, W.C. Chloroplast genome analysis of two medicinal Coelogyne spp. (Orchidaceae) shed light on the genetic information, comparative genomics, and species identification. Plants 2020, 9, 1332. [Google Scholar] [CrossRef]
- Xu, F.; He, L.; Gao, S.; Su, Y.; Li, F.; Xu, L. Comparative analysis of two sugarcane sncestors Saccharum officinarum and S. spontaneum based on complete chloroplast genome sequences and photosynthetic ability in cold stress. Int. J. Mol. Sci. 2019, 20, 3828. [Google Scholar] [CrossRef]
- Yang, Z.; Nielsen, R. Estimating synonymous and nonsynonymous substitution rates under realistic evolutionary models. Mol. Biol. Evol. 2000, 17, 32–43. [Google Scholar] [CrossRef]
- Liang, D.Q.; Wang, H.Y.; Zhang, J.; Zhao, Y.X.; Wu, F. Complete chloroplast genome sequence of Fagus longipetiolata Seemen (Fagaceae): Genome structure, adaptive Evolution, and phylogenetic relationships. Life 2022, 12, 1332. [Google Scholar] [CrossRef]
- Liang, H.; Chen, J. Comparison and phylogenetic analyses of nine complete chloroplast genomes of Zingibereae. Forests 2021, 12, 710. [Google Scholar] [CrossRef]
- Williams, A.M.; Friso, G.; van Wijk, K.J.; Sloan, D.B. Extreme variation in rates of evolution in the plastid Clp protease complex. Plant J. 2019, 98, 243–259. [Google Scholar] [CrossRef]
Disclaimer/Publisher’s Note: The statements, opinions and data contained in all publications are solely those of the individual author(s) and contributor(s) and not of MDPI and/or the editor(s). MDPI and/or the editor(s) disclaim responsibility for any injury to people or property resulting from any ideas, methods, instructions or products referred to in the content. |
© 2022 by the authors. Licensee MDPI, Basel, Switzerland. This article is an open access article distributed under the terms and conditions of the Creative Commons Attribution (CC BY) license (https://creativecommons.org/licenses/by/4.0/).