Article

Consecutive Application Effects of Washed Rice Water on Plant Growth, Soil Chemical Properties, Nutrient Leaching, and Soil Bacterial Population on Three Different Soil Textures over Three Planting Cycles

by
Abba Nabayi
1,2,
Christopher Boon Sung Teh
1,*,
Ali Kee Zuan Tan
1 and
Ngai Paing Tan
1
1
Department of Land Management, Faculty of Agriculture, University Putra Malaysia, Serdang 43400, Selangor, Malaysia
2
Department of Soil Science, Faculty of Agriculture, Federal University Dutse, PMB 7156, Dutse 720101, Jigawa State, Nigeria
*
Author to whom correspondence should be addressed.
Agronomy 2022, 12(9), 2220; https://doi.org/10.3390/agronomy12092220
Submission received: 9 August 2022 / Revised: 6 September 2022 / Accepted: 9 September 2022 / Published: 18 September 2022
(This article belongs to the Section Farming Sustainability)

Abstract

:
The benefits of washed rice water (WRW) as a plant fertilizer, particularly over a consecutive application period, are not well studied. An experiment was therefore carried out to determine: the continuous effects of applying unfermented (F0) and 3-day fermented (F3) WRW on the: (1) soil chemical properties, soil bacterial count, and the growth and plant nutrient content of a test crop, choy sum (Brassica chinensis var. parachinensis), grown on three contrasting soil textures (sandy clay loam, clay, and silt loam); (2) nutrient leaching losses from these three soils due to the continuous application of WRW; (3) crops’ improvement in water use, if any, in terms of its water productivity (WP) and water use efficiency (WUE); and (4) the relationship between soil bacterial count and plant growth parameters. The effects of F0 and F3 were compared with conventional NPK fertilizer and a control (only tap water; CON). Two factors, treatments and soil types, were used factorially in a randomized complete block design for three consecutive planting cycles. Results showed that NPK and F3 produced a significantly (p < 0.01) higher plant growth in terms of fresh and dry leaf weights and total leaf area by 5 to 61%, compared to that obtained in the other treatments. Furthermore, plants receiving either NPK or F3 had a significantly higher plant nutrient content (P, K, Ca, Mg, and Cu) in the third planting cycle. Clay soil treated with F3, NPK, and F0 had significantly higher NH 4 + , P, Ca, Mg, Zn, and B, by 19 to 152% relative to the other soils, irrespective of treatments. Soil nutrient leaching losses of P, K, Ca, Mg, Cu, Zn, and B decreased with successive planting cycles for all treatments. However, soils treated with either F3 or F0 experienced higher leaching of NH 4 + and NO 3   by 37 to 259% and 13 to 34%, respectively, relative to the NPK and CON. Plants treated with either NPK or F3 also had higher WP by 21 to 42% than the other treatments. For all the treatments, plants’ WUE increased with successive planting cycles; however, there was no significant difference between the treatments. F3 stimulated a significantly higher growth and yield of choy sum due to its nutrient and bacterial contents, and the continuous increase in plant growth with successive planting cycles indicated the carryover effects of the treatments, particularly by F3.

1. Introduction

Rice is very often washed before cooking, and the resultant wastewater (hereafter called washed rice water, or WRW) is very often merely thrown, unused, into the waterways and environment. Although rice washing means fewer nutrients are available in rice for human consumption, this also means that the WRW, now enriched by these leached nutrients, could be used as a liquid plant fertilizer and soil amendment. Washing rice leaches nutrients from the rice grains, and several studies [1,2,3,4,5,6,7] have indicated that this WRW contains nutrients such as total N, NO 3 , NH 4 + , P, K, Ca, Mg, and S elements in concentrations varying between 40 to 16,306 mg L−1. Nabayi et al. [8] further reported that fermenting the WRW had increased the concentrations of these nutrients by as much as 60%. Similarly, Dini and Salbiah [9] found N, P, and K contents in fermented WRW to be 400, 280, and 1000 mg L−1, respectively, due to the presence of cellulolytic bacteria and their mineralization activities, which helped to raise these nutrient levels. Reusing washed rice water ought to be encouraged because its practice is a part of better water governance. By 2050, the global freshwater demand is projected to rise by 55% [10]. This water demand increase is primarily due to climate change and the increasing world population, which drives the United Nations [11] to advocate for more effective water governance, where wastewater is utilized and reused or recycled for other purposes, rather than just being discarded. Recently, interest in using wastewater for irrigation has increased [12]. There are many claims regarding the beneficial effects of WRW as a plant fertilizer [13,14,15], but these claims are very often anecdotal, given without compelling scientific evidence.
WRW from the household can be used as liquid organic fertilizer for plant use [16]. In addition, it can enhance soil fertility and serve as a soil amendment [15]. Several studies [17,18,19] further found that the application of WRW increased the growth of tomato, eggplant, and spinach by 22 to 43% more than the control (tap water). Similarly, other studies [6,20,21,22,23,24,25] reported that the growth of crops, such as mustard plant, tomato, eggplant, oyster mushroom, lettuce, and desert rose, increased by 9 to 26% due to WRW application relative to the use of other waste (such as animal urine) and control (tap water) treatments. However, Sairi et al. [26] reported that the growth of chili using WRW was similar with that using a mineral fertilizer, and Wulandari et al. [24] found no significant effect of WRW on the growth of lettuce (Lactuca sativa L.), except only for a significant increase in the plant root weight.
Unfortunately, detailed scientific studies on the use of WRW as a plant fertilizer are very scarce. Instead, the interests and research focused on WRW are predominantly on its potential use for either human or animal health (e.g., use of washed rice water as a health supplement or medical treatment) or cosmetology purposes (e.g., use of washed rice water as a human facial, skin, and hair care) [4]. Based on our review of the literature, most of the studies on the potential use of WRW for agriculture seem to be conducted in Asia. In addition, these studies are often reported in languages other than English (even though some of these studies have English abstracts). These reports are also not easily accessible, and they are largely published in non-cited journals. Studies by Nabayi et al. [8,27] are particularly important. They are perhaps the most in-depth and scientifically rigorous examination ever performed to evaluate the potential reuse of WRW as a plant fertilizer. Prior to their studies, empirical studies on WRW were not only scarce, but very often also lacking in depth and scientific rigor. For instance, nearly all WRW studies did not include information on how often the WRW was applied, how it was applied, or even the size of the field or plot used [4]. Furthermore, because the majority of these WRW studies did not even examine the initial or final plant and soil nutrient contents, it was difficult to determine by how much the WRW had increased the nutrient contents of the various test crops and soils used.
In contrast, Nabayi et al. [8,27] reported how varying the washing speeds, washing volume (rice–to–water volumetric ratios), and fermentation periods had affected both the nutrient contents and beneficial bacteria counts in the WRW. They found that most of the nutrient levels increased the longer the WRW is fermented and with a higher washing volume (that is, using more water to wash the rice grains). However, rice washing speeds did not have a significant effect on most of the WRW nutrients levels. Unlike most nutrients, the C content in WRW decreased with fermentation. This was because C, used as an energy source for bacteria, was increasingly consumed by the bacteria in the WRW. This was why the bacterial counts initially and rapidly increased in the first 3 days of fermentation, then declined thereafter. During this 3-day fermentation period, beneficial microbes were found in the WRW, and using gene sequencing, they were identified as Enterobacter spp., Bacillus valezensis, and Pantoea agglomerans. Due to the presence of these bacteria, greater N-fixation, catalase, indole acetic acids (IAA), P-, and K-solubilization potentials were also observed, all of which decreased with the progression of fermentation.
This paper was a follow up to our first paper [27], where we stated that the benefits of WRW must be shown in two stages. The first stage is to show that WRW has the beneficial properties and nutrient levels for plant growth. This has been shown in our study [27]. This paper now aims to address the second stage; that is, to evaluate the immediate and continuous effects of applying WRW on crop growth and yield and on the biological and physicochemical properties of soil. Based on the higher nutrients and beneficial microbes contents of the 3-day fermented WRW [8,27], 0-day unfermented WRW and 3-day fermented WRW were selected to be evaluated, alongside the effects of applying conventional NPK fertilizer and a control (only tap water). This second paper aimed to further answer how strong the consecutive application effects (i.e., carryover effects) of WRW are, and where the continuous application of WRW over three consecutive planting cycles on the same soil could affect crop growth, soil chemical, and soil microbial counts. We hypothesized that the use of different soil types and treatments will affect plant growth, plant nutrient contents, and leachate chemical properties. The water productivity (WP) and water use efficiency (WUE) will also vary with the soil types, but the treatments will have no significant effect on the WP and WUE.
Therefore, the objectives of this study were to determine the consecutive application effects of applying unfermented (F0) and 3-day fermented (F3) WRW on: (1) the soil chemical properties, soil bacterial count, and the growth and plant nutrient content of a test crop, choy sum (Brassica chinensis var. parachinensis), grown on three contrasting soil textures (sandy clay loam, silt loam, and clay), (2) nutrient leaching losses from these three soils due to the continuous application of WRW, (3) the crop’s improvement in water use, if any, in terms of its WP and WUE, and (4) the relationship between the soil bacterial count and plant growth parameters. The effects of WRW (both unfermented and fermented) were compared with the effects of applying conventional NPK fertilizer (NPK) and a control (applied only with tap water; CON).
Choy sum (Brassica chinensis var. parachinensis) was used as the test crop in this study because it is a popular vegetable worldwide (especially in Asia and Africa [28,29]). It is also fast growing, easy to maintain, and has a short life cycle.

2. Materials and Methods

2.1. Materials

The treatments used in this study were: 3 days fermented WRW, unfermented WRW, NPK (15:15:15) recommended rate (450 kg ha−1) [30], and tap water labelled as F3, F0, NPK, and CON, respectively. Three distinct soil textures: sandy clay loam, silt loam, and clay soils, were also used as the second factor, due to their different sand and clay contents.

2.2. Washed Rice Water Preparation

The ‘Rambutan’ (Padiberas Nasional Berhad, Malaysia) rice brand was used, a commercially available medium-grained rice in Malaysia. The WRW was prepared in a volumetric water–to–rice (W:R) ratio 3:1. The mixture was obtained using a stand mixer (Bossman Kaden matte BK-100S, Tokyo, Japan), at a washing intensity of 80 rpm (0.357 × g Force) and a constant time of 90 s. The mixture (rice grains and water) was then separated using sieves (500-micron sizes) (Spectrum Technologies, Inc., Aurora, IL, USA). To ferment the WRW for 3 days (F3), the water was kept at room temperature in a container for a 3-day period before use, while the freshly prepared WRW was used as the unfermented WRW (F0).

2.3. Soil Collection and Preparation

The soils (sandy clay loam, silt loamy, and clay) were collected from three different places around Universiti Putra Malaysia (UPM), Faculty of Agriculture complex (2.984761° N, 101.7336° E) at the depth of 0–0.3 m. A preliminary survey was carried out to assess the soil textures before the soil collection. The soils (separately) were collected using shovel and auger (Royal Eijkelkamp, Kuala Lumpur, Netherlands), mixed thoroughly, and air dried in the soil physics laboratory of the UPM’s Faculty of Agriculture for further analysis. In addition, disturbed and undisturbed (using core samplers) soil samples were also collected for the determination of other physical and chemical properties.

2.4. Experimental Site

Choy sum was grown in perforated plastic trays under a rain shelter at University Putra Malaysia Serdang (2.984761° N, 101.7336° E). The experiment was continuous for three consecutive planting cycles (3 months): from 8 September 2021 to 15 December 2021, during which several plant growth and leachate parameters (such as fresh and dry weights, total leaf area of the crop, and leachate nutrient contents) were measured. These same parameters were measured for the second and third cycle. Throughout all planting cycles, the soil in each container was not replaced or discarded, but reused.

2.5. Planting and Treatments Application

Choy sum (Brassica chinensis var. parachinensis) seeds were germinated in a nursery, then transplanted after 10 days to a planter tray with dimensions 55 cm × 45 cm × 35 cm in length, breadth, and height, respectively, and monitored for 30 days before harvest. Each tray contained 40 kg of soil. Six plants were transplanted to each tray, with a plant spacing of 10 by 15 cm. Plastic bags were placed at the bottom of the trays to collect the leachates. Care was taken to minimize evaporation by attaching the plastic bags to the planting trays. NPK fertilizer was applied only once onto the soil surface at the start of each planting cycle. Watering of the plants, irrespective of soil type and treatment, was at the daily rate of 5 mm.

2.6. Plant and Leaching Parameters Determination

Plant growth parameters (namely, fresh and dry weights of shoot and leaf, plant height, number of leaves, and total leaf area) were measured at the end of every planting cycle (after 30 days of transplanting). The leachate per planter tray was collected weekly, and all weekly leachates were pooled together to determine their volume and nutrient contents ( NH 4 + , NO 3 , P, K, Ca, Mg, Cu, Zn, and B) at the end of every planting cycle. The soil volumetric moisture content in every container was measured, prior to plant watering, on a weekly basis using the Field Scout TDR 100-6440FS soil moisture probe (Spectrum Technologies, Aurora, IL, USA) to monitor soil moisture changes.

2.7. Plant Growth and Nutrient Contents Analyses

Leaf chlorophyll content was determined using a portable chlorophyll meter (SPAD-502, Minolta Co. Ltd., Osaka, Japan). The equation given by Cerovic et al. [31] was used to convert the SPAD readings to chlorophyll (Equation (1)).
Chlorophyll   ( µ g   cm 2 ) = 99 SPAD 144 SPAD
Plant harvesting occurred 30 days after transplanting, where all plants in every container were separated from the belowground parts. The total leaf area per plant was measured using the LI–3100 Area meter (LI-COR, Lincoln, NE, USA), and the plant height using a measuring tape.
Plant C, N, and S contents were assayed using CNS Analyzer (LECO Corp., St. Joseph, MI, USA), while the Ca, Mg, K, Cu, Zn, and B contents were determined by the atomic absorption spectrophotometry (AAS) (Perkin Elmer, PinAAcle, 900T, Waltham, MI, USA) after plant tissue had been digested using the dry ashing procedure [32]. Plant P was determined using auto analyzer (AA) (Leachat QuikChem FIA+ 8000 series, ON, Canada).
Water productivity (WP) is the ratio of the total dry weight of the biomass produced by the cumulative transpiration of the plant (Equation (2)), while water use efficiency (WUE) is the amount of water transpired by the plant in relation to the amount of irrigation water added (Equation (3)) [33]:
WP = Total   dry   weight   ( g ) Cumulative   transpiration   ( L )
WUE = Amount   of   water   used   by   the   plants   ( L ) Amount   of   the   irrigation   water   added   ( L )
Transpiration by choy sum was determined by Equation (4) as:
T = I ( L + E + θ )
where T is the transpiration, I is the irrigation, L is the leaching, E is the evaporation, and θ is the change in soil moisture content (all units are in Litre).
Evaporation was calculated every day using planter trays filled with the same soil but without any plants. These trays were watered every day with 5 mm water equivalent. The drainage holes of the trays used for the determination of the soil evaporation were covered to ensure water was lost only from the opening area of the containers. The soil was placed in the glasshouse and measured daily for water loss through evaporation.

2.8. Washed Rice Water Analysis

The fermented (F3) and unfermented (F0) WRW were first filtered through a Whatman 1 filter paper (11 µm size), and then both the F3, F0, and tap water (CON) samples were analyzed for pH, EC, total N, nitrate, ammonia, C, S, P, K, Ca, Mg, Cu, Zn, and B. Total N, C, and S were analyzed using a CNS analyzer (LECO Corp., St. Joseph, MI, USA), and P, K, Ca, Mg, Cu, Zn, and B were analyzed using inductively coupled plasma optical emission spectrophotometry (ICP-OES, Hitachi, Tokyo, Japan). Ammonium and nitrate were determined by the Kjeldahl procedure [34]. pH and EC were measured using the 827 pH and EC lab meter (Metrohm AG, Zurich, Switzerland) [35].

2.9. Soil Analyses

Soil pH was measured in a soil–water suspension with a soil: water ratio of 1:2.5 [35] using the 827 pH lab meter (Metrohm AG, Zurich, Switzerland). Soil total C and N were measured by the combustion method [36] using the Leco CR−412 Carbon Determinator (LECO Corp., St. Joseph, MI, USA). The contents of exchangeable bases (K, Ca, and Mg) and cation exchange capacity (CEC) were assessed by AAS (Perkin Elmer, PinAAcle, 900T, Waltham, MI, USA) and AA (Leachat QuikChem FIA+ 8000 series, ON, Canada), respectively, after being extracted by the leaching method using neutral 1 M ammonium acetate (NH4OAc) solution [37]. Soil P was extracted using the Bray II method [38] and determined using a spectrophotometer (Agilent Technologies 8453 7 Cuvette UV Vis Spectrophotometer, Boston, MA, USA). Soil particle size analysis was determined by the pipette method [39]. The soil water retention curve for matric potentials 0.0 to −1.5 MPa was measured by the pressure plate method [40]. Soil water content at saturation, field capacity, and the permanent wilting point is considered as the amount of water held in the soil at 0.0, −0.33, and −1.5 MPa, respectively. The total bacterial population was determined from the three soil types after each planting cycle according to the method described by Tan et al. [41]. After every harvest, each soil type under each treatment was serially diluted and grown on Tryptic Soy Agar (TSA) and incubated for 24 h. Subsequently, the bacterial growth from each plate was counted to determine the bacterial population [42].

2.10. Experimental Design and Data Analysis

The experimental design used was a factorial in a completely randomized design (CRD) with repeated measurements [43]. The factors were evaluated as follows: F3, F0, NPK, and CON as factor 1 (4 levels of fertilizer), and three different soil types (sandy clay loam, silt loam and clay) as factor 2. The treatment combinations were replicated 3 times; consequently, a total of 36 (4 × 3 × 3) experimental units were obtained. Data collected were analyzed by analysis of variance (ANOVA) using the Minitab (v20) software package (Pennsylvania State University, State College, PA, USA). Significant treatment means were separated by the Tukey’s (HSD) test procedure at the 5% level.

3. Results

3.1. Washed Rice Water and Soil Properties

F3 had higher nutrient contents by 9 to 247% relative to F0 (Table 1). The highest increase was in P and Zn, while the least was in S. However, F0 had a relatively higher C, by 32%, as compared to F3. Therefore, all elements’ (except C) content in WRW increased with fermentation. The three soil types used also varied in their nutrient contents in the order: clay > sandy clay loam > silt loam (Table 2). However, the sandy clay loam soil had the least water retention than clay and silt loam soils.
The amount of nutrients introduced into each tray by the treatments over the 90-day period is shown in Table 3. In total, over the 90 days, F3 added higher N and P by 21 and 40%, and 61 and 131%, than the NPK and F0 treatments, respectively. However, the NPK treatment introduced 44 and 27% higher K than the F0 and F3, respectively. All treatments were higher by between 240 and 500% than the amount added by the CON (only tap water).

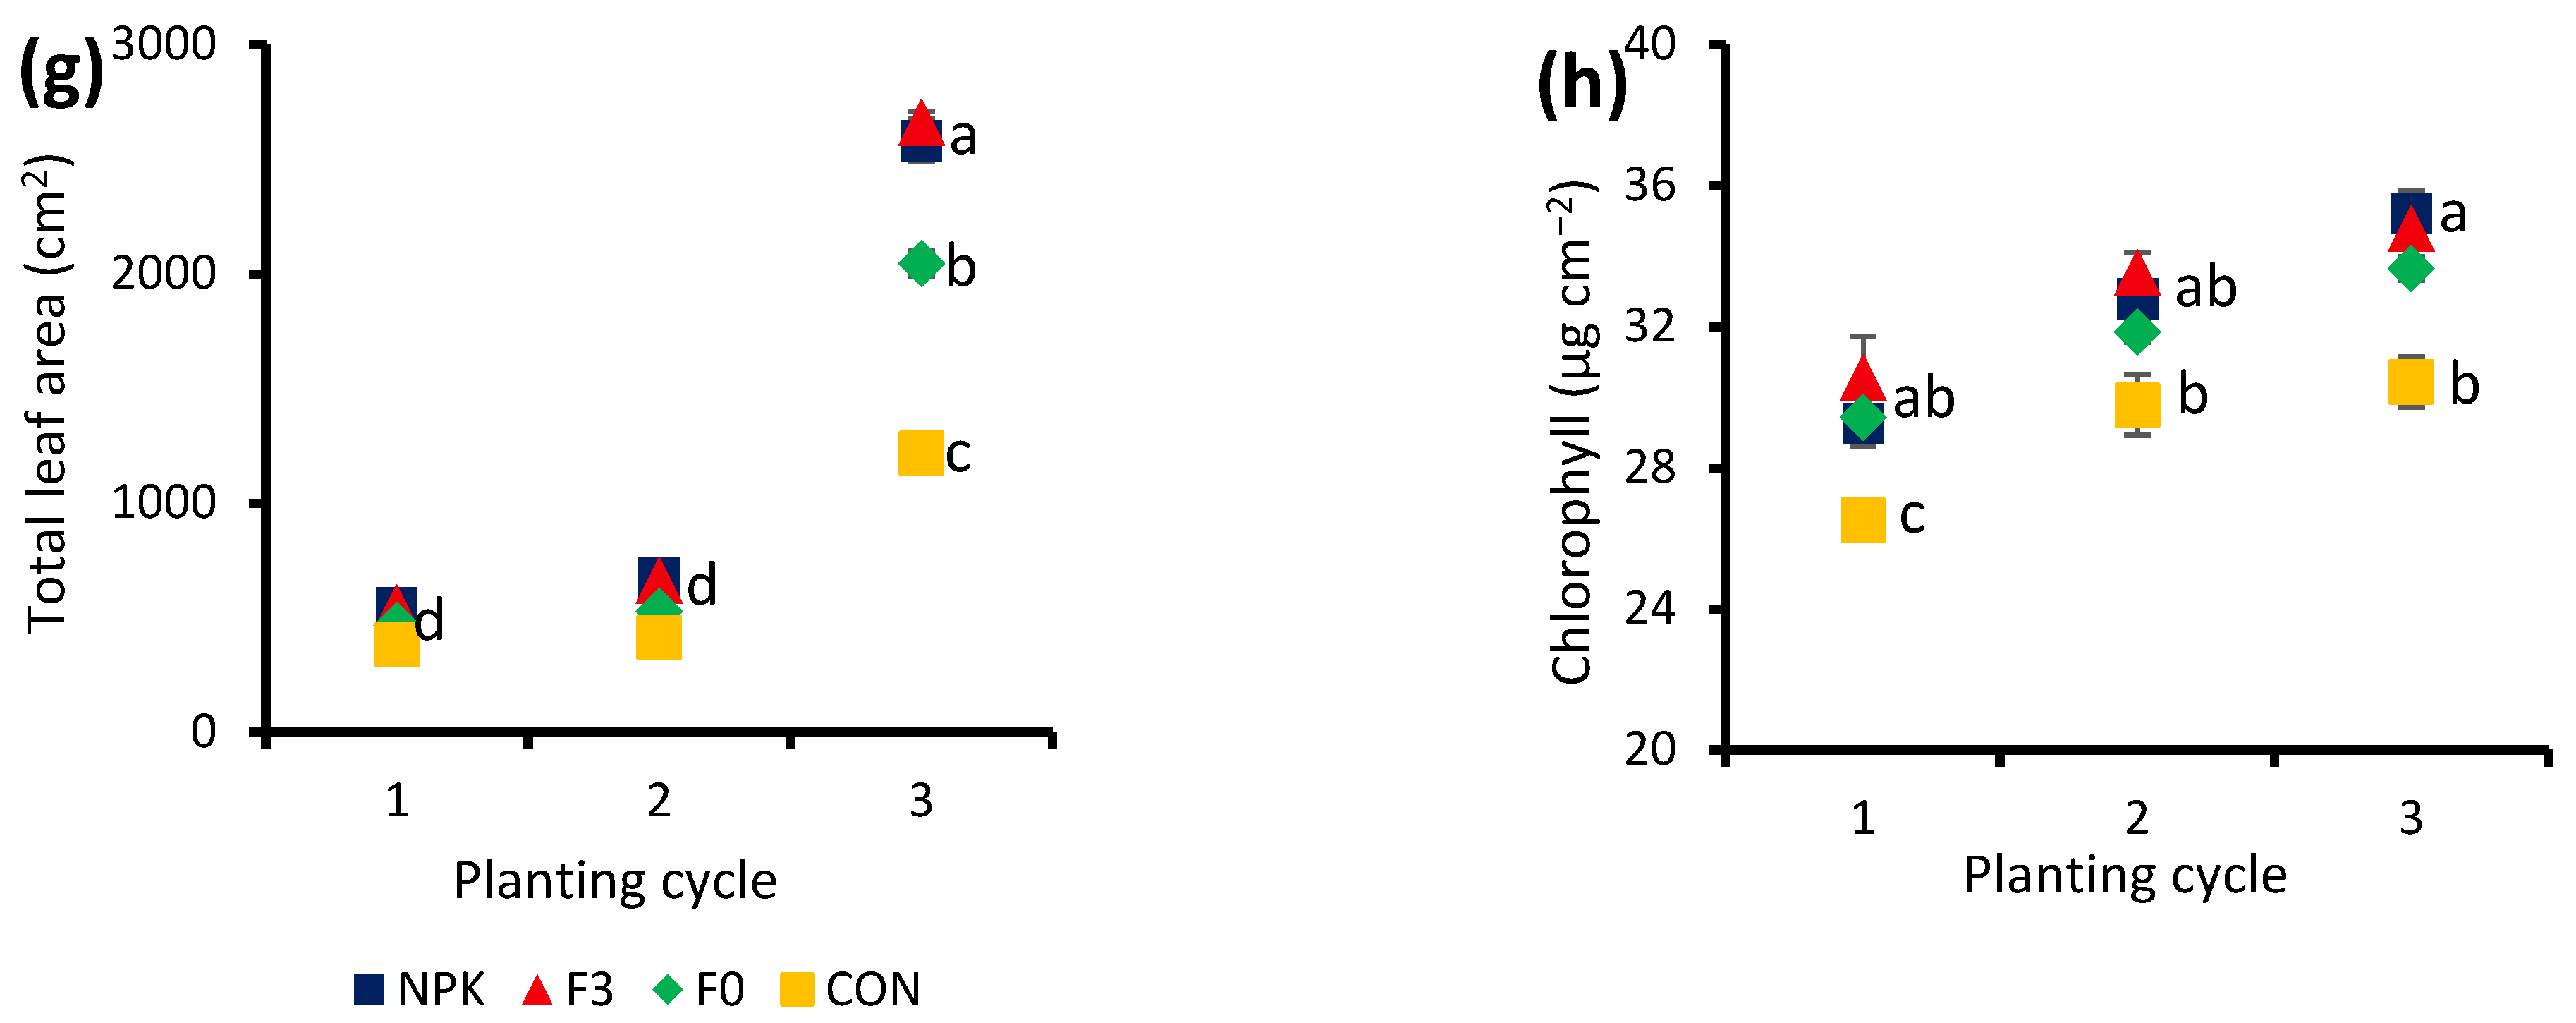
3.2. Effect of Soil Types, Treatments, and Planting Cycles on Plant Growth Parameters

Significantly (p < 0.01) higher plant growth parameters, irrespective of the soil type, were generally observed in both the NPK and F3 treatments, while the lowest was in CON (Table 4). Plant growth in silt loam was the lowest for all treatments. The effects of the NPK and F3 on the plant growth parameters were mostly comparable with one another on clay and sandy clay loam soils. Both these treatments in clay soil had a higher leaf fresh weight, leaf dry weight, and total leaf area by 5 to 34%, 12 to 57%, and 6 to 61%, respectively, compared with their performance in the other soil types. In comparison with the other treatments, NPK and F3 produced higher plant growth across all the three soil types.
Plant growth parameters increased with successive planting cycles for nearly all treatments (Figure 1). In other words, nearly all the treatments (including CON) produced the highest plant growth parameters in the third planting cycle, but it was the F3 that produced the significantly highest plant shoot dry and fresh weights, by 27 and 65%, respectively, higher than the other treatments, while the NPK had the significantly highest leaf fresh and dry weights. In the third planting cycle, the NPK had higher leaf fresh and dry weights, by 12 to 46%, than in the F3, F0, and CON treatments. F3 and NPK were on par with each other in terms of all other plant growth parameters, while CON had the least effect.

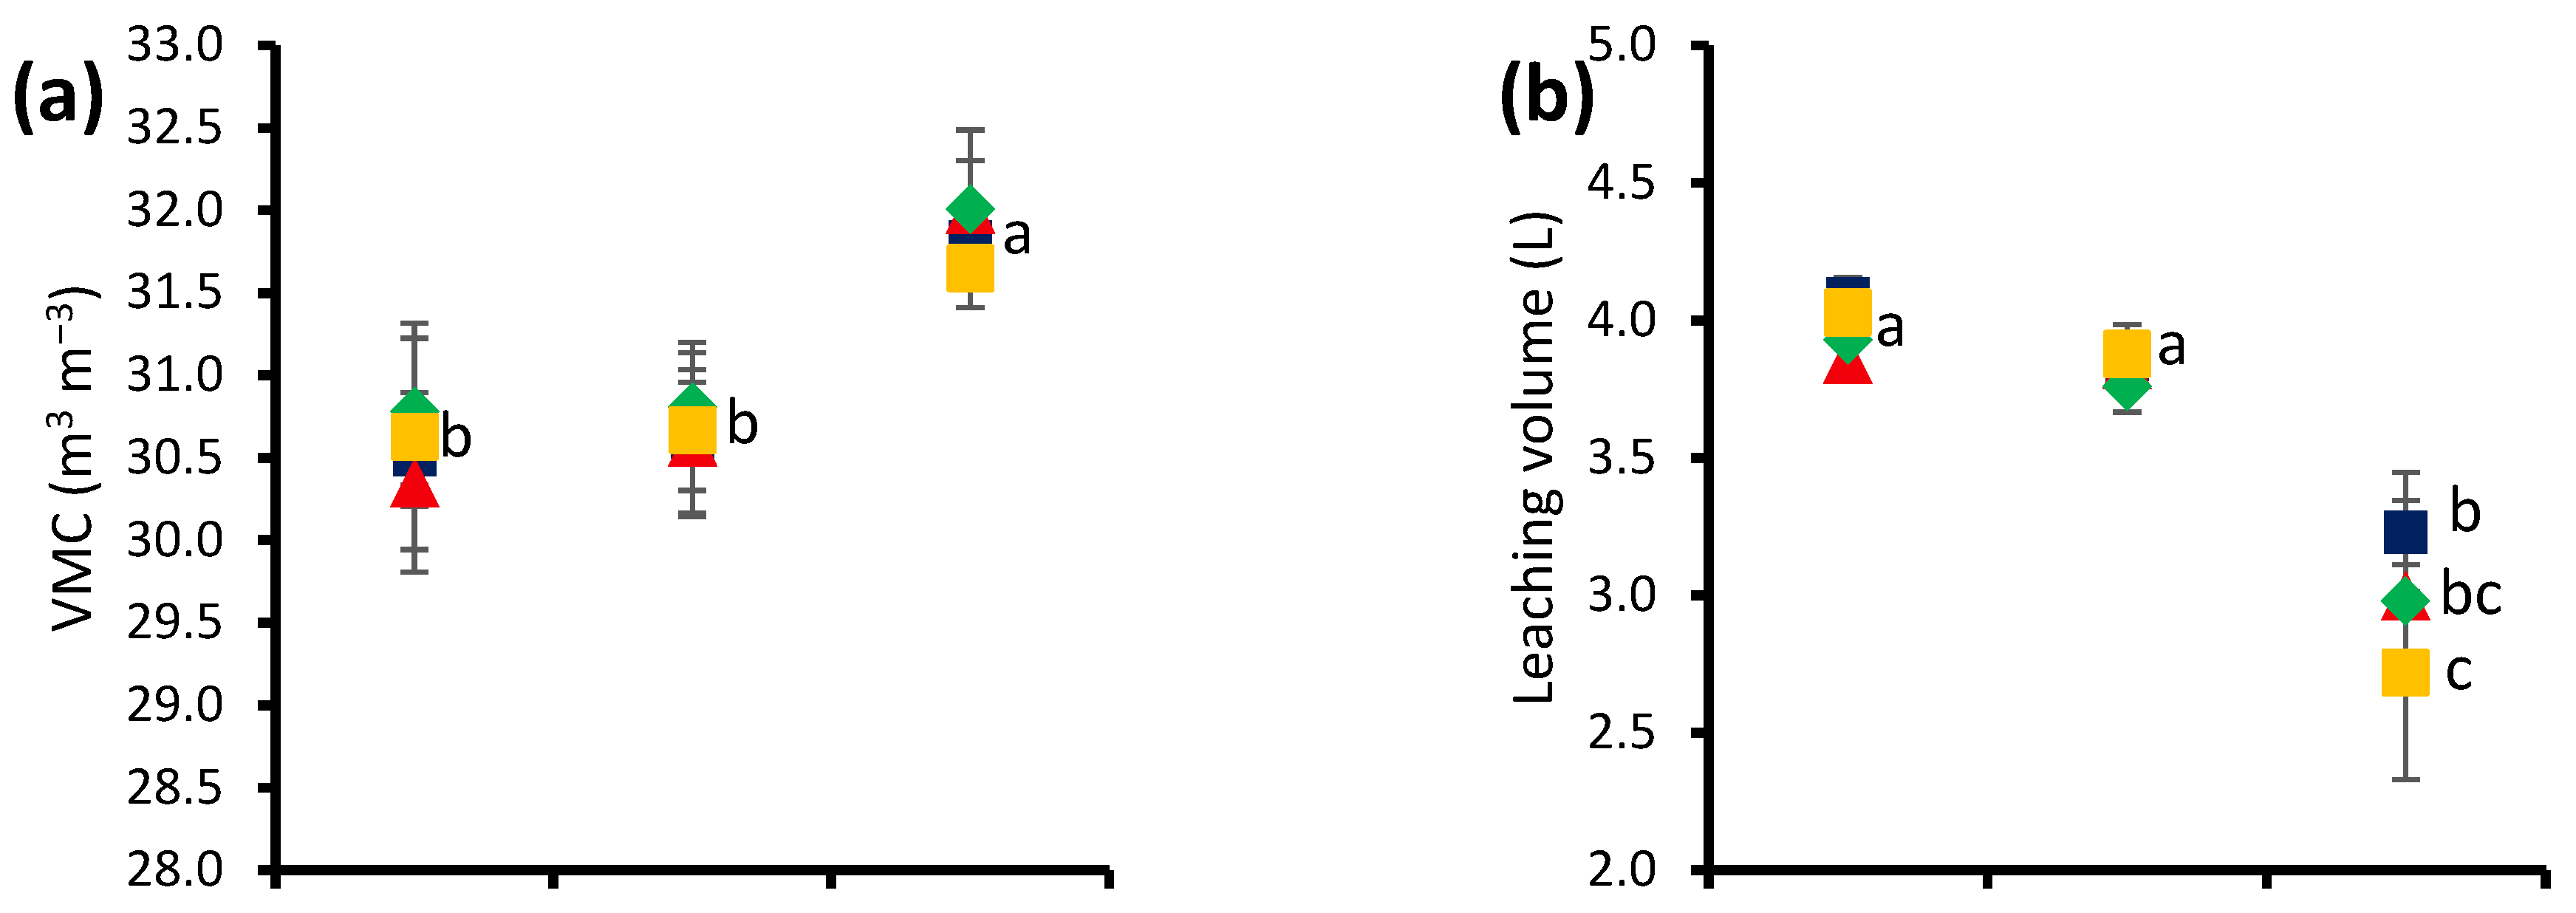
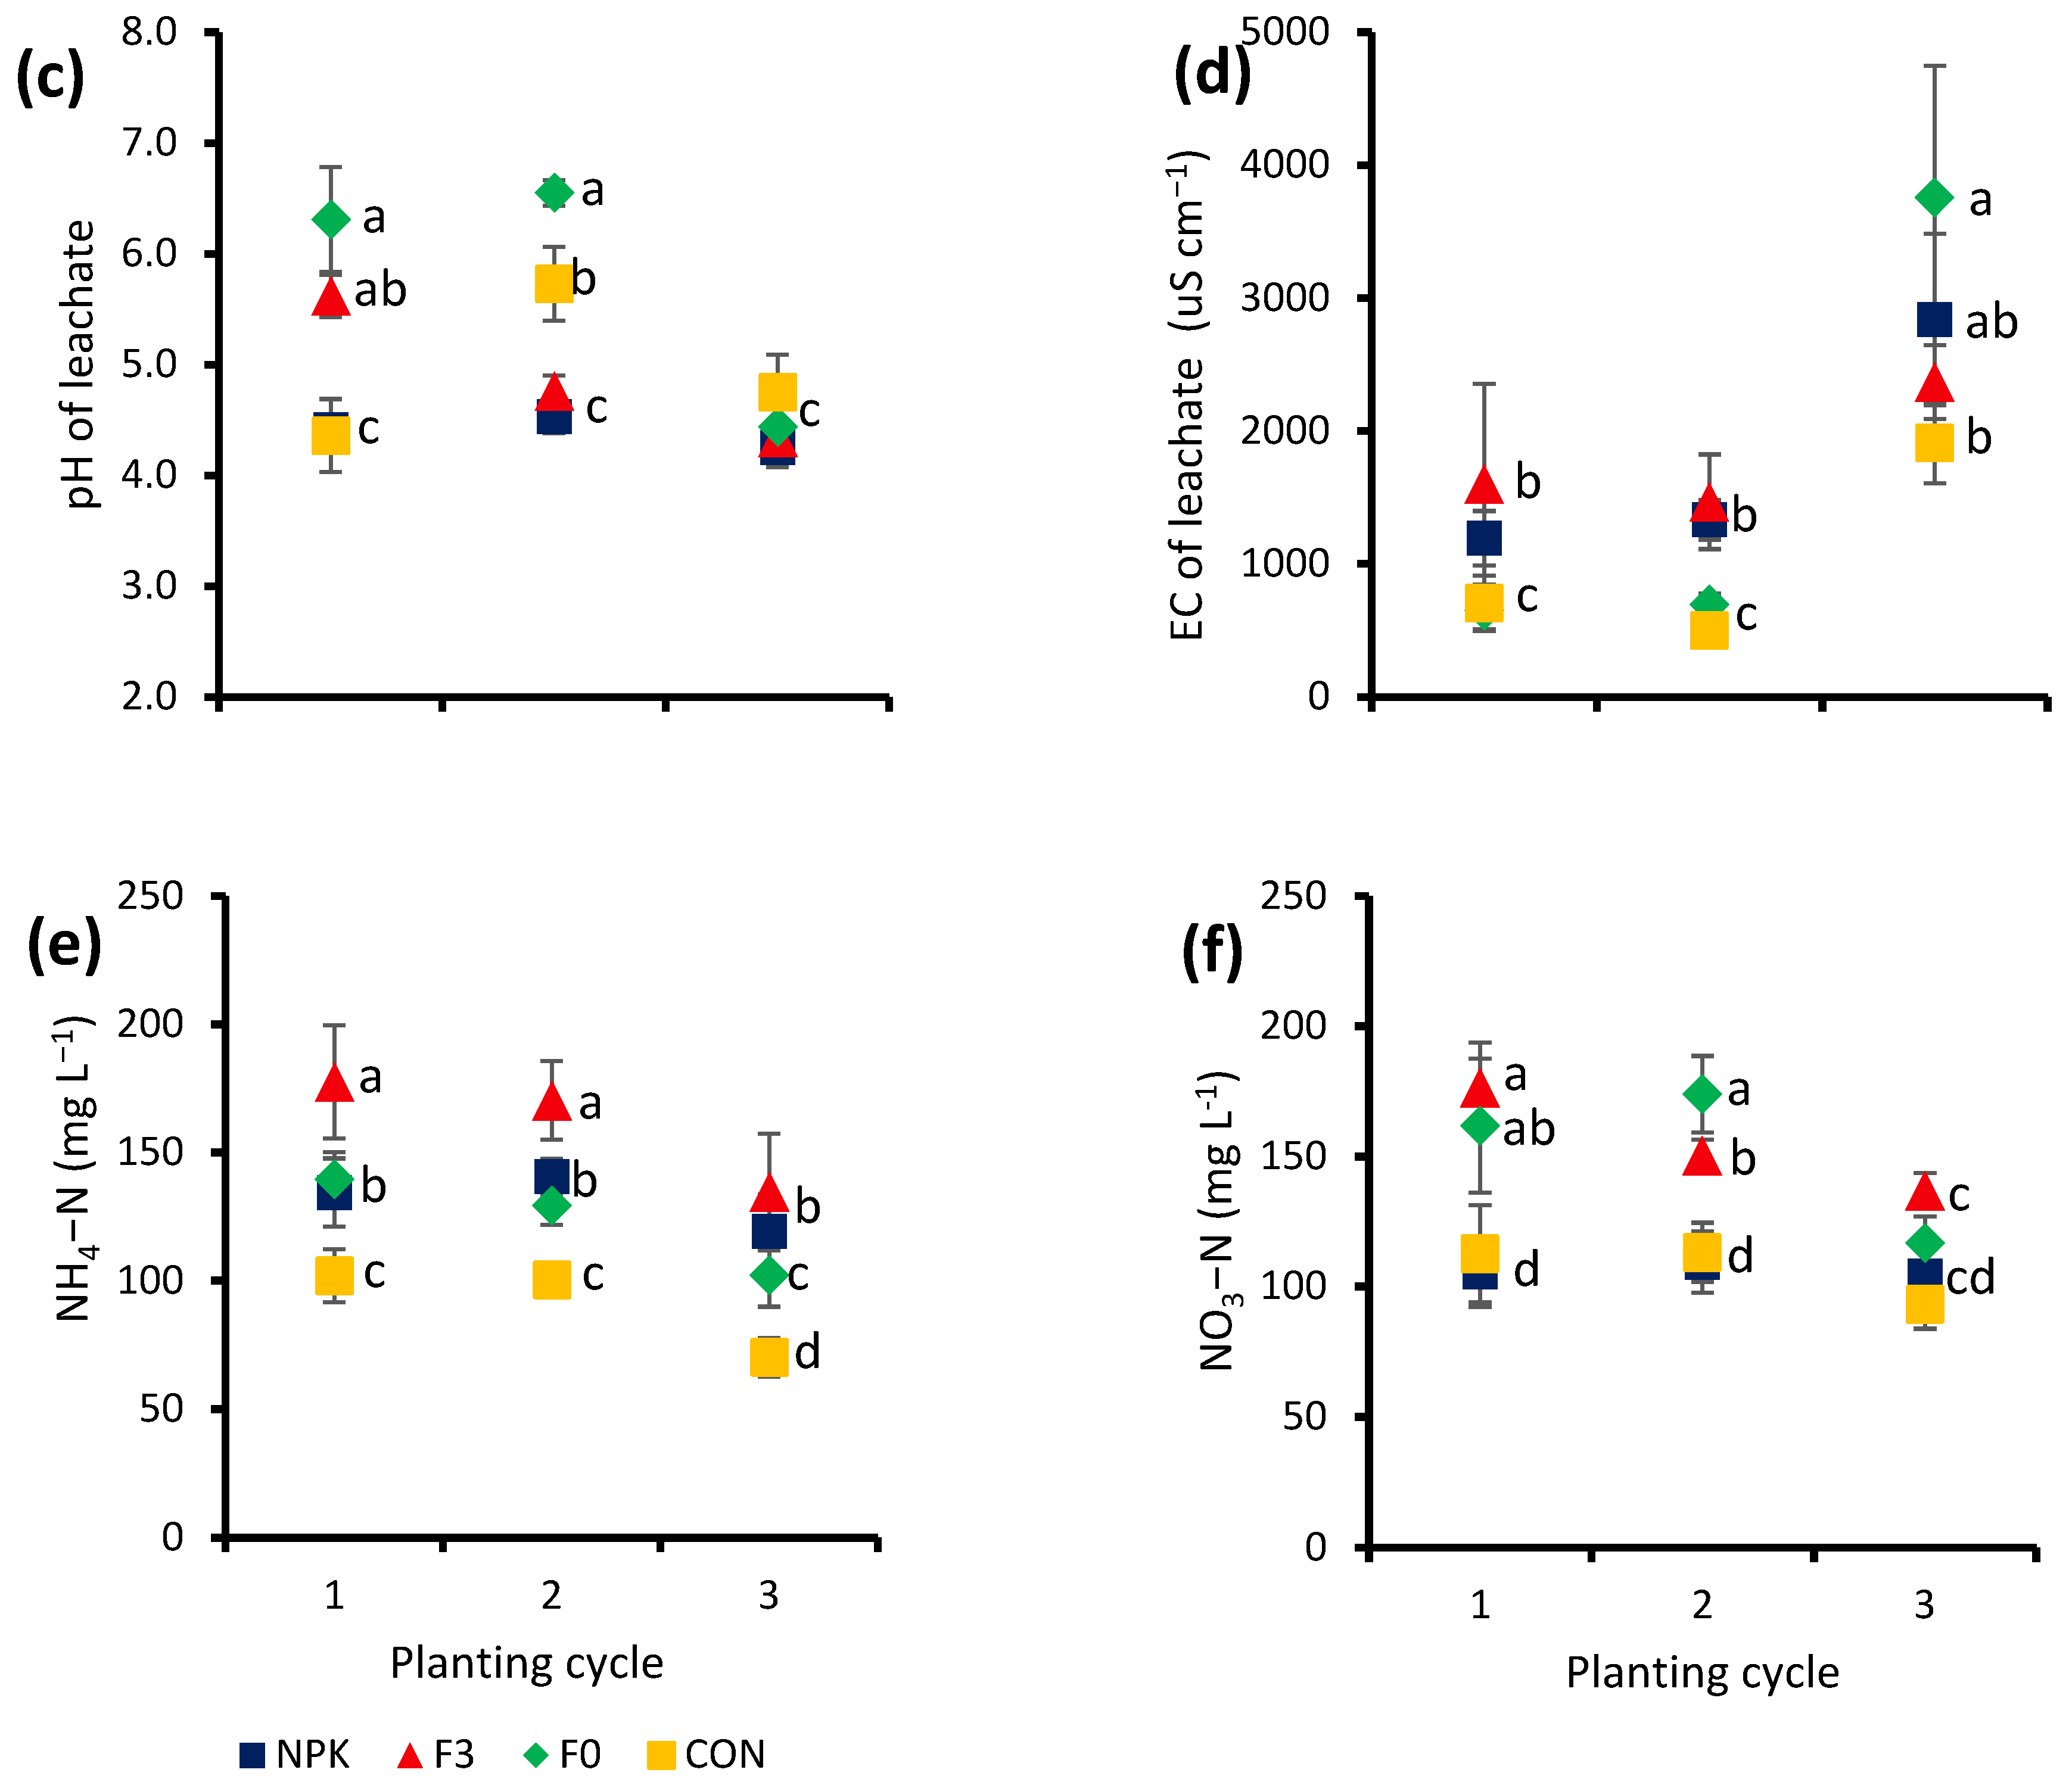
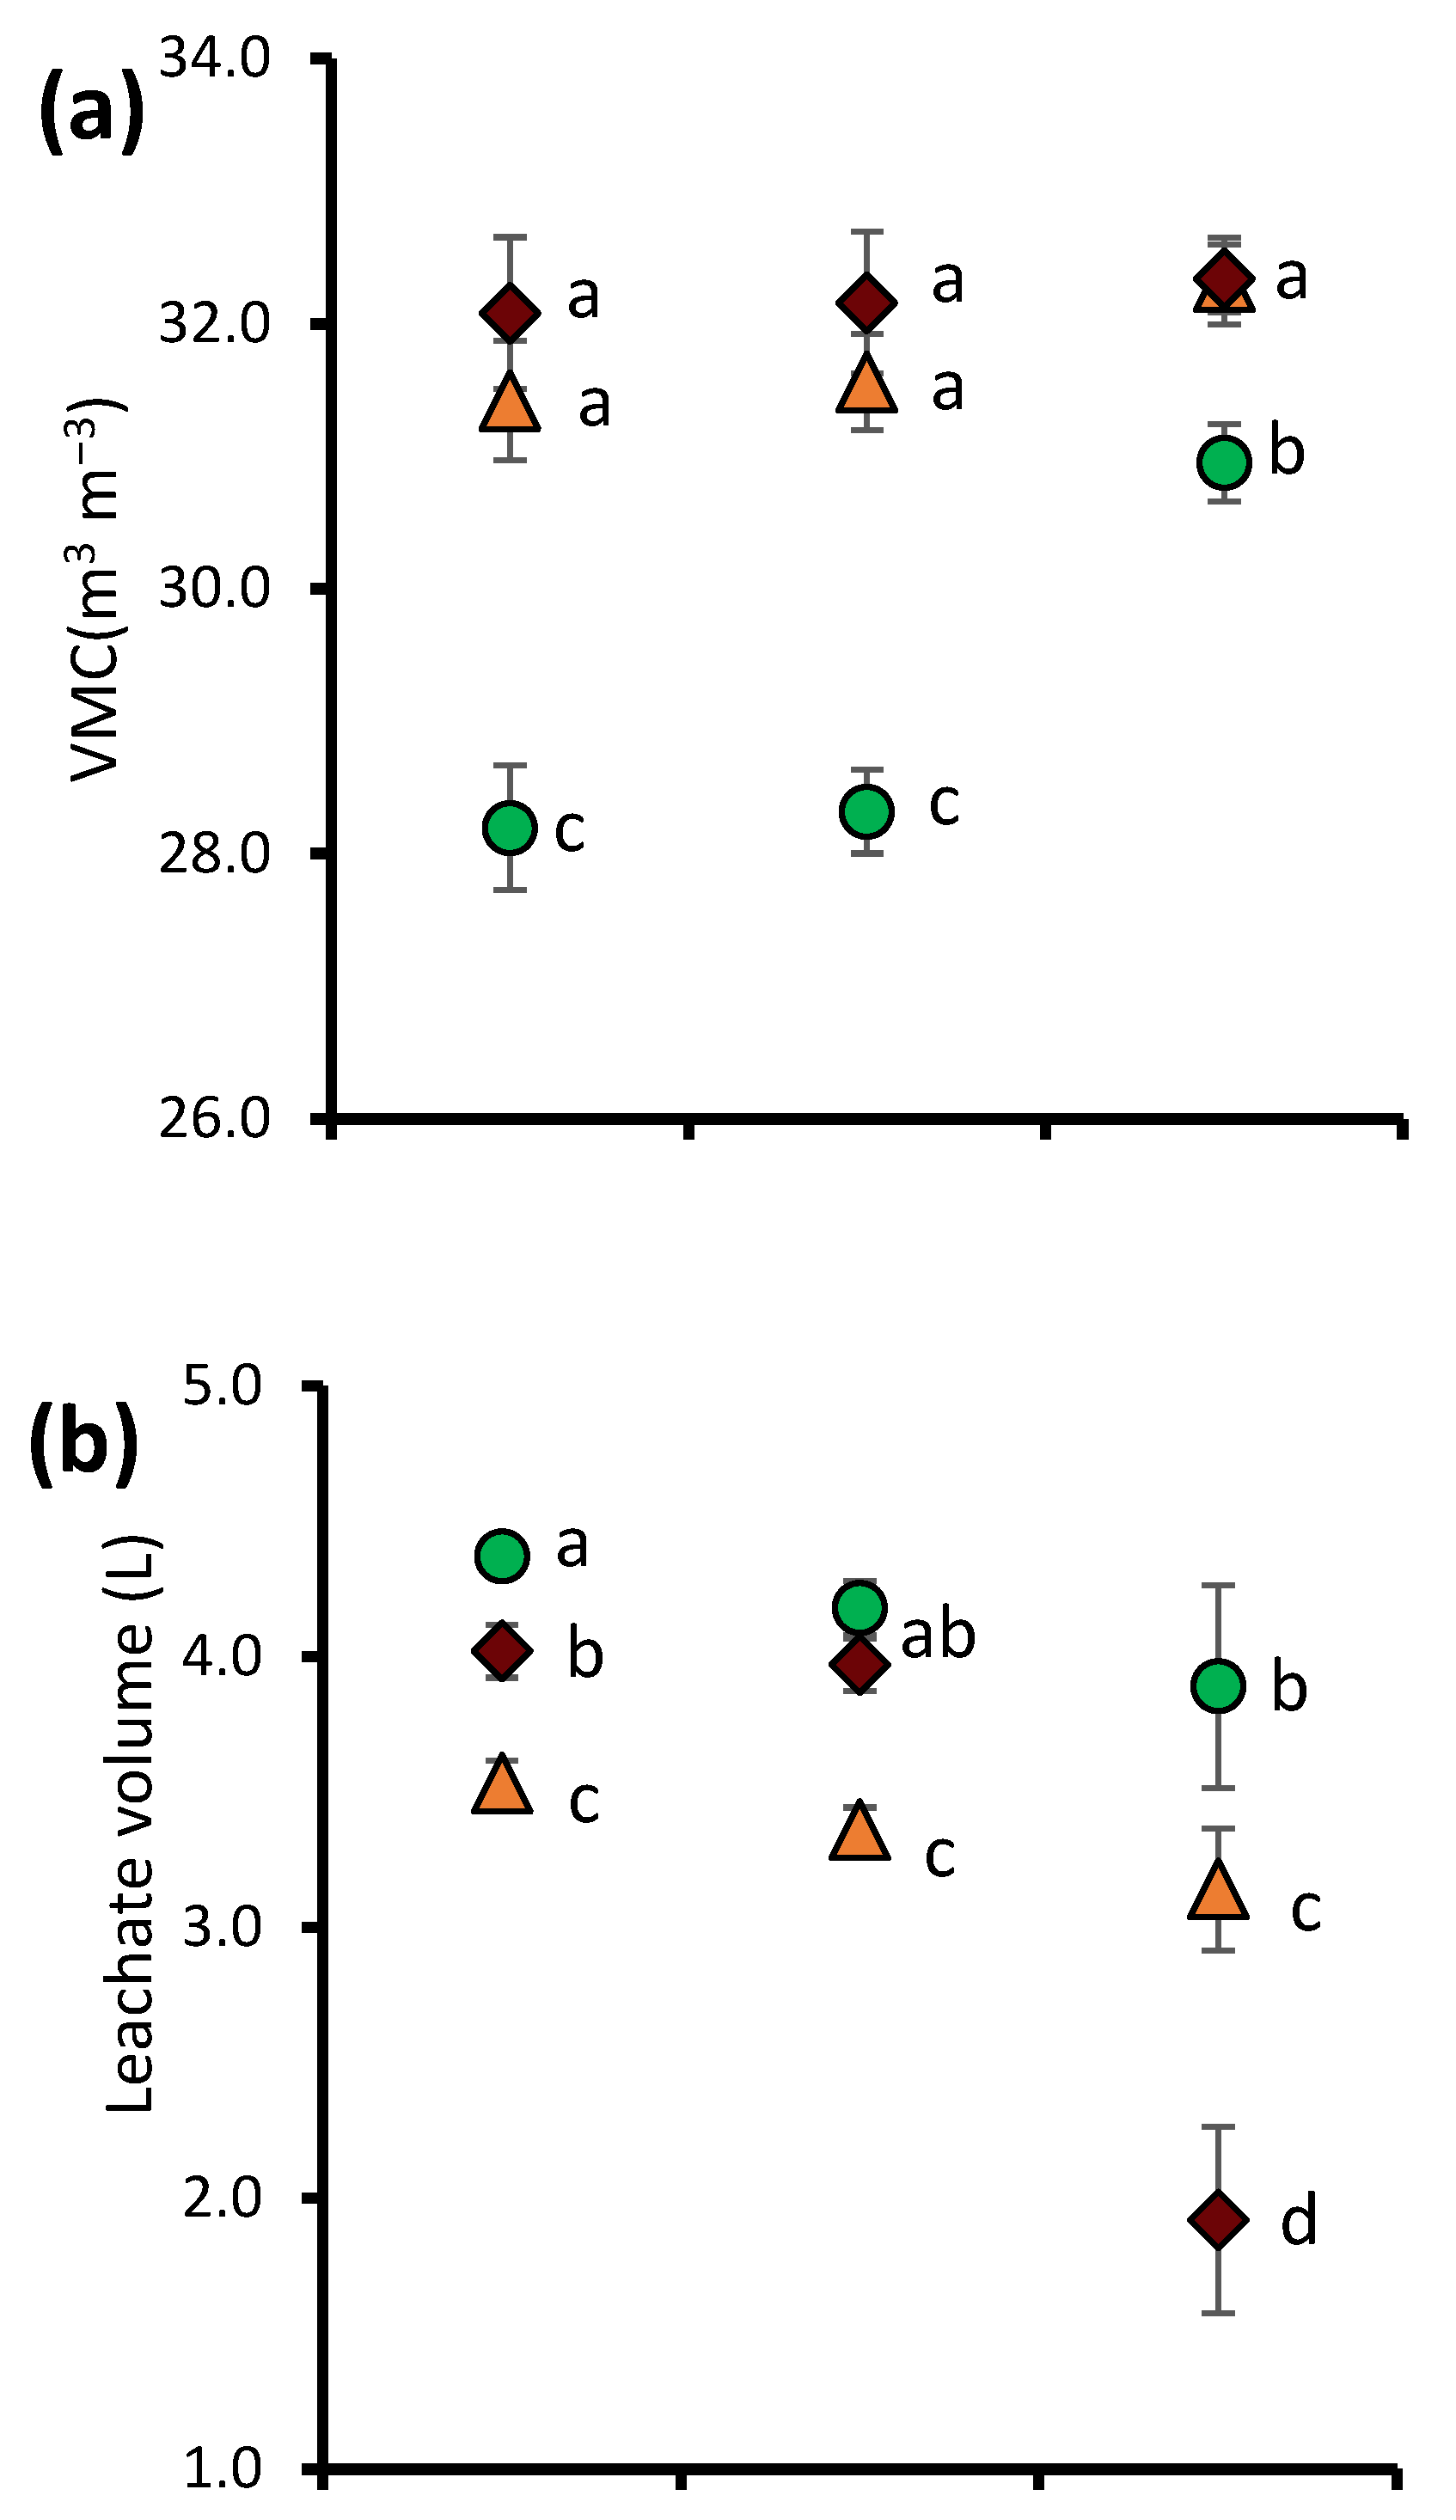
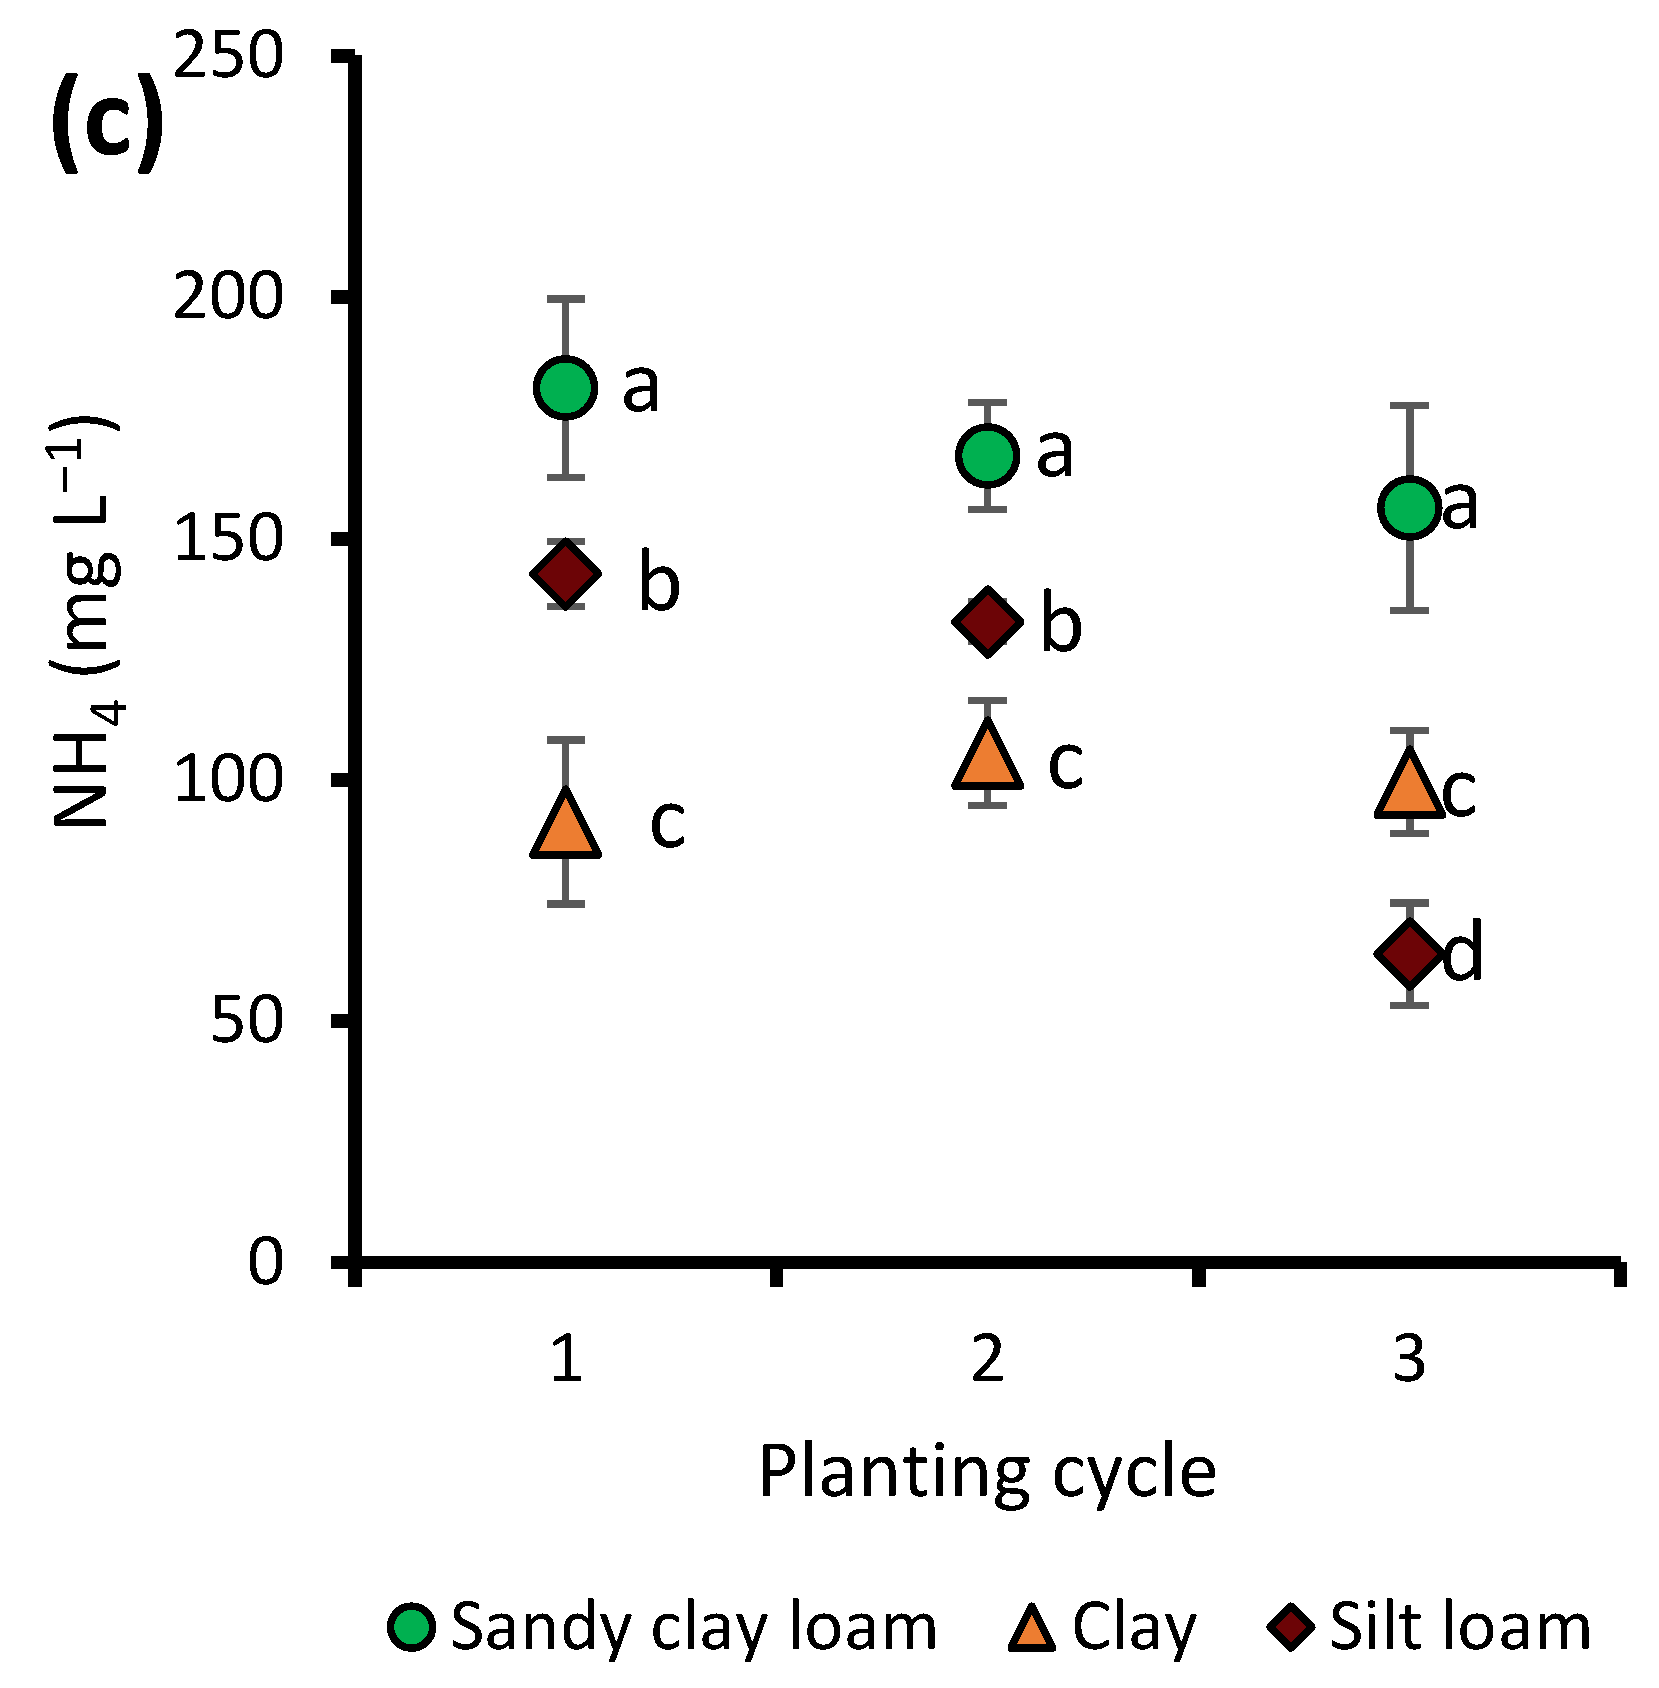
3.3. Nutrients Leaching and Soil Moisture

The contents of NH 4 + , NO 3 , volume, and pH of the leachate decreased with successive planting cycles for all treatments (Figure 2). The highest NH 4 + and NO 3   leachings were obtained in F3 and F0, respectively, where they were higher by 37 to 259% and 13 to 34%, respectively, relative to the other treatments. In contrast, the EC and pH of the leachate increased with planting cycles for all treatments, with the highest in F0 and the lowest in CON. With successive planting cycles, the NPK and F3 treatments had 31% lower leachate pH than F0 and CON. There was no significant interaction effect either between soil types and treatments or between soil type and planting cycles on the EC, P, K, Ca, Mg, Cu, Zn, and B leaching. However, levels of P, K, Ca, Mg, Cu, Zn, and B in the leachate decreased with successive planting cycles. Significant differences were only observed between the soil types in terms of soil VMC, leachate volume, and NH 4 + contents (Figure 3). The silt loam soil had a higher VMC, which did not differ significantly from the clay soil, but the two differed significantly (p < 0.01) from the sandy clay loam soil, which had the least VMC by 9 to 14%, in the third planting cycle (Figure 3 and Table 5).
The sandy clay loam soil had a significantly (p < 0.01) higher leachate volume in all the planting cycles, which decreased with successive planting cycles. In the third planting cycle, the total volume of leachate was in the order of sandy clay loam > clay > silt loam. The sandy clay loam soil had 19% higher leachate volume than the clay soil. The sandy clay loam had higher NH 4 + leaching, by 21 and 50%, 21 and 37%, and 51 and 36% in the first, second, and third planting cycle, respectively, than in silt loam and clay soils. However, for all the soil types, there was a general decrease in the NH 4 + leaching with successive planting cycles.

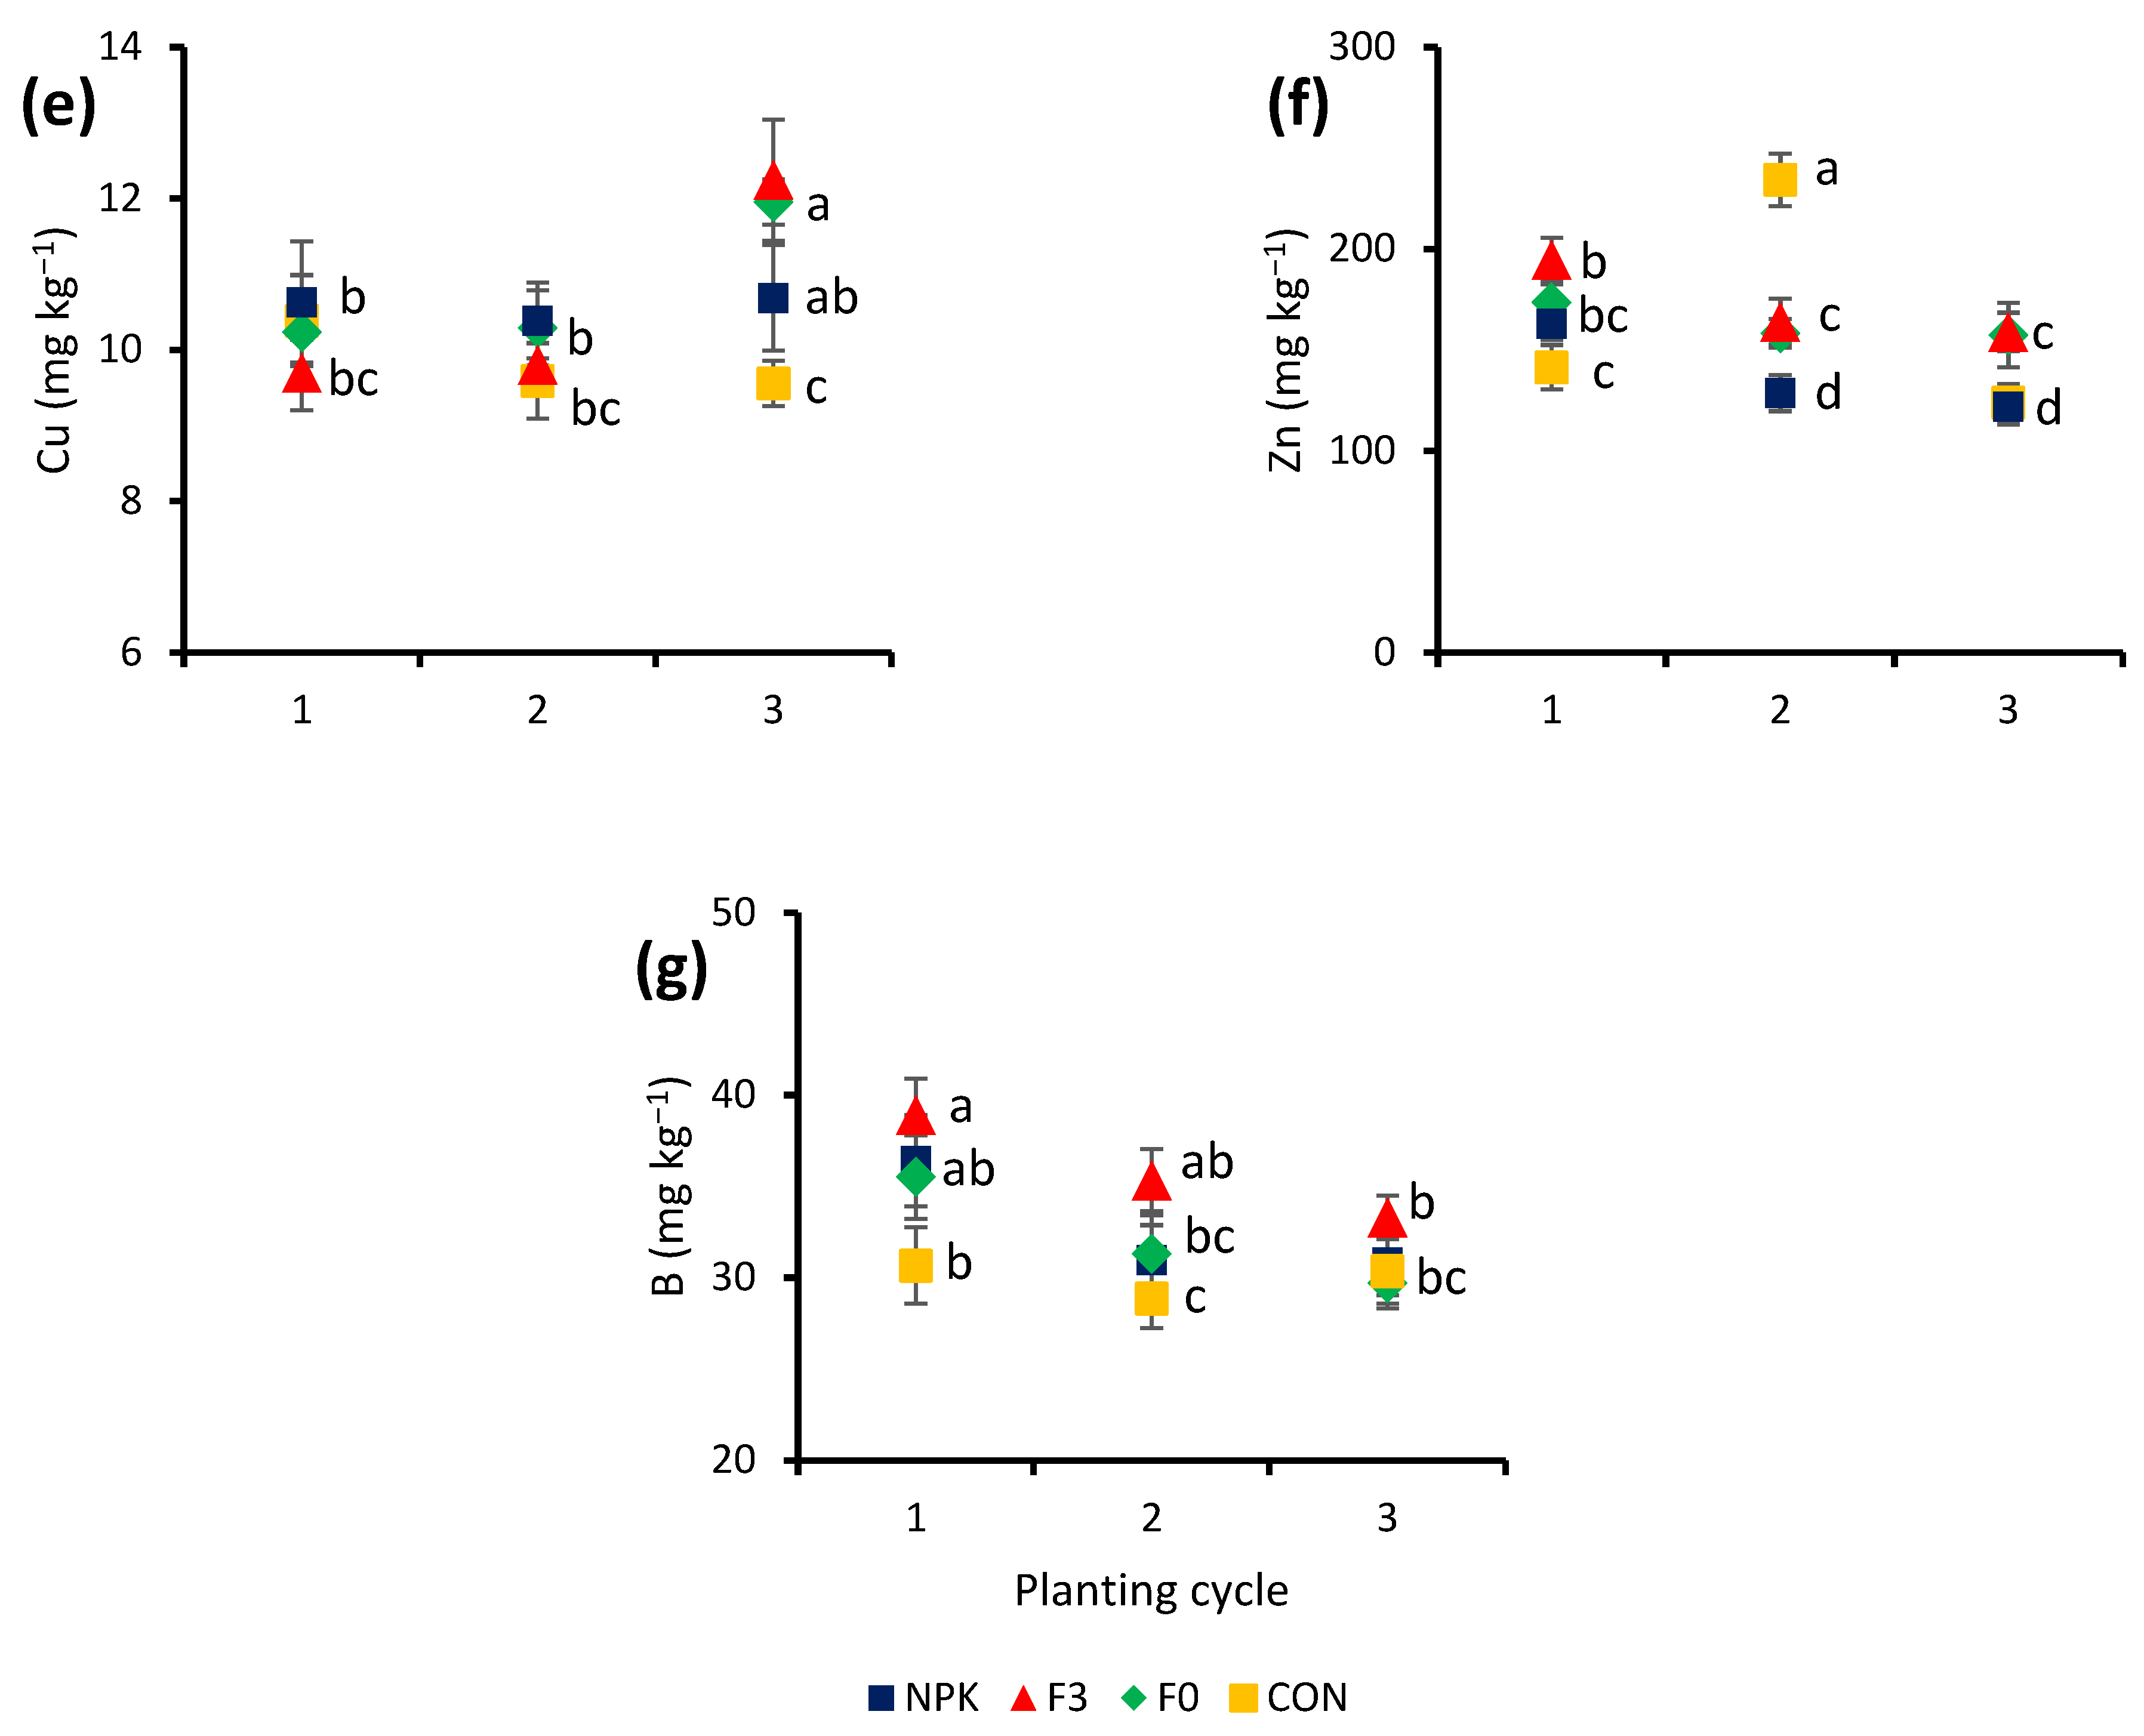
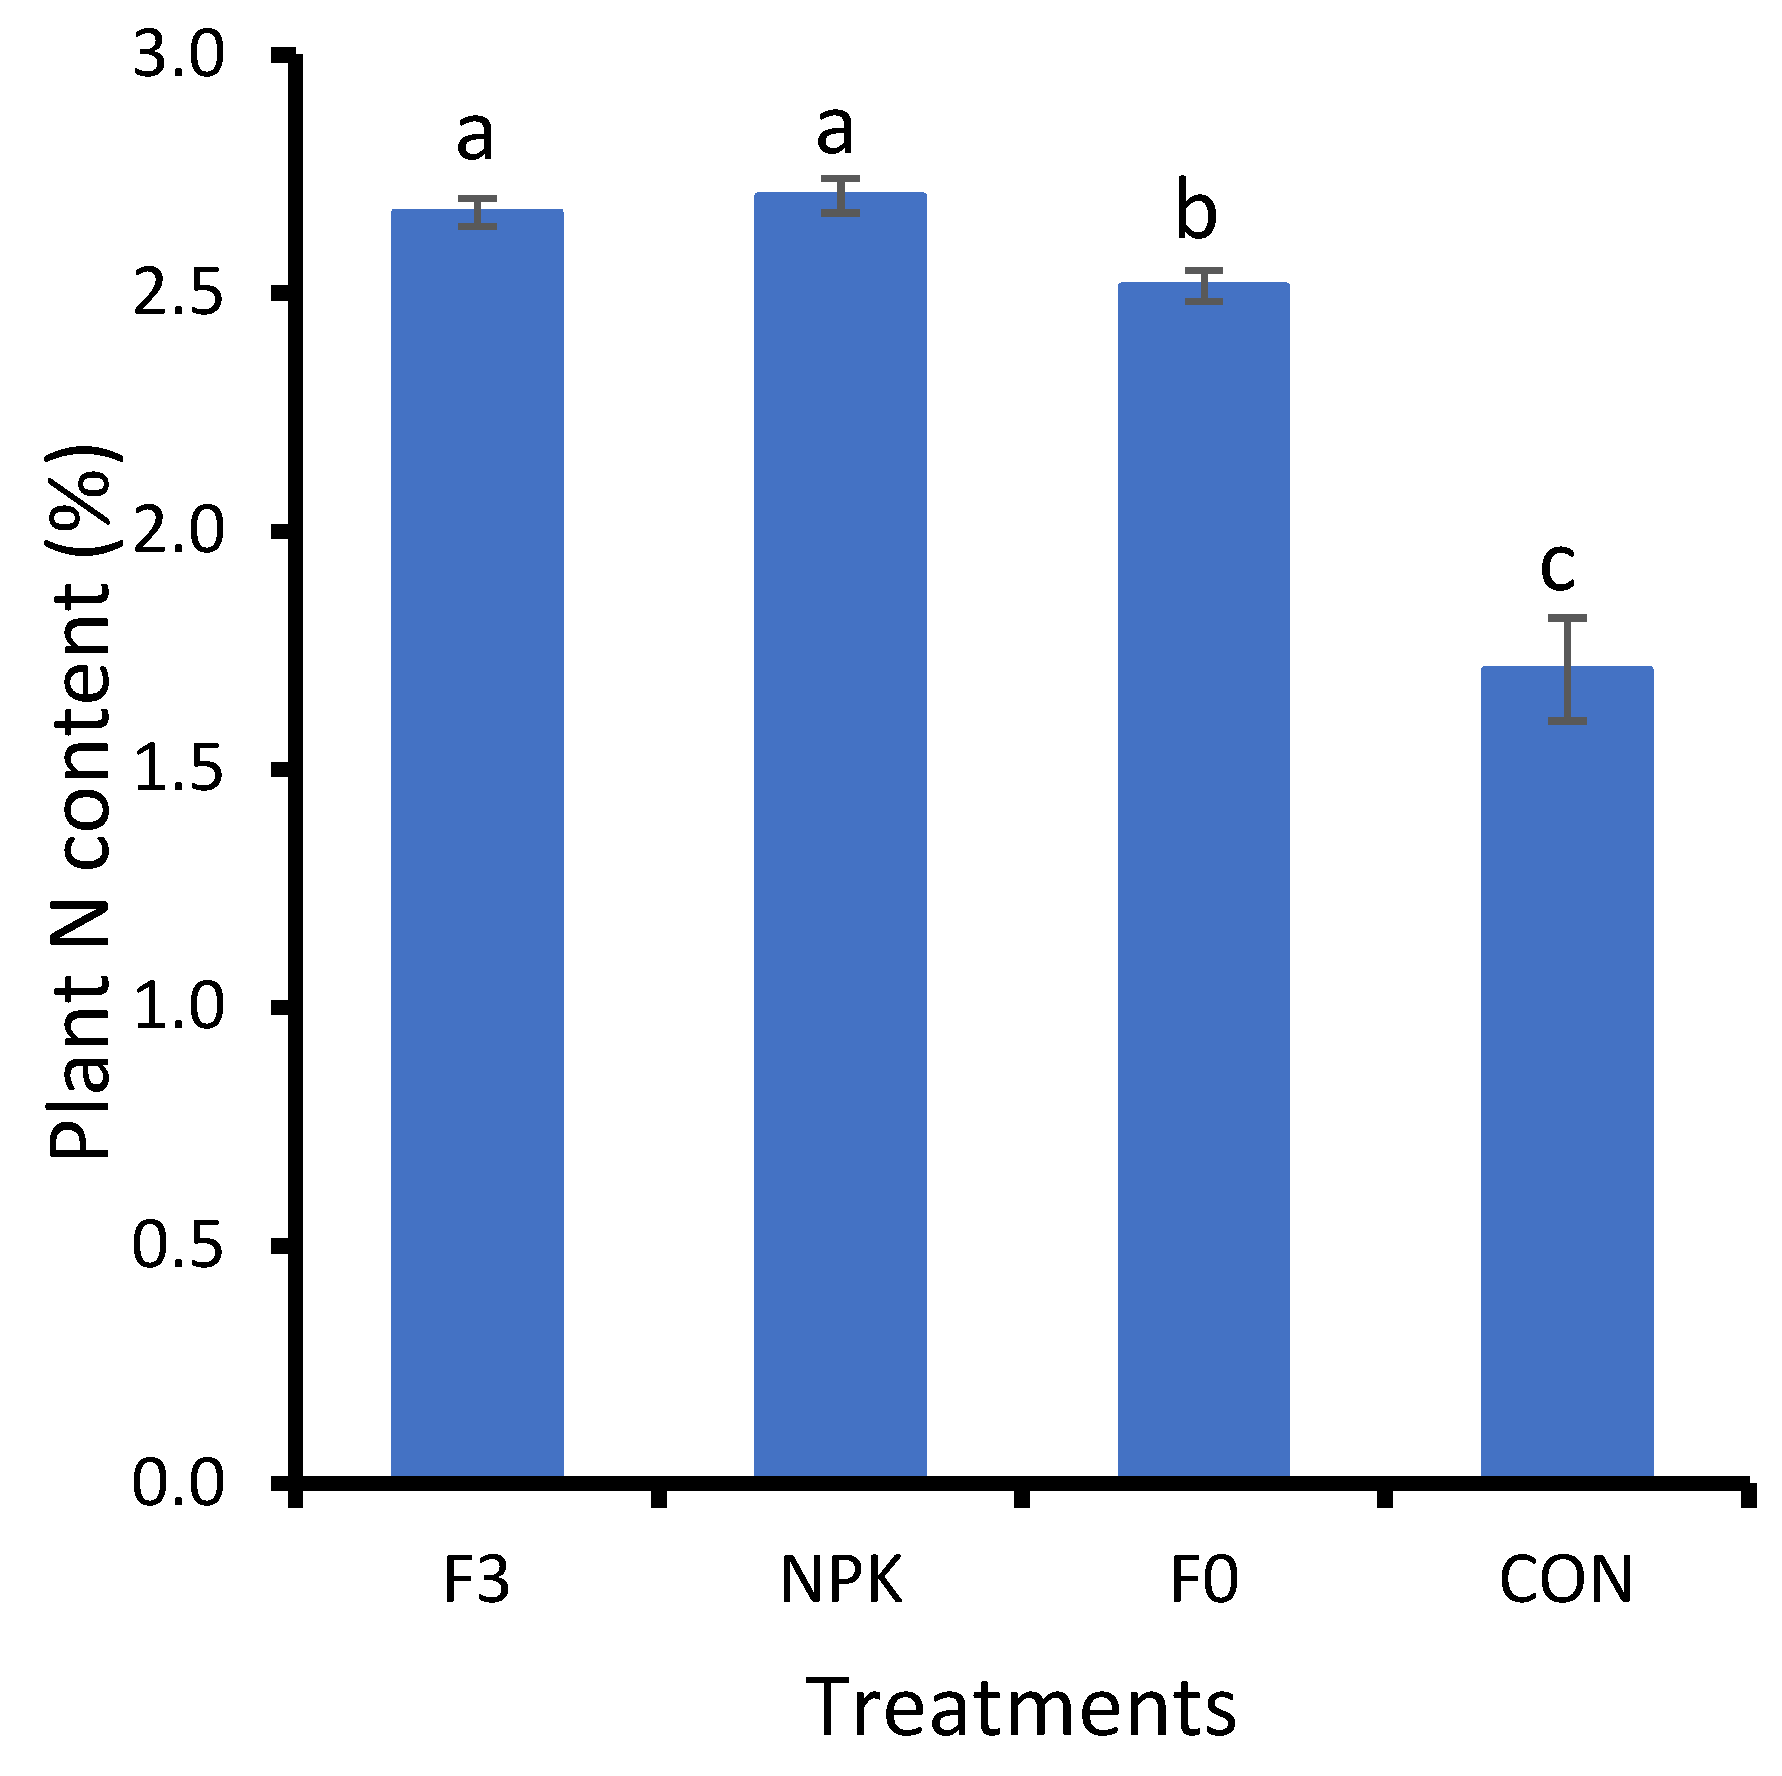
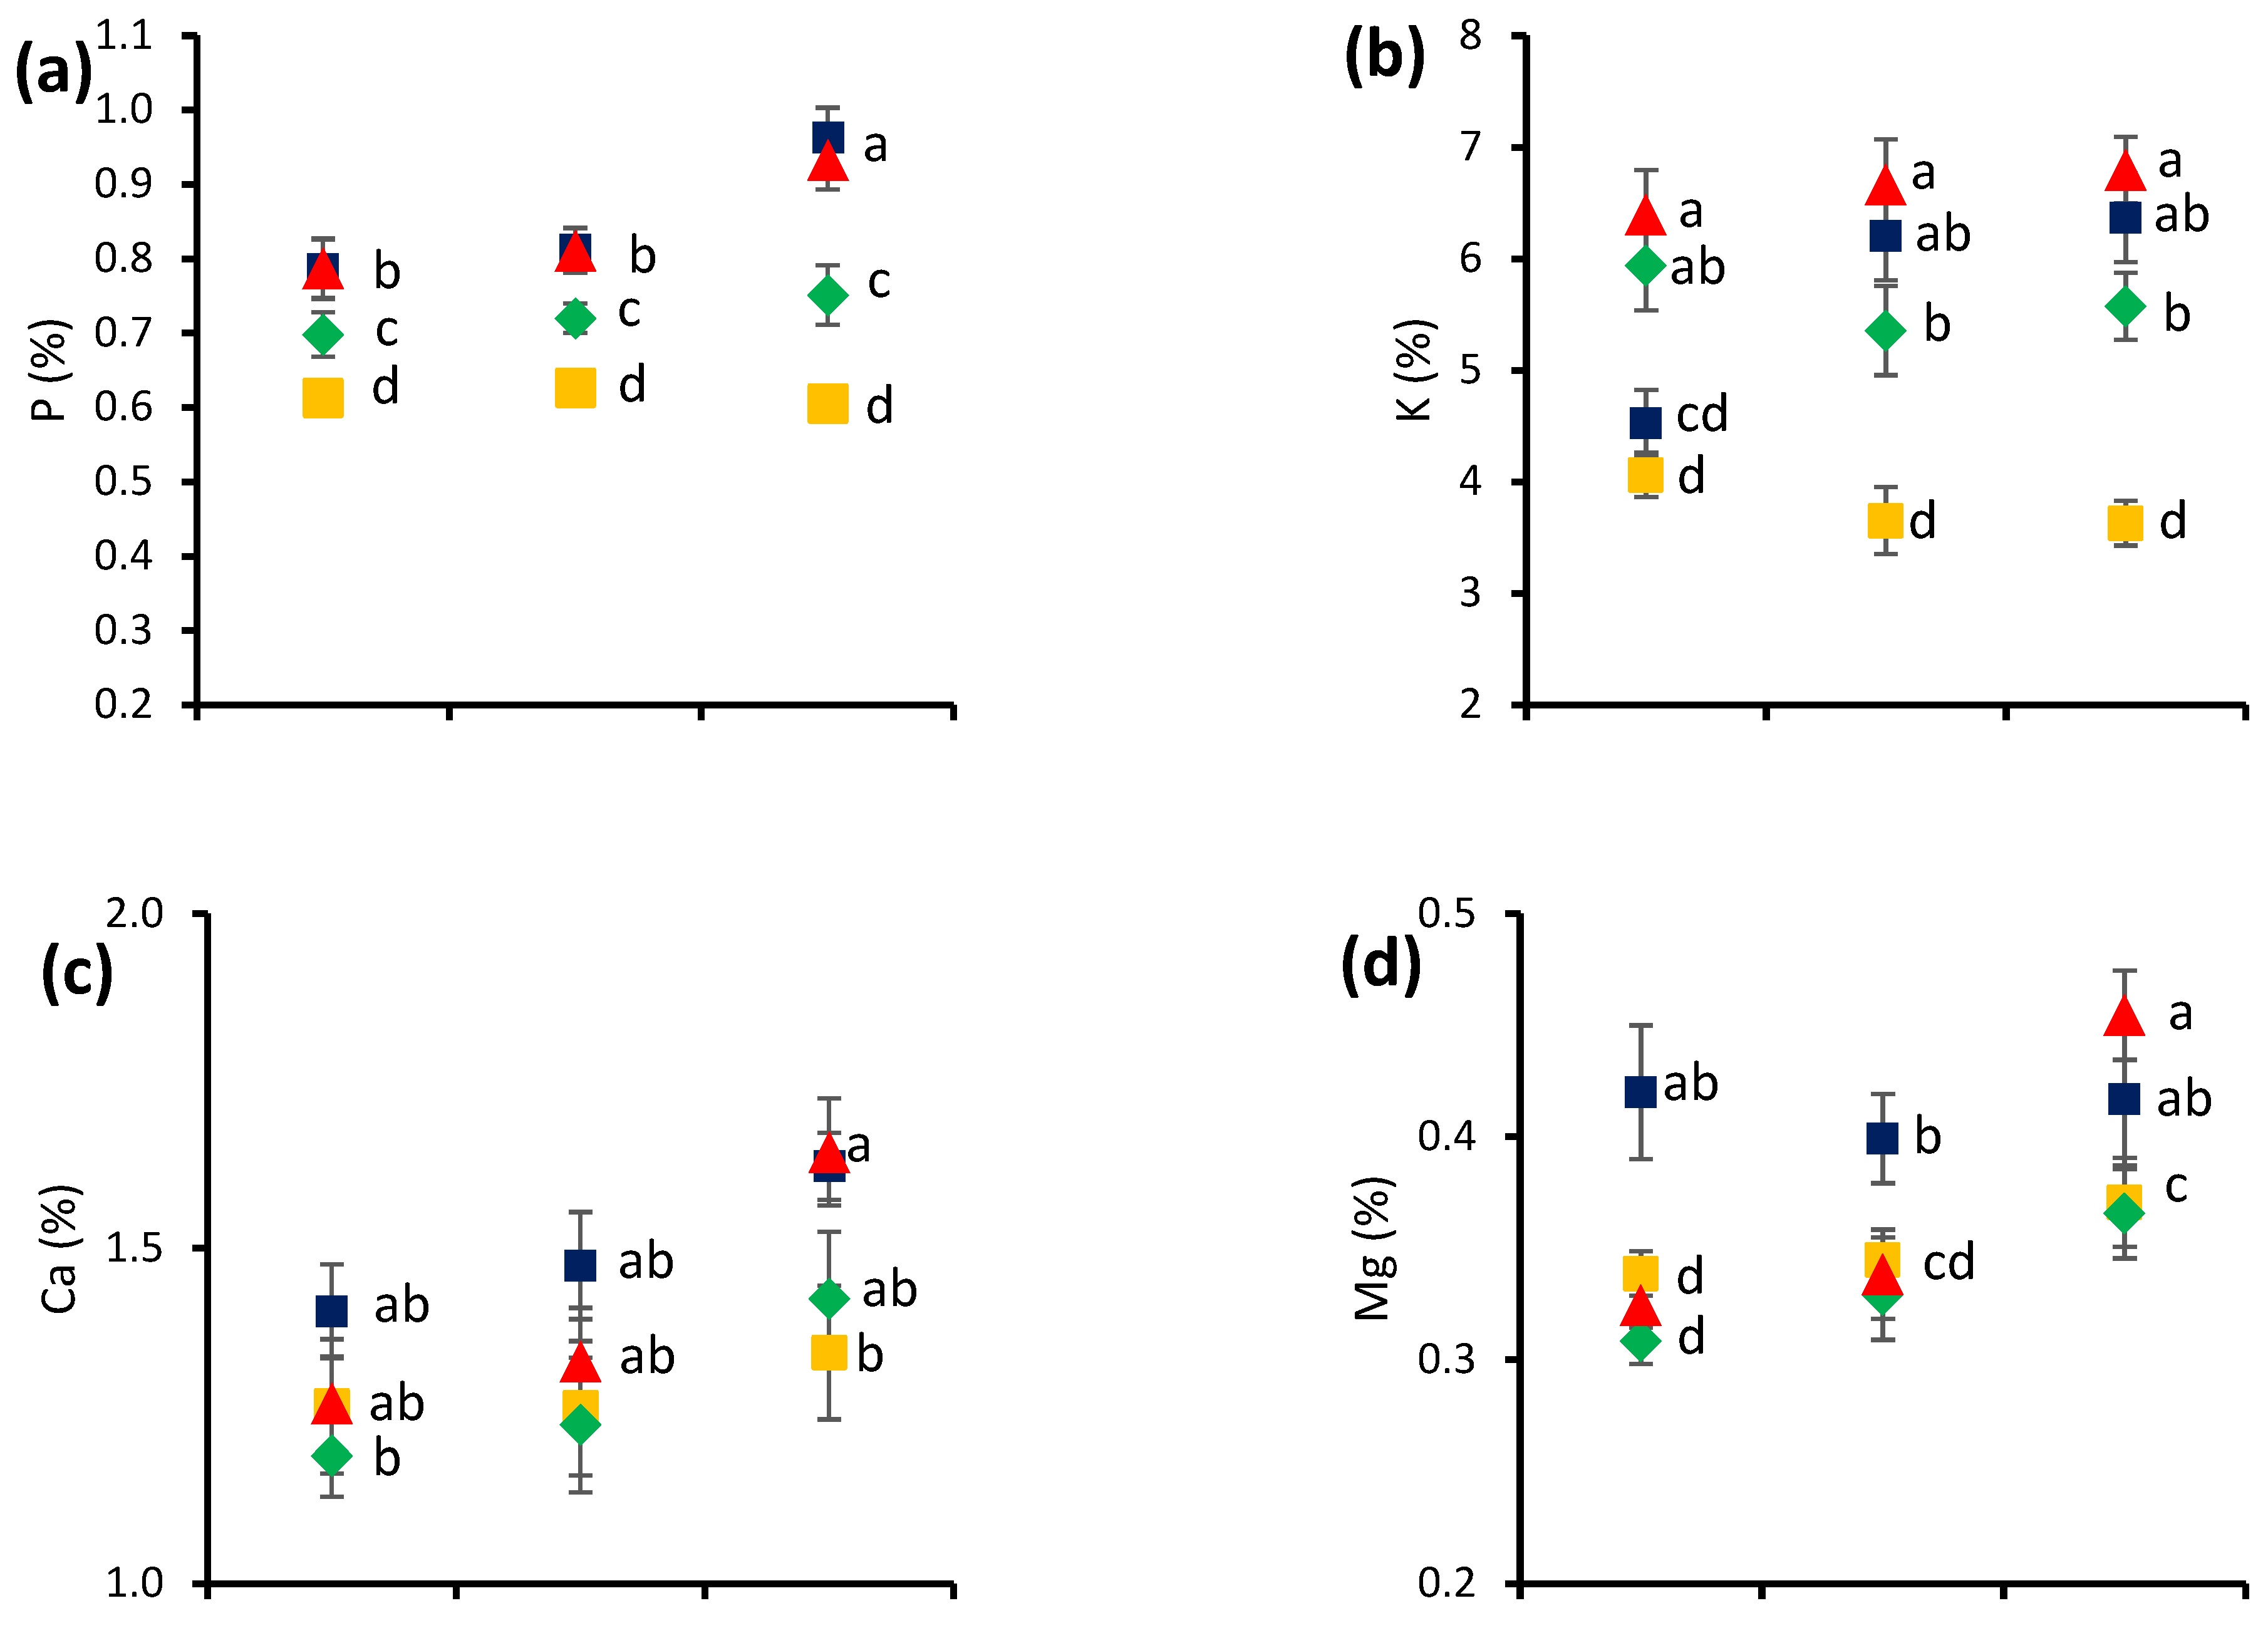
3.4. Plant Nutrient Contents

Overall, irrespective of the soil type, NPK, F3, and F0 did not differ significantly from one another in terms of plant nutrient contents. However, all these three treatments differed significantly (p < 0.01) from the CON. The silt loam soil had a lower plant nutrient content irrespective of the treatments received. The interactions between soil types and treatments were not significant on the plant N concentration. However, the main effect of the treatments (F0, F3, NPK, and CON) was significant on the plant N content (Figure 4), with NPK and F3 having a higher plant N by 8 and 58% than the F0 and CON, respectively. The F3-treated plants had higher plant B and K, by 10 and 14%, respectively, than the NPK-treated plants. With the progression of the planting cycle, the levels of P, K, Ca, Mg, and Cu in the plants increased, while those of Zn and B decreased, irrespective of the treatments (Figure 5). The significantly higher plant nutrients (P, K, Ca, Mg, and Cu) for all the treatments were observed in the third planting cycle, with the F3 and NPK having the highest, and the CON having the lowest.

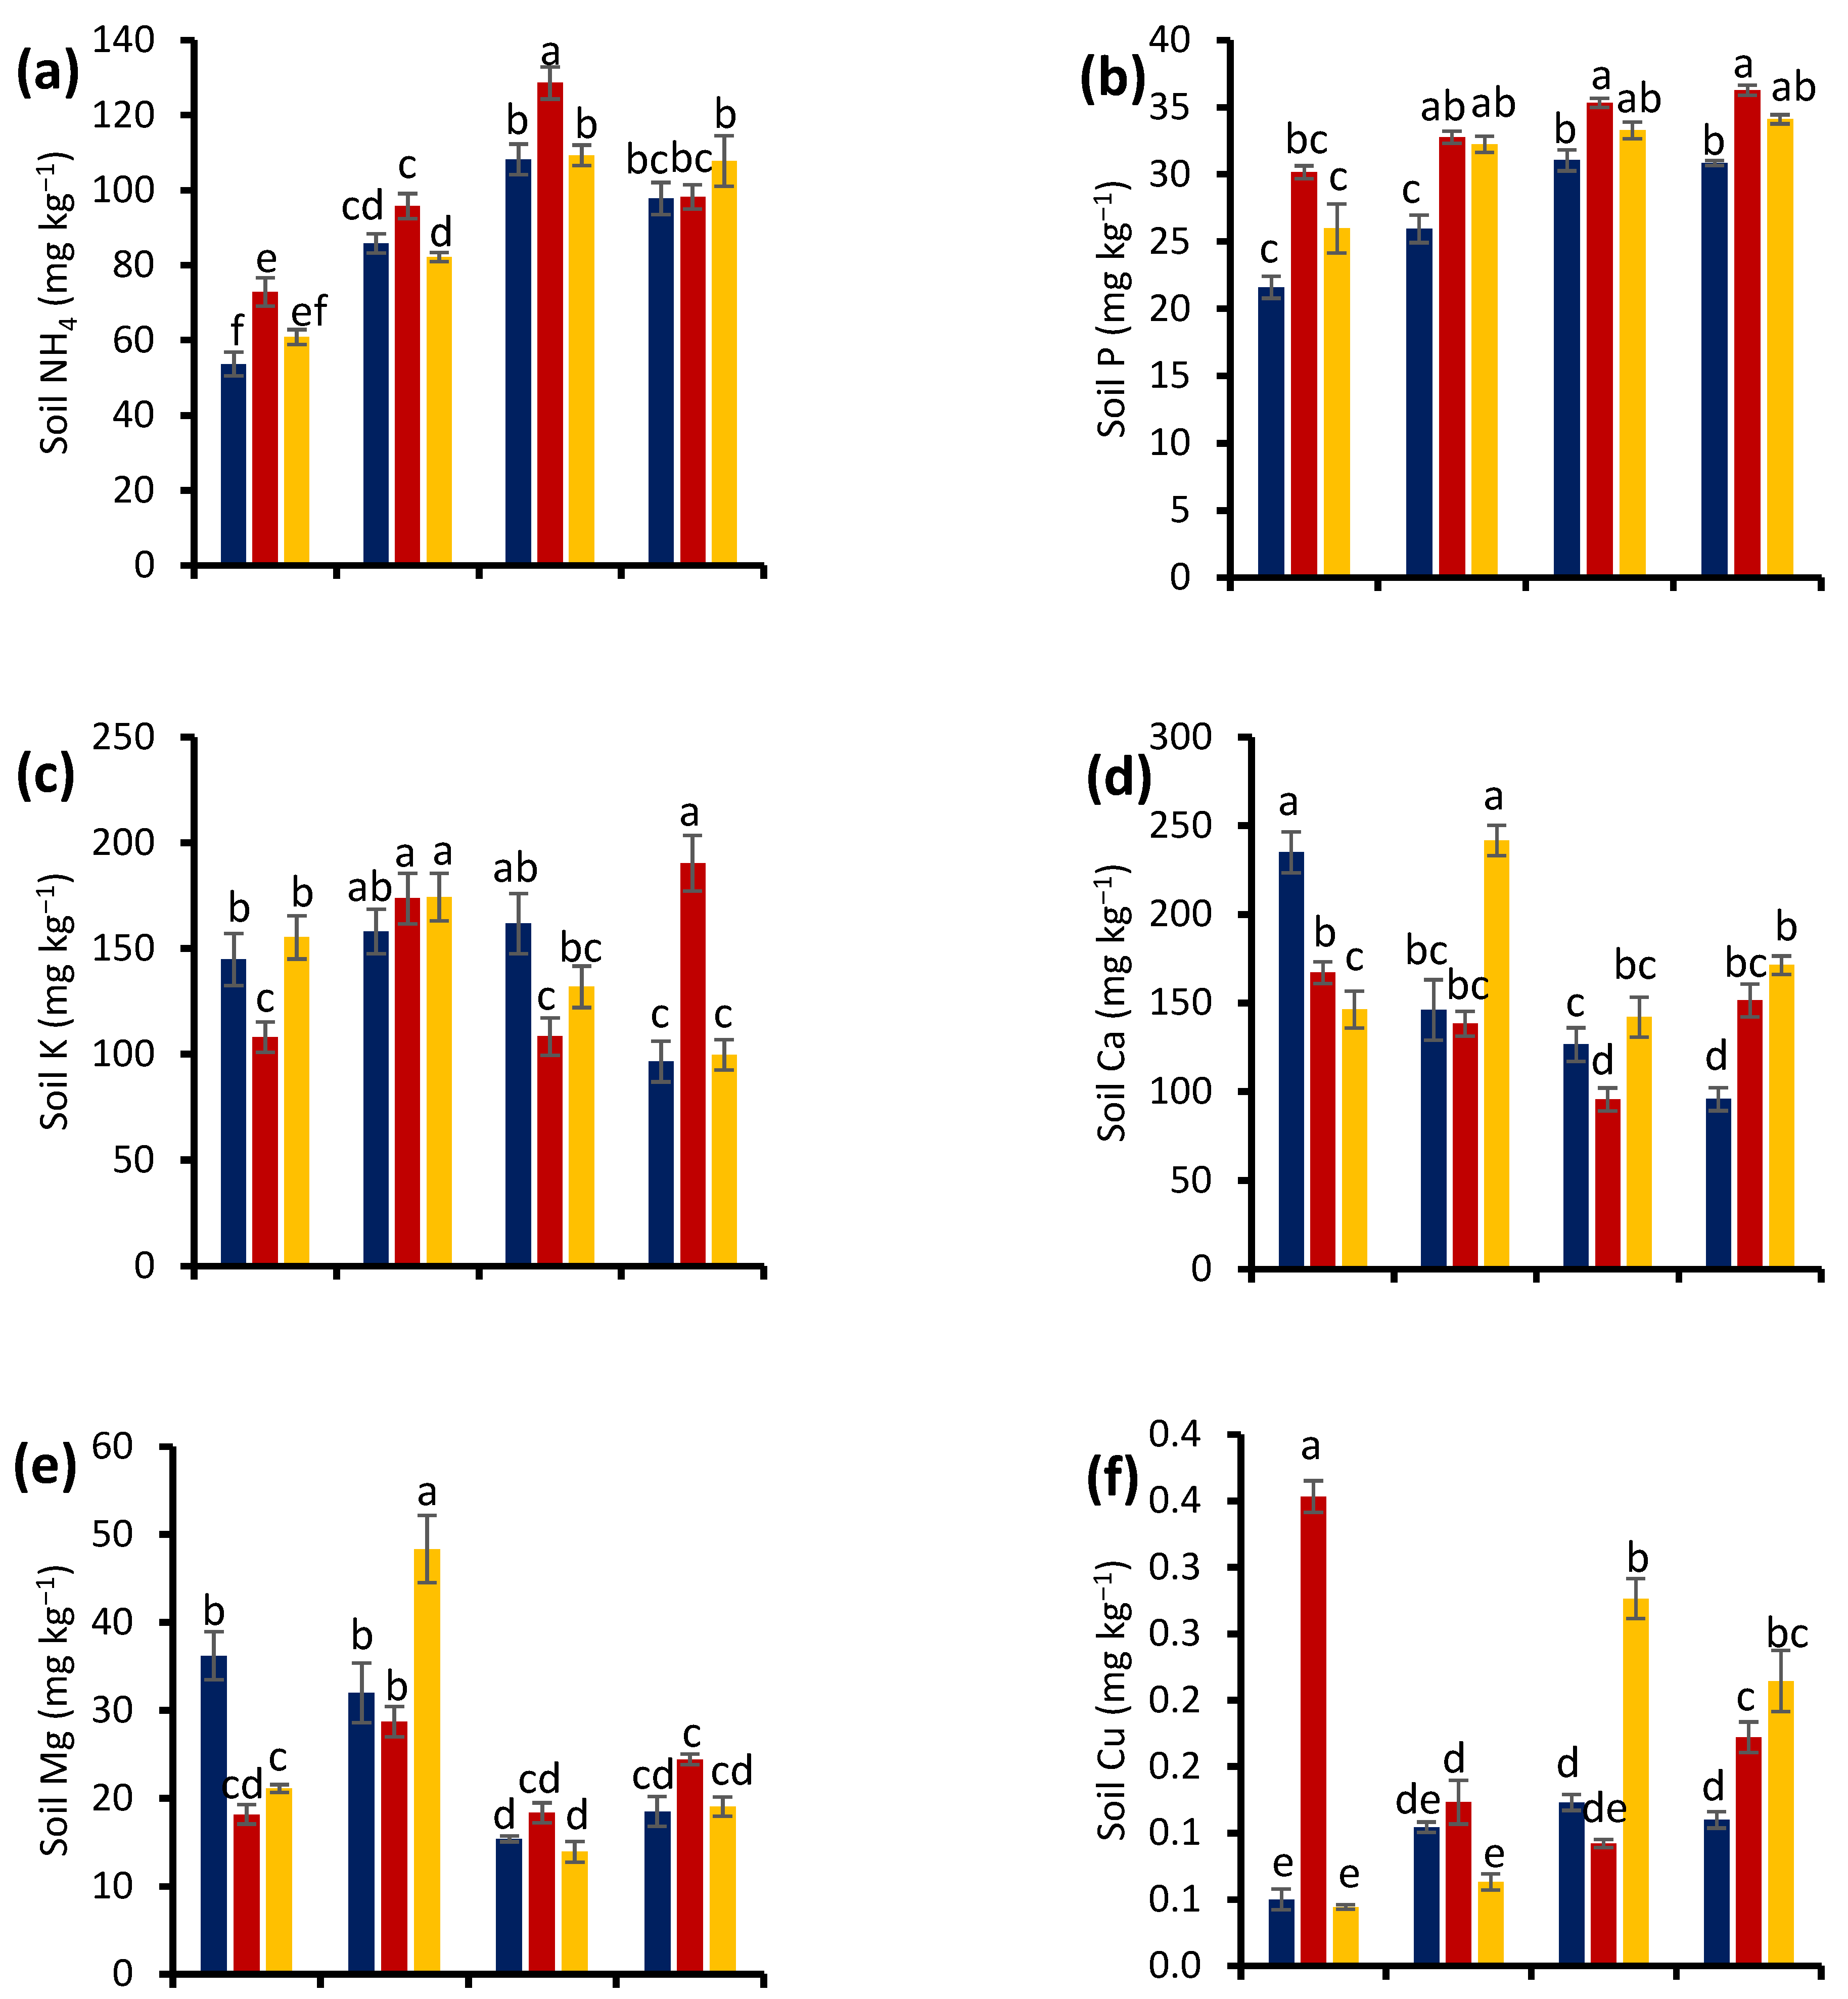
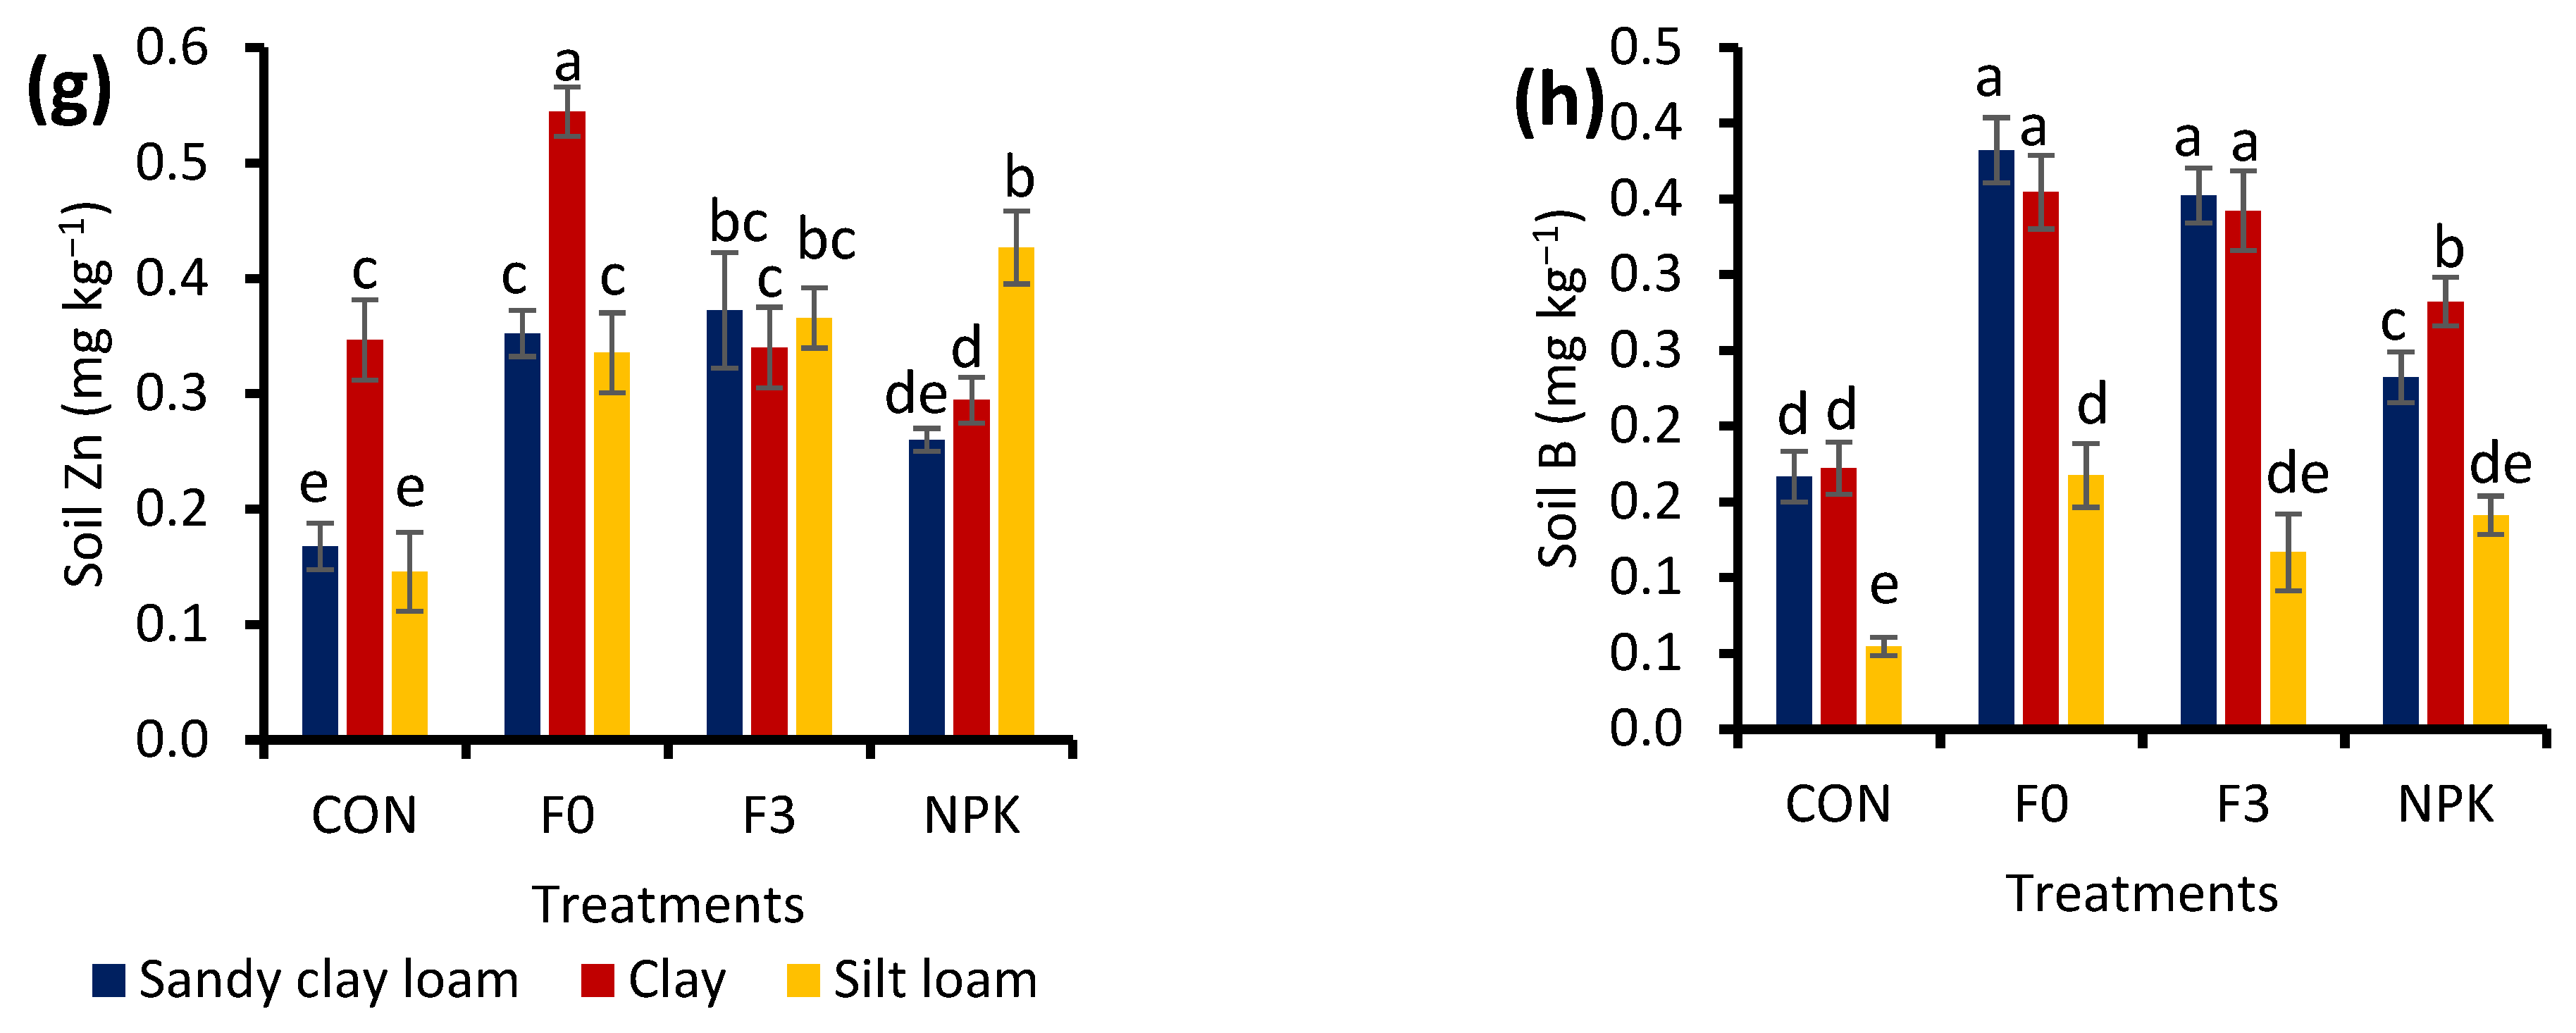
3.5. Soil Nutrient Contents

There was no significant interaction effect between treatments and planting cycles on the soil nutrients. However, a significant interaction effect was observed between the soil types and treatments, and higher concentrations of elements were mostly obtained in clay and silt loam soils treated with either NPK, F3, or F0 (Figure 6). Clay soil treated with F3 had a significantly higher NH 4 + and P, by 19 to 140% and 4 to 64%, respectively, relative to the other soils irrespective of the treatments received. The significantly higher and lower soil K were both recorded in NPK treatment in clay (190.3 mg kg−1) and sandy clay loam soils (96.4 mg kg−1), respectively. Clay and silt loam soils treated with F0 and F3 had the significantly higher Ca, Mg, Zn, and B, by 41 to 152%, than the other soils, irrespective of the treatments received (except sandy clay loam soil treated with CON in terms of Ca).

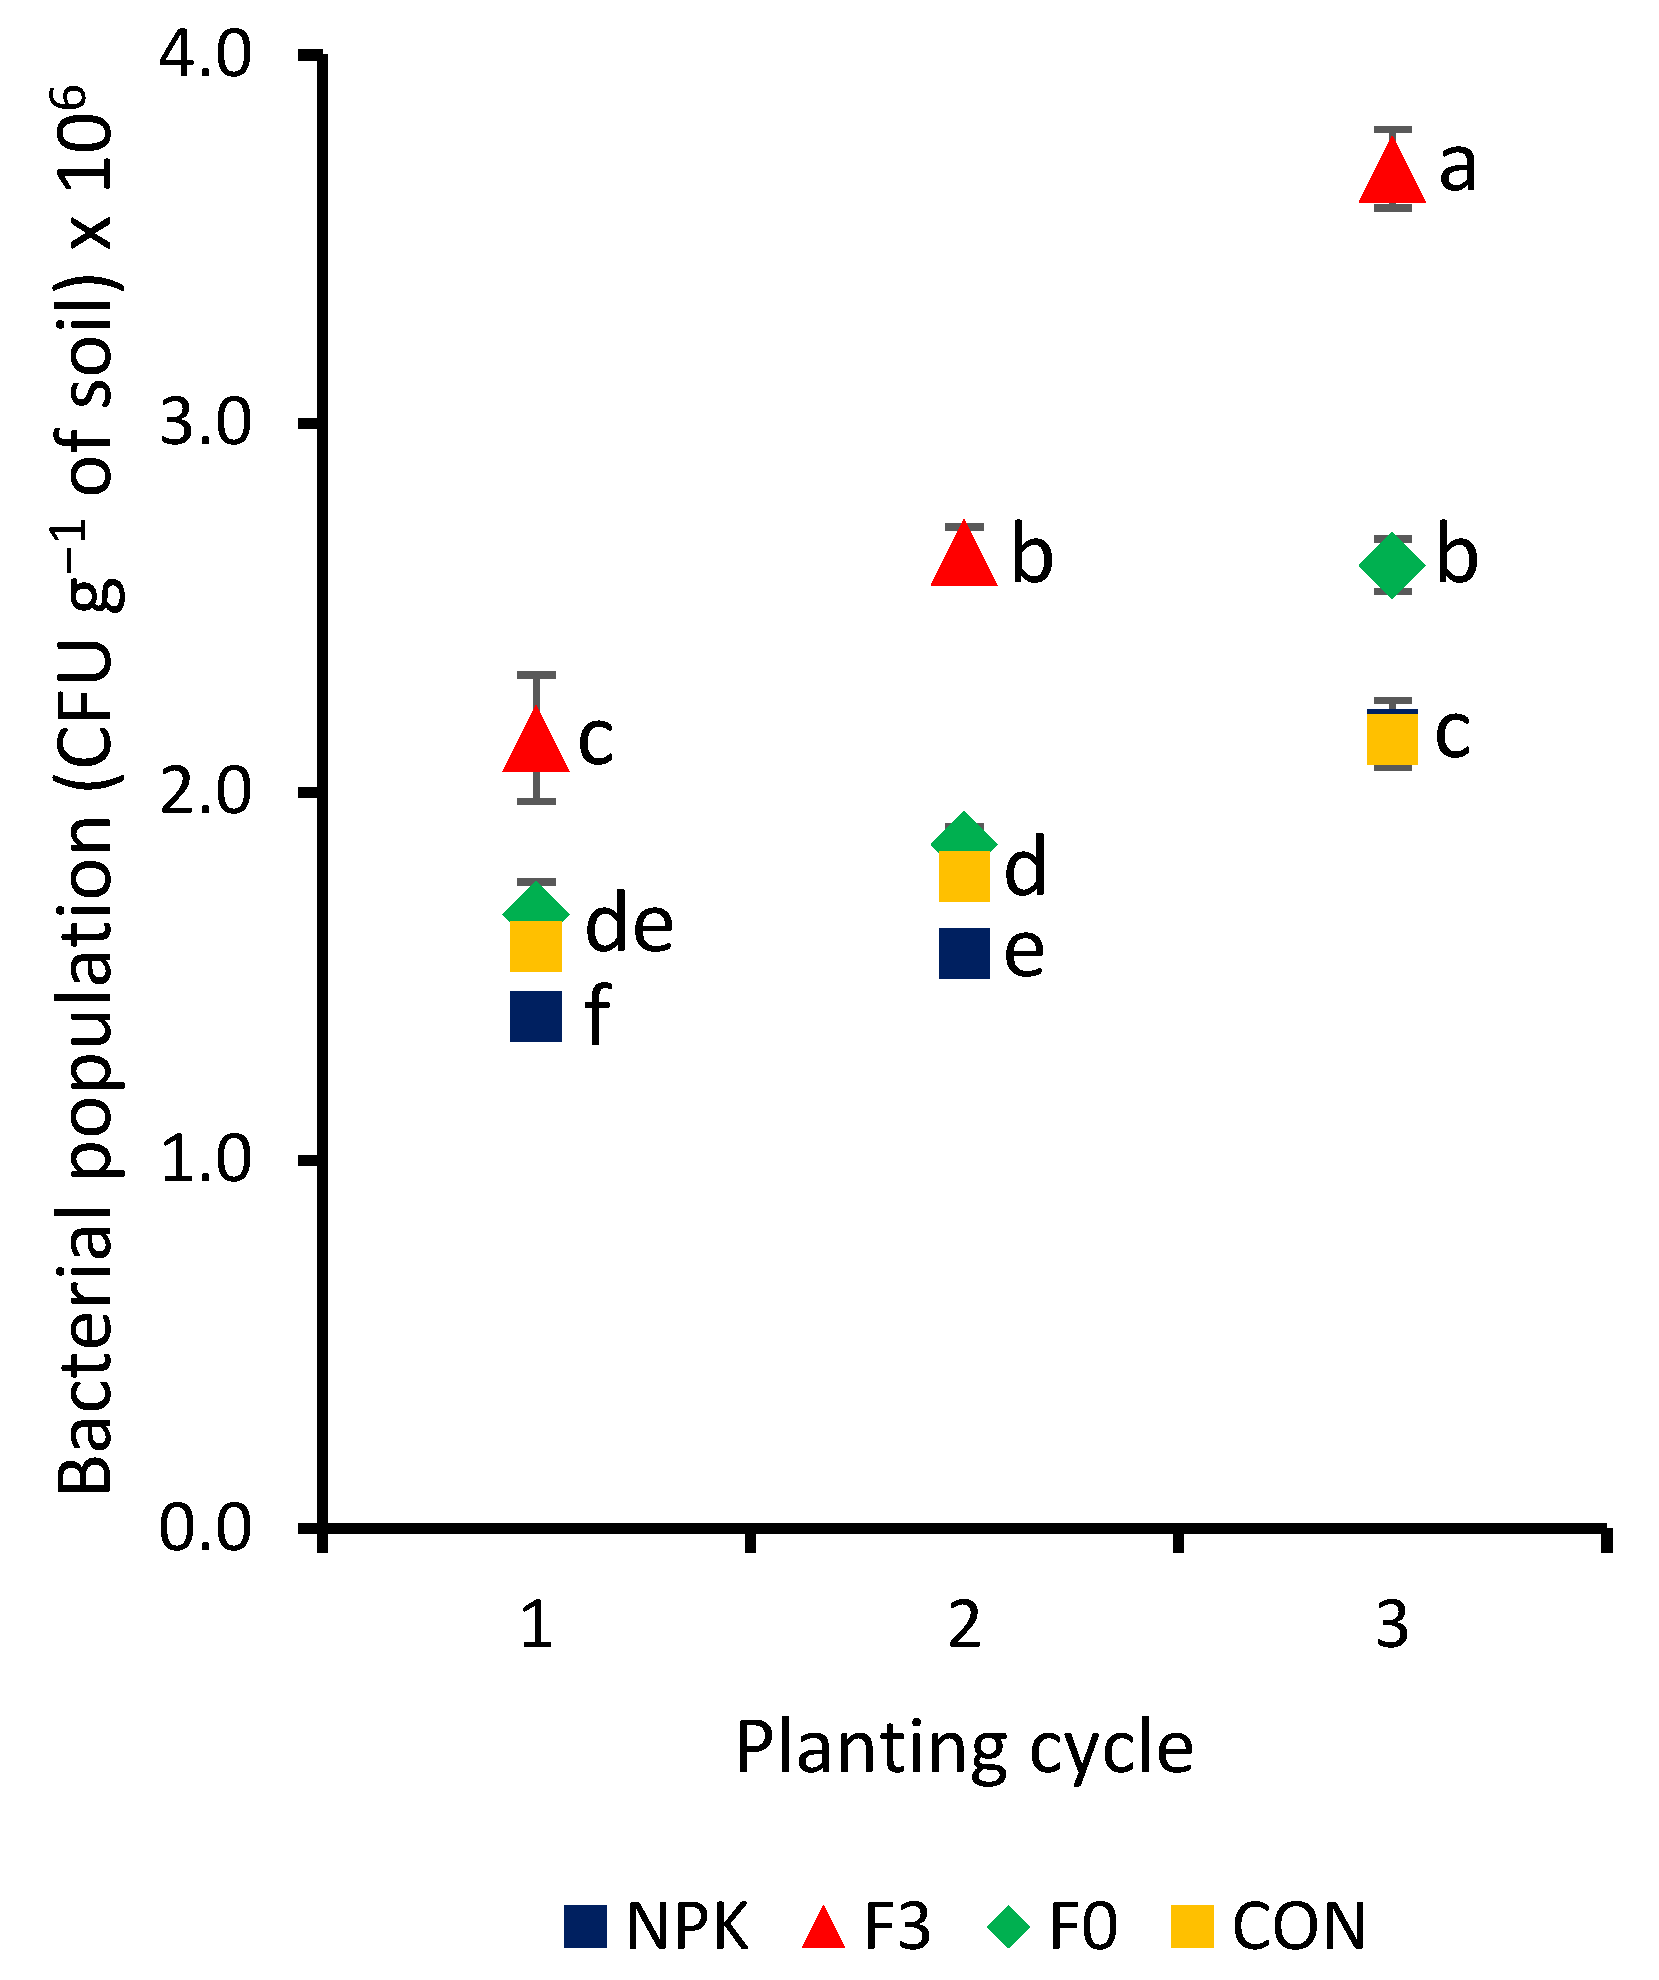
3.6. Relationships between Plant Growth Parameters and Soil Bacterial Population

All plant growth parameters were significantly (p < 0.01) and positively correlated with the soil bacterial population (Table 6). The soil bacterial counts differed significantly (p < 0.01) between treatments, with the highest in F3 and the lowest in the NPK. F3 had the highest, with F0 and CON being statistically similar to each other in terms of bacterial population (Figure 7). The F3 had higher bacterial counts, by 29 to 53, 42 to 70, and 41 to 71% in the first, second, and third planting cycle, respectively, than the other treatments. The bacterial counts increased with successive planting cycles for all treatments (even in CON). From the first to third planting cycle, the bacterial counts in F3 increased from 40 to 73%, F0 from 41 to 57%, NPK from 38 to 55%, and CON from 21 to 35%.

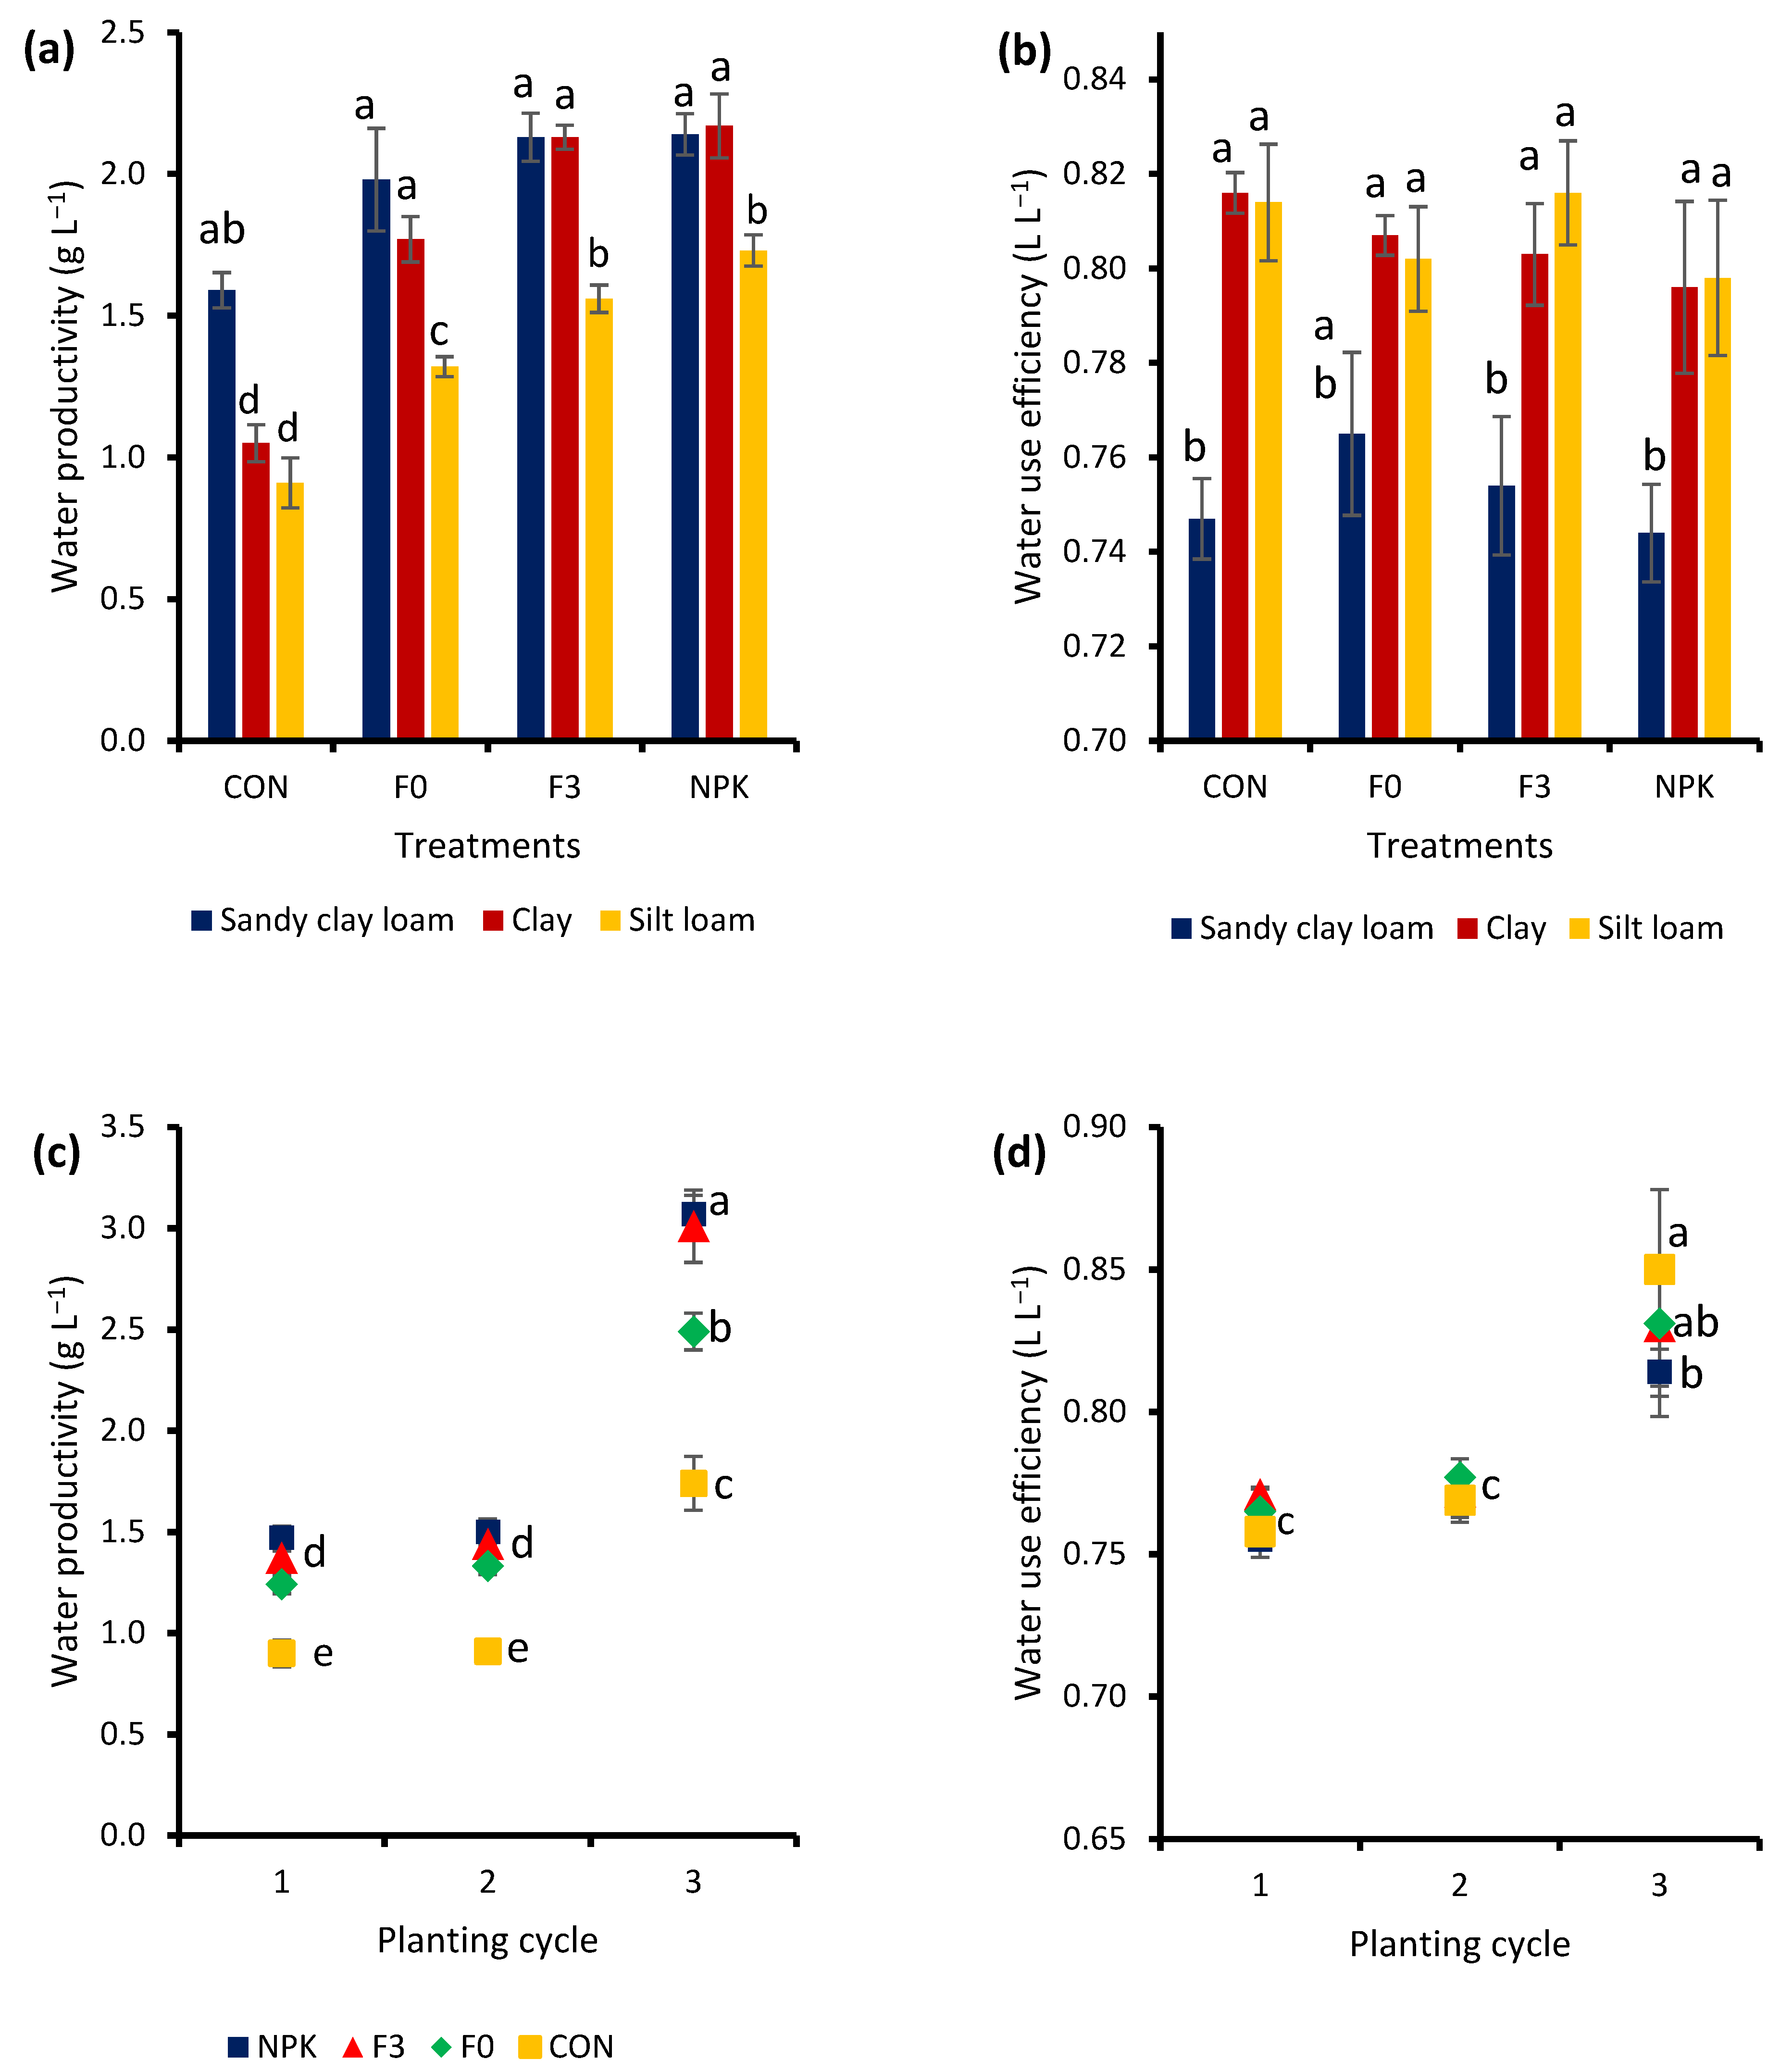
3.7. Water Productivity and Water Use Efficiency of Choy Sum

Significantly (p < 0.01) higher WPs were observed in clay and sandy clay loam soils treated with NPK, F3, and F0, while the least was in the CON (Figure 8). The clay and sandy clay loam soils had higher WP, by 21, 27, 33, and 42% in NPK, F3, F0, and CON, respectively, than in silt loam soil receiving the same treatments. Therefore, the CON had the significantly lowest WP, irrespective of the soil type. In contrast, the opposite was true for WUE, where a higher WUE was observed for the silt loam and clay soils, by 10 to 15%, than in the sandy clay loam, irrespective of the treatments it received (Figure 8b,d).
WP increased from the first to the third planting cycle, with significant differences between the treatments. Similarly, WUE also increased with successive planting cycles, but there was no significant difference between the treatments within the same planting cycle. In terms of WP, there was no significant difference between the plants treated with NPK, F3, and F0, but they differed significantly (p < 0.05) from the CON, which recorded the least in the first and second planting cycles. In the third planting cycle, the NPK and F3 treatments had a significantly higher (p < 0.01) WP, 21 and 42% higher than the F0 and CON, respectively.

4. Discussion

4.1. Plant Growth, Plant Nutrient Content, and Soil Nutrient Content

The highest plant growth parameters observed in the clay soil could be attributed to the clay soil’s ability to retain more nutrients for plant use as indicated by its CEC (Table 2), and the lowest leaching volume that led to the lower nutrients leaching, thereby, allowing more nutrients to be available for plant use (Table 4). Similarly, Nabayi et al. [44] attributed the higher plant growth of rubber seedlings to the lower leachate volume of the growing media used. Soil textural differences influence plant growth and yield because of their significant impact on soil water and nutrient flow [45]. The better performance of F3 in clay soil was because of the higher CEC of the clay soil, which led to the retention of the F3 nutrients for plant growth (Table 1 and Table 2), particularly in the third planting cycle, due to the build-up of the nutrients over time. The fermentation of WRW increased both nutrients and beneficial microbes [8,27]. In this study, therefore, the continuous application of F3 led to the higher bacterial counts in the soil (by 41 to 71%) relative to the application of the other treatments. The presence of these bacteria in F3 contributed to the higher plant growth of the treatment. The increase in soil bacteria with successive planting cycles led to the higher plant growth (Table 6). Nabayi et al. [8] stated that WRW contains beneficial microbes such as N-fixing and P- and K-solubilizing bacteria, among others, that could increase the proliferation of plants if utilized as liquid fertilizer. Kalsum et al. [46] reported that fermented WRW contains numerous nutrients that are essential to plant growth and development.
The higher plant nutrients P, K, Ca, Mg, and Cu, in the NPK, F3, and F0 treatments, particularly in the third planting cycle, showed a carryover effect by the F3, F0, and NPK treatments. The application of the treatments was continuous, and as such, the subsequent planting cycle benefits from the nutrients applied in the previous cycles, which therefore manifested the highest in the growth of the third planting cycle. The N and P added over the three planting cycles by F3 was higher by 21 and 61%, respectively, than in the NPK treatment. In contrast, the NPK-applied treatment added 27% higher K relative to the application of F3 (Table 3). Therefore, the higher N, P, and K elements added cumulatively by the F3 and NPK treatments led to the comparatively higher plant nutrients than that obtained in F0 and CON. The fermented WRW was found to contain N, P, and K of 400, 280, and 1000 mg L−1, respectively, due to the presence of cellulolytic bacteria [9]. Mosharrof et al. [47] reported that a greater availability of nutrients, including N, P, K, and other elements, promoted plant growth through a larger nutrient uptake. WRW increased the plant height, stem diameter, and yield of several test crops, such as tomato, water spinach, and pak choy [6,19,23,25]. Islam et al. [48] reported that higher plant yields depend largely on the soil types, soil nutrient status, and fertilizer management.
Higher plant growth and nutrient content with successive planting cycles (Figure 1) led to a non-significant increase in the soil nutrients, irrespective of the treatment. The lack of a significant increase in soil nutrients could be due to the plants’ nutrient uptake from the soil. Similarly, it could also be because continuous application of the treatments for only three planting cycles may be too short for an observable increase in the soil nutrients. The non-significantly higher elements in the clay and silt loam soils treated with NPK, F3 or F0 was because of the nutrients added through the application of the treatments (Table 3), in addition to their higher CEC, which made them to retain these elements (Table 2). Higher Ca, Mg, Zn, and B in the F3- and F0-treated soils was because of the addition of these elements through the WRW application, which were absent in the NPK treatments (Table 3). This led to their relative increase in the F3- and F0-treated soils than in the CON and NPK treatments. The lower K soil content in the sandy clay loam soil was because of its leaching due to its monovalent nature, which made it easily leachable as compared to its divalent counterparts, such as P, Mg and Ca elements. Monovalent elements, such as K, NH 4 + - N, and NO 3 - N, among others, have higher solubility relative to their divalent counterparts (i.e., Ca and Mg) [49] and, therefore, leached easily [27].

4.2. Nutrient Leaching

NH 4 + and NO 3 levels in the leachate, leachate volume, and pH of leachate decreased with successive planting cycles for all treatments (Figure 2). Despite decreasing with successive planting cycles, the highest leaching of NH 4 + in the F3 treatment was because of the relatively higher NH 4 + content of the treatment compared with the F0 and CON. Similarly, the higher leaching of NO 3 recorded in F0 was because of the relatively higher NO 3 content in the F0 treatment (Table 1 and Table 3). The decreased leaching of most elements with successive planting cycles could be attributed to their higher uptake by the plants, which eventually led to the higher plant growth in the third planting cycle. The higher EC content in the F3 and NPK leachate could indicate higher nutrient contents of the treatments as compared with CON, which had lower nutrient contents. The lower pH of leachate (more acidic) in the NPK and F3 treatments was because of the continuous addition of the treatments, which were acidic and in turn led to the lower pH of their leachates. Fermenting WRW increasingly lowers WRW pH due to the production of organic acids by microbes [27,50,51]. In contrast, the higher pH (less acidic) in the F0 and CON was because of their higher initial pH, so the continuous addition of these treatments led to the increase in their soil pH.

4.3. Water Productivity and Water Use Efficiency of Choy Sum

Statistically similar WUE between all treatments (NPK, F3, F0 and CON) indicates that the plants in all treatments had taken up the same amount of water. However, the plants in the various treatments differed in WP. The WP trend of F3 = NPK > F0 > CON means, though the plants had taken up the same amount of water, the plants in the F3 (and NPK) had used that water more efficiently to produce the same amount of biomass. F0 had lower WP, meaning that the crop was less productive in using the F0 to produce biomass as compared with F3 and NPK. CON had the lowest WP due to the lack of nutrients in the tap water. Water productivity is the yield of the plant obtained in relation to the amount of water transpired [33]. Ahmadi et al. [52] reported that crop water productivity may be influenced by the soil texture. The clay and sandy clay loam soils had the significantly higher WP, while the least was recorded in silt loam soil irrespective of the treatments applied. The higher WP in clay and sandy clay loam soils could be attributed to their relatively higher initial soil nutrient contents compared to the silt loam soil (Table 1 and Figure 8a).

5. Conclusions

It has been established that fermented WRW has beneficial plant nutrients and microbes [8,27]. Herein, the WRW was tested on three consecutive planting cycles, and the results showed that continuous WRW application increased the growth and yield of choy sum (Brassica chinensis). The continuous WRW application also led to the buildup of the soil bacteria with the progression of the planting cycle (particularly the F3). In the third planting cycle, the F3 treatment had 40 to 72% higher bacterial counts than its first and second planting cycles because of the carryover effect of using the F3. The positive correlations between the plant growth and soil bacterial population indicated the role of the microbes in the WRW in increasing the plant growth. Application of F3 into the sandy clay loam and clay soils produced higher plant growth and nutrient contents by 37–56% because of the higher CEC of the soils as compared to the silt loam soil. Application of the F3 and NPK treatments produced a comparable plant yield and nutrient content, which is attributed to their comparable amount of N, P, and K added over the three planting cycles. The use of freshly prepared WRW (F0) produced 20% higher plant growth than the CON, mainly due to the nutrient contents of the F0. The continuous WRW application (like all the other treatments) did not significantly increase the soil nutrient contents, which could indicate that three planting cycles may be too short for a significant impact on the soil. The results of this study showed that the continuous application of fermented WRW (F3) produced comparative plant growth and nutrient content with the NPK in the long run, which led us to recommend the use of WRW as a source of plant nutrients, particularly vegetable plants. However, fermented WRW needs to be evaluated in an open field to determine its efficiency when subjected to environmental factors.

Author Contributions

Conceptualization, A.N. and C.B.S.T.; methodology, A.N., C.B.S.T. and A.K.Z.T.; software, A.N. and C.B.S.T.; validation, A.N., N.P.T. and C.B.S.T.; formal analysis, A.N. and C.B.S.T.; investigation, A.N. and C.B.S.T.; resources, C.B.S.T. and N.P.T.; data curation, C.B.S.T.; writing—original draft preparation, A.N.; writing—review and editing, A.N. and C.B.S.T.; visualization, A.N. and C.B.S.T.; supervision, C.B.S.T., A.K.Z.T. and N.P.T. All authors have read and agreed to the published version of the manuscript.

Funding

This research was funded by the Uni. Putra Malaysia Grant 2022, Geran Inisiatif Putra Siswazah (GP-IPS) (No. GP-IPS/2022/9709600).

Data Availability Statement

Not applicable.

Acknowledgments

The authors would like to acknowledge TETFund Nigeria for providing a PhD scholarship to the first author. The authors also acknowledge colleagues and staff at Universiti Putra Malaysia Selangor Campus for their support and cooperation.

Conflicts of Interest

The authors declare no conflict of interest.

References

  1. Juliano, B.O. Rice in Human Nutrition; FAO Food and Nutrition Series: Rome, Italy, 1993. [Google Scholar]
  2. Malakar, M.C.; Banerjee, S.N. Effect of cooking rice with different volumes of water on the loss of nutrients and on digestibility of rice in vitro. Food Res. 1959, 24, 751–756. [Google Scholar] [CrossRef]
  3. Juliano, B.O. Rice: Chemistry and Technology, 2nd ed.; American Association of Cereal Chemists: Eagan, MN, USA, 1985. [Google Scholar]
  4. Nabayi, A.; Teh, C.B.S.; Ngai, T.P.; Tan, A.K.Z. Wastewater from washed rice water as plant nutrient source: Current understanding and knowledge gaps. Pertanika J. Sci. Technol. 2021, 29, 1347–1369. [Google Scholar] [CrossRef]
  5. Akib, M.A.; Setiawaty, H.; Haniarti, H.; Sulfiah, S. Improving the quality of “Leri” rice washing waste by different period of fermentation and yeast concentration as an alternative liquid organic fertilizer. Int. J. Agric. Syst. 2015, 2, 153–162. [Google Scholar]
  6. Hariyadi, S.P. The Effect of watering on rice washing water, MSG water, and AC (Air Conditioner) wastewater on yields components and tomato yields (Lycopersicon esculentum L.) in the deep peatland. Univers. J. 2020, 7, 1–12. [Google Scholar]
  7. He, Q.; Feng, C.; Chen, N.; Zhang, D.; Hou, T.; Dai, J.; Hao, C.; Mao, B. Characterizations of dissolved organic matter and bacterial community structures in rice washing drainage (RWD)-based synthetic groundwater denitrification. Chemosphere 2019, 215, 142–152. [Google Scholar] [CrossRef]
  8. Nabayi, A.; Sung, C.T.B.; Zuan, A.T.K.; Paing, T.N. Fermentation of washed rice water increases beneficial plant bacterial population and nutrient concentrations. Sustainability 2021, 13, 1–19. [Google Scholar] [CrossRef]
  9. Dini, I.R.; Salbiah, D. Growth and pepper yields (Capsicum annuum L.) by giving a formulation of biological fertilizer of cellulolytic bacteria based on organic liquid waste. In Proceedings of the Journal of Physics: Conference Series, Pekanbaru, Indonesia, 10 September 2019; IOP Publishing: Bristol, UK, 2019; Volume 1351, p. 12097. [Google Scholar]
  10. Park, J. Environment and health: An overview of current trends at WHO and OECD. J. Environ. Health Sci. 2013, 39, 299–311. [Google Scholar] [CrossRef]
  11. United Nations, G.A. United Nations, G.A. United Nations World Water Assessment Programme (UNWWAP). In The World Water Development Report; United Nations: Paris, France, 2016; pp. 1–148. [Google Scholar]
  12. Khalid, S.; Shahid, M.; Bibi, I.; Sarwar, T.; Shah, A.H.; Niazi, N.K. A review of environmental contamination and health risk assessment of wastewater use for crop irrigation with a focus on low and high-income countries. Int. J. Environ. Res. Public Health 2018, 15, 895. [Google Scholar] [CrossRef]
  13. Winance, G.M.; Ernaningsih, D.; Eting, D.E. Effect of utilization of rice washing water and eggshells on the growth of tomato plants (Lycopersium escuslentum Mill). BIOS J. Pendidik. Biol. dan Pengajaran 2018, 1, 1–9. [Google Scholar]
  14. The Jakarta Post Village in Bogor Uses Leftover Rice Water to Grow Plants. Jakarta Post News Desk 2017. Village in Bogor Uses Leftover Rice Water to Grow plants-City-The Jakarta Post. Available online: https://www.thejakartapost.com/news/2017/10/07/village-in-bogor-uses-leftover-rice-water-to-grow-plants.html (accessed on 26 May 2021).
  15. Supraptiningsih, L.K.; Nuriyanti, R.; Sutrisno, A. Processing household waste (washed rice water) into liquid organic fertilizer in probolinggo regency empowering. J. Pengabdi. Masy. Fak. Psikol. 2019, 3, 12–20. [Google Scholar]
  16. Iskarlia, G.R. The growth of hydroponic mustard plant (Brassica rapa L.) using the nutrition of washed rice water and chicken egg shells. Agric Sains J. Budid. Tanam. Perkeb. Politek. Hasnur. 2017, 3, 42–51. [Google Scholar]
  17. Ratnadi, N.W.Y.; Sumardika, N.I.; Setiawan, N.A.G. Effect of watering rice washing water and urea fertilizer with different concentrations on the growth of henna plants (Impatiens balsamina L.). J. Biol. Educ. 2014, 1, 1–9. [Google Scholar]
  18. Leandro, M. Effect of Rice Wash Water Concentration on Growth of Tomato and Eggplant Plants. Available online: http://cikaciko.blogspot.com/2009/01/PengaruhKonsentrasiAirCucianBerasterhadapPertumbuhanTanamanTomatdanTerong.html (accessed on 18 January 2021).
  19. Bahar, A. Pengaruh pemberian limbah air cucian beras terhadap pertumbuhan tanaman kangkung darat (Ipomoea reptans Poir). J. Ilm. Mhs. Fak. Pertan. 2016, 3, 1–9. [Google Scholar]
  20. Wardiah, L.; Hafnati, L.R. Potensi limbah air cucian beras sebagai pupuk organik cair pada pertumbuhan pakchoy (Brassica rapa L.). J. Biol. Edukasi 2014, 6, 34–38. [Google Scholar]
  21. Istiqomah, N. Efektivitas pemberian air cucian beras coklat terhadap produktivitas tanaman kacang hijau (Phaseolus radiatus L.) pada lahan rawa lebak. Ziraa’ah 2012, 33, 99–108. [Google Scholar]
  22. Ariwibowo, F. Utilization of Chicken Eggshells and Rice Washed Water on the Growth of Tomato Plants (Solonum Lycopercium L.) with Hydroponic Growing Media. Unpublished Undergraduate Thesis, Universitas Muhammadiah Surakarta, Surakarta, Indonesia, 2012. [Google Scholar]
  23. Siagian, A.S. Response of Organic Fertilizer to Liquid Water Wash on Growth and Production of Lettuce (Lactuca sativa L.). Unpublished Undergraduate Thesis, University of Medan Area Faculty of Agricultural Studies Program of Agrotechnology, Medan, Indonesia, 2018. Available online: http://repository.uma.ac.id/handle/123456789/10578 (accessed on 26 May 2021).
  24. Wulandari, C.G.M.; Muhartini, S.; Trisnowati, S. Pengaruh air cucian beras merah dan beras putih terhadap pertumbuhan dan hasil selada (Lactuca sativa L.). Vegetalika 2012, 1, 24–35. [Google Scholar]
  25. Karlina, A.; Yursida; Ruli, J.P. Growth response of water spinach (Ipomea reptans) to the application of liquid organic fertilizer from cow urine and organic fertilizer in tidal land overflow type C. J. Ilm. Agric. 2013, 1, 1–16. [Google Scholar]
  26. Sairi, F.; Ismail, N.; Ibrahim, N. The effect of FRAW towards the growth of chilli seedlings and its associated microorganisms. Malays. J. Microbiol. 2018, 14, 606–610. [Google Scholar]
  27. Nabayi, A.; Sung, C.T.B.; Zuan, A.T.K.; Paing, T.N.; Akhir, N.I.M. Chemical and microbial characterization of washed rice water waste to assess its potential as plant fertilizer and for increasing soil health. Agronomy 2021, 11, 2391. [Google Scholar] [CrossRef]
  28. Austin, D.F. Water spinach (Ipomoea aquatica, Convolvulaceae): A food gone wild. Ethnobot. Res. Appl. 2007, 5, 123–146. [Google Scholar] [CrossRef]
  29. Wiersema, J.H.; León, B. World Economic Plants: A Standard Reference; CRC press: Boca Raton, FL, USA, 2016. [Google Scholar]
  30. Vimala, P.; Chan, S.K. Tanah dan pembajaan. Panduan pengeluaran sayur-sayuran. Malays. Agric. Res. Dev. Inst. (MARDI) 1990, 1, 1–47. [Google Scholar]
  31. Cerovic, Z.G.; Masdoumier, G.; Ghozlen, N.B.; Latouche, G. A new optical leaf-clip meter for simultaneous non-destructive assessment of leaf chlorophyll and epidermal flavonoids. Physiol. Plant. 2012, 146, 251–260. [Google Scholar] [CrossRef] [PubMed]
  32. Campbell, C.R.; Plank, C.O. Preparation of plant tissue for laboratory analysis. Methods Plant Anal. 1998, 37, 37–49. [Google Scholar]
  33. Heydari, N. Water productivity in agriculture: Challenges in concepts, terms and values. Irrig. Drain. 2014, 63, 22–28. [Google Scholar] [CrossRef]
  34. Nelson, D.W.; Sommers, L. Total carbon, organic carbon, and organic matter. In Methods of Soil Analysis. Part 2. Chemical and Microbiological Properties; Wiley: Hoboken, NJ, USA, 1983; Volume 9, pp. 539–579. [Google Scholar]
  35. McLean, E.O. Soil pH and lime requirement. In Methods of Soil Analysis. Part 2. Chemical and Microbiological Properties; Page, A.L., Miller, R.H., Keeney, D.R., Eds.; ASA Inc.: Phoenix, AZ, USA; SSSA Inc. Publishers: New York, NY, USA, 1982; Volume 9, pp. 199–224. [Google Scholar]
  36. Skjemstad, J.O.; Baldock, J.A. Total and organic carbon. In Soil Sampling and Methods of Analysis; CRC Press: Boca Raton, FL, USA, 2007; pp. 225–239. [Google Scholar]
  37. Thomas, G.W. Exchangeable cations. In Methods of Soil Analysis. Part 2. Chemical and Microbiological Properties; Page, A.L., Miller, R.H., Keeney, D.R., Eds.; ASA Inc.: Phoenix, AZ, USA; SSSA Inc. Publishers: New York, NY, USA, 1982; Volume 9, pp. 159–165. [Google Scholar]
  38. Bray, R.H.; Kurtz, L.T. Determination of total, organic, and available forms of phosphorus in soils. Soil Sci. 1945, 59, 39–46. [Google Scholar] [CrossRef]
  39. Gee, G.W.; Bauder, J.W. Particle size analysis. In Methods of soil Analysis. Part 1. Physical and Mineralogical Methods; Klute, A., Ed.; ASA Inc.: Phoenix, AZ, USA; SSSA Inc. Publishers: Madison, WI, USA, 1986; Volume 9, pp. 383–411. [Google Scholar]
  40. Richards, L.A. Pressure-membrane apparatus, construction and use. Agric. Eng. 1947, 28, 451–454. [Google Scholar]
  41. Tan, K.Z.; Radziah, O.; Halimi, M.S.; Khairuddin, A.R.; Habib, S.H.; Shamsuddin, Z.H. Isolation and characterization of rhizobia and plant growth-promoting rhizobacteria and their effects on growth of rice seedlings. Am. J. Agric. Biol. Sci. 2014, 9, 342–360. [Google Scholar] [CrossRef]
  42. Thomas, P.; Sekhar, A.C.; Upreti, R.; Mujawar, M.M.; Pasha, S.S. Optimization of single plate-serial dilution spotting (SP-SDS) with sample anchoring as an assured method for bacterial and yeast cfu enumeration and single colony isolation from diverse samples. Biotechnol. Rep. 2015, 8, 45–55. [Google Scholar] [CrossRef]
  43. Gomez, K.A.; Gomez, A.A. Statistical Procedures for Agricultural Research; John Wiley & Sons: Hoboken, NJ, USA, 1984. [Google Scholar]
  44. Nabayi, A.; Teh, C.B.S.; Husni, M.H.A.; Sulaiman, Z. Plant growth, nutrient content and water use of rubber (Hevea brasiliensis) seedlings grown using root trainers and different irrigation systems. Pertanika J. Trop. Agric. Sci. 2018, 41, 251–270. [Google Scholar]
  45. Feng, G.; Zhang, Y.; Chen, Y.; Li, Q.; Chen, F.; Gao, Q.; Mi, G. Effects of nitrogen application on root length and grain yield of rain-fed maize under different soil types. Agron. J. 2016, 108, 1656–1665. [Google Scholar] [CrossRef]
  46. Kalsum, U.S.; Fatimah; Wasonowati, C. Effectiveness of washed rice water provision on growth and yield of white oyster mushroom (Pleurotus ostreatus). J. Agrovigor 2011, 4, 86–92. [Google Scholar]
  47. Mosharrof, M.; Uddin, M.K.; Sulaiman, M.F.; Mia, S.; Shamsuzzaman, S.M.; Haque, A.N.A. Combined application of rice husk biochar and lime increases phosphorus availability and maize yield in an acidic soil. Agriculture 2021, 11, 793. [Google Scholar] [CrossRef]
  48. Islam, M.M.; Karim, A.J.; Jahiruddin, M.; Majid, N.M.; Miah, M.G.; Ahmed, M.M.; Hakim, M.A. Effects of organic manure and chemical fertilizers on crops in the radish-stem amaranth-Indian spinach cropping pattern in homestead area. Aust. J. Crop Sci. 2011, 5, 1370–1378. [Google Scholar]
  49. Petrucci; Ralph, H.; Geoffrey, H.F.; Jeffrey, D.M.; Bissonnette, C. General Chemistry: Principles and Modern Applications, 10th ed.; Pearson Education: Upper Saddle River, NJ, USA, 2011. [Google Scholar]
  50. Nkhata, S.G.; Ayua, E.; Kamau, E.H.; Shingiro, J.B. Fermentation and germination improve nutritional value of cereals and legumes through activation of endogenous enzymes. Food Sci. Nutr. 2018, 6, 2446–2458. [Google Scholar] [CrossRef]
  51. Taylor, J.R.N.; Hugo, L.F.; Yetnerberk, S. Developments in Sorghum Bread Making; Woodhead Publishing Limited: Sawston, UK, 2005. [Google Scholar]
  52. Ahmadi, S.H.; Andersen, M.N.; Plauborg, F.; Poulsen, R.T.; Jensen, C.R.; Sepaskhah, A.R.; Hansen, S. Effects of irrigation strategies and soils on field grown potatoes: Yield and water productivity. Agric. Water Manag. 2010, 97, 1923–1930. [Google Scholar] [CrossRef]
Figure 1. Means (±SE) of interaction between treatments and planting cycle for: (a) plant height, (b) number of leaves, (c) shoot fresh weight, (d) shoot dry weight, (e) leaf fresh weight, (f) leaf dry weight, (g) total leaf area, and (h) leaf chlorophyll content. On the same chart, means with the same letters are not significantly different (p > 0.05) from one another using Tukey’s test. All measurements are expressed on a per plant basis.
Agronomy 12 02220 g001aAgronomy 12 02220 g001b
Figure 2. Mean (±SE) interaction between treatments and the planting cycle on (a) soil VMC, (b) leaching volume, (c) pH, (d) EC, (e) NH 4 + , and (f) NO 3 contents of leachate. On the same chart, means with the same letters are not significantly different (p > 0.05) from one another using Tukey’s test. VMC is volumetric moisture content.
Agronomy 12 02220 g002aAgronomy 12 02220 g002b
Figure 3. Means (±SE) of interaction effect between soil type and planting cycle on (a) VMC, (b) leachate volume, and (c) NH 4 + leachate contents. VMC volumetric moisture content, CL clay soil, SL silt loam soil, SCL sandy clay loam soil. On the same chart, means with the same letters are not significantly different (p > 0.05) from one another using Tukey’s test. Means were taken across all the treatments.
Agronomy 12 02220 g003aAgronomy 12 02220 g003b
Figure 4. Means (±SE) of plant N content as influenced by different treatments. Means with the same letters are not significantly different (p > 0.05) from one another using Tukey’s test.
Agronomy 12 02220 g004
Figure 5. Means (±SE) interaction between treatments and the planting cycle on plant nutrient: (a) P, (b) K, (c) Ca, (d) Mg, (e) Cu, (f) Zn, and (g) B. On the same chart, means with the same letter(s) within the same chart are not significantly different (p > 0.05) from one another using Tukey’s test.
Agronomy 12 02220 g005aAgronomy 12 02220 g005b
Figure 6. Means (±SE) of the interaction effect of soil types and treatments on total soil (a) NH 4 + , (b) P, (c) K, (d) Ca, (e) Mg, (f) Cu, (g) Zn, and (h) B contents. Within the same chart, means followed by the same letter(s) are not significantly different (p > 0.05) from one another using Tukey’s test. Means were taken across the three planting cycles.
Agronomy 12 02220 g006aAgronomy 12 02220 g006b
Figure 7. Means (±SE) of interaction between the treatments and planting cycles on bacterial population across soil types. Means with the same letter are not significantly different (p > 0.05) from one another using Tukey’s test.
Agronomy 12 02220 g007
Figure 8. Means (±SE) of interaction between soil types and treatments on WP (a), WUE (b), and interaction between treatments and planting cycle on WP (c) and WUE (d). Within the same chart, means followed by the same letter are not significantly different (p > 0.05) from one another using Tukey’s test.
Agronomy 12 02220 g008
Table 1. Means (± SE) element analyses of washed rice water and the tap water used in the study.
ParametersF0F3Tap Water
pH6.53 ± 0.024.53 ± 0.086.58 ± 0.02
EC (µS cm−1)285.83 ± 34.53551.30 ± 21.42125.36 ± 28.21
Total C (mg kg−1)2850.23 ± 120.742160.43 ± 401.2330.02 ± 2.23
S (mg kg−1)110.10 ± 40.39120.62 ± 10.57100.21 ± 10.31
Total N (mg kg−1)160.11 ± 5.20220.11 ± 41.6230.20 ± 4.12
NH 4 + -N (mg kg−1)10.50 ± 1.6811.80 ± 0.361.44 ± 0.04
NO 3 - N (mg kg−1)5.48 ± 1.415.40 ± 0.061.45 ± 0.03
P (mg kg−1)90.92 ± 3.76209.81 ± 11.210.05 ± 0.02
K (mg kg−1)118.11 ± 14.21135.80 ± 9.225.74 ± 0.15
Ca (mg kg−1)8.52 ± 2.1013.61 ± 0.5310.95 ± 0.06
Mg (mg kg−1)27.9 ± 1.7666.81 ± 3.220.97 ± 0.06
Cu (mg kg−1)0.188 ± 0.010.206 ± 0.030.002 ± 0.0001
Zn (mg kg−1)0.074 ± 0.010.253 ± 0.010.005 ± 0.0001
B (mg kg−1)0.121 ± 0.020.183 ± 0.020.001 ± 0.0001
F0 is unfermented washed rice water (WRW); F3 is fermented WRW for 3 days.
Table 2. Initial mean (±SE) physicochemical properties of the three soils used in this study.
ParametersSandy Clay LoamSilt LoamClay
pH5.32 ± 0.216.3 ± 0.116.8 ± 0.26
EC (dS m−1)0.72 ± 0.051.03 ± 0.100.62 ± 0.04
Clay (<2 μm)21.59 ± 1.2117.8 ± 1.0165.19 ± 2.76
Silt (2–50 μm)6.63 ± 0.6754.69 ± 1.379.28 ± 0.07
Sand (>50 μm)71.78 ± 3.4127.51 ± 1.6225.53 ± 1.60
Total C (%)1.01 ± 0.051.47 ± 0.101.75 ± 0.03
Total N (%)0.08 ± 0.010.12 ± 0.010.15 ± 0.01
NH 4 + - N (mg kg−1)38.82 ± 0.2431.9 ± 1.2634.54 ± 1.75
NO 3 - N (mg kg−1)3.70 ± 0.125.96 ± 0.424.85 ± 0.32
P (mg kg−1)12.40 ± 0.4123.60 ± 1.0219.20 ± 0.81
K (mg kg−1)1053.21 ± 0.08382.20 ± 0.05588.90 ± 0.03
Ca (mg kg−1)1578.36 ± 0.521082.01 ± 0.111558.01 ± 0.22
Mg (mg kg−1)337.20 ± 0.11206.40 ± 0.03114.00 ± 0.05
Cu (mg kg−1)0.14 ± 0.010.16 ± 0.010.22 ± 0.01
Zn (mg kg−1)2.41 ± 0.050.50 ± 0.012.19 ± 0.07
B (mg kg−1)0.18 ± 0.010.31 ± 0.020.54 ± 0.01
Bulk density (Mg m−3) 1.50 ± 0.041.60 ± 0.041.55 ± 0.02
CEC (cmol kg−1)7.24 ± 0.136.33 ± 0.1411.24 ± 0.30
Volumetric soil water content (m3 m−3)
Saturation0.62 ± 0.030.73 ± 0.020.78 ± 0.03
Field capacity0.31 ± 0.010.37 ± 0.010.45 ± 0.01
Permanent wilting point0.13 ± 0.010.21 ± 0.010.26 ± 0.01
Table 3. Mean (±SE) total nutrients added by the different treatments over the three planting cycles (90 days in total).
ParametersF0F3NPKTap Water
Total C (mg)59850 ± 112045360 ± 14001320 ± 60
S (mg)2310 ± 2402530 ± 1601130 ± 160
Total N (mg)3310 ± 8204620 ± 3203830 ± 1601131 ± 80
NH 4 + -N (mg)220 ± 10250 ± 6091 ± 10
NO 3 - N (mg)120 ± 10110 ± 4090 ± 10
P (mg)1900 ± 804400 ± 2102730 ± 14031 ± 10
K (mg)2510 ± 1002850 ± 1203610 ± 120361 ± 20
Ca (mg)180 ± 10280 ± 20689 ± 40
Mg (mg)580 ± 201400 ± 7061 ± 7
Cu (mg)3.92 ± 0.114.33 ± 0.230.151 ± 0.01
Zn (mg)1.51 ± 0.065.32 ± 0.310.333 ± 0.01
B (mg)2.54 ± 0.133.81 ± 0.130.175 ± 0.01
F0 is unfermented washed rice water (WRW); F3 is fermented WRW for 3 days, NPK is the 450 kg ha−1 of NPK 15:15:15 recommended for vegetable growth by Vimala and Chan [30].
Table 4. Means (±SE) of the interaction effect between soil types and treatments on the plant growth parameters.
Soil TypeTreatmentHGTSFWSDWLFWLDWTLASLAChlorophyll
cmg plant−1cm2g cm−2µg cm−2
CLNPK34.16 ±
1.22 a
18.76 ±
0.64 d
1.92 ±
0.10 b
71.49 ±
2.13 a
6.19 ±
0.32 a
1525.11 ±
112.60 a
202.82 ±
13.20 abc
33.92 ±
0.74 a
F335.01 ±
0.62 a
26.23 ±
0.47 b
2.29 ±
0.12 a
65.83 ±
1.25 ab
5.70 ±
0.25 ab
1483.09 ±
98.20 a
216.07 ±
16.20 abc
33.13 ±
0.74 ab
F031.93 ±
0.92 b
17.34 ±
0.28 e
1.76 ±
0.11 b
52.06 ±
2.12 cd
4.92 ±
0.23 bcd
1061.73 ±
79.30 de
182.84 ±
10.20 bc
31.51 ±
0.65 bc
CON27.90 ±
0.99 ef
8.05 ±
0.21 i
0.75 ±
0.07 e
35.75 ±
2.10 fg
3.29 ±
0.25 fg
712.27 ±
21.60 fg
200.16 ±
14.40 abc
28.88 ±
1.71 d
SLNPK30.46 ±
1.01 cd
17.30 ±
0.31 e
1.71 ±
0.10 b
55.75 ±
2.87 cd
4.92 ±
0.32 bcd
974.82 ±
21.60 e
188.17 ±
10.62 bc
32.11 ±
2.01 ab
F331.44 ±
0.76 c
17.68 ±
0.41 de
1.66 ±
0.08 b
50.92 ±
2.15 cde
4.44 ±
0.08 cde
947.12 ±
36.20 e
198.51 ±
11.60 ab
32.99 ±
1.65 ab
F029.14 ±
0.59 de
14.63 ±
0.37 f
1.27 ±
0.08 c
42.09 ±
1.89 ef
3.75 ±
0.98 ef
784.42 ±
22.30 f
194.91 ±
12.70 bc
31.48 ±
1.43 bc
CON27.15 ±
0.55 f
10.12 ±
0.26 h
0.89 ±
0.03 de
31.36 ±
1.23 g
2.69 ±
0.56 g
593.72 ±
34.21 g
214.11 ±
14.30 abc
29.70 ±
0.96 cd
SCLNPK34.30 ±
1.10 a
17.83 ±
0.29 de
2.01 ±
0.71 ab
58.81 ±
2.54 bc
5.44 ±
0.21 ab
1301.93 ±
78.50 bc
218.92 ±
10.62 ab
31.25 ±
0.56 bc
F334.71 ±
1.17 a
33.64 ±
1.05 a
2.36 ±
0.91 a
55.55 ±
2.88 cd
5.26 ±
0.16 bc
1434.97 ±
98.99 ab
258.33 ±
17.80 a
32.76 ±
1.22 ab
F033.32 ±
1.21 ab
22.47 ±
0.89 c
1.86 ±
0.86 b
54.78 ±
3.01 cd
5.19 ±
0.27 bcd
1192.13 ±
85.64 cd
199.59 ±
13.70 abc
31.94 ±
1.43 ab
CON28.68 ±
0.93 ef
12.62 ±
0.67 g
1.20 ±
0.79 cd
47.40 ±
2.52 de
4.39 ±
0.62 de
711.14 ±
23.70 fg
155.68 ±
12.40 c
28.14 ±
0.78 d
p-value <0.001<0.001<0.001<0.001<0.001<0.001<0.0010.160
Note: HGT plant height, SFW shoot fresh weight, SDW shoot dry weight, LFW leaf fresh weight, LDW leaf dry weight, TLA total leaf area, SLA specific leaf area, CL clay soil, SL silt loam soil, SCL sandy clay loam soil. Means followed by different letters within the column differ significantly (p < 0.05) from one another using Tukey’s test. Means were taken across all planting cycles.
Table 5. Means (±SE) of interaction effect between soil types and treatments on volumetric moisture content and leachate nutrient contents.
Soil TypeTreatmentVMCpH NH 4 + NO 3
% mg L−1
CLNPK31.80 ±
0.43 a
3.78 ±
0.10 e
112.04 ±
8.61 cde
118.22 ±
5.41 cde
F332.07 ±
0.27 a
4.11 ±
0.20 de
119.70 ±
7.2 cde
138.38 ±
10.1 bcd
F031.64 ±
0.73 a
6.00 ±
0.32 a
99.15 ±
6.91 def
183.53 ±
10.62 a
CON31.55 ±
1.12 a
4.57 ±
0.21 cde
64.30 ±
4.32 f
101.56 ±
8.62 de
SLNPK31.99 ±
1.43 a
5.10 ±
0.31 bc
113.77 ±
9.43 cde
87.64 ±
6.32 e
F331.70 ±
0.67 a
5.66 ±
0.24 ab
132.43 ±
8.2 bcd
173.47 ±
8.54 ab
F032.52 ±
1.54 a
5.67 ±
0.26 ab
123.84 ±
6.55 cd
121.56 ±
10.87 cde
CON32.57 ±
1.54 a
5.13 ±
0.27 bc
82.41 ±
5.21 ef
90.14 ±
7.54 e
SCLNPK29.18 ±
0.88 b
4.31 ±
0.21 cde
168.60 ±
7.92 b
113.54 ±
9.65 cde
F329.18 ±
0.47 b
4.94 ±
0.21 bcd
230.37 ±
14.3 a
152.06 ±
11.87 abc
F029.45 ±
0.65 b
5.63 ±
0.36 ab
148.07 ±
7.92 bc
147.33 ±
12.61 abc
CON28.83 ±
0.66 b
5.14 ±
0.28 bc
125.67 ±
8.43 cd
127.42 ±
7.66 cde
p-value 0.02<0.001<0.001<0.001
Note: VMC volumetric moisture content, CL clay soil, SL silt loam soil, SCL sandy clay loam soil. Means followed by different letters within the column differ significantly (p < 0.05) from one another using Tukey’s test. Means were taken across all planting cycles.
Table 6. Pearson correlation coefficients between plant growth parameters and soil bacterial population.
ParametersHGTLFNUMSFWSDWLFWLDWTLASLACHP
LFNUM0.878 **
SFW0.667 **0.438 *
SDW0.810 **0.661 **0.932 **
LFW0.742 **0.516 *0.818 **0.788 **
LDW0.774 **0.557 *0.833 **0.817 **0.992 **
TLA0.757 **0.499 *0.886 **0.840 **0.960 **0.957 **
SLA0.585 **0.293 ns0.861 **0.762 **0.766 **0.758 **0.894 **
CHP0.697 **0.630 **0.657 **0.719 **0.695 **0.694 **0.693 **0.626 **
SBP (×106)0.707 **0.472 *0.736 **0.722 **0.608 **0.630 **0.694 **0.664 **0.542 **
HGT plant height, LFNUM number of leaves, SFW shoot fresh weight, SDW shoot dry weight, LFW leaf fresh weight, LDW leaf dry weight, TLA total leaf area, SLA specific leaf area, CHP Chlorophyll, SBP soil bacterial population, * significant at 5%, ** significant at 1% and ns not significant at 5%.
Publisher’s Note: MDPI stays neutral with regard to jurisdictional claims in published maps and institutional affiliations.

