Article

Identification and Validation of the Genomic Regions for Waterlogging Tolerance at Germination Stage in Wheat

State Key Laboratory of Crop Biology, College of Agronomy, Shandong Agricultural University, Tai’an 271018, China
*
Authors to whom correspondence should be addressed.
These authors contributed equally to this work.
Agronomy 2022, 12(8), 1848; https://doi.org/10.3390/agronomy12081848
Submission received: 8 July 2022 / Revised: 28 July 2022 / Accepted: 2 August 2022 / Published: 4 August 2022

Abstract

:
Waterlogging occurs when field soil is saturated with water induced by extensive rainfall or improper irrigation, which is a severe abiotic stress influencing wheat plant growth and yield production. At the germination stage, waterlogging usually induces rot of seeds and reduced germination rate and seedling survival. Development of tolerant wheat varieties is the most efficient approach to improve seed germination and mitigate the damages caused by waterlogging. In this study, we screened 432 wheat accessions at germination stage by waterlogging treatment, and identified 27 tolerant accessions with a germination rate of over 80% after treatment. To identify quantitative trait loci (QTL) for waterlogging tolerance, two segregation populations were developed by crossing waterlogging-tolerant cultivars Shannong 135 and Huaimai 18 with sensitive cultivars Siyang 936 and CD1840, respectively. Three QTL qWlg5A, qWlg7B and qWlg2D for waterlogging tolerance were detected on chromosomes 5A, 7B and 2D through bulked segregation analysis genotyped by wheat 55K SNP array. Two, one, and two kompetitive allele specific PCR (KASP) assays linked with qWlg5A, qWlg7B and qWlg2D were developed and validated in the two populations, respectively. The identified waterlogging tolerant germplasm lines, the QTL for waterlogging tolerance and the high-throughput KASP markers, were highly valuable in improving waterlogging tolerance in wheat-marker-assisted breeding.

1. Introduction

Wheat (Triticum aestivum L.) is one of the most important cereals, feeding more than half of the world’s population; however, its production is always influenced by various biotic and abiotic stresses [1]. Among them, waterlogging, occurring when soil is saturated with water induced by extensive rainfall or improper irrigation, is one of the severe environmental stresses limiting wheat production worldwide [2]. Globally, 10–15 million hectares of wheat fields are annually influenced by waterlogging stress, which usually causes 15–50% yield losses, especially for wheat production areas with sharp rainfall or irrigation fields without proper drainage facilities [3,4]. In China, waterlogging is particularly serious at the middle and downstream areas of the Yangtze River because of a large amount of rainfall during wheat planting season [5]. In addition, at rice–wheat rotation zones, the long-term soaking during rice planting season usually causes soil to be sticky, which often induces waterlogging stress for wheat plant growth due to poor permeability and drainage of fields, resulting in considerable yield losses [6].
Wheat is highly sensitive to waterlogging stress and probably encounters waterlogging at any period, from germination and seedling stages to booting and filling stages [7,8]. Waterlogging happening at an early period (germination, seedling and tillering stages) usually induces rot of wheat seeds, reduced seedling survival, faded leaves and delayed tillering [5]. Waterlogging occurring at later periods (heading, flowering and filling stages) induces leaf senescence and decreases effective spikelet numbers, grain numbers, and grain weight, and finally reduces grain yield [9,10,11]. Due to a lack of oxygen, waterlogging stress influences wheat seed germination and root respiration, hinders plants to absorb nutrients and water, and limits normal metabolism and photosynthesis [12,13]. It also reduces the soil redox potential and causes the accumulation of Mn2+, Fe2+, organic acids and other harmful substances, finally inhibiting the normal growth of plants [8,14]. Besides waterlogging, per se, wheat plants subjected to waterlogging stress are prone to be damaged by diseases, insects and other biotic stresses [15].
Agronomic measures, such as drainage and soil loosening, can partly alleviate the damages of waterlogging [16,17]; however, it is difficult to adopt for large-scale wheat fields due to high costs of manpower, material and financial resources. Identifying waterlogging tolerant germplasms, and breeding and growing tolerant varieties is the most economic approach to mitigate waterlogging damages [18,19]. Given that wheat waterlogging tolerance is a complex trait, controlled by multiple genes with both additive and non-additive effects [2,18], identifying tolerant germplasm and quantitative trait loci (QTL) for waterlogging tolerance is highly valuable in improving wheat waterlogging tolerance.
QTL mapping is an effective approach for dissecting the genetic architecture of complex traits. To date, QTL for waterlogging-tolerance-related traits have been reported in wheat, including several with major effects [20]. In a recombinant inbred line (RIL) population derived from spelt wheat Oberkulmer and common wheat Forno, five QTL affecting survival rate were identified on chromosome 2B, 3B, 5A and 7S, with the major QTL on 5A explaining 20.4% of phenotypic variance [21]. In an RIL population derived from synthetic wheat W7984 and cultivated wheat Opata85, 32 QTL for waterlogging tolerance index were identified on 14 chromosomes, of which the major QTL for germination index on chromosome 7A explained 23.9% of phenotypic variation [22]. Using an RIL population from a cross between two soft red grain wheats USG3209 and Jaypee, Ballesteros et al. [23] identified 48 QTL at vegetative growth stage that clustered into 10 genomic regions, of which the major QTL region for leaf chlorophyll content on chromosome 1D explained 24.0% of phenotypic variance. However, none of these QTL were cloned or fine-mapped because of the huge genome size of wheat and the complex genetic mechanisms of waterlogging tolerance. The advancement of high-resolution genome sequencing approaches and the release of wheat reference genomes facilitated the investigation of the genetic response for waterlogging stress in wheat. Recently, Wei et al. [24] conducted RNA-seq for two wheat cultivars, XM55 and YM158, with different waterlogging tolerances, identifying 942 important different expressed genes mainly involved in steroid metabolism and biosynthesis, downstream brassinosteroids biosynthesis, and hormone signal transduction, which provided valuable information for understanding the mechanisms of waterlogging tolerance.
In the present study, 432 wheat varieties or breeding lines were evaluated for waterlogging tolerance at germination stage. The major objectives were to (1) identify germplasms with tolerance to waterlogging stress; (2) detect QTL conferring waterlogging tolerance and develop linked kompetitive allele specific PCR (KASP) assays. Our study provides valuable germplasms, useful genes, and high-throughput SNP markers for waterlogging tolerance improvement in wheat breeding.

2. Materials and Methods

2.1. Plant Materials

The materials comprised 432 released wheat cultivars or elite breeding lines from the main wheat growing areas of China. Based on the screening result for waterlogging tolerance at the germination stage of these varieties, two tolerant varieties, Shannong 135 (SN135) and Huaimai 18 (HM18), were crossed with sensitive varieties, Siyang 936 (SY936) and CD1840, respectively, to develop two segregation populations SN135 × SY936, and HM18 × CD1840, comprising 184 and 215 F3 lines, respectively. The seeds used for waterlogging tolerance evaluation were harvested from the 2020–2021 experiment planted at the experiment station of Shandong Agricultural University, Taian (36.20° N, 117.08° E), Shandong Province in China.

2.2. Evaluation of Waterlogging Tolerance

Two replications of 20 seeds from each line were placed in 120 mL wide-mouth bottles with two layers of wet filter paper. The bottles were filled with ultrapure water to simulate waterlogging stress, then these bottles were kept in a germination chamber set at 14/10 h photoperiod with temperatures of 22/20 °C. After five days of waterlogging treatment, the water in the bottles was removed, and the seeds were kept germinating for five days. The seeds’ germination rates (SGRs) were measured as the number of germinated seeds divided by total number (20 seeds), which was used to indicate waterlogging tolerance.

2.3. DNA Extraction and Genotyping

Genomic DNA was isolated by a modified CTAB method. For each population of SN135 × SY936 and HM18 × CD1840, two extreme bulks were constructed by equally mixing the DNA of ~30 highly tolerant or sensitive plants. The four extreme bulks coupled with four parents were genotyped by wheat_55k SNP array for bulked segregant analysis (BSA).

2.4. KASP Assay for SNPs

KASP primers of SNPs were designed by PolyMarker (http://www.polymarker.info/, accessed on 10 April 2022). KASP assays were carried out in 384-well formats and set up as 6 μL PCR reaction volumes consisting of 3 μL of 2 × KASP master mix, 0.0825 μL of KASP primer assay mix, and 3 μL of genomic DNA at a concentration of 20 ng/μL. The PCR was conducted in an ABI QuantStudio 12K Flex Real-Time PCR System (Life Technology, Grand Island, NY, USA) following the manufacturers’ recommendations (https://biosearch-cdn.azureedge.net/assetsv6/Analysis-of-KASP-genotyping-data-using-cluster-plots.pdf, accessed on 15 April 2022).

2.5. Statistical Analysis

The experiment errors of two replicates for these varieties were tested by analysis of variance (ANOVA), and the heritability (h2) was calculated as the sum square of accessions divided by total sum square of the model. The mean value of the two replicates for each plant was calculated for the subsequent data analysis. The phenotype distribution was plotted using hist function implemented in R software. The genotype data were analyzed using EXCEL to identify polymorphic SNPs between the parents and the extreme bulks. The phenotypic differences between different genotypes at each QTL were determined by ANOVA and graphed using ggplot2 package implemented in R software.

3. Results

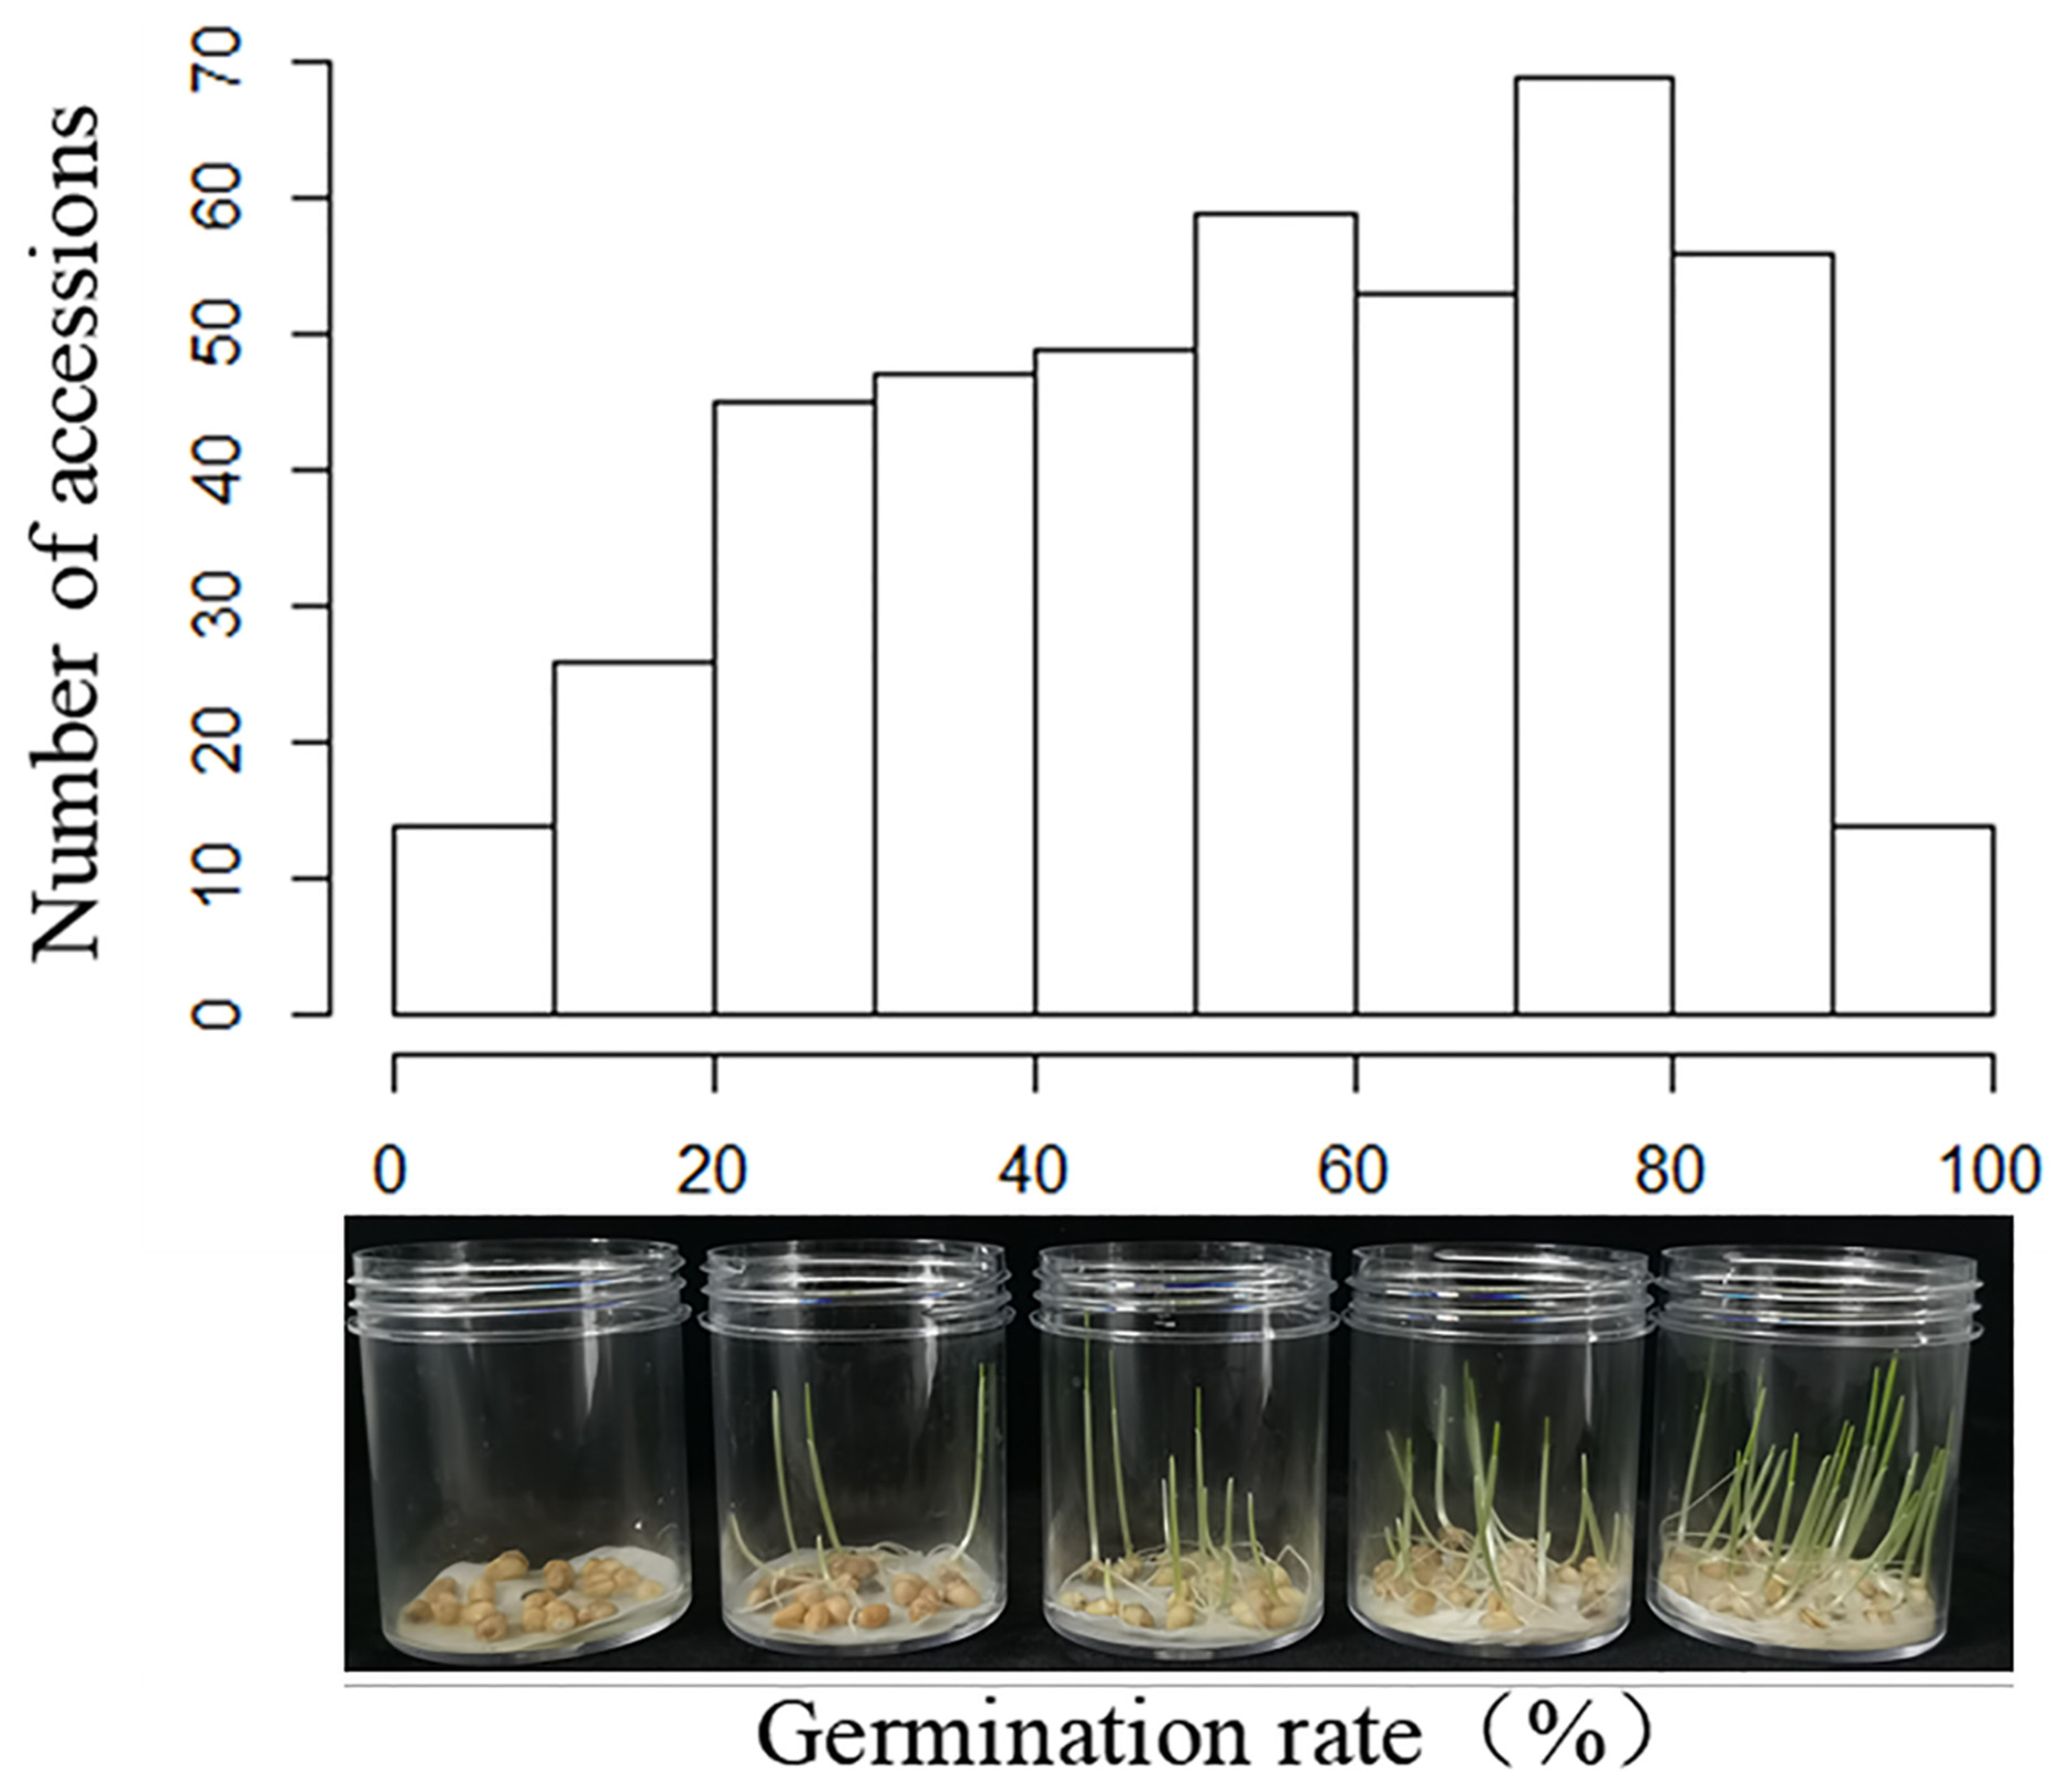
3.1. Variation of Waterlogging Tolerance among Wheat Varieties

Wide variations were observed for the SGR after waterlogging treatment of 432 varieties. ANOVA of SGR showed that the difference among accessions was highly significant with a p-value of 1.7 × 10−41, and the heritability was 0.79. The difference between replicates was significant at the level of p < 0.01, indicating the experiment error was controlled properly (Table 1). The SGRs of the 432 varieties were almost 100% under normal conditions; however, after waterlogging treatment, the average SGR of these varieties was reduced to 55.5%. A wide variation of SGR among these varieties was observed after waterlogging treatment with a range of 2.0–96.0% (Figure 1), indicating significantly different waterlogging tolerance among wheat varieties. From the 432 accessions, we identified 27 varieties/lines highly tolerant to waterlogging, with the SGR over 80% (Supplementary Table S1).

3.2. Phenotyping of SN135/SY936 and HM18/CD1840 Populations and Extreme Bulks

Wide and continuous variations of SGR were observed in the SN135/SY936 and HM18/CD1840 populations after waterlogging treatment, and the germination of seeds reduced considerably with the average SGR of 36.4 and 36.5% for the populations SN135/SY936 and HM18/CD1840, respectively (Figure 2). Based on the phenotype of the two populations, two extremely tolerant and sensitive bulks with contrasting SGRs were constructed for each population. For the population of SN135 × SY936, 30 plants with SGRs ranging from 73–92% were selected as extremely tolerant bulk, whereas 28 plants with SGRs ranging from 0 to 12% were selected as an extremely sensitive bulk. For the population of HM18 × CD1840, 29 plants with SGRs ranging from 75 to 95% were selected to form an extremely tolerant bulk, and 31 plants with SGRs ranging from 0 to 10% were selected to form an extremely sensitive bulk.

3.3. Genotyping of Extreme Tolerant and Sensitive Bulks

For the population of SN135 × SY936, 5855 polymorphic SNPs distributed on the whole genome were identified between the two parents, of which 285 were polymorphic between the tolerant and sensitive bulks. Most of these polymorphic SNPs were located on chromosomes 5A and 7B, with 60 and 40 SNPs, respectively (Table 2 and Figure 3). Among the 60 polymorphic SNPs on chromosome 5A, 57 were located in the region of 659.6–709.1 Mb, whereas in the 40 polymorphic SNPs on chromosome 7B, 35 were located in the region of 583.9–614.2 Mb (Table 2). For the population of HM18 × CD1840, 15709 polymorphic SNPs between the two parents were identified as being distributed on the 21 chromosomes. Among them, 370 sites were polymorphic between the two bulks, and most of the SNPs were located on chromosome 2D (126) (Table 2 and Figure 3), of which 120 SNPs were distributed in the region of 570.4–619.0 Mb. The results indicated that these three regions on chromosomes 5A, 7B and 2D might harbor QTL governing waterlogging tolerance, namely qWlg5A, qWlg7B and qWlg2D, respectively.

3.4. Validation of QTL by KASP Assay

To validate the three regions identified by BSA, five KASP assays, including two for qWlg5A, one for qWlg7B, and two for qWlg2D were successfully developed according to the identified polymorphic SNPs (Table 2). These five KASP assays were run across the two populations (Figure 4a). ANOVA analysis for each KASP showed that SGRs of different genotypes were significantly different. In the population of SN135 × SY936, the phenotypic variation explained by k5A6810 (qWlg5A), k5A6857 (qWlg5A) and k7B6029 (qWlg7B) was 10.6, 15.3 and 20.5%, respectively (Table 3). For all of the three markers, the average SGR of plants conferring SN135 alleles (44.3–46.2%) was higher than that of plants carrying SY936 alleles (16.8–25.6%), and the average SGR of heterozygotes (31.6–39.4%) was between them (Figure 4b–d). Hence, the favorable alleles improving waterlogging tolerance of qWlg5A and qWlg7B were both contributed to by the tolerant parent SN135. In the population of HM18 × CD1840, k2D5802 and k2D5904 explained 8.0 and 5.1% of phenotypic variation, respectively. The average SGR of plants carrying HM18 alleles (46.3–48.0%) of the two markers was higher than that of plants carrying CD1840 alleles (31.1–32.1%), and the average SGR of heterozygotes (31.3–33.2%) was close to the plants carrying CD1840 alleles (Figure 4e,f), indicating the tolerant allele of qWlg2D was from tolerant parent HM18.

4. Discussion

4.1. SNP Array Combined with BSA Is Effective for QTL Identification

SNP is the most abundant class of polymorphic markers in a genome, and has been widely used in wheat genetic studies [25,26]. The development of wheat SNP arrays greatly facilitates the high-throughput genotyping of wheat accessions and gene cloning [27,28]. In the present study, the wheat_55k SNP array combined with the BSA method was applied to identify the genomic region for waterlogging tolerance and three genomic regions with concentrated polymorphic SNPs between the tolerant and sensitive bulks were identified and were designated as three QTL (qWlg5A, qWlg7B and qWlg2D) for waterlogging tolerance. The QTL were further validated by the two segregation populations of SN135 × SY936 and HM18 × CD1840 by combining the genotyping data of the five KASP assays (k5A6810 and k5A6857 for qWlg5A, k7B6029 for qWlg7B, and k2D5802 and k2D5904 for qWlg2D) and phenotyping data (Table 2). Our results demonstrated that wheat SNP arrays, combined with BSA, are an effective way to identify the genomic region for a specific complex trait in wheat, and thus can be widely used in other studies.

4.2. Comparison with Previous Reported Waterlogging Tolerance QTL

The three waterlogging tolerance QTL (qWlg5A, qWlg7B, and qWlg2D) identified in this study were located in the region of 659.6–709.1 Mb, 583.9–614.2 Mb, and 570.4–619.0 Mb on chromosomes 5A, 7B and 2D, respectively (Table 2). On chromosome 5A, previous studies also identified QTL for waterlogging tolerance affecting seedling growth index of the flooded plants, mean germination time of the flooded plants, percentage of survival and leakage on metabolites under waterlogging stress in the early phase of germination [21]. Due to the lack of marker information, we cannot compare the physical position of these QTL with qWlg5A to figure out whether they were the same.
On chromosome 7B, QTL for waterlogging tolerance-related traits, such as shoot dry weight index, survival rate, plant height index, and root length index were detected previously [22,29]. In the RIL population derived from W7984 and Opata85, one QTL for waterlogging tolerance affecting shoot dry weight index was identified in the region flanked by Xbarc50 and Xgwm146, one QTL affecting survival rate was detected to be linked with Xbcd1338, one QTL affecting plant height index was detected around markers Xbcd310, and one QTL affecting root length index was detected around marker Xgwm333 [22,29]. However, these QTL were far away from qWlg7B identified in the present study (Table 2). Thus, the QTL on 7B identified in this study was a putative novel QTL for waterlogging tolerance.
On chromosome 2D, previous studies also identified QTL for waterlogging tolerance that affected seedling growth index and germination time of flooded plants under waterlogging stress in the early phase of germination, plant height index and shoot dry weight index [21,22,29]. Among them, the QTL affecting plant height index linked with Xbarc228 (570.4 Mb) [22] was close to qWlg2D detected in the present study (Table 2), indicating they were probably the same QTL. The repeatable QTL identified by different studies is free of genetic background and is more valuable in wheat breeding for enhancing seed germination ability under waterlogging conditions.

4.3. Candidate Genes Governing Waterlogging Tolerance

Although several QTL for waterlogging tolerance have been reported in wheat, none of these QTL are cloned yet and only few putative candidate genes have been identified, such as SOD, NADPH oxidase, and TaERFVII.1, which were mainly involved in ROS producing/scavenging [2,30,31]. The three QTL identified in the present study still covered long chromosome regions harboring many annotated genes, and further fine mapping is required to narrow down the QTL region to identify the causal genes underlying waterlogging tolerance. However, through comparison with waterlogging-resistant-related genes reported in other crops, we still got some interesting information. Within the region of qWlg5A, the gene TraesCS5A01G492100.1 (heavy metal transport/detoxification superfamily protein, HMS) is the syntenic gene of GRMZM2G5574, a candidate gene related to waterlogging tolerant in maize, detected by BSR-seq that differentially expressed between susceptible and tolerant bulks [32]. Another annotated gene within the region of qWlg2D encoding a BTB/POZ domain containing protein (TRIAE_CS42_2DL_TGACv1_159317_AA0536460.1) is the homology of OsOMT, influencing rice seed vigor by modulating amino acid levels and glycolysis and tricarboxylic acid cycle processes [33]. Seed vigor is one of the key factors influencing waterlogging tolerance, and high seed vigor could improve waterlogging tolerance [34]. Therefore, these two genes were considered as the most likely candidate genes of qWlg5A and qWlg2D, respectively.

4.4. Germplasms for Wheat Waterlogging Tolerance Breeding

Waterlogging-resistant germplasms are key genetic sources for wheat breeding. Different tolerant germplasms could form different physiological mechanisms to cope with waterlogging stress, such as lowering metabolism, changing metabolic pathways or isolating toxic substances and increasing oxygen supply by morphological changes [35,36]. Thus, evaluation of waterlogging tolerance of different germplasms is very important to identify genes conferring different physiological mechanisms for waterlogging tolerance. The QTL qWlg5A, qWlg7B and qWlg2D were identified from different varieties (SN135 and HM18), and the putative candidate genes underlying qWlg5A and qWlg2D modulating waterlogging tolerance through different mechanisms in this study further demonstrate the importance of evaluation of waterlogging tolerance of different germplasms.
Under waterlogging treatment, the protrusion of seeds can be observed but the elongation of coleoptiles cannot; after the removal of water, the seeds of tolerant varieties still have the ability to germinate, whereas those of sensitive varieties will rot. When exposed to waterlogging stress after sowing, the seed germination of sensitive varieties reduced significantly; thus, the ability to germinate after waterlogging is essential for identifying tolerant varieties. Through evaluating drops of SGR coupled with decreased percentage point, plant waterlogging index and the root waterlogging index, Cai et al. [37] identified 28 tolerant lines from 155 wheat varieties or advanced breeding lines at bud-seedling stage. In this study, through evaluating SGR after waterlogging treatment, 27 accessions with germination rate ≥80% were identified; thus, these varieties were believed highly tolerant to waterlogging stress (Supplementary Table S1). Among them, some varieties were also identified as tolerant to waterlogging by previous studies, such as Zhoumai 27 [38], Huaimai 18 [39], etc. Therefore, our study provided valuable parental materials for wheat breeding to improve waterlogging toleration at germination stage.

4.5. Cost-Effective Markers for Wheat Molecular Breeding

KASP assay is a time saving and cost-effective genotyping assay for single SNP analysis [40]. In this study, two, one and two SNPs within the region of qWlg5A, qWlg7B and qWlg2D were successfully converted into high-throughput KASP assays, respectively, and were validated to be linked with the three QTL for waterlogging tolerance (Figure 4). These KASP markers could be used to trace their linked QTL in the breeding procedure. Hence, the five waterlogging-tolerant-related KASP markers are useful in further QTL fine mapping to identify causal genes and marker-assisted selection to improve wheat waterlogging tolerance.

Supplementary Materials

The following supporting information can be downloaded at: https://www.mdpi.com/article/10.3390/agronomy12081848/s1. Table S1: The varieties highly resistant to waterlogging stress.

Author Contributions

Y.P., X.W. and S.L. wrote the manuscript; M.Z., Y.L., Q.Y., S.S. and Y.W. performed experiments, phenotype and genotype evaluations; Y.P. and X.W. analyzed the data. All authors contributed to writing the manuscript. All authors have read and agreed to the published version of the manuscript.

Funding

This work is supported by the Natural Science Foundation of Shandong Province in China (ZR2019BC071) and National Natural Science Foundation of China (32072052).

Institutional Review Board Statement

Not applicable.

Informed Consent Statement

Not applicable.

Data Availability Statement

The data presented in this study are available on request from the corresponding author.

Conflicts of Interest

The authors declare no conflict of interests.

References

  1. Afzal, F.; Chaudhari, S.K.; Gul, A.; Farooq, A.; Ali, H.; Nisar, S.; Sarfraz, B.; Shehzadi, K.J.; Mujeeb-Kazi, A. Bread wheat (Triticum aestivum L.) under biotic and abiotic stresses: An overview. In Crop Production and Global Environmental Issues; Hakeem, K.R., Ed.; Springer International Publishing: Cham, Switzerland, 2015; pp. 293–317. [Google Scholar]
  2. Tong, C.; Hill, C.B.; Zhou, G.; Zhang, X.-Q.; Jia, Y.; Li, C. Opportunities for improving waterlogging tolerance in cereal crops—physiological traits and genetic mechanisms. Plants 2021, 10, 1560. [Google Scholar] [CrossRef] [PubMed]
  3. Shabala, S. Physiological and cellular aspects of phytotoxicity tolerance in plants: The role of membrane transporters and implications for crop breeding for waterlogging tolerance. New Phytol. 2011, 190, 289–298. [Google Scholar] [CrossRef] [PubMed] [Green Version]
  4. Kaur, G.; Singh, G.; Motavalli, P.P.; Nelson, K.A.; Orlowski, J.M.; Golden, B.R. Impacts and management strategies for crop production in waterlogged or flooded soils: A review. Agron. J. 2020, 112, 1475–1501. [Google Scholar] [CrossRef] [Green Version]
  5. Ding, J.; Liang, P.; Wu, P.; Zhu, M.; Li, C.; Zhu, X.; Gao, D.; Chen, Y.; Guo, W. Effects of waterlogging on grain yield and associated traits of historic wheat cultivars in the middle and lower reaches of the Yangtze River, China. Field Crop. Res. 2020, 246, 107695. [Google Scholar] [CrossRef]
  6. Yang, H.; Zhai, S.; Li, Y.; Zhou, J.; He, R.; Liu, J.; Xue, Y.; Meng, Y. Waterlogging reduction and wheat yield increase through long-term ditch-buried straw return in a rice—wheat rotation system. Field Crop. Res. 2017, 209, 189–197. [Google Scholar] [CrossRef]
  7. Ghobadi, M.E.; Ghobadi, M.; Zebarjadi, A. Effect of waterlogging at different growth stages on some morphological traits of wheat varieties. Int. J. Biometeorol. 2017, 61, 635–645. [Google Scholar] [CrossRef]
  8. Mfarrej, M.F.B.; Wang, X.; Hamzah Saleem, M.; Hussain, I.; Rasheed, R.; Arslan Ashraf, M.; Iqbal, M.; Sohaib Chattha, M.; Nasser Alyemeni, M. Hydrogen sulphide and nitric oxide mitigate the negative impacts of waterlogging stress on wheat (Triticum aestivum L.). Plant Biol. 2022, 24, 670–683. [Google Scholar] [CrossRef]
  9. Arduini, I.; Orlandi, C.; Pampana, S.; Masoni, A. Waterlogging at tillering affects spike and spikelet formation in wheat. Crop Pasture Sci. 2016, 67, 703–711. [Google Scholar] [CrossRef]
  10. Ploschuk, R.A.; Miralles, D.J.; Striker, G.G. Early- and late-waterlogging differentially affect the yield of wheat, barley, oilseed rape and field pea through changes in leaf area index, radiation interception and radiation use efficiency. J. Agron. Crop Sci. 2021, 207, 504–520. [Google Scholar] [CrossRef]
  11. Ding, J.; Liang, P.; Wu, P.; Zhu, M.; Li, C.; Zhu, X.; Guo, W. Identifying the critical stage near anthesis for waterlogging on wheat yield and its components in the yangtze river basin, China. Agronomy 2020, 10, 130. [Google Scholar] [CrossRef] [Green Version]
  12. Xu, Z.; Shen, Q.; Zhang, G. The mechanisms for the difference in waterlogging tolerance among sea barley, wheat and barley. Plant Growth Regul. 2022, 96, 431–441. [Google Scholar] [CrossRef]
  13. Kulshreshtha, N.; Kumar, A.; Kumar, A.; Lata, C. Genetic Interventions to Improve Salt and Microelement Toxicity Tolerance in Wheat. In New Horizons in Wheat and Barley Research: Global Trends, Breeding and Quality Enhancement; Kashyap, P.L., Gupta, V., Prakash Gupta, O., Sendhil, R., Gopalareddy, K., Jasrotia, P., Singh, G.P., Eds.; Springer: Singapore, 2022; pp. 429–483. [Google Scholar]
  14. Herzog, M.; Striker, G.G.; Colmer, T.D.; Pedersen, O. Mechanisms of waterlogging tolerance in wheat—A review of root and shoot physiology. Plant Cell Environ. 2016, 39, 1068–1086. [Google Scholar] [CrossRef] [PubMed]
  15. Tian, L.X.; Zhang, Y.C.; Chen, P.L.; Zhang, F.F.; Li, J.; Yan, F.; Dong, Y.; Feng, B.L. How does the waterlogging regime affect crop yield? A global meta-analysis. Front. Plant Sci. 2021, 12, 634898. [Google Scholar] [CrossRef] [PubMed]
  16. Manik, S.M.N.; Pengilley, G.; Dean, G.; Field, B.; Shabala, S.; Zhou, M. Soil and crop management practices to minimize the impact of waterlogging on crop productivity. Front. Plant Sci. 2019, 10, 140. [Google Scholar] [CrossRef] [Green Version]
  17. Du, X.; He, W.; Wang, Z.; Xi, M.; Xu, Y.; Wu, W.; Gao, S.; Liu, D.; Lei, W.; Kong, L. Raised bed planting reduces waterlogging and increases yield in wheat following rice. Field Crop. Res. 2021, 265, 108119. [Google Scholar] [CrossRef]
  18. Ahmed, F.; Rafii, M.Y.; Ismail, M.R.; Juraimi, A.S.; Rahim, H.A.; Asfaliza, R.; Latif, M.A. Waterlogging tolerance of crops: Breeding, mechanism of tolerance, molecular approaches, and future prospects. Biomed Res. Int. 2013, 2013, 963525. [Google Scholar] [CrossRef] [PubMed]
  19. Jiang, X.; Mao, D.; Zhu, M.; Wang, X.; Li, C.; Zhu, X.; Guo, W.; Ding, J. Evaluating the waterlogging tolerance of wheat cultivars during the early growth stage using the comprehensive evaluation value and digital image analysis. Agriculture 2022, 12, 384. [Google Scholar] [CrossRef]
  20. Tanin, M.J.; Saini, D.K.; Sandhu, K.S.; Pal, N.; Gudi, S.; Chaudhary, J.; Sharma, A. Consensus genomic regions associated with multiple abiotic stress tolerance in wheat and implications for wheat breeding. bioRxiv 2022. [Google Scholar] [CrossRef]
  21. Burgos, M.S.; Messmer, M.M.; Stamp, P.; Schmid, J.E. Flooding tolerance of spelt (Triticum spelta L.) compared to wheat (Triticum aestivum L.)—A physiological and genetic approach. Euphytica 2001, 122, 287–295. [Google Scholar] [CrossRef]
  22. Yu, M.; Mao, S.L.; Chen, G.Y.; Liu, Y.X.; Li, W.; Wei, Y.M.; Liu, C.J.; Zheng, Y.L. QTLs for waterlogging tolerance at germination and seedling stages in population of recombinant inbred lines derived from a cross between synthetic and cultivated wheat genotypes. J. Integr. Agric. 2014, 13, 31–39. [Google Scholar] [CrossRef]
  23. Ballesteros, D.C.; Mason, R.E.; Addison, C.K.; Andrea Acuña, M.; Nelly Arguello, M.; Subramanian, N.; Miller, R.G.; Sater, H.; Gbur, E.E.; Miller, D.; et al. Tolerance of wheat to vegetative stage soil waterlogging is conditioned by both constitutive and adaptive QTL. Euphytica 2015, 201, 329–343. [Google Scholar] [CrossRef]
  24. Wei, M.; Li, X.; Yang, R.; Li, L.; Wang, Z.; Wang, X.; Sha, A. Novel insights into genetic responses for waterlogging stress in two local wheat cultivars in yangtze river basin. Front. Genet. 2021, 12, 681680. [Google Scholar] [CrossRef] [PubMed]
  25. Pang, Y.; Liu, C.; Wang, D.; St. Amand, P.; Bernardo, A.; Li, W.; He, F.; Li, L.; Wang, L.; Yuan, X.; et al. High-resolution genome-wide association study identifies genomic regions and candidate genes for important agronomic traits in wheat. Mol. Plant 2020, 13, 1311–1327. [Google Scholar] [CrossRef] [PubMed]
  26. Bhatia, D.; Bajwa, G.S. Molecular marker techniques and recent advancements. In Genotyping by Sequencing for Crop Improvement; John Wiley & Sons: Hoboken, NJ, USA, 2022; pp. 1–21. [Google Scholar]
  27. Cavanagh, C.R.; Chao, S.; Wang, S.; Huang, B.E.; Stephen, S.; Kiani, S.; Forrest, K.; Saintenac, C.; Brown-Guedira, G.L.; Akhunova, A.; et al. Genome-wide comparative diversity uncovers multiple targets of selection for improvement in hexaploid wheat landraces and cultivars. Proc. Natl. Acad. Sci. USA 2013, 110, 8057–8062. [Google Scholar] [CrossRef] [Green Version]
  28. Xu, X.; Kolmer, J.; Li, G.; Tan, C.; Carver, B.F.; Bian, R.; Bernardo, A.; Bai, G. Identification and characterization of the novel leaf rust resistance gene Lr81 in wheat. Theor. Appl. Genet. 2022, 135, 2725–2734. [Google Scholar] [CrossRef]
  29. Yu, M.; Chen, G.Y. Conditional QTL mapping for waterlogging tolerance in two RILs populations of wheat. SpringerPlus 2013, 2, 245. [Google Scholar] [CrossRef] [PubMed] [Green Version]
  30. Pan, R.; He, D.; Xu, L.; Zhou, M.; Li, C.; Wu, C.; Xu, Y.; Zhang, W. Proteomic analysis reveals response of differential wheat (Triticum aestivum L.) genotypes to oxygen deficiency stress. BMC Genom. 2019, 20, 60. [Google Scholar] [CrossRef] [Green Version]
  31. Wei, X.; Xu, H.; Rong, W.; Ye, X.; Zhang, Z. Constitutive expression of a stabilized transcription factor group VII ethylene response factor enhances waterlogging tolerance in wheat without penalizing grain yield. Plant Cell Environ. 2019, 42, 1471–1485. [Google Scholar] [CrossRef]
  32. Du, H.; Zhu, J.; Su, H.; Huang, M.; Wang, H.; Ding, S.; Zhang, B.; Luo, A.; Wei, S.; Tian, X.; et al. Bulked segregant RNA-seq reveals differential expression and SNPs of candidate genes associated with waterlogging tolerance in maize. Front. Plant Sci. 2017, 8, 1022. [Google Scholar] [CrossRef] [Green Version]
  33. Li, W.; Yang, B.; Xu, J.; Peng, L.; Sun, S.; Huang, Z.; Jiang, X.; He, Y.; Wang, Z. A genome-wide association study reveals that the 2-oxoglutarate/malate translocator mediates seed vigor in rice. Plant J. 2021, 108, 478–491. [Google Scholar] [CrossRef]
  34. Capo-chich, L.; Eldridge, S.; Elakhdar, A.; Kumamaru, T.; Anyia, A.O. Major QTLs for seedling traits in barley using a DArT-based linkage map. bioRxiv 2019, 12, 889899. [Google Scholar] [CrossRef]
  35. Hossain, M.A.; Uddin, S.N. Mechanisms of waterlogging tolerance in wheat: Morphological and metabolic adaptations under hypoxia or anoxia. Aust. J. Crop Sci. 2011, 5, 1094–1101. [Google Scholar]
  36. Pan, J.; Sharif, R.; Xu, X.; Chen, X. Mechanisms of waterlogging tolerance in plants: Research progress and prospects. Front. Plant Sci. 2021, 11, 627331. [Google Scholar] [CrossRef] [PubMed]
  37. Cai, B.; Tian, W.; Wang, X. Screening of wheat varieties tolerant to waterlogging at bud-seeding stage. J. Henan Agric. Sci. 2015, 44, 52–57. [Google Scholar] [CrossRef]
  38. Ma, B.; Li, Q.; Cai, J.; Zhou, Q.; Huang, M.; Dai, T.; Wang, X.; Jiang, D. Physiological mechanisms of pre-anthesis waterlogging priming on waterlogging stress tolerance under post-anthesis in wheat. Acta Agron. Sin. 2022, 48, 151–164. [Google Scholar] [CrossRef]
  39. Tong, H.; Liu, Y.; Zhu, Z.; Chen, L.; Zhang, Y.; Wu, B.; Gao, C. Morphological and metabolic adaptation of wheat root to waterlogging. Crops 2013, 5, 13–17. [Google Scholar] [CrossRef]
  40. He, C.; Holme, J.; Anthony, J. SNP genotyping: The KASP assay. In Crop Breeding: Methods and Protocols; Fleury, D., Whitford, R., Eds.; Springer: New York, NY, USA, 2014; pp. 75–86. [Google Scholar]
Figure 1. The variation of seed germination rate (SGR) after waterlogging treatment of the 432 wheat varieties.
Agronomy 12 01848 g001
Figure 2. The phenotypic variation of waterlogging tolerance of the two biparental populations. (A) The seeds germination of parents Shannong 135 (SN135) and Siyang 936 (SY936) and distribution of the germination rate of the SN135 × SY936 population after waterlogging treatment. (B) The seed germination of parents Huaimai 18 (HM18) and CD1840 and distribution of the germination rate of population HM18 × CD1840 after waterlogging treatment.
Agronomy 12 01848 g002
Figure 3. The distribution of polymorphic SNP sites identified by 55K_SNP array. (A,C) show the distribution of polymorphic SNP between Shannong 135 and Siyang 936, Huaimai and CD1840, respectively; (B,D) show the distribution of polymorphic SNP between the tolerant and sensitive bulks derived from Shannong 135 × Siyang 936 and Huaimai 18 × CD1840 populations, respectively.
Agronomy 12 01848 g003
Figure 4. The phenotypic variation of five KASP markers validated in the segregation populations. (a) illustrates k2D5904 KASP assays screened in the Huaimai 18 × CD1840 population; (bd) show the average germination rate of lines separated by the genotypes at k5A6810, k5A6857 and k7B6029 in Shannong 135 × Siyang 936 population; (e,f) show the average germination rate of lines separated by the genotypes at k2D5802 and k2D5904 in the Huaimai 18 × CD1840 population. A refers to genotypes of tolerant parent Shannong 135 or Huaimai 18, B refers to genotypes of Siyang 936 or CD1840, and H is heterozygote.
Agronomy 12 01848 g004
Table 1. The analysis of variance for seed germination rate after waterlogging treatment of the 432 wheat varieties.
FactorsDfSum SqMean SqF ValuePr (>F)Heritability (h2)
Accessions43130,012.369.63.81.7 × 10−410.79
Replicates1129.1129.17.10.0080
Residues4317845.918.2
Table 2. QTL region identified for waterlogging tolerance on chromosomes 5A and 7B, and their corresponding linkage KASP markers.
PopulationQTLRegionKASP aPrimer
SN135 × SY936qWlg5A659.6–709.1k5A6810F1: TTGCAGCGCTTCTTTTATCC
F2: TTGCAGCGCTTCTTTTATCG
R: TTTACGATTTTGGTCGGGCC
k5A6857F1: CAGGACACTACCGTCATGGA
F2: CAGGACACTACCGTCATGGG
R: AGCACGGATAAGCAGGTGAC
qWlg7B583.9–614.2k7B6029F1: TGGGAGCCGTAAATAAAGCA
F2: TGGGAGCCGTAAATAAAGCG
R: CTCCCTTCGAAGTTGGGCTT
HM18 × CD1840qWlg2D570.4–619.0k2D5802F1:TCGAATGCCTACCGTGAATAAC
F2: TCGAATGCCTACCGTGAATAAT
R: TGGGTGATATAGCGGCAAAGA
k2D5904F1: GGACGTTGTCGGTACTAAAACT
F2: GGACGTTGTCGGTACTAAAACC
R: TGATCCGAGATCCACAGCTC
a indicates the SNPs that have been converted to KASP marker.
Table 3. Analysis of variance for five KASP assays conducted in the two segregation populations.
PopulationFactorsDfSum SqMean SqF ValuePr (>F)R2 (%)
SN135 × SY936k5A6810212,991.86495.910.654.3 × 10−510.6
Residuals179109,144.4609.7
k5A6857.218,267.99134.015.824.9 × 10−715.3
Residuals175101,070.3577.5
k7B6029224,980.712,490.323.011.3 × 10−920.5
Residuals17997,155.6542.8
HM18 × CD1840k2D5802210,557.335278.78.660.00028.0
Residuals200121,909.4609.5
k2D590426757.8533378.95.380.00535.1
Residuals200125,708.8628.5
Publisher’s Note: MDPI stays neutral with regard to jurisdictional claims in published maps and institutional affiliations.

