Abstract
Soil organic matter (SOM) is heterogeneous and a complex mixture, whose concentration, chemical composition, and structure are strongly associated with the binding behavior of heavy metals (HMs) in soil. The HM-SOM binding affinity affects the HM biotoxicity and bioavailability in the environment. This study investigated Cu’s distribution and binding affinity on five size-fractioned alkaline-extracted soil organic matters (AEOMs) taken from paddy fields. The fractioned AEOMs were M-A (100 kDa −0.45 μm), M-B (3–100 kDa), M-C (1–3 kDa), M-D (0.3–1.0 kDa), and M-E (<0.3 kDa). The average organic carbon (OC) mass percentages were 10.0, 40.3, 6.3, 5.0, and 38.4%, and Cu mass percentages were 9.8, 66.7, 4.7, 4.7, and 14.1% for fractioned M-A, M-B, M-C, M-D, and M-E solutions, respectively. The Cu and AEOM binding affinity, [Cu]/[DOC] ratios, ranged from 3.1 to 127.6 μmol/g-C with 41-fold variation. The ratio order was 63.5 ± 32.3 (M-B) > 32.8 ± 12.8 (M-A) > 28.0 ± 10.5 (M-D) > 24.25 ± 10.7 (M-C) > 12.5 ± 6.0 (M-E) μmol g-C−1. Cu preferred binding with size-fractioned AEOMs ranging from 3 to 100 kDa. The specific ultraviolet absorbance at 254 nm (SUVA254), the fluorescence index (FI), and the biological index (BIX) were significantly correlated with the [Cu]/[DOC] ratios. In each site, the combined bulk and the five size-fractioned AEOMs, the selected optical indicators had a significant correlation with the corresponding [Cu]/[DOC] ratios. Cu-AEOM binding affinity was enhanced by AEOM rich in aromaticity. However, high microbial and autochthonous AEOM origins decreased the binding affinity.
1. Introduction
Soil organic matter (SOM) is one of many important components of soil [1,2,3,4]. SOM and fine particles are major components that are associated with heavy metals (HMs) in soil [4,5,6]. The alkaline and water-extracted organic matter (AEOM/WEOM) of SOM are the main components that bind to HMs [3,4,5,6,7]. AEOM/WEOM comprises phenolic, carboxylic, and hydroxyl functional groups, which have a strong ability to bind HMs [5,8]. The AEOM has a wide range of molecular weights, but the various size-fractioned AEOMs may have different chemical compositions. The binding behavior with HMs is different [9]. The complexation of HMs and AEOM influences the HM mobility, biotoxicity, and fate in the soil environment [3,4,5,6,8,10,11,12,13].
The molecular weights and composition of AEOM are greatly influenced by the biogeochemical processes and the source of the organic matter in the soil environment [1,3,8,14]. The size-fractioned AEOM could play a critical role in distinguishing and simplifying the HM binding behavior [8,9,14,15,16]. The low molecular weight dissolved organic matter (DOM) and AEOM (<1 kDa) still contain various HM species (binding with organic acid and free metal ions) [9,16,17,18]. The low molecular weight DOM/AEOM has a binding capacity to HMs and hydrophobic organic compounds [9,14,19,20].
UV-Vis and fluorescence spectroscopy is a rapid, non-destructive spectral methodology. These sensitive detection methods are widely used to determine the chemical compositions and structures of various DOM/AEOMs [21,22,23,24,25,26,27]. UV-Vis indicator SUVA254 shows DOM/AEOM aromaticity [23,24,28]. The fluorescence index (FI) is relative to the contribution of terrestrial sources [21,23]. The biological index (BIX) is relative to the contribution of autochthonous sources [23,26].
The dissolved organic carbon (DOC) concentration cannot fully predict the mobility potential and binding strength of HMs. To understand the HM-AEOM binding behavior, the AEOM chemical composition and structure needs to be included [6,8,11]. The HM and DOM binding affinity, [Me]/[DOC] ratio, is a useful parameter and has been used to investigate the preferences, distribution, bioavailability, and mobility potential of HMs binding with DOM/AEOM [9,10,11,16,29,30,31,32,33]. Moreover, the HM-AEOM binding affinity in various molecular weight AEOMs is an important factor in understanding the HM binding behavior. Amery et al. [10,11] studied the Cu and DOM binding affinity [Cu]/[DOC] ratios with many soil solutions (lysimeter leachate, soil pore water, water and CaCl2 extracted soil solutions). The ratios had a significantly positive correlation with SUVA254. However, the studies were lacking the molecular weight effect on the ratio difference in the soil solutions. In an aquatic environment, the [Cu]/[DOC] ratios of bulk DOM had been reported by some researchers [16,29,30,32,33]. The ratios were positively correlated with aromaticity for natural water DOM [29,32]. However, when the DOM was affected by anthropogenic sources, such as wastewater effluent input, the ratios had a weak correlation with DOM aromaticity. In addition, the ratios were affected by treatment processes [16,34], molecular weight [16,30,34], and the DOM composition [30]. Hsieh et al. [9] studied [Ni, Cd]/[DOC] ratio distributions in soil AEOM. The results showed that Ni and Cd had different binding affinities with size-fractioned AEOM solutions. Cd preferred binding with low molecular weight AEOM, but Ni favored binding with high molecular weight AEOM. The type of HM, DOM chemical properties, and the DOM molecular weight affected the HM-OM binding affinity. The Cu binding affinity to various molecular weight soil organic matters needs more study in order to assess the Cu biotoxicity and mobility potential in soil.
The binding strength of HMs-OM in the soil is essential in affecting the biotoxicity and bioavailability of heavy metals in agricultural soil. Although previous studies have used sequence extraction to investigate the chemical formation of heavy metals in soil, the method cannot fully provide the heavy metal and organic matter binding strength. Therefore, extracted soil organic matter was separated into size fractions to investigate size-fractioned [HM]/[DOC] ratios. This is an excellent surrogate indicator for understanding heavy metals’ binding strength and preference, distribution, bioavailability, and mobility potential in soil environments [9,10,11,16,29,30,31,32,33]. At the same time, using sensitive and rapid optical indicators to understand the chemical composition and structure of the extracted organic matter can simplify the analysis of the dominant factors that influence HMs-OM binding affinity. In addition, size-fractioned AEOM can differentiate the binding capacity of HM. Unfortunately, extraction of soil organic matter and separation into size-fractioned dissolved organic matter to investigate HMs-OM binding affinity is lacking in the paddy field study.
This study investigated Cu distribution and binding affinity with size-fractioned alkaline-extracted soil organic matter. UV-Vis and fluorescence indicators (SUVA254, BIX, and FI) were used to investigate the chemical properties of size-fractioned AEOM. The correlation method was used to examine the dominate factors of Cu and AEOM binding affinity, [Cu]/[DOC] ratio, in terms of the AEOM optical indicators.
2. Materials and Methods
2.1. Soil Sampling, Treatment, and Measurement
In Taiwan, the major rice production areas are in the center, eastern and southern parts of Taiwan. Therefore, the major rice production area was divided into five regions of Taiwan: center, south center, south, east north, and east south. The soil samples were taken from these areas at two sampling sites. Ten paddy fields were selected from the five regions for the present study, and the site locations are shown in Figure 1. The soil samples were taken with a shovel in the selected paddy fields. Each site at three locations was selected. A total of 3.0 kg soil was taken to a depth of 30 cm. Each soil sample was uniformly mixed. The 30 soil samples were used to analyze the DOC and Cu concentrations and the optical indicators of the alkaline-extracted organic matter (AEOM).
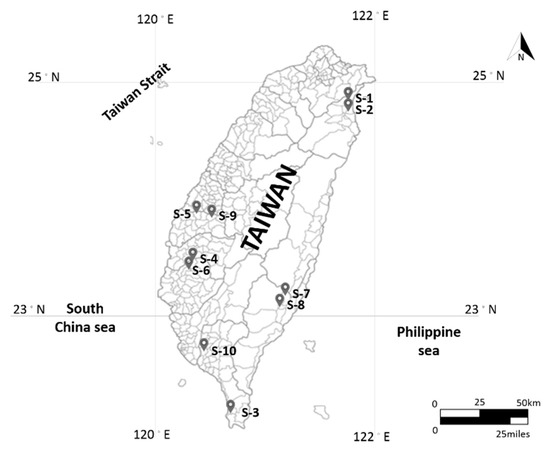
Figure 1.
Soil sampling sites of the ten studied paddy fields.
First, the soil samples were air-dried (1 month) in the laboratory, and then the soil was passed through a sieve mesh #10 (2.0 mm) and provided for subsequent tests, and the basic soil properties were determined. The soil pH was 6.87 ± 0.98, EC was 575 ± 405 μS cm−1, CEC was 6.48 ± 3.45 meq 100 g−1, and total organic carbon (TOC) was 6.48 ± 3.45%. The soil contained an average of 33.9, 47.5, and 18.6% sand, silt, and clay, respectively. The textures of the soil samples were classified as loam and silty loam soils. The basic soil properties of pH, EC, and CEC were similar to uncontaminated farmland soil but the TOC contents of the paddy soil were higher than those of uncontaminated farmland soil [4,35,36,37,38,39]. The total Cu concentrations were analyzed with an aqua regia digestion method and measured by flame atomic absorption spectrometry (Hitachi, Tokyo, Z-2300). Briefly, 3 g of soil was added to a 30 mL aqua regia solution; after 2 h digestion at 180 °C and 16 h settling, the solution was measured at 100 mL to determine Cu concentrations.
2.2. AEOM Extraction and Separation
Soil humic substance was extracted with an alkaline solution [40]. Briefly, 0.1 N HCl 100 mL solution was added to 5 g soil to remove the alkaline metals and carbonate. The 0.1 N NaOH 100 mL was added to the residual soil at the w/v = 1/20. The soil solution was shaken for 24 h and then centrifuged at 4500 rpm for 30 min. The NaOH-extracted humic substance was the bulk AEOM (M-O) solution. A 4 liter M-O solution was used to separate the bulk into the five size-fractioned AEOM solutions. A cross-flow ultrafiltration system equipped with 100, 3, 1, and 0.3 kDa nominal molecular weight cutoff ceramic membrane cartridges sequenced the samples (Filtanium, France). The feed flow rate was 1.7–2.0 L min−1. The permeate flow rate ranged from 12 to 140 mL min−1 and the pressure of feed flow ranged from 1.0 to 5.0 kg cm−2 depending on the pore size of the ultrafiltration cartridge. In the separation process, the volume concentration factor (Cf) was kept at 10 (Equation (1)). The retentate flow was sent back to the feed flow bottle in each separation process. The permeate flow passed through the membrane cartridge and was collected in another container, which was the feed flow for next separation process. The mass balances of the dissolved organic carbon (OC) and Cu were calculated by Equation (2). The mass percentages for each size-fractioned solution were calculated by Equation (3).
where Cf is the volume concentration factor. MB(%) is the percentage of mass balance for OC and Cu. MFi is the mass percentages of OC and Cu for each size-fractioned AEOM solution. Vr, and Vp are the retentate and permeate volumes, respectively, of each separation process. Cbulk and Ci are the measured Cu and OC concentrations of the bulk and the five size-fractioned AEOM solutions, respectively. Vbulk and Vi are the volumes of the bulk and the five size-fractioned AEOM solutions, respectively. The membrane was cleaned and preconditioned before each AEOM separation experiment as recommended by the manufacture’s protocol. The bulk and fractioned AEOM solutions were measured for DOC concentration using UV-Vis and fluorescence spectroscopy. The dissolved organic carbon for the bulk and size-fractioned AEOM solutions was measured with a TOC-V analyzer (Shimadzu, Kyoto, Japan). Copper concentrations were measured with an atomic absorption spectrophotometer (AAS) (Hitachi Z-2300, Tokyo, Japan) and with a graphite furnace atomic absorption spectrophotometer (Hitachi Z-3000, Tokyo, Japan).
2.3. UV-Vis and Fluorescent Measurement
The bulk and size-fractioned AEOM solutions were diluted to <6 mg-C L−1 with ultrapure water. The UV-Vis absorbance at 254 nm was <0.2 and the inner filter effect correction was ignored. The absorbance was measured with an ultraviolet/visible spectrophotometer (Hitachi U-2900, Tokyo, Japan) and fluorescence spectra were recorded on a fluorescence spectrometer (Hitachi F-7000, Tokyo, Japan). The UV-Vis spectrophotometric scanning wavelength was 200–800 nm and the absorbance at 700–800 nm was set as the background value. The absorbance of the sample was subtracted from the average of the absorbance at 700–800 nm [24].
2.4. Optical Index and Metal Binding Affinity Calculation
The specific ultraviolet absorbance at 254 nm (SUVA254, L mg-C−1 m−1) was the absorbance of the sample at 254 nm (UV254, cm−1) divided by the DOC concentration of the AEOM sample (mg-C L−1) multiplied by 100 [23,28]. The fluorescence index (FI) was the fluorescence intensity ratio of Em = 450 to Em = 500 nm at Ex = 370 nm [21,41]. The biological index (BIX) was the fluorescence intensity ratio of Em = 380 to Em = 430 nm at Ex = 310 nm [21,26]. The copper and AEOM binding affinity ([Cu]/[DOC] ratio, μmol-Cu g-C−1) was the measured copper concentration (μmol L−1) divided by the DOC concentration (g-C L−1) [10,11,29,32].
2.5. Statistical Analysis
In this study, correlation analysis and the different tests used the S-Plus software (V 6.2) at significance levels of p < 0.05. The t-test method was conducted to test the two groups’ differences between high and low molecular weight AEOM samples (such as concentration, mass percentage, [Cu]/[DOC] ratio, and indicators). The ANOVA test method was carried out to examine three group differences. In addition, the difference in Cu, DOC, AEOM-Cu, AEOM-OC concentrations, and [Cu]/[DOC] ratios are used in the Kruskal Wallis method of nonparametric test. The R script developed by Lapworth and Kinniburgh [42] was used to calculate fluorescence indicators.
3. Results and Discussion
3.1. Optical Indicators
Table 1 lists the values of SUVA254, BIX, and FI for bulk and size-fractioned AEOM solutions. The bulk AEOM optical indicators were within the ranges of reported values in the soil solution [2,9,10,11,35,36,43].

Table 1.
The optical values of SUVA254, BIX, and FI for bulk and size-fractioned AEOM solutions.
The SUVA254 is positively correlated with the aromatic content [27,28]. The SUVA254 of bulk AEOM ranged from 0.30 to 7.92 L mg-C−1 m−1 with a 26-fold variation. The bulk and high molecular weight AEOM (1 kDa–0.45 μm, HMW, n = 90) SUVA254 value 3.67 ± 2.22 L mg-C−1 m−1 was significantly higher than the low molecular weight AEOM SUVA254 values 1.76 ± 0.95 L mg-C−1 m−1(<1 kDa, LMW, n = 60, p < 0.001). The HMW AEOM solutions contained more hydrophobic and aromatic compounds than the LMW AEOM solutions [27]. Previous studies reported SUVA254 values ranging from 0.26 to 6.30 L mg-C−1 m−1 in DOM/AEOM, which is comparable to the SUVA254 values of the present study [2,9,10,11,35,36,43].
The FI is an indicator relative to terrestrial sources [21,23]. A high FI value indicates a low terrestrial source contribution. In the present study, the FI values of bulk AEOM were 1.32–1.86. HMW and LMW AEOM solutions had FI values of 1.48 ± 0.11 and 1.65 ± 0.13, respectively (p < 0.001). HMW AEOM had a higher terrestrial contribution than the LMW AEOM. Most of the FI values were within the range 1.4–1.9, which suggested that the AEOM solutions contained median terrestrial sources [21,23,41]. The FI values in the present study were within FI values, ranging from 1.08 to 2.03 as reported in previous DOM/AEOM studies [2,9,35,36,43].
The BIX is an indicator relative to autochthonous origin contribution. In the present study, the BIX values of bulk AEOM were 0.66–1.16. HMW and LMW AEOM solution BIX values were 0.81 ± 0.18 and 1.01 ± 0.26, respectively. A recently produced DOM of autochthonous origin suggested BIX > 1.0, and an allochthonous origin BIX < 0.6 [21,26]. BIX values suggested that the HMW AEOM solutions had a median allochthonous origin and the LMW AEOM was the autochthonous origin. The bulk BIX values in the present study were comparable to BIX values ranging from 0.43 to 0.96 as reported in previous studies [35,36,43].
The size-fractioned AEOM in the present study showed that the fraction M-B (3–100 kDa) had the highest SUVA254 but the lowest FI and BIX values. In contrast, the fraction M-E (<0.3 kDa) had the lowest SUVA254 but the highest FI and BIX values.
3.2. DOC and Cu Concentrations of Size-Fractioned AEOM
Table 2 lists the DOC and Cu concentrations of the total and the extracted bulk AEOM solutions. The AEOM-OC content ranged from 1.46 to 5.97 g kg−1 and the total organic carbon (TOC) was 12.5 to 130 g kg−1 based on the soil mass. The AEOM-DOC content/TOC ratio was 6.59 ± 4.12%. Hsieh et al. [9] reported the average AEOM-DOC concentration was 0.68 ± 0.25 g kg−1 and the TOC was 18.1 ± 1.9 g kg−1 based on soil mass. Therefore, the AEOM-DOC content/TOC ratio (0.68/18.1) was 3.70%. At room temperature, Fernández-Romero et al. [2] reported that water extraction organic carbon (WEOC) was 80–620 mg kg−1, and organic matter ranged from 43–156 g kg−1. Therefore, the WEOC/OM ratios were 0.12–0.40%. Gao et al. [43] reported the DOC concentration of water-extracted soil organic matter was 56.1–81.1 mg kg−1, and the TOC was 2.64–4.45 g kg−1. Therefore, the WEOC/TOC ratios were 1.24–3.07%. In the present study, the alkaline-extracted soil organic carbon from paddy soil was much higher than the water-extracted soil organic carbon and alkaline-extracted soil organic matter from the dry farm soil.
Table 2.
The DOC and Cu concentrations of total and extracted bulk AEOM solutions.
Table 2 shows the total Cu concentrations ranging from 8.99 to 32.30 mg kg−1 in the soil samples with an average of 20.95 ± 6.19 mg kg−1, and they were similar to the Cu concentrations in the unpolluted farmland soils [4,9,37,44,45]. The AEOM-Cu concentrations ranged from 2.00 to 8.80 mg kg−1 with an average of 5.43 ± 1.63 mg kg−1. The ratios of bulk AEOM-Cu to the total Cu concentration ranged from 9.7 to 64.5%, averaging 29.2 ± 14.8%. Hsieh et al. [9] reported the mean AEOM-Cu concentration was 1.19 mg kg−1 and the total Cu concentration was 9.89 mg kg−1. AEOM-Cu to total Cu had a ratio of 12.0%. Matong et al. [4] reported that three agricultural soils were sequentially extracted with acetic, ascorbic, and hydrogen peroxide digestion. The organic matter- and sulfide-binding fractions were 57–68% for Cu. In the present study, a high amount of Cu and OC was extracted by alkaline solution, and AEOM-Cu/total-Cu and AEOC/TOC ratios were higher than the corresponding ratio extracted with water. This may be explained by the fact that the paddy field had high soil organic matter and was readily extracted by alkaline solution compared to dry farmland. Cambier et al. [45] reported that Cu is preferentially combined with soil humic substances. In the aquatic environment, the simulation showed copper had a high percentage of binding with dissolved organic matter [46], which explained the high ratio of AEOM-Cu/total-Cu observed in the present study.
3.3. Cu and OC Distribution between Size-Fractioned AEOM
Table 3 lists each site’s DOC and Cu concentrations of bulk and size-fractioned AEOM solutions and lists the average, standard deviation, minimum, and maximum total concentrations. The mass balances of DOC and Cu in the size-fractioned AEOM were calculated with Equation (2). The average mass balances were 106 ± 16% and 97 ± 18% for Cu and DOC, respectively, which were within a reasonable range of 100 ± 25% [15,47].
Table 3.
Cu and DOC mean and standard deviation concentrations of bulk and size-fractioned AEOM solutions for each site.
In aqueous DOM separation studies, the OC mass balances ranged from 78 to 104% [17,48,49]. In the soil and sediment extraction solution separated into size-fractioned solutions, the reported OC mass balances ranged from 80 to 159% [9,14,50,51]. The water-extracted soil organic matter (WEOM) was separated into four size-fractioned WEOMs reported by de Zarruk et al. [50], and the DOC mass balance was 117%. Martin et al. [47] separated lagoon water DOM; the DOC mass balances ranged from 85 to 98%. Wen et al. [49,52] separated seawater into high molecular weight (1 kDa–0.45 um) and low molecular weight (<1 kDa) DOM. The Cu mass balances ranged from 88 to 106%.
Figure 2a,b shows the average mass percentages of Cu and OC for size-fractioned AEOM in each site. The mass percentages varied among the sampling sites. The quantity order of mass percentages for Cu average values were M-B (66.7%) > M-E (14.1%) > M-A (9.8%) > M-C and M-D (4.7%). The quantity order of mass fractions for total OC values were M-B (40.3%) > M-E (38.4%) > M-A (10.0%) > M-C (6.3%) > M-D (5.0%). Cu had a much higher percentage in the M-B fraction than in other fractions, but OC had a higher percentage in M-B and M-E fractions than in the other fractions.
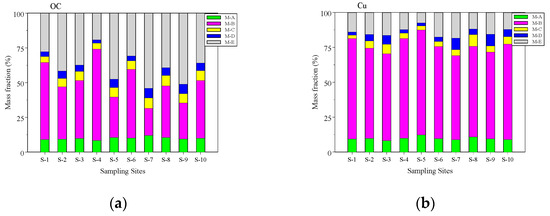
Figure 2.
(a,b) The average Cu and OC mass percentages of the five size-fractioned AEOM solutions for each site. (a) OC and (b) Cu.
The molecular weight at 1 kDa for DOM/AEOM is used to distinguish between the high and low molecular weight of DOM/AEOM. The high molecular weight fractions (>1 kDa) were 81.2 and 56.6% for Cu and OC, respectively, which suggested that Cu favored binding to high molecular weight AEOM.
Wang et al. [53] separated soil solutions and water samples into HMW WEOM/DOM (1 kDa–0.45 μm) and LMW WEOM/DOM (<1 kDa). The Cu mass percentages of HMW were 47 and 59% for soil solution and water samples, respectively. Ilina et al. [46] reported that water-extracted soil solution, lake water, and river water used ultrafiltration separation; the mass percentages of HMW Cu (1 kDa–0.45 μm) were 80, 53 and 38%, respectively. In a municipal wastewater treatment plant, Hargreaves et al. [16] reported the HMW DOM (1 kDa–0.45 μm) averaged 74% for Cu. Hsieh et al. [9] separated soil AEOM into HMW (1 kDa–0.45 um) and LMW (<1 kDa) solutions. The OC mass percentage of HMW AWOM was 44%. Dai et al. [48] separated seawater into HMW DOM (1 kDa–0.45 um) and LMW AEOM (< 1 kDa) solutions. The masses for OC and Cu were 8.2–30.4 and 20.5–39.2%, respectively. The mass percentages of high and low molecular weights in water DOM and water-extracted organic matter varied. The percentages depended on organic matter sources, biogeochemical process, type of metal, the matrix, extraction solvent and method, solid/liquid ratio, and separation method and conditions [15,53,54].
3.4. Cu and AEOM Binding Affinity [Cu]/[DOC] Ratio
The copper and organic matter binding affinity, [Cu]/[DOC] ratio, was used to understand the variation in the binding ability of copper to DOM/WEOM [10,11,16,29,30,31,32,33]. Table 4 lists the [Cu]/[DOC] ratios of bulk and size-fractioned AEOM solutions for each site. The [Cu]/[DOC] ratios of bulk AEOM ranged from 13.2 to 56.2 μmol g-C−1 and the average ratios for the ten sites averaged 31.1 ± 13.3 μmol g-C−1. The ratios were varied and were higher than 250 soil leachate, ranging from 3.7 to 20.2 μmol g-C−1 [11]. The ratios in the present study were also higher than the [Cu]/[DOC] ratio for soil pore water, soil organic matter extracted with water and CaCl2, ranging from below the detection limit to 37.0 μmol g-C−1 [7,10]. The alkaline had a higher ability to extract Cu from soil organic substances than water and CaCl2 solutions.
Table 4.
The [Cu]/[DOC] ratios (μmol/g-C) of bulk and size-fractioned AEOM solutions at each site.
The ratios for total size-fractioned AEOMs ranged from 3.1 to 127.6 μmol g-C−1. Amery et al. [10] reported soil pore water and soil water-extracted solution had [Cu]/[DOC] ratios with a 10-fold variation. Amery et al. [11] reported soil leachate [Cu]/[DOC] ratios had a 5-fold variation. In the present study, the bulk AEOM had a 4-fold variation, and the size-fractioned samples had a 41-fold variation. The highly varied [Cu]/[DOC] ratios in the present study were due to different molecular weight AEOMs with significantly different binding affinities to Cu. Furthermore, the chemical properties of size-fractioned AEOM at the sites had significant differences (Table S1). The quantity order of mean ratios was 63.5 ± 32.3 (M-B) > 32.8 ± 12.8 (M-A) > 28.0 ± 10.5 (M-D) > 24.2 ± 10.7 (M-C) > 12.5 ± 6.0 (M-E) μmol g-C−1. The fractioned size ranging from 3 to 100 kDa had the highest ratio for Cu binding affinity to AEOM ranging from 17.5 to 127.6 μmol g-C−1. The optical indicators showed that fractioned M-B had higher aromaticity (SUVA254), terrestrial (FI), and allochthonous (BIX) sources (Table 1) than the other AEOM fractions. In addition, the molecular weight of 3 to 100 kDa may be richer in humic substances comprising humic acid- and fulvic acid-like substances containing phenolic, carboxylic, and hydroxyl functional groups [8,55]. These functional groups have a strong metal binding ability, which resulted in high [Cu]/[DOC] ratios.
The lowest ratio was fractioned M-E (< 0.3 kDa), ranging from 3.1 to 31.9 μmol g-C−1 with a 10-fold variation. The size M-D and M-E (<1.0 kDa) generally was considered as the truly dissolved phase of DOM with low metal binding ability [20]. However, previous studies have reported that the truly dissolved phase had a binding ability with heavy metals [14,16,34]. In this study, fractioned M-D (0.3–1.0 kDa) had a binding affinity comparable with fractioned M-A (>100 kDa) and M-C (1–3 kDa), which suggested that the AEOM molecular weight at sub kDa may contain humic substances and have a strong copper binding ability. In addition, the mass percentage of fractioned M-E (<0.3 kDa) was 38.4% for OC and 14.1% for Cu. This suggested that, with the exception of free Cu ions, the AEOM contained a low molecular weight organic acid, which had an ability to bind to Cu. The mass percentage of fractioned M-B was 40.3% for OC and 66.7% for Cu. The high binding ability of Cu in the soil environment could reduce Cu biotoxicity and bioavailability.
Li et al. [34] calculated [Me]/[DOC] ratios of a wastewater treatment process for aged and young municipal solid waste leachate. The wastewater was separated into four MW ranges, <1 kDa, 1–10 kDa, 10–100 kDa, and 100 kDa–0.45 μm. For young leachate wastewater, the MW ranging from 1-10 kDa had the highest [Cu]/[DOC] ratios of 37.8, and 189.0 μmol g-C−1 for anoxic–oxic and coagulation–flocculation treatment processes, respectively. The results were similar to the present study where the fractions of 3–100 kDa had the highest ratios. For storage tank and anaerobic processes, the highest ratios were MW > 100 kDa ratios that were 6.14 and 29.9 μmol g-C−1, respectively. For aged leachate wastewater the highest ratios were MW > 100 kDa, ranging from 7.24 to 299.2 μmol g-C−1. In another study of the final effluent of a wastewater treatment plant, Hargreaves et al. [16] reported that [Cu]/[DOC] ratios were 8.42 and 31.58 μmol g-C−1 for LMW (<1kDa) and HMW (1 kDa–0.45 μm), respectively. The metal and organic matter binding affinity, [Me]/[DOC] ratio, could depend on the metal concentration, the DOM chemical composition and structure, and the DOM molecular weight.
3.5. [Cu]/[DOC] Ratios and Optical Indicators Correlation Analysis
The [Cu]/[DOC] ratios varied depending on the fractioned AEOM and sites, which was attributed to the complex chemical composition and structure of AEOM and Cu concentrations. The AEOM optical characteristics affecting the [Cu]/[DOC] ratios used the Pearson correlation analysis method. For each of the ten size-fractioned AEOM combined sites, the [Cu]/[DOC] ratios and the selected AEOM optical characteristics had a weak-to-median correlation. Each fractioned AEOM in the ten sites had a significantly different chemical composition and structure that resulted in AEOM optical indicators not being good surrogates for [Cu]/[DOC] ratios.
The correlations of [Cu]/[DOC] ratios with optical characteristics for total and individual site combined size-fractioned AEOM solutions are listed in Table 5. For total AEOM solutions, the optical indicators SUVA254, FI, and BIX had a significant correlation with the [Cu]/[DOC] ratios (p < 0.001). The indicators also had a significant correlation with the [Cu]/[DOC] ratio for most of the sites. Some indicators in an individual site did not show significant correlation with the [Cu]/[DOC] ratio, and the correlation tendency was the same with the significant indicators. The SUVA254 had a positive correlation, but FI and BIX had a negative correlation with the [Cu]/[DOC] ratios. The SUVA254 value is a surrogate of aromaticity. The high FI value is attributed to the low terrestrial source, and the high BIX value indicates high autochthonous sources. The correlation suggested that the [Cu]/[DOC] ratios were enhanced by high aromaticity. However, the high content of autochthonous source and low terrestrial source of AEOM decreased the Cu binding affinity with AEOM solutions.
Table 5.
The correlations of [Cu]/[DOC] ratios with optical characteristics for total and individual site combined size-fractioned AEOM solutions.
In each site, the soil organic substances have experienced the same biological and geochemical processes in the field that each fractioned AEOM had developed, with similar chemical composition and structure. Consequently, the [Cu]/[DOC] ratios significantly correlated with the selected optical characteristics in each site. The relationships suggested that the chemical properties of soil organic substances were an important factor that affected the [Cu]/[DOC] ratios. It is noteworthy to see that the dominant factors were different in each site. For example, in site S-5, the average [Cu]/[DOC] ratios were 112.8 and 6.8 μmol g-C−1 for fractioned M-B and M-E solutions, respectively, with a 16-fold variation. The optical indicators FI and BIX had a significant correlation with the [Cu]/[DOC] ratios. This suggested that the AEOM chemical composition was the dominant factor. In site S-4, the [Cu]/[DOC] ratios were 18.3 and 10.6 μmol g-C−1 for fractioned M-B and M-E, respectively, with a 2-fold variation. The SUVA254 indicator had a significant correlation with the [Cu]/[DOC] ratio. The AEOM aromaticity was the dominant factor for the [Cu]/[DOC] ratios in site S-4. In a different site, the [Cu]/[DOC] ratios were varied; however, the [Cu]/[DOC] ratios had a strong correlation with the selected optical indicators. This study demonstrated that the indicators were good surrogates to represent Cu-AEOM binding affinity. However, the relationship was limited in some conditions, such as the soil organic matter experiencing the same geochemical and biological processes.
In the aqueous solution and soil solutions we studied the correlation between the [Cu]/[DOC] ratio and the optical indicators. The [Cu]/[DOC] ratios in soil leachate and water-extracted soil organic matter had a significant positive correlation with SUVA254 [10,11]. In natural water DOM, [Cu]/[DOC] ratios correlated significantly positively with the SUVA254 values. However, in river water DOM impacted by the WTP effluent [32] and anthropogenic input [29], the [Cu]/[DOC] ratios did not show significant correlations with SUVA254.
4. Conclusions
The size-fractioned soil AEOM analyzed with the spectral methodology allowed understanding of the different chemical structure and composition of AEOM. The Cu and OC were not evenly distributed in the fractioned AEOM, in which molecular weights between 3 and 100 kDa were significantly higher than in other molecular weight AEOM. Optical characteristics showed that size-fractioned M-B had a high aromaticity and terrestrial resources, but fewer autochthonous sources. However, low molecular weight AEOM (<1 kDa) had optical characteristics in contrast to high molecular weight AEOM. The binding affinity between size-fractioned Cu and AEOM demonstrated that M-B had the highest [Cu]/[DOC] ratios but M-E had the lowest [Cu]/[DOC] ratio. The [Cu]/[DOC] ratio had a significant correlation with SUVA254, FI, and BIX that suggested Cu and AEOM binding affinity positively affected the aromaticity and the content of terrestrial and autochthonous sources. The optical indices distinguished the chemical composition and structure of size-fractioned AEOM and investigated the binding affinity of Cu-AEOM.
Supplementary Materials
The following supporting information can be downloaded at: www.mdpi.com/article/10.3390/agronomy12071689/s1, Table S1: The optical indicators and fluorescence intensities for bulk and size-fractioned AEOM at each site.
Author Contributions
Conceptualization, Y.-L.Y. and T.-C.L.; methodology, W.-H.H. and C.-M.H.; formal analysis, W.-H.H. and T.-C.L.; data curation, W.-H.H., T.-C.L. and T.-C.C.; writing—original draft preparation, W.-H.H., T.-C.L. and T.-C.C.; writing—review and editing, T.-C.L. and T.-C.C. All authors have read and agreed to the published version of the manuscript.
Funding
This research was supported by the Ministry of Science and Technology and Atomic Energy Council, Executive Yuan, Taiwan through project (Grant No: MOST 108-NU-E-020-002-NU).
Institutional Review Board Statement
Not applicable.
Data Availability Statement
The data presented in this study are available on request from the corresponding author.
Conflicts of Interest
The authors declare no conflict of interest.
References
- Gmach, M.R.; Cherubin, M.R.; Kaiser, K.; Cerri, C.E.P. Processes that influence dissolved organic matter in the soil: A review. Sci. Agricol. 2019, 77. [Google Scholar] [CrossRef]
- Fernández-Romero, M.; Clark, J.; Collins, C.; Parras-Alcántara, L.; Lozano-García, B. Evaluation of optical techniques for characterising soil organic matter quality in agricultural soils. Soil Tillage Res. 2016, 155, 450–460. [Google Scholar] [CrossRef]
- Lehmann, J.; Kleber, M. The contentious nature of soil organic matter. Nature 2015, 528, 60–68. [Google Scholar] [CrossRef]
- Matong, J.M.; Nyaba, L.; Nomngongo, P.N. Fractionation of trace elements in agricultural soils using ultrasound assisted sequential extraction prior to inductively coupled plasma mass spectrometric determination. Chemosphere 2016, 154, 249–257. [Google Scholar] [CrossRef] [PubMed]
- Gustafsson, J.P.; Pechová, P.; Berggren, D. Modeling metal binding to soils: The role of natural organic matter. Environ. Sci. Technol. 2003, 37, 2767–2774. [Google Scholar] [CrossRef] [PubMed]
- Zhou, T.; Wu, L.; Luo, Y.; Christie, P. Effects of organic matter fraction and compositional changes on distribution of cadmium and zinc in long-term polluted paddy soils. Environ. Pollut. 2018, 232, 514–522. [Google Scholar] [CrossRef] [PubMed]
- Liu, H. Relationship between organic matter humification and bioavailability of sludge-borne copper and cadmium during long-term sludge amendment to soil. Sci. Total Environ. 2016, 566, 8–14. [Google Scholar] [CrossRef] [PubMed]
- Aiken, G.R.; Hsu-Kim, H.; Ryan, J.N. Influence of dissolved organic matter on the environmental fate of metals, nanoparticles, and colloids. Environ. Sci. Techol. 2011, 45, 3196–3201. [Google Scholar] [CrossRef] [PubMed]
- Hsieh, S.-H.; Chiu, T.-P.; Huang, W.-S.; Chen, T.-C.; Yeh, Y.-L. Cadmium (Cd) and Nickel (Ni) Distribution on Size-Fractioned Soil Humic Substance (SHS). Int. J. Environ. Res. Public Health 2019, 16, 3398. [Google Scholar] [CrossRef] [Green Version]
- Amery, F.; Degryse, F.; Degeling, W.; Smolders, E.; Merckx, R. The copper-mobilizing-potential of dissolved organic matter in soils varies 10-fold depending on soil incubation and extraction procedures. Environ. Sci. Technol. 2007, 41, 2277–2281. [Google Scholar] [CrossRef]
- Amery, F.; Degryse, F.; Cheyns, K.; De Troyer, I.; Mertens, J.; Merckx, R.; Smolders, E. The UV-absorbance of dissolved organic matter predicts the fivefold variation in its affinity for mobilizing Cu in an agricultural soil horizon. Eur. J. Soil Sci. 2008, 59, 1087–1095. [Google Scholar] [CrossRef]
- Khanam, R.; Kumar, A.; Nayak, A.K.; Shahid, M.; Tripathi, R.; Vijayakumar, S.; Bhaduri, D.; Kumar, U.; Mohanty, S.; Panneerselvam, P. Metal (loid) s (As, Hg, Se, Pb and Cd) in paddy soil: Bioavailability and potential risk to human health. Sc. Total Environ. 2020, 699, 134330. [Google Scholar] [CrossRef] [PubMed]
- Sauvé, S.; Manna, S.; Turmel, M.-C.; Roy, A.G.; Courchesne, F. Solid− Solution partitioning of Cd, Cu, Ni, Pb, and Zn in the organic horizons of a forest soil. Environ. Sci. Technol. 2003, 37, 5191–5196. [Google Scholar] [CrossRef] [PubMed]
- Xu, H.; Zou, L.; Guan, D.; Li, W.; Jiang, H. Molecular weight-dependent spectral and metal binding properties of sediment dissolved organic matter from different origins. Sci. Total Environ. 2019, 665, 828–835. [Google Scholar] [CrossRef] [PubMed]
- Dabrin, A.; Roulier, J.-L.; Coquery, M. Colloidal and truly dissolved metal (oid) fractionation in sediment pore waters using tangential flow filtration. Appl. Geochem. 2013, 31, 25–34. [Google Scholar] [CrossRef]
- Hargreaves, A.J.; Vale, P.; Whelan, J.; Constantino, C.; Dotro, G.; Campo, P.; Cartmell, E. Distribution of trace metals (Cu, Pb, Ni, Zn) between particulate, colloidal and truly dissolved fractions in wastewater treatment. Chemosphere 2017, 175, 239–246. [Google Scholar] [CrossRef]
- Jarvie, H.; Neal, C.; Rowland, A.; Neal, M.; Morris, P.; Lead, J.; Lawlor, A.; Woods, C.; Vincent, C.; Guyatt, H. Role of riverine colloids in macronutrient and metal partitioning and transport, along an upland–lowland land-use continuum, under low-flow conditions. Sci. Total Environ. 2012, 434, 171–185. [Google Scholar] [CrossRef] [Green Version]
- Worms, I.A.; Szigeti, Z.A.-G.; Dubascoux, S.; Lespes, G.; Traber, J.; Sigg, L.; Slaveykova, V.I. Colloidal organic matter from wastewater treatment plant effluents: Characterization and role in metal distribution. Water Res. 2010, 44, 340–350. [Google Scholar] [CrossRef]
- Luan, H.; Vadas, T.M. Size characterization of dissolved metals and organic matter in source waters to streams in developed landscapes. Environ. Pollut. 2015, 197, 76–83. [Google Scholar] [CrossRef]
- McPhedran, K.N.; Seth, R.; Drouillard, K.G. Investigation of Hydrophobic Organic Carbon (HOC) partitioning to 1 kDa fractionated municipal wastewater colloids. Environ. Sci. Technol. 2013, 47, 2548–2553. [Google Scholar] [CrossRef]
- Birdwell, J.E.; Engel, A.S. Characterization of dissolved organic matter in cave and spring waters using UV–Vis absorbance and fluorescence spectroscopy. Org. Geochem. 2010, 41, 270–280. [Google Scholar] [CrossRef]
- Derrien, M.; Yang, L.; Hur, J. Lipid biomarkers and spectroscopic indices for identifying organic matter sources in aquatic environments: A review. Water Res. 2017, 112, 58–71. [Google Scholar] [CrossRef] [PubMed]
- Hansen, A.M.; Kraus, T.E.; Pellerin, B.A.; Fleck, J.A.; Downing, B.D.; Bergamaschi, B.A. Optical properties of dissolved organic matter (DOM): Effects of biological and photolytic degradation. Limnol. Oceanogr. 2016, 61, 1015–1032. [Google Scholar] [CrossRef] [Green Version]
- Helms, J.R.; Stubbins, A.; Ritchie, J.D.; Minor, E.C.; Kieber, D.J.; Mopper, K. Absorption spectral slopes and slope ratios as indicators of molecular weight, source, and photobleaching of chromophoric dissolved organic matter. Limnol. Oceanogr. 2008, 53, 955–969. [Google Scholar] [CrossRef] [Green Version]
- Hudson, N.; Baker, A.; Reynolds, D. Fluorescence analysis of dissolved organic matter in natural, waste and polluted waters—a review. River Res. Appl. 2007, 23, 631–649. [Google Scholar] [CrossRef]
- Huguet, A.; Vacher, L.; Relexans, S.; Saubusse, S.; Froidefond, J.-M.; Parlanti, E. Properties of fluorescent dissolved organic matter in the Gironde Estuary. Org. Geochem. 2009, 40, 706–719. [Google Scholar] [CrossRef]
- Matilainen, A.; Gjessing, E.T.; Lahtinen, T.; Hed, L.; Bhatnagar, A.; Sillanpää, M. An overview of the methods used in the characterisation of natural organic matter (NOM) in relation to drinking water treatment. Chemosphere 2011, 83, 1431–1442. [Google Scholar] [CrossRef] [PubMed]
- Weishaar, J.L.; Aiken, G.R.; Bergamaschi, B.A.; Fram, M.S.; Fujii, R.; Mopper, K. Evaluation of specific ultraviolet absorbance as an indicator of the chemical composition and reactivity of dissolved organic carbon. Environ. Sci. Technol. 2003, 37, 4702–4708. [Google Scholar] [CrossRef] [PubMed]
- Baken, S.; Degryse, F.; Verheyen, L.; Merckx, R.; Smolders, E. Metal complexation properties of freshwater dissolved organic matter are explained by its aromaticity and by anthropogenic ligands. Environ. Sci. Technol. 2011, 45, 2584–2590. [Google Scholar] [CrossRef] [Green Version]
- Chon, K.; Chon, K.; Cho, J. Characterization of size fractionated dissolved organic matter from river water and wastewater effluent using preparative high performance size exclusion chromatography. Org. Geochem. 2017, 103, 105–112. [Google Scholar]
- Fujii, M.; Imaoka, A.; Yoshimura, C.; Waite, T. Effects of molecular composition of natural organic matter on ferric iron complexation at circumneutral pH. Environ. Sci. Technol. 2014, 48, 4414–4424. [Google Scholar] [PubMed]
- Kikuchi, T.; Fujii, M.; Terao, K.; Jiwei, R.; Lee, Y.P.; Yoshimura, C. Correlations between aromaticity of dissolved organic matter and trace metal concentrations in natural and effluent waters: A case study in the Sagami River Basin, Japan. Sci. Total Environ. 2017, 576, 36–45. [Google Scholar] [CrossRef] [PubMed] [Green Version]
- Yi, Y.; Xiao, M.; Mostofa, K.M.; Xu, S.; Wang, Z. Spatial variations of trace metals and their complexation behavior with DOM in the water of Dianchi Lake, China. Int. J. Environ. Res. Public Health 2019, 16, 4919. [Google Scholar] [CrossRef] [PubMed] [Green Version]
- Li, R.; Yue, D.; Liu, J.; Nie, Y. Size fractionation of organic matter and heavy metals in raw and treated leachate. Waste Manag. 2009, 29, 2527–2533. [Google Scholar] [CrossRef]
- Chiu, T.-P.; Huang, W.-S.; Chen, T.-C.; Yeh, Y.-L. Fluorescence characteristics of dissolved organic matter (DOM) in percolation water and lateral seepage affected by soil solution (SS) in a lysimeter test. Sensors 2019, 19, 4016. [Google Scholar]
- Gao, J.; Liang, C.; Shen, G.; Lv, J.; Wu, H. Spectral characteristics of dissolved organic matter in various agricultural soils throughout China. Chemosphere 2017, 176, 108–116. [Google Scholar]
- Jalali, M.; Hemati, N. Chemical fractionation of seven heavy metals (Cd, Cu, Fe, Mn, Ni, Pb, and Zn) in selected paddy soils of Iran. Paddy Water Environ. 2013, 11, 299–309. [Google Scholar]
- Krishnamurti, G.S.; Naidu, R. Solid− solution speciation and phytoavailability of copper and zinc in soils. Environ. Sci. Technol. 2002, 36, 2645–2651. [Google Scholar] [CrossRef]
- Nkhili, E.; Guyot, G.; Vassal, N.; Richard, C. Extractability of water-soluble soil organic matter as monitored by spectroscopic and chromatographic analyses. Environ. Sci. Pollut. Res. 2012, 19, 2400–2407. [Google Scholar] [CrossRef]
- Hur, J.; Park, M.-H.; Schlautman, M.A. Microbial transformation of dissolved leaf litter organic matter and its effects on selected organic matter operational descriptors. Environ. Sci. Technol. 2009, 43, 2315–2321. [Google Scholar]
- McKnight, D.M.; Boyer, E.W.; Westerhoff, P.K.; Doran, P.T.; Kulbe, T.; Andersen, D.T. Spectrofluorometric characterization of dissolved organic matter for indication of precursor organic material and aromaticity. Limnol. Oceanogr. 2001, 46, 38–48. [Google Scholar] [CrossRef]
- Lapworth, D.J.; Kinniburgh, D. An R script for visualising and analysing fluorescence excitation–emission matrices (EEMs). Comput. Geosci. 2009, 35, 2160–2163. [Google Scholar] [CrossRef] [Green Version]
- Gao, S.-J.; Zhao, C.; Shi, Z.-H.; Zhong, J.; Liu, J.-G.; Li, J.-Q. Spectroscopic characteristics of dissolved organic matter in afforestation forest soil of Miyun District, Beijing. J. Anal. Methods Chem. 2016, 2016, 1480857. [Google Scholar] [PubMed]
- Araújo, E.; Strawn, D.G.; Morra, M.; Moore, A.; Alleoni, L.R.F. Association between extracted copper and dissolved organic matter in dairy-manure amended soils. Environ. Pollut. 2019, 246, 1020–1026. [Google Scholar] [PubMed]
- Cambier, P.; Pot, V.; Mercier, V.; Michaud, A.; Benoit, P.; Revallier, A.; Houot, S. Impact of long-term organic residue recycling in agriculture on soil solution composition and trace metal leaching in soils. Sci. Total Environ. 2014, 499, 560–573. [Google Scholar] [CrossRef]
- Ilina, S.M.; Lapitskiy, S.A.; Alekhin, Y.V.; Viers, J.; Benedetti, M.; Pokrovsky, O.S. Speciation, size fractionation and transport of trace elements in the continuum soil water–mire–humic lake–river–large oligotrophic lake of a Subarctic watershed. Aquat. Geochem. 2016, 22, 65–95. [Google Scholar] [CrossRef]
- Martin, J.M.; Dai, M.H.; Cauwet, G. Significance of colloids in the biogeochemical cycling of organic carbon and trace metals in the Venice Lagoon (Italy). Limnol. Oceanogr. 1995, 40, 119–131. [Google Scholar] [CrossRef] [Green Version]
- Dai, M.; Martin, J.-M.; Cauwet, G. The significant role of colloids in the transport and transformation of organic carbon and associated trace metals (Cd, Cu and Ni) in the Rhône delta (France). Mar. Chem. 1995, 51, 159–175. [Google Scholar] [CrossRef]
- Wen, L.-S.; Santschi, P.; Gill, G.; Paternostro, C. Estuarine trace metal distributions in Galveston Bay: Importance of colloidal forms in the speciation of the dissolved phase. Mar. Chem. 1999, 63, 185–212. [Google Scholar] [CrossRef]
- de Zarruk, K.K.; Scholer, G.; Dudal, Y. Fluorescence fingerprints and Cu2+-complexing ability of individual molecular size fractions in soil-and waste-borne DOM. Chemosphere 2007, 69, 540–548. [Google Scholar] [CrossRef]
- Shi, M.-S.; Huang, W.-S.; Hsu, L.-F.; Yeh, Y.-L.; Chen, T.-C. Fluorescence of Size-Fractioned Humic Substance Extracted from Sediment and Its Effect on the Sorption of Phenanthrene. Int. J. Environ. Res. Public Health 2019, 16, 5087. [Google Scholar] [CrossRef] [PubMed] [Green Version]
- Wen, L.-S.; Stordal, M.C.; Tang, D.; Gill, G.A.; Santschi, P.H. An ultraclean cross-flow ultrafiltration technique for the study of trace metal phase speciation in seawater. Mar. Chem. 1996, 55, 129–152. [Google Scholar] [CrossRef]
- Wang, W.; Wen, B.; Zhang, S.; Shan, X.-Q. Distribution of heavy metals in water and soil solutions based on colloid-size fractionation. Int. J. Environ. Anal. Chem. 2003, 83, 357–365. [Google Scholar] [CrossRef]
- Wenming, X.; ZHANG, S.; Lin, R.; Mingyue, Y.; Weiming, S.; ZHANG, H.; Weihua, L. Evaluating soil dissolved organic matter extraction using three-dimensional excitation-emission matrix fluorescence spectroscopy. Pedosphere 2017, 27, 968–973. [Google Scholar]
- Wang, W.; Chen, M.; Guo, L.; Wang, W.-X. Size partitioning and mixing behavior of trace metals and dissolved organic matter in a South China estuary. Sci. Total Environ. 2017, 603, 434–444. [Google Scholar] [CrossRef]
Publisher’s Note: MDPI stays neutral with regard to jurisdictional claims in published maps and institutional affiliations. |
© 2022 by the authors. Licensee MDPI, Basel, Switzerland. This article is an open access article distributed under the terms and conditions of the Creative Commons Attribution (CC BY) license (https://creativecommons.org/licenses/by/4.0/).