Abstract
Wild lowbush blueberry is an economically and culturally important crop in North America. Different fertilizer companies have been advertising their foliar fertilizer products to the wild blueberry growers, claiming better growth and production of this crop with no scientific proof. Although foliar fertilization has shown to be efficient for delivering micronutrients in deficit for different crops by reducing soil activation and environmental contamination, limited research has been done in wild blueberries. It is still unknown how foliar fertilizers affect the physiology, growth, and yield of this crop. Therefore, we tested the impacts of seven foliar treatments containing macro- and micro-nutrients and plant hormones (Seacrop16, Salvador, Agro-Phos applied in 2019 and Kali-T, Nano-Gro, Poma, Poma + Nanocellulose applied in 2020) on this crop for one crop cycle from vegetative year (2019) to crop year (2020). We tested these products against the standard soil-applied granular fertilizer called Diammonium phosphate (DAP) and control (no fertilizer) in a randomized complete block design with eight replicates in a conventional wild blueberry field in Maine, USA. In 2019, no significant differences across the applied treatments were observed in crop physiology and growth except in leaf chlorophyll concentration. In 2020, there was significantly higher leaf chlorophyll concentration in SeaCrop16 and Poma+Nanocellulose plots, but significantly lower photosynthetic rates in DAP and SeaCrop16 treated plots compared to the control. Meanwhile, no significant differences in plant height, leaf characteristics, or blueberry yield were found among the treatments. Overall, mobile nutrients (N, P, K) from soil applied fertilizers and foliar fertilizers containing other immobile nutrients (Ca) and/or plant hormones might benefit crop growth, but the impact on yield is limited. We also reveal that the wild blueberry physiological and morphological traits and leaf nutrients in the vegetative year are more related to the crop yield than those traits in the crop year. This implies that a combination of wild blueberry physiology, morphology, and leaf nutrients in the vegetative year largely impact their yield in the following crop year.
1. Introduction
The wild lowbush blueberry production system in North America is a unique semi-natural agricultural system where two wild blueberry species exist in a field: (1) common low-sweet lowbush blueberry (Vaccinium angustifolium Aiton) (80–90% of the field) and (2) velvet leaved sour-top lowbush blueberry (Vaccinium myrtilloides Michx.). Wild blueberry fields are initially established from seeds naturally occurring (not planted), and then underground stems (rhizomes) develop. Roots then grow directly off of rhizomes creating a tightly woven mat across fields. Rhizomes grow within ~10 cm of the soil surface, and upright stems (~10 to 60 cm) above the soil surface are produced that ultimately bear fruit. An individual wild blueberry plant, with its spreading rhizome system, is referred to as a genet [1]. Each genet is visually, genetically, and physiologically different [1,2] from neighboring plants creating a complex mixture of genets in the wild blueberry fields, which provides consumers with a rich diversity of flavors. This crop is managed in a two-year cycle: the plants grow vegetatively in the first year (vegetative year) after the harvest and pruning of the previous year, and the plants flower and produce fruits in the second year (crop year). After harvesting the fruits, the plants become dormant, and wild blueberry growers prune the field by either mowing or burning to encourage growth in the following crop cycle.
Maine, USA, is the largest production region of wild blueberry in the U.S., where approximately 485 growers manage this unique crop commercially on 41,000 acres of land [3]. Wild blueberries are the second largest crop in Maine [3], with cultural and economic importance. Fertilizer companies advertise and sell foliar fertilizers to the growers without scientific evidence specific to wild blueberry. They claim that foliar fertilizer products consisting of different amounts of macro- and micro-nutrients, along with plant growth regulators (PGR), can improve nutrient uptake by the plants, further improving the growth and yield of wild blueberries. Soil-applied granular fertilizers such as monoammonium phosphate (MAP), diammonium phosphate (DAP), and ammonium sulfate have been the most common industry standard products for wild blueberry production. One of the major issues is that weed management is closely tied to nutrient management in wild blueberries. Because of the low soil pH, rhizomatous nature of the crop, and field-grown aspects of this system, any granular fertilizer applied is available for weeds to take up in addition to the crop [4]. Often fertilizers provide nutrients to the weeds allowing them to out-compete slow-growing blueberry plants [4]. Wild blueberry plants require acidic soil (soil pH of 4 to 4.5), making it harder for the plants to take up the required nutrients [4,5]. To overcome these issues, foliar fertilizers could be a solution because nutrients would be applied to the leaves where they can be quickly and readily absorbed with less potential for soil activation or environmental contamination [6]. The challenge behind applying foliar products is the waxy leaf cuticle on the blueberry leaves, which physiologically makes foliar fertilizer sprays ineffective when nutrients are applied or environmental conditions are unfavorable [7,8]. In this case, spraying foliar fertilizers containing adjuvants or spraying additional adjuvants like cellulose nanofibers [9] with the foliar fertilizers might aid in getting the applied nutrients or plant growth regulators (PGR) through the waxy leaf.
The traditional wild blueberry fertilizers are nitrogen and phosphorus based granular fertilizers, including MAP and DAP [10]. Based on several past studies identifying nutrition requirements for improved wild blueberry yield, N-P-K (Nitrogen-Phosphorous-Potassium), MAP, and DAP granular fertilizers have been shown to work best, providing them the most important nutrients (N, P, K) [10,11,12,13,14]. While nitrogen and phosphorus are the most important nutrients for plants, they also require other macro- and micro-nutrient elements such as Calcium and Boron [15,16]. Foliar-applied liquid boron was found to be more efficient for faster nutrient uptake by wild blueberry plants when compared to soil-applied granular boron due to the relative immobility of the boron element [17,18,19]. To date, there have been very few studies that have investigated the effects of micronutrients through foliar sprays on wild blueberry, where mixed results were reported [15,16,17,18,19]. In contrast, multiple studies on highbush blueberry plants reported foliar fertilizers to be effective in cases of leaf micronutrient deficiencies, which therefore improved yield in highbush blueberries (Vaccinium corymbosum L.) [6,7,8]. Due to the lack of sufficient investigation of foliar fertilizers containing macro- and micro-nutrients, plant growth regulators, and adjuvants, it is vital to evaluate such commercial foliar products before recommending them to wild blueberry growers.
Additionally, the physiology of wild blueberries is relatively understudied. Few studies, to our knowledge, have explored the photosynthetic performance of this crop [2,20,21,22,23,24]. Also, no study so far has related the wild blueberry photosynthesis and other physiological and morphological traits to fruit yield. This information is needed to understand better the effects of different fertilizers on the physiology and yield of this crop. Photosynthesis is directly related to plant productivity and crop yield [25,26], and is therefore used as a good indicator of fertilizer efficacy, though the relationship has not yet been established for wild blueberries. By using physiological traits like leaf chlorophyll concentration and photosynthesis to identify the absorption of nutrients, researchers and growers would have a physiological explanation for why certain products are effective or not. Therefore, robust investigations that test the efficacy of different commercial foliar products on the physiology, morphology, and production of wild blueberries are long overdue. To this end, the objectives of this study were to:
1. Assess the impacts of common commercial foliar fertilizer products containing different nutrient elements and plant growth regulators on wild blueberry physiology, morphology, growth, and yield during one crop cycle from 2019 (vegetative year) to 2020 (crop year).
2. Explore relationships among physiological traits, morphological traits, leaf nutrient elements, and the wild blueberry yield under different foliar fertilizer treatments.
2. Materials and Methods
2.1. Study Area and Experimental Design
Six different foliar fertilizer products were tested against one standard granular fertilizer, Diammonium phosphate (DAP) (Table 1) and control (no fertilizer) in a randomized complete block design with eight replicates (Figure 1) in a conventional wild blueberry field at the Blueberry Hill Farm, Jonesboro, ME, USA. Six soil samples were collected at a depth of 6” (15 cm) with a soil sampling probe from the entire study location across the field when the experimental blocks were laid out (May 2019). Those soil samples were mixed for homogeneity and sent as one sample to the University of Maine Soil Testing Lab, Orono, ME, USA, for a comprehensive soil test. The soil pH and organic matter (OM) were 4.8 and 12.1%, respectively, slightly higher than the recommended optimum levels (4 to 4.5 pH, and 5 to 8% OM) for wild blueberries. Each experimental plot was 6′ × 30′ (1.83 m × 9.14 m) represented in blue in Figure 1, and there was a 3′ (0.91 m) buffer zone between the experimental plots (Figure 1). In each experimental plot, at least two different wild blueberry genets were identified and flagged for measurements. This study was conducted for one crop cycle, starting in the vegetative year of 2019 and finishing in the crop year of 2020.

Table 1.
Physical properties, chemical composition, application rates, and times of commercial fertilizer products used in the experimental design (Figure 1) of this study in a conventional wild blueberry field at the Blueberry Hill Farm, Jonesboro, ME, USA during the crop cycle from 2019 (vegetative year) to 2020 (crop year).
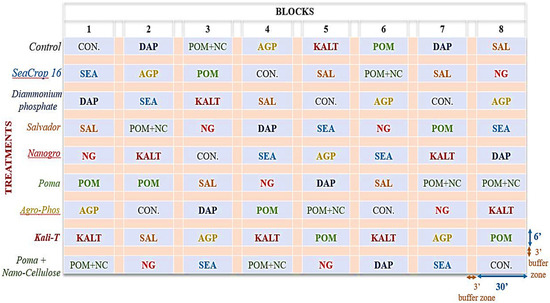
Figure 1.
Experimental Design of this study in a conventional wild blueberry field at the Blueberry Hill Farm, Jonesboro, ME, USA.
2.2. Application Materials and Methods
Fertilizer products for this study were chosen based on interest from a few fertilizer companies to sell their products to the wild blueberry growers in ME, USA. Fertilizer products were applied at the recommended rate according to the label or company representative in their recommended year (Table 1). Four products in this study are foliar fertilizers (Salvador, Kali-T, Agro-Phos, and Poma in Table 1) from the Agro-100 Global Inc., QC, Canada, which contain different amounts of macro- and micro-nutrient elements. Salvador is rich in nitrogen, phosphorus, and potassium, and complemented with magnesium, sulfur, and micronutrients (boron, iron, manganese, molybdenum, zinc) that are indispensable for plant growth. Kali-T is concentrated in potassium and enriched with nitrogen. About 70% of the potassium is in the form of potassium hydroxide and potassium carbonate, which are more easily absorbed by the leaves and the least phytotoxic. Agro-Phos is highly concentrated in phosphorus, includes soluble potassium and magnesium, and is assimilable by the foliar route. Poma is a calcium acetate-based liquid foliar nutrient which is also a chlorine- and nitrogen-free solution containing a multifunctional adjuvant (adhesive, penetrating, damping, anti-foaming, and tensioactive agents) that allows calcium to remain in solution longer on the leaf without being washed out and helps to penetrate the leaf more easily. Calcium in Poma works as an osmo-regulator to help the stabilization of plant cell membranes to prevent drought and/or late frost damage [5] and also plays a role in berry skin development.
Out of the other two foliar products (Table 1), Seacrop16 produced by North American Kelp, Waldoboro, ME, USA, and NanoGro produced by Aqua-Yield, Sandy, UT, USA, are fertilizers with plant growth regulator (PGR) active ingredients. The active ingredient in Seacrop16 is kelp extract which naturally contains cytokinin, a growth hormone associated with enhanced plant growth and bud development (cell division), which may serve as an alternative to traditional fertilizers [27,28]. NanoGro is N-P-K (7-10-1) mixed with gibberellic acid, another plant growth hormone known to promote and elongate cells [5]. Aqua-Yield claims that the NanoGro product can increase fruit set when applied during bloom. We also tested a nanocellulose product called Cellulose Nanofibril (CNF). We tested this CNF material as an additive for foliar products, which has been recently shown to be effective for foliar pesticide application and retention on leaves [9]. CNF is made from wood-derived fiber (pulp) that has been micro-refined to the nano level of several hundredths of a micron and smaller. This cellulose nanofibril is the world’s most advanced biomass material. We tested this material since CNF is derived from plant fibers, and thus the environmental impact from production and disposal is low. The University of Maine Process Development Center (PDC), Orono, ME, USA, supplies this cellulose nanofibril product (CNF) to academic, public, and private research groups interested in evaluating and developing applications for this material. The Process Development Center (PDC) is the only facility in the United States that can manufacture cellulose nanofibril (CNF) at a rate of one ton per day by mechanical fibrillation. The CNF material was hypothesized to help the foliar fertilizer as an adjuvant, sticking to the wild blueberry leaves and allowing the leaves to absorb the nutrients through the waxy cuticle. We chose the Poma product applied with the CNF to test our hypothesis. Poma was the only one containing an immobile macro-nutrient (Ca) with adjuvant out of all products, although there was no scientific proof regarding the efficiency of the adjuvant. Hence, testing with another potential adjuvant (CNF) [9] would reveal if the adjuvant in Poma was sufficient or needed an additional adjuvant to efficiently work through the wild blueberry waxy cuticle. DAP was included in this study as a traditional standard soil-applied granular fertilizer and applied at the recommended rate by the University of Maine Soil Testing Lab, Orono, ME, USA, based on the foliar test results conducted in 2018. Products recommended for vegetative and bud development were applied in 2019 as vegetative-year products, and products associated with flower and fruit development were applied in 2020 as crop-year products. In 2019, vegetative-year foliar products were mixed with water and applied using a back sprayer on 12 June, 9 July, 21 August, and 10 September. The DAP fertilizer treatment was applied one time as a broadcast application by hand on 12 June 2019. In 2020, crop-year products were mixed with water and applied using a back sprayer on 17 June, 9 July, and 29 July.
2.3. Measurement Methods
2.3.1. Physiological Traits
Six wild blueberry stems from each treatment plot were randomly selected to monitor chlorophyll and anthocyanin concentration from June to October in the vegetative year (2019). Again, in the crop year (2020), eight stems from each treatment plot were randomly selected to monitor chlorophyll and anthocyanin concentrations from June to September. Chlorophyll concentration (SPAD) was measured using an MC-100 chlorophyll concentration meter (Apogee Instruments, Inc., Logan, UT, USA), and Anthocyanin concentration (ACM) was measured using an ACM-200 (Opti-sciences, Hudson, NY, USA). Leaf photosynthetic rates were measured in leaves from two stems in each treatment plot with a portable photosynthetic measurement system through gas-exchange measurements (li-6800; Li-Cor Biosciences, Lincoln, NE, USA) on a sunny day (July 15th) in the vegetative year (2019) between 10:00 and 15:30 h solar time at a photosynthetic photon flux density of 1500 μmol m−2 s−1. The measurements were completed under an ambient CO2 concentration of around 350 to 370 μmol.mol−1, with temperatures ranging from 23.5 to 27.1 °C, and relative humidity ranging from 57% to 83%. Gas exchange measurements were taken from one stem in each treatment plot on a sunny day (July 16th) in the crop year (2020) between 10:00 and 15:00 h solar time. These measurements were completed under an ambient CO2 concentration between 360 to 380 μmol.mol−1, with temperatures ranging from 24 to 28 °C, and relative humidity ranging from 50% to 75%.
2.3.2. Structural Traits and Leaf Nutrient Concentrations
Six wild blueberry stems from each treatment plot were randomly selected to monitor stem heights from June to July (until 100% tip-die back of plants when their height increments leveled off) in the vegetative year (2019). In the crop year (2020), eight stems from each treatment plot were randomly selected for final stem height measurements. In the vegetative year (2019), twelve stems from each genet in each treatment plot (24 stems at two samples in each plot) were collected in July 2019 (after 100% tip-die back) to measure total leaf area per stem, leaf dry biomass per stem, and leaf mass per area. In the crop year (2020), during the harvesting period in early August, eight stems from two genets in each treatment plot (4 stems from each genet) were collected to measure leaf number, leaf dry biomass per stem, and leaf nutrients. Twelve random leaves from each of the 8 stems in each treatment plot were collected to measure leaf area per stem, leaf dry biomass, and leaf mass per area. Leaf area was determined using an LI-3000A area meter (Li-Cor, Lincoln, NE, USA), and the leaves were oven-dried at 70 °C to constant mass and weighed using a precision balance (0.0001 g). The dried leaf samples were ground and sent to the University of Maine Soil and Plant Tissue Testing Laboratory in Orono, ME, USA, for leaf nutrition analysis. Total carbon (C) and total nitrogen (N) in leaf tissue samples were quantified using a Leco TruMac CN analyzer (Midland, ON, Canada). The rest of the macro-nutrients (P, K, Ca, Mg) and micro-nutrients (Al, B, Cu, Fe, Mn, Zn) in leaf tissue samples were quantified using a Thermo-Fisher model iCAP 6300 radial view ICP-OES (Waltham, MA, USA).
2.3.3. Crop Yield
Wild blueberries from all the treatment plots were harvested on 13 August 2020, using a hand rake and a walk-behind harvester. The two harvesting modes provided a more exact yield via the hand rake and a more realistic yield via the harvester for each treatment plot. In two locations at the center third of each treatment plot, a 4 sq ft (0.37 m2) quadrat was hand raked and weighed to obtain a quadrat yield. Following the collection of the quadrat yield, a 3 ft (0.91 m) wide walk-behind harvester was used to harvest a 90 sq ft (8.36 m2) strip down the center of each treatment plot to obtain a representative ‘whole plot’ yield. Prior to harvesting, each plot was visually ranked on a scale of 0–3, with 0 indicating unusually low berry coverage and 3 indicating optimum berry coverage to account for bare patches or lower fruiting clones. The ranks were converted to a corresponding percent cover and multiplied by the whole plot yield and quadrat yield to obtain an estimated yield for each. The estimated yield represents an estimated potential yield under different fertility treatments. The estimated whole plot and quadrat yields were averaged by treatment plot to report the final ‘yield’ in this study.
2.4. Data Analysis
Statistical analyses were carried out using SPSS V21 (IBM Corp., Armonk, NY, USA) and JMP Pro 16.2 (SAS Institute Inc., Cary, NC, USA). Frequently monitored measurements during the growing season, including stem heights, chlorophyll concentration, and anthocyanin concentration, were analyzed by a two-way analysis of variance (ANOVA) using a General linear model univariate procedure testing the effects of time (measurement dates), treatments, and any interaction between time (dates) and treatments. Analysis of Variance (ANOVA) based upon a randomized complete block design (RCB) as well as a series of General linear models were used to compare the single date measurements (leaf photosynthetic rates, leaf area, leaf biomass, leaf mass per area, leaf nutrients, and harvest yield). These analyses were followed by a Tukey’s pairwise comparison and LSD (least significant difference) post-hoc test (α = 0.05). For all these analyses, treatments were considered as a fixed factor, experimental blocks were considered as a random factor, and Bonferroni confidence interval adjustment was applied. A Principal Component Analysis (PCA) was applied to all the physiological, morphological, leaf nutrients, and yield measurements using the multivariate platform in JMP Pro 16.2. The two highest PCs (PC 1 and PC 2 and their explained percentage of total variance) were used to plot the PCA scores and PCA loadings for the data taken in 2019 and 2020 separately. Further, multiple linear regression analysis and bivariate linear regression analyses were conducted in predicting the crop yield (dependent variable) using all the physiological, morphological, and leaf nutrient measurements (independent variables) in JMP Pro 16.2. For all the above-mentioned analyses, data were transformed by the square root prior to analysis if and where necessary.
3. Results
3.1. Effects on Wild Blueberry Plant Physiology
Overall, applied fertilizer treatments significantly affected the measured wild blueberry leaf chlorophyll concentrations on different dates throughout the growing season (Table 2 and Figure 2) in both vegetative and crop years. In the vegetative year (2019), plants treated with DAP fertilizer consistently had the highest leaf chlorophyll concentration throughout the summer among all treatments (Figure 2a). Both DAP and Salvador treated plants had significantly higher leaf chlorophyll concentrations at the end of July 2019 (Figure 2c) when plants reached their seasonal peak chlorophyll concentration, compared to plants under other treatments (Figure 2a). In the crop year (2020), overall leaf chlorophyll concentration levels were lower than the observed levels in the vegetative year. Interestingly, the effects from DAP fertilizer diminished in the crop year (2020), whereas a significantly higher leaf chlorophyll concentration was observed in the SeaCrop16 and Poma+Nanocellulose treated plants compared to the other treatments, including control (Figure 2b,c).

Table 2.
Two-way Analysis of variance (ANOVA) results from the fertilizer effects on leaf chlorophyll concentration measured on different dates in 2019 and 2020, as shown in Figure 2a,b.
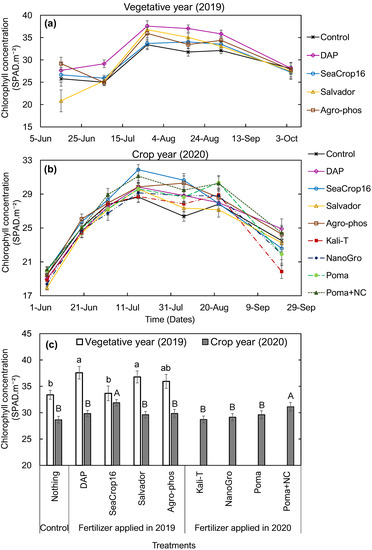
Figure 2.
Changes in leaf chlorophyll concentration in wild blueberry plants over (a) June to October in 2019 (vegetative year) and (b) June to September in 2020 (crop year) under nine different treatments. (c) Comparison of peak leaf chlorophyll concentration in wild blueberry plants in 2019 and 2020 across the nine different treatments. Error bars indicate the standard error of the mean. Different small letters and capital letters over the bars indicate significant differences among the treatments in 2019 and 2020, respectively, at the significance level of p < 0.05.
In contrast to the chlorophyll concentration, no significant differences were found in leaf photosynthetic rates (Figure 3) among the treatments in the vegetative year (2019). Also, leaf photosynthetic rates (Figure 3) in the crop year (2020) were not in agreement with the observed pattern in leaf chlorophyll concentrations (Figure 2c) across the applied treatments. The leaf photosynthetic rates were significantly lower in DAP and Seacrop16 treated plots compared to the control and other treatments, and no significant differences were found among all other treatments (Figure 3).
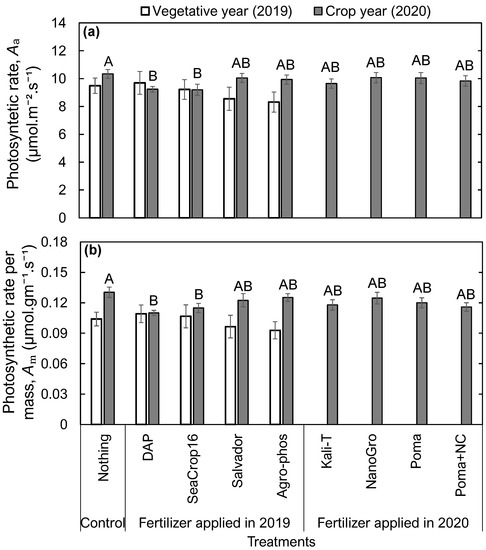
Figure 3.
Comparison in (a) Photosynthetic rate per leaf area and (b) Photosynthetic rate per leaf mass of wild blueberry plants in 2019 and 2020 across the studied nine different treatments. Error bars indicate the standard error of the mean. No letters over the bars indicate no significant differences among the treatments in 2019, and different capital letters indicate significant differences among the treatments in 2020 at the significance level of p < 0.05.
3.2. Effects on Wild Blueberry Plant Morphology
No significant differences were found in morphological traits (stem height, leaf area, leaf biomass, and leaf mass per area) of the wild blueberry crops across the treatments in both the vegetative and crop years (Figure 4 and Figure 5). Final stem heights (Figure 4) showed no significant difference among all the treated plots measured in the crop year (2020) right before harvesting the fruit.
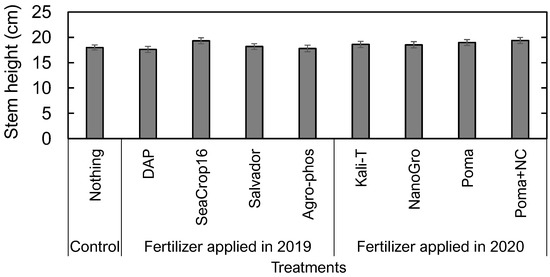
Figure 4.
Comparison of final wild blueberry stem heights in 2020 (crop year) across the nine treatments. Error bars indicate the standard error of the mean. No letters indicate no significant differences among the treatments at the significance level of p < 0.05.
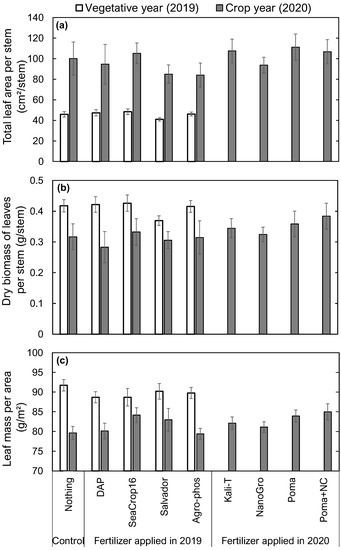
Figure 5.
Comparison in (a) Total leaf area per stem, (b) Dry biomass of leaves per stem, and (c) Leaf mass per area (LMA) of wild blueberry plants in 2019 and 2020 across the studied nine different treatments. Error bars indicate the standard error of the mean. No letters over the bars indicate no significant differences among the treatments at the significance level of p < 0.05.
Overall, leaf area per stem was two times higher, while the leaf mass per stem and leaf mass per area were lower in the crop year (2020) than in the vegetative year (2019). There was no significant difference among different treatments in leaf area per stem, leaf biomass per stem, and leaf mass per area (Figure 5). Although not significant, Salvador treated plots had the lowest average leaf area and biomass per stem (Figure 5a,b) among all treatments, including the control. Control plants had the highest average leaf mass per area (Figure 5c) in the vegetative year (2019). In the crop year (2020), higher average leaf area and biomass per stem were found in SeaCrop16, Kali-T, Poma, and Poma+NC treated plots compared to the control, whereas other treatments showed lower leaf area and biomass than the control plot (Figure 5a,b), but not significantly different. SeaCrop16, Salvador, Kali-T, Poma, and Poma+NC treated plots showed higher average leaf mass per area than other treatments, including the control, yet this was not significantly different (Figure 5c).
3.3. Effects on Wild Blueberry Leaf Nutrients
In all treatments, leaf nitrogen (N), phosphorus (P), and potassium (K) levels were lower than the established optimum level (Figure 6a–c) for wild blueberry plants in both the vegetative (2019) and crop (2020) years. In contrast, leaf calcium (Ca) (Figure 6e) and magnesium (Mg) (Figure 6f) levels were at the optimum level in the vegetative year, and they were higher than the optimum level in the crop year in all the treatments. In terms of differences across the treatments, no significant differences in leaf macro-nutrients (N, P, K, C, Ca, and Mg in Figure 6) in the vegetative year were found. By contrast, in the crop year, significantly higher leaf P (Figure 6b) was observed in the DAP treatment, yet that was not significantly higher than the control where no fertilizer was applied. However, no significant differences were found in leaf N (Figure 6a), K (Figure 6c), and C (Figure 6d) concentrations across the treatments in the crop year, whereas significantly lower Ca (Figure 6e) and Mg (Figure 6f) concentrations were found in Kali-T treatment compared to others.
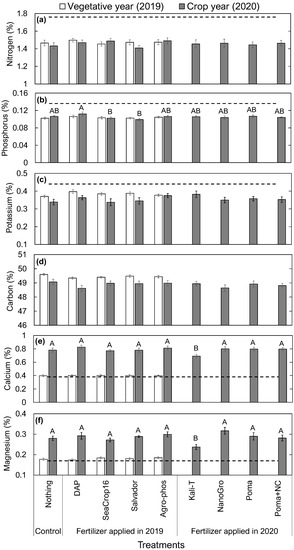
Figure 6.
Comparison in the concentration of macro-nutrient elements per leaf mass of wild blueberry plants in 2019 and 2020 across the studied nine different treatments: (a) Nitrogen, (b) Phosphorus, (c) Potassium, (d) Carbon, (e) Calcium, and (f) Magnesium. Error bars indicate the standard error of the mean. No letters over the bars indicate no significant differences among the treatments in 2019, and different capital letters indicate significant differences among the treatments in 2020 at the significance level of p < 0.05. The dashed lines represent the recommended optimum nutrient levels in wild blueberry leaves [29].
In the vegetative year, leaf micro-nutrients (Figure 7) such as Boron (B), Copper (Cu), Iron (Fe), Manganese (Mn), and Zinc (Zn) were at the optimum level in all treatments, whereas only Aluminum (Al) was far below the optimum level required for the wild blueberry plants. These leaf micro-nutrients were close to (Al in Figure 7b) or higher (B in Figure 7a; Cu, Fe, Mn, Zn in Figure 7c–f) than the optimum levels in the crop year. Regarding differences across the treatments, no significant differences were found in micro-nutrients (Figure 7) in the vegetative year (Figure 6). In contrast, significant differences among the treatments were found in the crop year for all the micro-nutrients (B, Al, Fe, Mn, Zn in Figure 7a,b,d–f) except for Cu (Figure 7c).
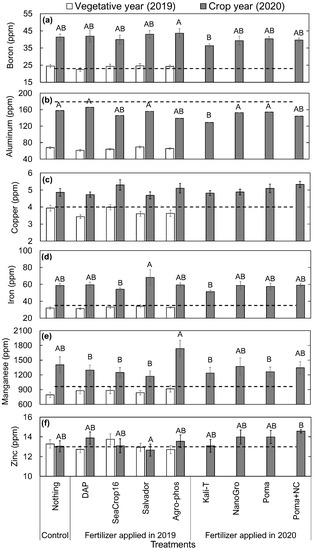
Figure 7.
Comparison in the concentration of micro-nutrient elements per leaf mass of wild blueberry plants in 2019 and 2020 across the studied nine different treatments: (a) Boron, (b) Aluminum, (c) Copper, (d) Iron, (e) Manganese, and (f) Zinc. Error bars indicate the standard error of the mean. No letters over the bars indicate no significant differences among the treatments in 2019, and different capital letters indicate significant differences among the treatments in 2020 at the significance level of p < 0.05. The dashed lines represent the recommended optimum nutrient levels in wild blueberry leaves [29].
3.4. Effects on Crop Yield
No significant differences across the treatments were found in harvested wild blueberries at the end of this study in crop year (2020) (Figure 8). However, based on the average, although not significant, Poma+NC treated plots followed by NanoGro and DAP treated plots had higher yield than the control, whereas other treated plots had lower yield than the control (Figure 8).
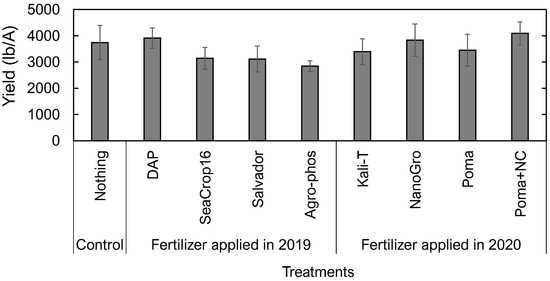
Figure 8.
Comparison in harvested yield of wild blueberries in crop year (2020) across the studied nine different treatments. Error bars indicate the standard error of the mean. No letters over the bars indicate no significant differences among the treatments at the significance level of p < 0.05.
3.5. Relationships among All Wild Blueberry Plant Traits and Yield
Based on the principal component analysis of all measured traits when vegetative (traits of vegetative year and crop yield in Figure 9a) and crop (traits of crop year and crop yield in Figure 9b) years are analyzed separately, the vegetative year (Figure 9a) exhibited more closely related traits, especially regarding crop yield, rather than the traits of the crop year (Figure 9b). It is also evident that a higher percentage of the total variance was explained by the first two principal components in the vegetative year (20.8% by PC1 and 14.1% by PC2 in Figure 9a) than in the crop year (17.2% by PC1 and 11.3% by PC2). In fact, all the measured physiological traits, morphological traits, and leaf macro- and micro-nutrients from the vegetative year significantly (p < 0.05) explained 70% of the variation of the yield, whereas those parameters from the crop year explained only 40% (Table 3), which is non-significant. Moreover, out of all the measured traits in the vegetative year, the morphological traits such as leaf area per stem, leaf mass per stem, and leaf mass per area were the most important predictive parameters (Table 3).
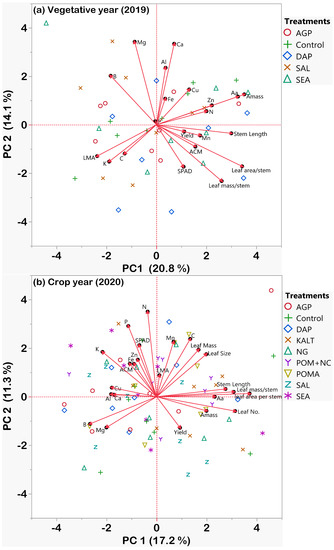
Figure 9.
Principal Component Analysis (PCA) of physiological traits (SPAD, ACM, Aa, Amass), morphological traits (stem length, leaf size, leaf mass, leaf no., leaf mass per area), major and minor leaf nutrient elements (N, P, K, C, Ca, Mg, B, Al, Cu, Zn, Mn, Fe) and yield of wild blueberries in (a) 2019 and (b) 2020. Red arrows indicate the PCA loadings of different traits. Different colored shapes in the background indicate the PCA scores for different studied treatments.

Table 3.
Multiple linear regression analysis predicting the harvested wild blueberry yield in the crop year using measured physiological traits (SPAD, ACM, Aa, Amass), morphological traits (stem length, leaf area and mass per stem, leaf mass per area), leaf macro- and micro-nutrients (N, P, K, C, Ca, Mg, B, Al, Cu, Zn, Mn, Fe) from both Vegetative year (2019) and Crop year (2020). Bold values indicate significant effects at the significance level of p < 0.05.
Additional to the bivariate analysis between the measured traits and yield (Table 4), we observed that yields are significantly positively related to stem length (Figure 10a) of wild blueberry plants. Leaf area per stem was also positively related to yield according to the multiple regression (Table 3), but the bivariate relationship was not significant (Figure 10b). Such relationships indicate that with the increasing stem height and leaf surface area of wild blueberry plants in the vegetative year, an increased yield was observed. The relationship between stem height and yield (Figure 10a) was similar in both vegetative and crop years because stem heights were measured after the tip-die back period in the vegetative year. Therefore, the final stem heights measured in crop year were almost the same as in the vegetative year since the stem heights level off after the tip-die back period passes.

Table 4.
Bivariate linear regression analysis predicting the harvested wild blueberry yield in the crop year using individual measured physiological traits (SPAD, ACM, Aa, Amass), morphological traits (stem length, leaf area, mass per stem, leaf mass per area), and leaf macro- and micro-nutrients (N, p, K, C, Ca, Mg, B, Al, Cu, Zn, Mn, Fe) from both the Vegetative year (2019) and the Crop year (2020). Bold values indicate significant linear relationships at the significance level of p < 0.05. R2 values with negative signs indicate negative linear relationships between the parameters.
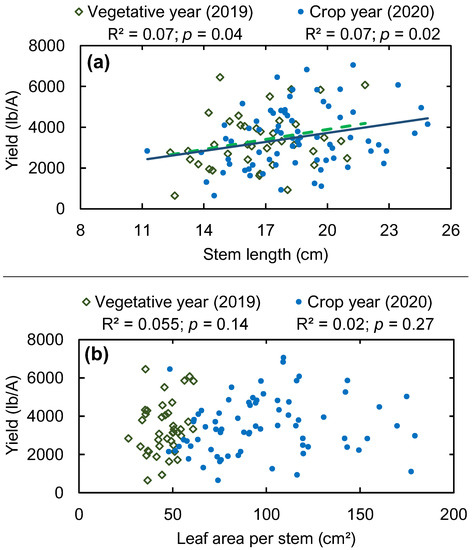
Figure 10.
Wild blueberry yield in relation to stem length (a) and leaf area per stem (b) in the vegetative year (2019) and crop year (2020). The green dashed line and solid blue line represent significant linear regressions in the vegetative year and crop year, respectively.
4. Discussion
We found limited effects of applied fertilizer products on physiological and morphological traits (except leaf chlorophyll concentrations) of wild blueberries in the first (vegetative) year. However, significant differences in most of the traits across treatments were found in the second (crop) year. This could be because wild blueberry leaves need time to absorb nutrients from the applied fertilizers, especially through the existing thick waxy cuticle, and respond slowly. Our results revealed that some mobile macro-nutrients (N, P, K) needed in higher quantities might be more effective if supplied from the soil rather than through foliar products. On the other hand, immobile macro-nutrients such as Ca or plant growth regulators appeared effective when applied through the foliar system. Moreover, if an adjuvant was added to the foliar product, such as the nanocellulose used in this study, wild blueberry leaves would more effectively absorb the nutrients. Our results also revealed that if wild blueberry leaves already contain the optimum level of their most required immobile and micronutrients such as Ca, B, or Mg, it is futile to supply more of those nutrients. In fact, supplying more nutrients above a maximum threshold will not benefit wild blueberry development and production. Rather, it will add an unnecessary cost for the growers. It further implies the importance of testing leaf tissues before supplying any fertilizers to the wild blueberries. Based on the traits measured in both the vegetative and crop years of this study, we established that physiological and morphological performance in the vegetative year rather than the crop year is more likely to decide wild blueberry yield potential.
We found significant effects of applied fertilizers on leaf chlorophyll concentrations in both the vegetative and crop years. In the vegetative year (2019), the high nitrogen content in the DAP (80 lb N/acre) and Salvador (N-P-K: 14-4-6) might be the reason for higher leaf chlorophyll concentrations [30,31,32]. Higher leaf chlorophyll concentrations might also help increase the number of flower buds, as found in other studies [33], that occur almost at the end of summer in the vegetative year for the wild blueberries [34]. Previous studies have shown that N-P-K and DAP fertilizers are efficient for wild blueberries [12,13,14,15]. Although leaf chlorophyll concentration has been shown to be a strong determinant of photosynthesis for other plants [35,36], it might not be true for wild blueberries. This is because leaf photosynthetic rates measured in this study did not follow the trend of the measured leaf chlorophyll concentration, and hence there was no correlation or relationship between these two physiological traits. Two treatments (DAP, SeaCrop16) showed lower, and other treatments showed similar leaf photosynthetic rates to the control plot, which might be because of high variation in photosynthetic capacity across genets [2]. Our study observed leaf photosynthetic rate variation of 1 to 3 µmol.m−2 s−1 across different treatments with different genets in the studied field. This is consistent with the previous study [2] conducted in the same field, which has shown high variation (range of 2 to 5 µmol.m−2 s−1) in leaf photosynthetic capacity across different wild blueberry genets. Average leaf surface area per stem was higher in SeaCrop16 and DAP treatments (although not significant), possibly because of the cell division regulator hormone (cytokinin) in SeaCrop16 and the high nitrogen supply from the DAP fertilizer [5,32]. Since wild blueberry is a slow-growing plant that needs time to uptake and metabolize the applied nutrients, especially because of the acidic soil environment [37], more significant effects from all the treatments were found in the crop year.
However, significant differences were not found in morphology or fruit yield in the crop year. A possible explanation is that the wild blueberry leaves already contained the recommended levels of their most important nutrients [29,38] in the vegetative year, most of which increased beyond the optimum ranges after fertilizer application. This implies that if wild blueberry leaves already contain optimum nutrient levels, it is unnecessary to apply more as they can be toxic rather than helpful to the crop [5], not to mention extravagant for growers. For instance, excessive B and Ca can be harmful to the wild blueberry plant [38], which is possibly why there were no significant differences in yield across the treatments as the plants already had much more B and Ca than they required. Still, Poma+Nanocellulose containing Ca and adjuvant showed some promising results, such as higher leaf chlorophyll concentration, but Poma and Poma+Nanocellulose did not significantly increase the amount of leaf Ca. In terms of applying such foliar nutrients (Ca), an adjuvant like the cellulose nanofibril (CNF) appears to help the nutrient element get through the waxy coating of the wild blueberry leaf [9,39,40]. Adjuvants such as the cellulose nanofibril (CNF) might help the foliar nutrients disperse well and get into the leaf stomata and stick to the leaves for a comparatively longer time during windy and rainy weather [9,39,40]. However, further investigation is needed to explore the use of different adjuvants for foliar nutrient adsorption by the wild blueberry plants because adjuvants vary widely [9,39,40].
Lastly, in this study, the physiological and morphological performance of wild blueberries in the vegetative year were better indicators of yield compared to those in the crop year. Specifically, stem heights and leaf surface area appeared to play important roles in yield prediction. In the vegetative year, wild blueberry plants need sufficient nutrients, such as N, P, K, to build the stems and leaves for carbohydrate production, transportation, and storage [38]. For such processes to occur, they especially need nitrogen to invest in building leaf chlorophyll to produce carbohydrates [5,30,31,32] and hence flower buds [33]. These flower buds will become fruit in the crop year as long as they receive enough pollination [34,41,42,43,44]. As a perennial and clonal shrub plant, wild blueberry has a large underground energy and carbohydrate reservoir in the rhizomes and roots. The carbohydrates produced in the vegetative year could be crucial for the flower development in the crop year when leaves are still young. In the crop year, more vital factors such as pollination, pest pressure, and soil moisture during fruit set and maturation determine actual fruit production [10,41,42,43,44].
5. Conclusions
In conclusion, our study implies that sufficient vegetative growth must be present in the vegetative year to guarantee a high yield in the following season. Proper fertilization management according to leaf tissue nutrient content in the vegetative year after the tip-die back [10] must be conducted to reach its yield potential and to manage the wild blueberry farms economically. In terms of fertilization, foliar products might be a better option to correct for deficiencies of immobile and micro-nutrients, whereas an adjuvant might also help for better utilization of such foliar products. Since our studied plants did not show any micro-nutrient deficiency and we only studied a few foliar products, there are more opportunities for further investigations. Research for more than one crop cycle will be required to identify when the nutrient deficiencies occur in wild blueberry plants, and how foliar products with adjuvants like nanocellulose materials will help manage them efficiently and economically.
Author Contributions
Conceptualization, Y.-J.Z. and L.C.; methodology, Y.-J.Z., L.C., B.T. and R.T.; software, R.T.; validation, Y.-J.Z. and R.T.; formal analysis, R.T.; investigation, L.C., B.T. and R.T.; resources, Y.-J.Z., L.C. and L.W.; data curation, B.T. and R.T.; writing—original draft preparation, R.T.; writing—review and editing, Y.-J.Z., L.C., L.W. and B.T.; visualization, Y.-J.Z., R.T. and L.W.; supervision, Y.-J.Z. and L.C.; project administration, Y.-J.Z. and L.C.; funding acquisition, Y.-J.Z. and L.C. All authors have read and agreed to the published version of the manuscript.
Funding
This project was supported by the USDA Specialty Crop Block Grant program through the Maine Department of Agriculture, Conservation and Forestry, the Wild Blueberry Commission of Maine, and the USDA National Institute of Food and Agriculture, Hatch Project number ME0-22021 through the Maine Agricultural & Forest Experiment Station. Maine Agricultural and Forest Experiment Publication Number 3882. Y.-J.Z. was also supported by the University of Maine Faculty Summer Research Award. The foliar fertilizer products used in this study were donated by the foliar fertilizer companies (Agro-100 Global, North American Kelp Company, and Aqua-Yield).
Data Availability Statement
Data is available upon request from one of the corresponding authors (R.T.: rafa.tasnim@maine.edu).
Acknowledgments
We thank the Blueberry Hill farm crew Joshua Stubbs and Christopher McManus for managing the wild blueberry field. We also thank Becky Gumbrewicz, Anthony Ayers, Sydney Abramovich, Aidan Lurgio, Sarah Marcotte, and Aldous Hofmann for assisting with the field and lab work for this study. We also thank Douglas J. Gardner for providing the nanocellulose for our study.
Conflicts of Interest
The authors declare no conflict of interest.
References
- Bell, D.J.; Rowland, L.J.; Zhang, D.; Drummond, F.A. Spatial genetic structure of lowbush blueberry, Vaccinium angustifolium, in four fields in Maine. Botany 2009, 87, 932–946. [Google Scholar] [CrossRef]
- Tasnim, R.; Zhang, Y.J. Are Wild Blueberries a Crop with Low Photosynthetic Capacity? Chamber-Size Effects in Measuring Photosynthesis. Agronomy 2021, 11, 1572. [Google Scholar] [CrossRef]
- United States Department of Agriculture National Agricultural Statistics Services (USDA NASS). Noncitrus Fruit and Nuts 2020 Summary. 2021. Available online: https://downloads.usda.library.cornell.edu/usda-esmis/files/zs25x846c/sf269213r/6t054c23t/ncit0521.pdf (accessed on 26 January 2022).
- Yarborough, D.E.; Bhowmik, P.C. Lowbush blueberry-bunchberry competition. J. Am. Soc. Hortic. Sci. 1993, 118, 54–62. [Google Scholar] [CrossRef]
- Taiz, L.; Zeiger, E.; Møller, I.M.; Murphy, A. Plant Physiology and Development, 6th ed.; Sinauer Associates Incorporated: Sunderland, MA, USA, 2015. [Google Scholar]
- Karlsons, A.; Osvalde, A. Effect of foliar fertilization of microelements on highbush blueberry (Vaccinium corumbosum L.) nutrient status and yield components in cutover peatlands. Agron. Res. 2019, 17, 133–143. [Google Scholar] [CrossRef]
- Hart, J.; Strik, B.; White, L.; Yang, W.; Nutrient Management for Blueberries in Oregon. Oregon State University. 2006. Available online: https://catalog.extension.oregonstate.edu/em8918 (accessed on 5 November 2021).
- Wach, D.; Błazewicz-Woźniak, M. Effect of foliar fertilization on yielding and leaf mineral composition of highbush blueberry (Vaccinium corymbosum L.). Acta Sci. Pol. Hortorum Cultus 2012, 11, 205–214. [Google Scholar]
- Zhang, C.; Yang, X.; Yang, S.; Liu, Z.; Wang, L. Eco-friendly and multifunctional lignocellulosic nanofibre additives for enhancing pesticide deposition and retention. Chem. Eng. J. 2022, 430, 133011. [Google Scholar] [CrossRef]
- Yarborough, D.E.; Smagula, J.M. Fertilizing with Nitrogen and Phosphorus, Fact Sheet No. 225. University of Maine Cooperative Extension, Orono, ME, USA. 2013. Available online: https://extension.umaine.edu/blueberries/factsheets/production/fertilizing-with-nitrogen-phosphorus/ (accessed on 5 November 2021).
- Collins, J.A.; Drummond, F.A. Fertilizer and fungicides: Effects on wild blueberry growth, insect attack, and leaf spot disease incidence. In Proceedings of the North American Blueberry Research and Extension Workers Conference, Orono, ME, USA, 12–15 August 2018; p. 7. Available online: https://digitalcommons.library.umaine.edu/nabrew2018/proceedingpapers/proceedingpapers/7 (accessed on 5 November 2021).
- Starast, M.; Karp, K.; Vool, E. Effect of NPK fertilization and elemental sulphur on growth and yield of lowbush blueberry. Agric. Food Sci. 2007, 16, 34–45. [Google Scholar] [CrossRef]
- Percival, D.C.; Janes, D.E.; Stevens, D.E.; Sanderson, K. Impact of multiple fertilizer applications on plant growth, development, and yield of wild lowbush blueberry (Vaccinium angustifolium Aiton). In Proceedings of the XXVI International Horticultural Congress: Berry Crop Breeding, Production and Utilization for a New Century, Toronto, ON, Canada, 11–17 August 2002; Volume 626, pp. 415–421. [Google Scholar]
- Percival, D.; Sanderson, K. Main and interactive effects of vegetative-year applications of nitrogen, phosphorus, and potassium fertilizers on the wild blueberry. Small Fruits Rev. 2004, 3, 105–121. [Google Scholar] [CrossRef]
- Smagula, J.M. Effect of boron on lowbush blueberry fruit set and yield. In Proceedings of the V International Symposium on Vaccinium Culture, Melbourne, Australia, 14 January 1993; Volume 346, pp. 183–192. [Google Scholar]
- Chen, Y.; Smagula, J.M.; Litten, W.; Dunham, S. Effect of boron and calcium foliar sprays on pollen germination and development, fruit set, seed development, and berry yield and quality in lowbush blueberry (Vaccinium angustifolium Ait.). J. Am. Soc. Hortic. Sci. 1998, 123, 524–531. [Google Scholar] [CrossRef]
- Perrin, G.D. Main and Interactive Effects of Boron on Lowbush Blueberry (Vaccinium Angustifolium Ait.) Nutrition, Growth, Development, and Yield. Nova Scotia Agricultural College. 2001. Available online: https://central.bac-lac.gc.ca/.item?id=MQ50969&op=pdf&app=Library&oclc_number=1006915219. (accessed on 5 November 2021).
- Eaton, F.M. Deficiency, toxicity and accumulation of boron in plants. J. Agric. Res 1944, 69, 237–277. [Google Scholar]
- Eaton, L.J.; Ju, H.-Y.; Sanderson, K. Effects of summer and fall applications of foliar boron on fruit bud winter injury in wild blueberry (Vaccinium angustifolium Ait.). Can. J. Plant Sci. 2007, 87, 923–925. [Google Scholar] [CrossRef]
- Hicklenton, P.R.; Reekie, J.Y.; Gordon, R.J.; Percival, D.C. Seasonal patterns of photosynthesis and stomatal conductance in lowbush blueberry plants managed in a two-year production cycle. HortScience 2000, 35, 55–59. [Google Scholar] [CrossRef]
- Percival, D.; Murray, A.; Stevens, D. Drought stress dynamics of wild blueberry (Vaccinium angustifolium Aiton). Acta Hortic. 2003, 618, 353–362. [Google Scholar] [CrossRef]
- Percival, D.; Kaur, J.; Hainstock, L.J.; Privé, J.P. Seasonal changes in photochemistry, light use efficiency and net photosynthetic rates of wild blueberry (Vaccinium angustifolium Ait.). Can. J. Plant Sci. 2012, 92, 1135–1143. [Google Scholar] [CrossRef][Green Version]
- Yarborough, D.E. Factors contributing to the increase in productivity in the wild blueberry industry. Sm. Fr. Rev. 2004, 3, 33–43. [Google Scholar] [CrossRef]
- Tasnim, R.; Calderwood, L.; Annis, S.; Drummond, F.; Zhang, Y.J. The future of wild blueberries: Testing warming impacts using open-top chambers. Spire Maine J. Conserv. Sustain. 2020. Issue 4. Available online: https://umaine.edu/spire/2020/02/10/wildblueberries/ (accessed on 22 February 2021).
- Zelitch, I. The close relationship between net photosynthesis and crop yield. Bioscience 1982, 32, 796–802. [Google Scholar] [CrossRef]
- Peng, S.; Krieg, D.R.; Girma, F.S. Leaf photosynthetic rate is correlated with biomass and grain production in grain sorghum lines. Photosynth. Res. 1991, 28, 1–7. [Google Scholar] [CrossRef]
- Peltonen-Sainio, P. Nitrogen fertilizer and foliar application of cytokinin affect spikelet and floret set and survival in oat. Field Crops Res. 1997, 49, 169–176. [Google Scholar] [CrossRef]
- Zodape, S.T.; Kawarkhe, V.J.; Patolia, J.S.; Warade, A.D. Effect of liquid seaweed fertilizer on yield and quality of okra (Abelmoschus esculentus L.). J. Sci. Ind. Res. 2008, 67, 1115–1117. [Google Scholar]
- Santiago, J.P.M. Improving Lowbush Blueberry (Vaccinium angustifolium Ait.) Growth and Development through Optimal Mineral Nutrition. MS (Master of Science) Thesis, Electronic Theses and Dissertations, University of Maine, Orono, ME, USA, 2011; p. 728. Available online: https://digitalcommons.library.umaine.edu/etd/728 (accessed on 5 November 2021).
- Wood, C.W.; Reeves, D.W.; Duffield, R.R.; Edmisten, K.L. Field chlorophyll measurements for evaluation of corn nitrogen status. J. Plant Nutr. 1992, 15, 487–500. [Google Scholar] [CrossRef]
- Wood, C.W.; Tracy, P.W.; Reeves, D.W.; Edmisten, K.L. Determination of cotton nitrogen status with a hand-held chlorophyll meter. J. Plant Nutr. 1992, 15, 1435–1448. [Google Scholar] [CrossRef]
- Zhang, Y.J.; Cao, K.F.; Sack, L.; Li, N.; Wei, X.M.; Goldstein, G. Extending the generality of leaf economic design principles in the cycads, an ancient lineage. New Phytol. 2015, 206, 817–829. [Google Scholar] [CrossRef] [PubMed]
- Sousa-Souto, L.; Bocchiglieri, A.; de Dias, D.; Ferreira, A.S.; Filho, J.P. Changes in leaf chlorophyll content associated with flowering and its role in the diversity of phytophagous insects in a tree species from a semiarid Caatinga. PeerJ 2018, 6, e5059. [Google Scholar] [CrossRef] [PubMed]
- Bell, D.J.; Rowland, L.J.; Smagula, J.M.; Drummond, F. Recent Advances in the biology and genetics of lowbush blueberry. Maine Agric. For. Exper. Stn. Tech. Bull. 2009, 203, 1–28. [Google Scholar]
- Evans, J.T. Nitrogen and photosynthesis in the flag leaf of wheat. Plant Physiol. 1985, 72, 297–302. [Google Scholar] [CrossRef]
- Seemann, J.R.; Sharkey, T.D.; Wang, J.; Osmond, C.B. Environmental effects on photosynthesis, nitrogen-use efficiency, and metabolite pools in leaves of sun and shade plants. Plant Physiol. 1987, 84, 796–802. [Google Scholar] [CrossRef]
- Yarborough, D.E. Establishment and management of the cultivated lowbush blueberry (Vaccinium angustifolium). Int. J. Fruit Sci. 2012, 12, 14–22. [Google Scholar] [CrossRef]
- Calderwood, L.; Yarborough, D.E.; Smagula, J.M. Interpreting Your Leaf Analysis Results, Fact sheet No. 223. University of Maine Cooperative Extension, Orono, ME, USA. 2020. Available online: https://extension.umaine.edu/blueberries/factsheets/production/interpreting-your-leaf-analysis-results/ (accessed on 5 November 2021).
- Fernández, V.; Eichert, T. Uptake of hydrophilic solutes through plant leaves: Current state of knowledge and perspectives of foliar fertilization. Crit. Rev. Plant Sci. 2009, 28, 36–68. [Google Scholar] [CrossRef]
- Schönherr, J. Cuticular penetration of calcium salts: Effects of humidity, anions, and adjuvants. J. Plant Nutr. Soil Sci. 2001, 164, 225–231. [Google Scholar] [CrossRef]
- Drummond, F.A. Factors That Affect Yield in Wild Blueberry, Vaccinium angustifolium Aiton. Agric. Res. Tech. Open Access J. 2019, 22, 556212. [Google Scholar]
- Qu, H.; Drummond, F. Simulation-based modeling of wild blueberry pollination. Comput. Electron. Agric. 2018, 144, 94–101. [Google Scholar] [CrossRef]
- Obsie, E.Y.; Qu, H.; Drummond, F. Wild blueberry yield prediction using a combination of computer simulation and machine learning algorithms. Comput. Electron. Agric. 2020, 178, 105778. [Google Scholar] [CrossRef]
- Qu, H.; Xiang, R.; Obsie, E.Y.; Wei, D.; Drummond, F. Parameterization and calibration of wild blueberry machine learning models to predict fruit-set in the northeast china bog blueberry agroecosystem. Agronomy 2021, 11, 1736. [Google Scholar] [CrossRef]
Publisher’s Note: MDPI stays neutral with regard to jurisdictional claims in published maps and institutional affiliations. |
© 2022 by the authors. Licensee MDPI, Basel, Switzerland. This article is an open access article distributed under the terms and conditions of the Creative Commons Attribution (CC BY) license (https://creativecommons.org/licenses/by/4.0/).