Article

Excessive Rainfall Is the Key Meteorological Limiting Factor for Winter Wheat Yield in the Middle and Lower Reaches of the Yangtze River

1
Department of Geography and Spatial Information Techniques, Ningbo University, Ningbo 315211, China
2
Institute of Applied Remote Sensing and Information Technology, Zhejiang University, Hangzhou 310058, China
3
Key Laboratory of Environmental Remediation and Ecological Health, Ministry of Education, Zhejiang University, Hangzhou 310058, China
4
Key Laboratory of Agricultural Remote Sensing and Information Systems, Hangzhou 310058, China
5
Anhui Meteorological Information Centre, Hefei 230031, China
6
School of Automation, Hangzhou Dianzi University, Xiasha Higher Education Zone, Hangzhou 310018, China
*
Author to whom correspondence should be addressed.
Agronomy 2022, 12(1), 50; https://doi.org/10.3390/agronomy12010050
Submission received: 11 November 2021 / Revised: 15 December 2021 / Accepted: 22 December 2021 / Published: 27 December 2021

Abstract

:
In the era of global climate change, extreme weather events frequently occur. Many kinds of agro-meteorological disasters that are closely related to environmental conditions (such as sunshine hours, temperature, precipitation, etc.) are witnessed all over the word. However, which factor dominates winter wheat production in the middle and lower reaches of the Yangtze River remains unresolved. Quantifying the key limiting meteorological factor could deepen our understanding of the impact of climate change on crops and then help us to formulate disaster prevention and mitigation measures. However, the relative role of precipitation, sunshine hours and maximum daily temperature in limiting winter wheat yield in the middle and lower reaches of the Yangtze River is not clear and difficult to decouple. In this study, we used statistical methods to quantify the effect of precipitation, maximum temperature and sunshine hours extremes on winter wheat (Triticum aestivum L.) yield based on long time-series, county-level yield data and a daily meteorological dataset. According to the winter wheat growing season period (October of the sowing year to May of the following year), anomaly values of cumulative precipitation, average sunshine hours and average daily maximum temperature are calculated. With the range of −3 σ to 3 σ of anomaly and an interval of 0.5 σ (σ is the corresponding standard deviation of cumulative precipitation, mean maximum temperature and mean sunshine hours, respectively), the corresponding weighted yield loss ratio (WYLR) represents the impact of this kind of climate condition on yield. The results show that excessive rainfall is the key limiting meteorological factor that can reduce winter wheat yield to −18.4% in the middle and lower reaches of the Yangtze River, while it is only −0.24% in extreme dry conditions. Moreover, yield loss under extreme temperature and sunshine hours are negligible (−0.66% for extremely long sunshine hours and −8.29% for extreme cold). More detailed analysis results show that the impact of excessive rainfall on winter wheat yield varies regionally, as it causes severe yield reductions in the Huai River basin and the middle to southern part with low elevation and rainy areas of the study area, while for drier areas in the Hubei province, there is even an increase in yield. Our results disclosed with observational evidence that excessive precipitation is the key meteorological limiting factor leading to the reduction in winter wheat yield in the middle and lower reaches of the Yangtze River. The knowledge of the possible impact of climate change on winter wheat yield in the study area allows policy-makers, agronomists and economists to better forecast a plan that differs from the past. In addition, our results emphasized the need for better understanding and further process-based model simulation of the excessive rainfall impact on crop yield.

1. Introduction

Increasing frequency of extreme climate is likely to occur due to continued warming of the climate, including extremes of precipitation and temperature [1,2]. There are indications that areas now suffering from drought may become more arid, while areas suffering from excessive rainfall may see more precipitation [3,4,5,6,7]. In the context of the rapid increase in the global population, quantitative assessment of the impact of climate change on crop production is of great significance to ensure a stable supply of food [8,9]. A large number of studies have shown that climate extremes related to temperature and precipitation, such as heat, cold and drought, could severely reduce crop production from regional to global scale [10,11,12,13,14,15,16,17,18]. Adverse weather conditions will further exacerbate the gap between the rapidly increasing population and the limited food supply. Therefore, it is necessary to understand the sensitivity and tolerance of existing agricultural systems to extreme climates [19].
Recent studies on extreme climates have focused on the effects of extreme temperatures [16,20,21,22,23] and drought [15,24,25] on crop production, while few studies have focused on the impact of excessive rainfall [13]. Winter wheat is one of the main food crops worldwide, especially in China, where 20% of the world′s population lives on 7% of the land. In addition, according to the official statistics, drought, hailstorms, cold and waterlogging are the main agro-meteorological disasters restricting agricultural production in China (Figure S1), especially in the middle and lower reaches of the Yangtze River (Figure S2), which is one of the most important commodities gaining planting area. Taking Jiangsu province as an example, studies have shown that there will be a major drought or flood every 2–3 years, and there will be 4–5 times of waterlogging caused by continuous rain in spring every year [26]. However, which one is the key meteorological limiting factor and how much does precipitation, sunshine hour and temperature affect winter wheat yield in the middle and lower reaches of the Yangtze River leaves a critical knowledge gap, which may impede our ability to understand and evaluate the climate change effects on crop production.
Generally speaking, the impact of extreme events on crop yield at the regional, national or global scale could be quantified by empirical-based [18,27,28] or crop model methods [24,29,30,31]. Process-based crop models could reveal the dynamic growth of crops with input of soil data, crop management data, meteorological data and so on. The impact of extreme events on crop yield could be simulated with excessive precipitation [31] or higher temperature [32]. In addition, decoupling the effect of one extreme from another is available. Many studies have adopted the physical-based crop model to quantify the effect of climate extremes [13,15,20,33,34], because we can change the temperature, precipitation or CO2 content simultaneously or sequentially in the crop model, and the corresponding yield or biomass reduction could be obtained. This method was widely used because it clearly shows the effect of single or combined factors on crops. Moreover, it could simulate the potential impact of climate change on crop yield in the future. However, crop models are also limited by significant disadvantages, such as too many parameters, complex parameter optimization processes and ill-posed problems. More importantly, the existing crop models consider more the impact of water deficit or nutrient restriction, while few models take into account the impact of excessive precipitation on crop growth and yield. Therefore, when the crop model was adopted to simulate the impact of excessive precipitation, it is often unable to accurately estimate or even give the opposite results, compared with the statistical data [13]. The same phenomenon also exists in studies that simulate the impact of other extreme climates on yield [34]. Compared with physical-based methods, the statistical method is simpler and more straightforward, although it is region-specific and when considering its application to another region, it may not be appropriate. For the sake of being straightforward and simple and limited by the dataset we could collect, the empirical model was selected.
In order to explore the key limiting factors that affect winter wheat yield and the extent to which each environmental factor contributed to the reduction in winter wheat yield in the middle and lower reaches of the Yangtze River, in this study, observational evidence from long time-series meteorological data and county-level winter wheat yield and area data to explore the key meteorological limiting factors of winter wheat yield in the middle and lower reaches of the Yangtze River. A binning method was employed to decouple the combined effect of precipitation, sunshine hours and maximum temperature on winter wheat yield. At the same time, we explore the spatial pattern of the extremes of key factor impacts on winter wheat yield.

2. Study Area and Data
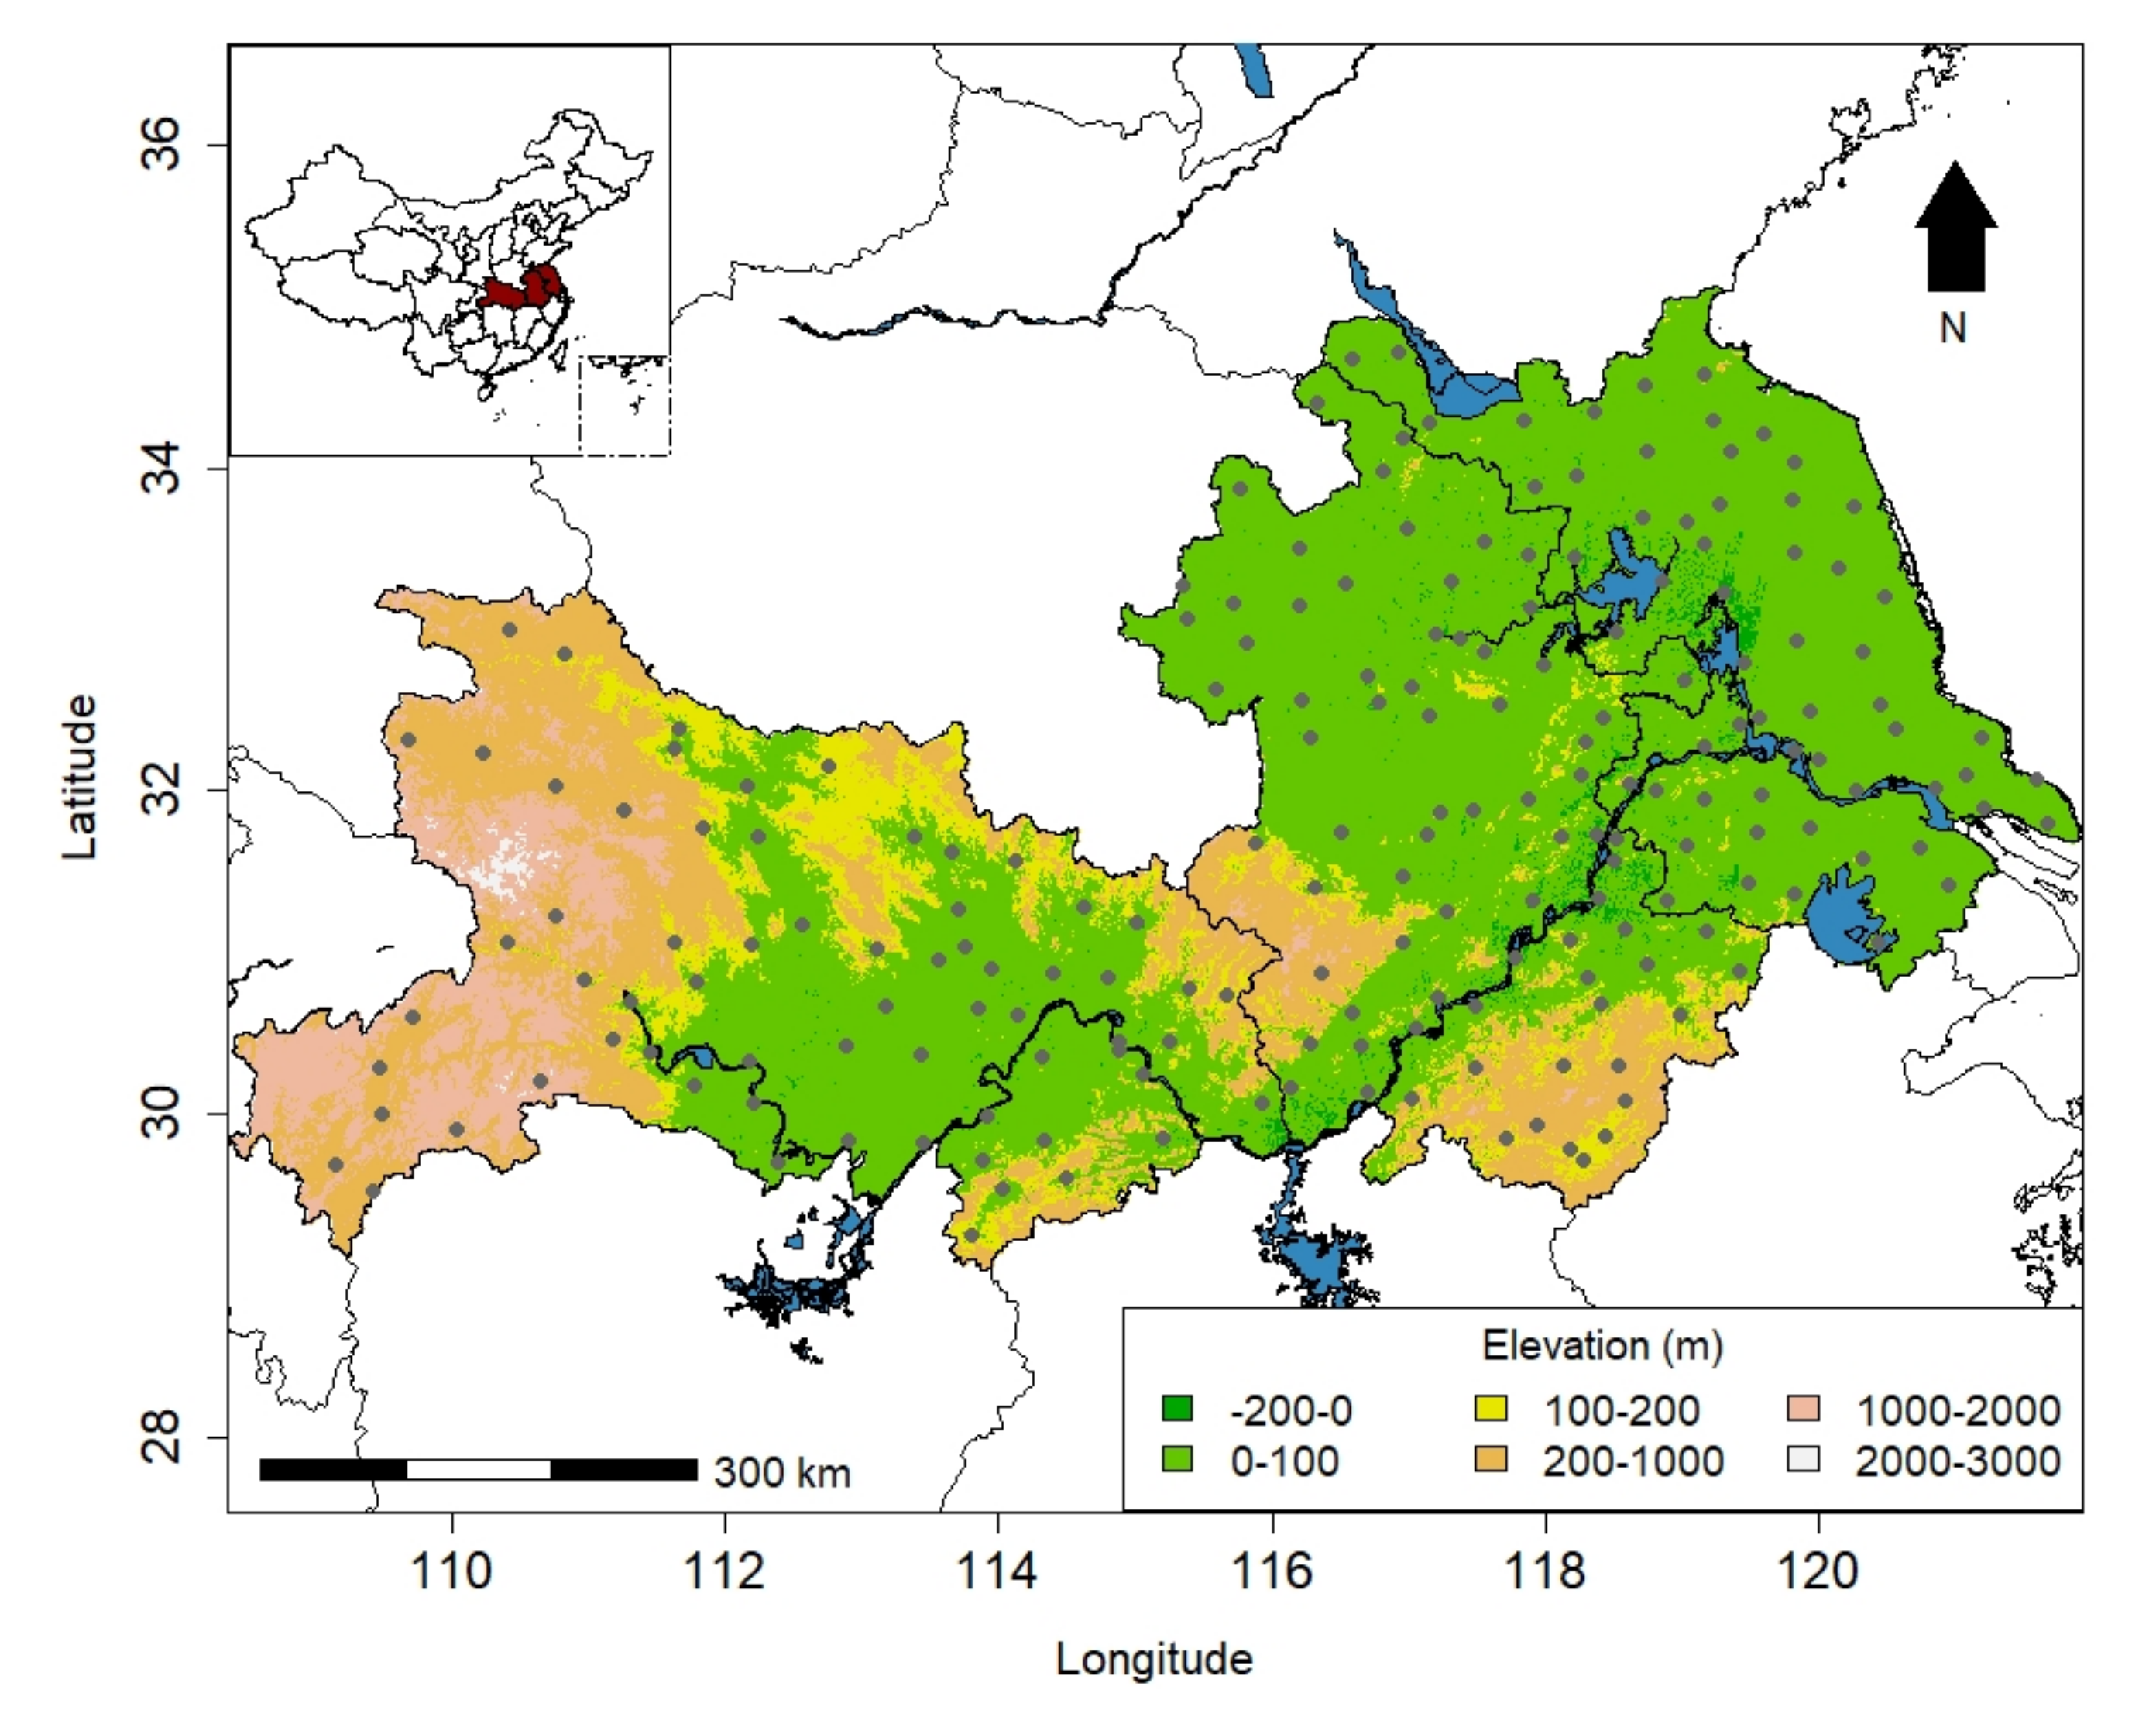
2.1. Study Area

The study area includes Jiangsu, Anhui and Hubei province in the middle and lower reaches of the Yangtze River (Figure 1), with an average annual temperature between 13.6 °C and 18 °C. The climate in this area is complex, including a temperate monsoon climate in the north of the Huai River and semi-humid and subtropical humid monsoon climate in the area south of the Huai River. As for the elevation, there are large mountains with higher elevation in the western part of Hubei province and the southern part of Anhui province, while the northern and eastern areas are at a lower elevation. The main cropping system in the northern part of our study area is the winter wheat–summer maize (Zea mays L.) rotation, whereas a winter wheat/rapeseed (Brassica napus L.)–rice (Oryza sativa L.) rotation is widely employed in southern part. Generally, winter wheat is planted in October (after harvest of corn or paddy rice) and harvested around the end of May. Five winter wheat developmental stages are widely recognized according to Feekes Scale [35], including tillering (1–5), stem extension (6–10), heading (10.1–10.5), flowering (10.51–10.54) and ripening (11.1–11.4).

2.2. Data

2.2.1. Climate Data

The meteorological data used in this study came from the Anhui Meteorological Information Center (AMIC), the Jiangsu Meteorological Information Centre (JMIC) and the Hubei Meteorological Information and Technology Support Centre (HMITSC), including 203 national-level meteorological stations. The data included daily precipitation, sunshine hours, maximum temperature, minimum temperature, and average temperature. The information of meteorological stations and winter wheat yield data are given in Table 1.

2.2.2. Winter Wheat Yield Data

County-level yield and planting area data were also provided by AMIC, HMITSC and JMIC. Both yield and meteorological data were required for each county in order to explore the impact of excessive precipitation on yield. A total of 203 stations (county) met the requirements (Table 1).

3. Methodology

3.1. Winter Wheat Yield Data Processing

With improved technology, winter wheat yield has gradually increased in recent decades (Figure S3), which was mainly due to improved varieties, increasing fertilizer inputs, field management advances, improved irrigation practices, etc. Since the main object of this study was to find the key meteorological factors that restrict winter wheat yield, it was necessary to remove the contribution of anthropogenic factors to yield change, especially from technological advances. Therefore, a 5-year moving window was used to obtain the yield trend, representing the “optimal” yield at current practices without unfavorable climate effects.

3.2. Statistical Analysis

3.2.1. Extreme Climate Conditions Definition

Climate is the average weather conditions over a long period (typically more than 30 years) in a given area. Sunshine hours, precipitation and temperature are part of the most related meteorological factors that influence crops. In this study, we used the standard anomaly (M, Equation (1)) to quantify the departure degree of climate in a given year ( C i ) to its mean climate condition ( C ¯ ), defined by standard deviation ( σ ). Taking precipitation for example, the molecular of Equation (2) is defined as precipitation anomaly, and standard anomaly is the precipitation anomaly with a unit of σ .
M = C i C ¯ σ
The standard anomaly of winter wheat growing season’s total precipitation, mean sunshine hours and mean maximum temperature were calculated using Equation (1). When the precipitation anomaly was lower than −2.0 σ, extreme dry (drought) was determined, while when it is greater than 2.0 σ, extreme wet (excessive rainfall) was defined. In addition, moderate dry and moderate wet conditions were also defined as precipitation anomaly greater than −2.0 σ and lower than 2.0 σ respectively (Figure S4). It was the same for maximum temperature and sunshine hours extremes definition.

3.2.2. Quantify the Effect of Extreme Climate on Winter Wheat Yield

The impact of climate extremes on yield could be quantified by comparing observed yield in extreme year with the expected yield from the long-term trend of yield change (5-year moving window in this study). More specifically, the difference of observed ( y i e l d o b e ) and expected yield ( y i e l d t r e ) in an extreme year was obtained (also named as meteorological yield), which was closed related with climate variability. Then, the meteorological yield was divided by the y i e l d t r e , which gives the yield loss ratio (YLR, Equation (2)), which could quantitatively reflect the deviation of yield in extreme year to the long-term yield trend for each county.
Y L R = y i e l d o b s y i e l d t r e y i e l d t r e × 100 %
According to Equation (2), the yield loss ratio for every county–year sample could be obtained. Taking precipitation for example, the impact of extreme dry and extreme wet conditions on winter wheat yield at the regional scale could be quantified by aggregating all the county–year samples with extreme drought and excessive rainfall conditions (M ≤ −2 and ≥2.0 respectively), weighted by the corresponding county–year sample′s planting area (weighted yield loss ratio, WYLR). Similarly, yield response to precipitation viability, from extreme dry to extreme wet conditions, could be calculated by aggregating all county–year samples that fall into the precipitation anomaly bins with an interval of 0.5   σ , and then it was weighted by the corresponding planting area of each county–year sample. Similarly, the average response of yield to sunshine hours and maximum temperature, as the WYLR across each standard anomaly bin, were obtained.

4. Results

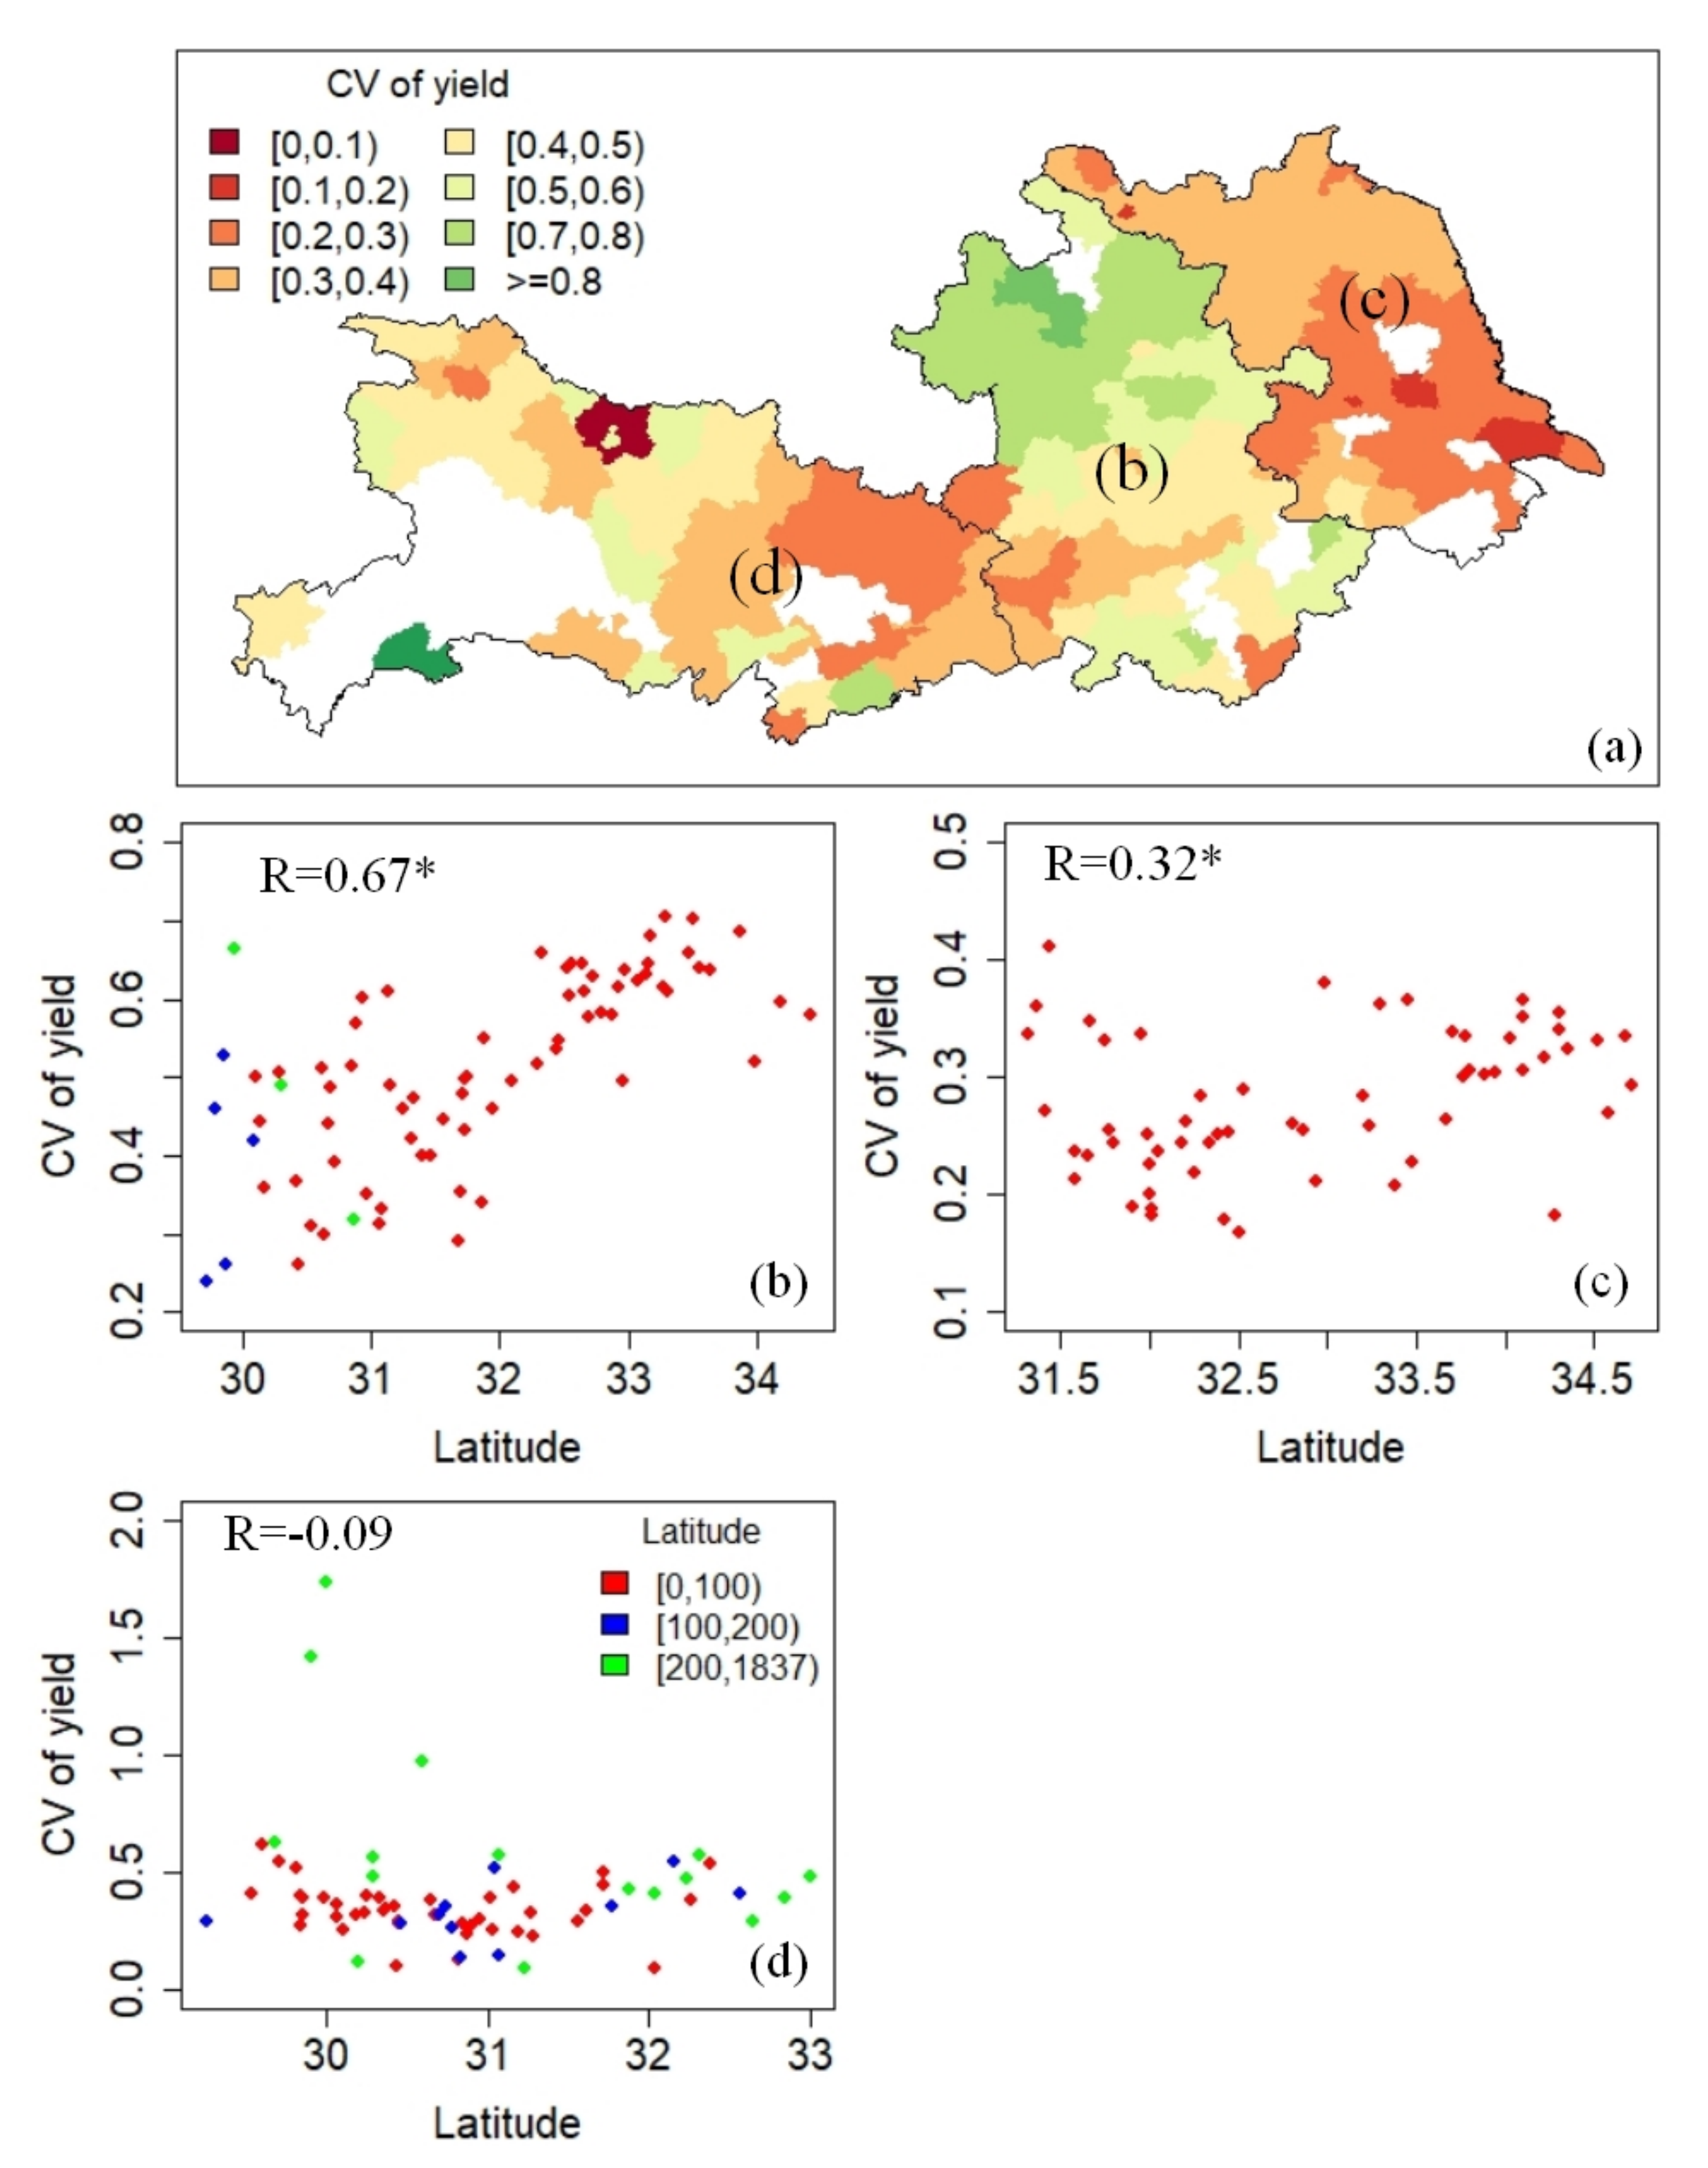
4.1. Spatial–Temporal Pattern of Winter Wheat Yield

During the past several decades, the annual winter wheat yield of Anhui, Jiangsu and Hubei province in the middle and lower reaches of Yangtze River have steadily increased (Figure S3). Spatial distribution of coefficient of variability (CV) of yield over time was given in Figure 2a. In general, the yield variability in the southern regions of Anhui and Jiangsu is smaller than that in the northern part, while the plain in Hubei province has the lower CV of yield. More specifically, the CV of yield is lower in middle and south of Jiangsu, the riverside plain of Anhui province and the plain area of Hubei province, while north Jiangsu, north of the Huai River of Anhui, shows higher variability. Meanwhile, yield variability in Anhui province with a mean CV yield value of 0.51, which is higher than that of Jiangsu and Hubei with 0.28 and 0.44, respectively. A strong positive correlation of between the CV of yield and latitude was observed, especially in Anhui (Figure 2b) and Jiangsu (Figure 2c), where yield variability is higher in the northern part of the main winter wheat-producing areas.

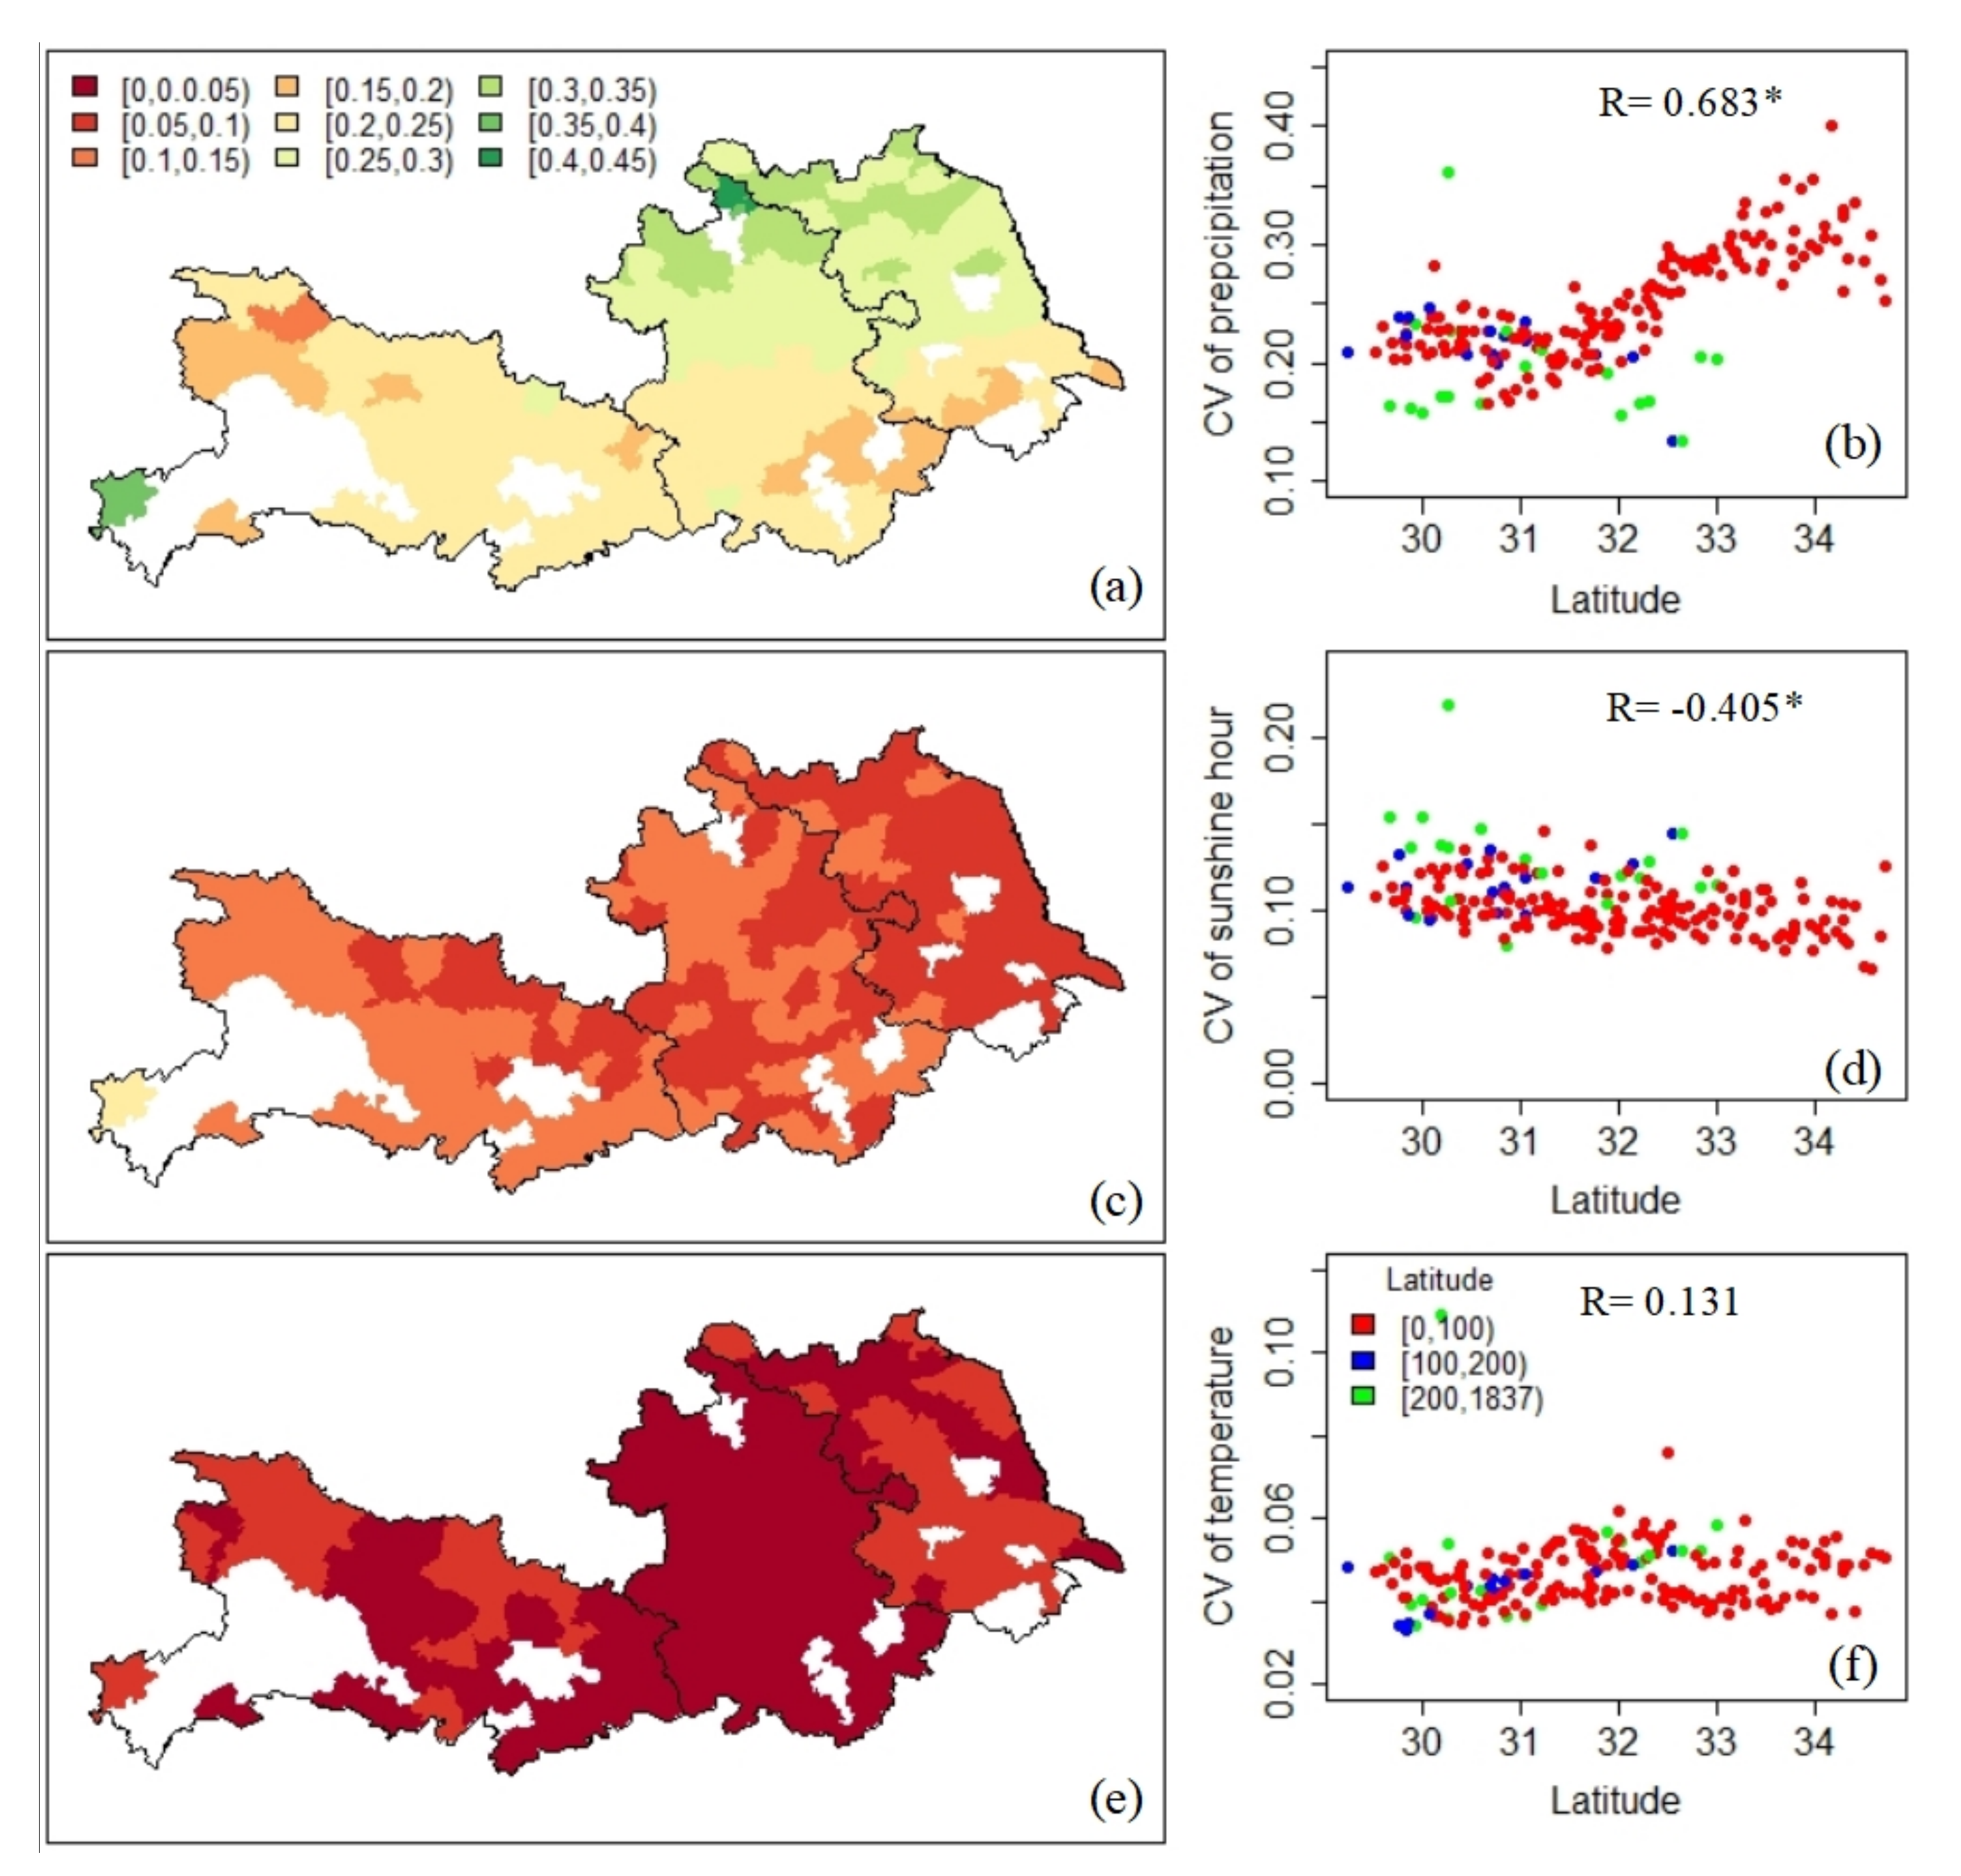
4.2. Spatial–Temporal Pattern of Climate Factors

The variability of total precipitation, mean sunshine hours and mean maximum temperature across the growing season for each county were calculated. Additionally, the spatial pattern of CV for the three climate factors is shown in Figure 3. We could see that precipitation variability across the winter wheat growing season is higher than that of sunshine hours and maximum temperature, with a range of CV between 0.1 and 0.4, while it is lower than 0.15 and 0.1 for sunshine hours and maximum temperature, respectively. Specifically, for the CV of precipitation, we find a strong increasing CV trend and the highest precipitation variability was observed north of the Anhui and Jiangsu province, whereas most of Hubei province and the middle to south part of Anhui and Jiangsu had a lower CV of precipitation (Figure 3b). The spatial pattern of sunshine hours (Figure 3a) shows that variability is higher in areas with lower latitudes and is decreased significantly with increased latitude. The CV of the maximum temperature is lowest compared with sunshine hours and precipitation, with most counties being lower than 0.1. Moreover, there is no significant correlation between the variability of maximum temperature and latitude (Figure 3f).

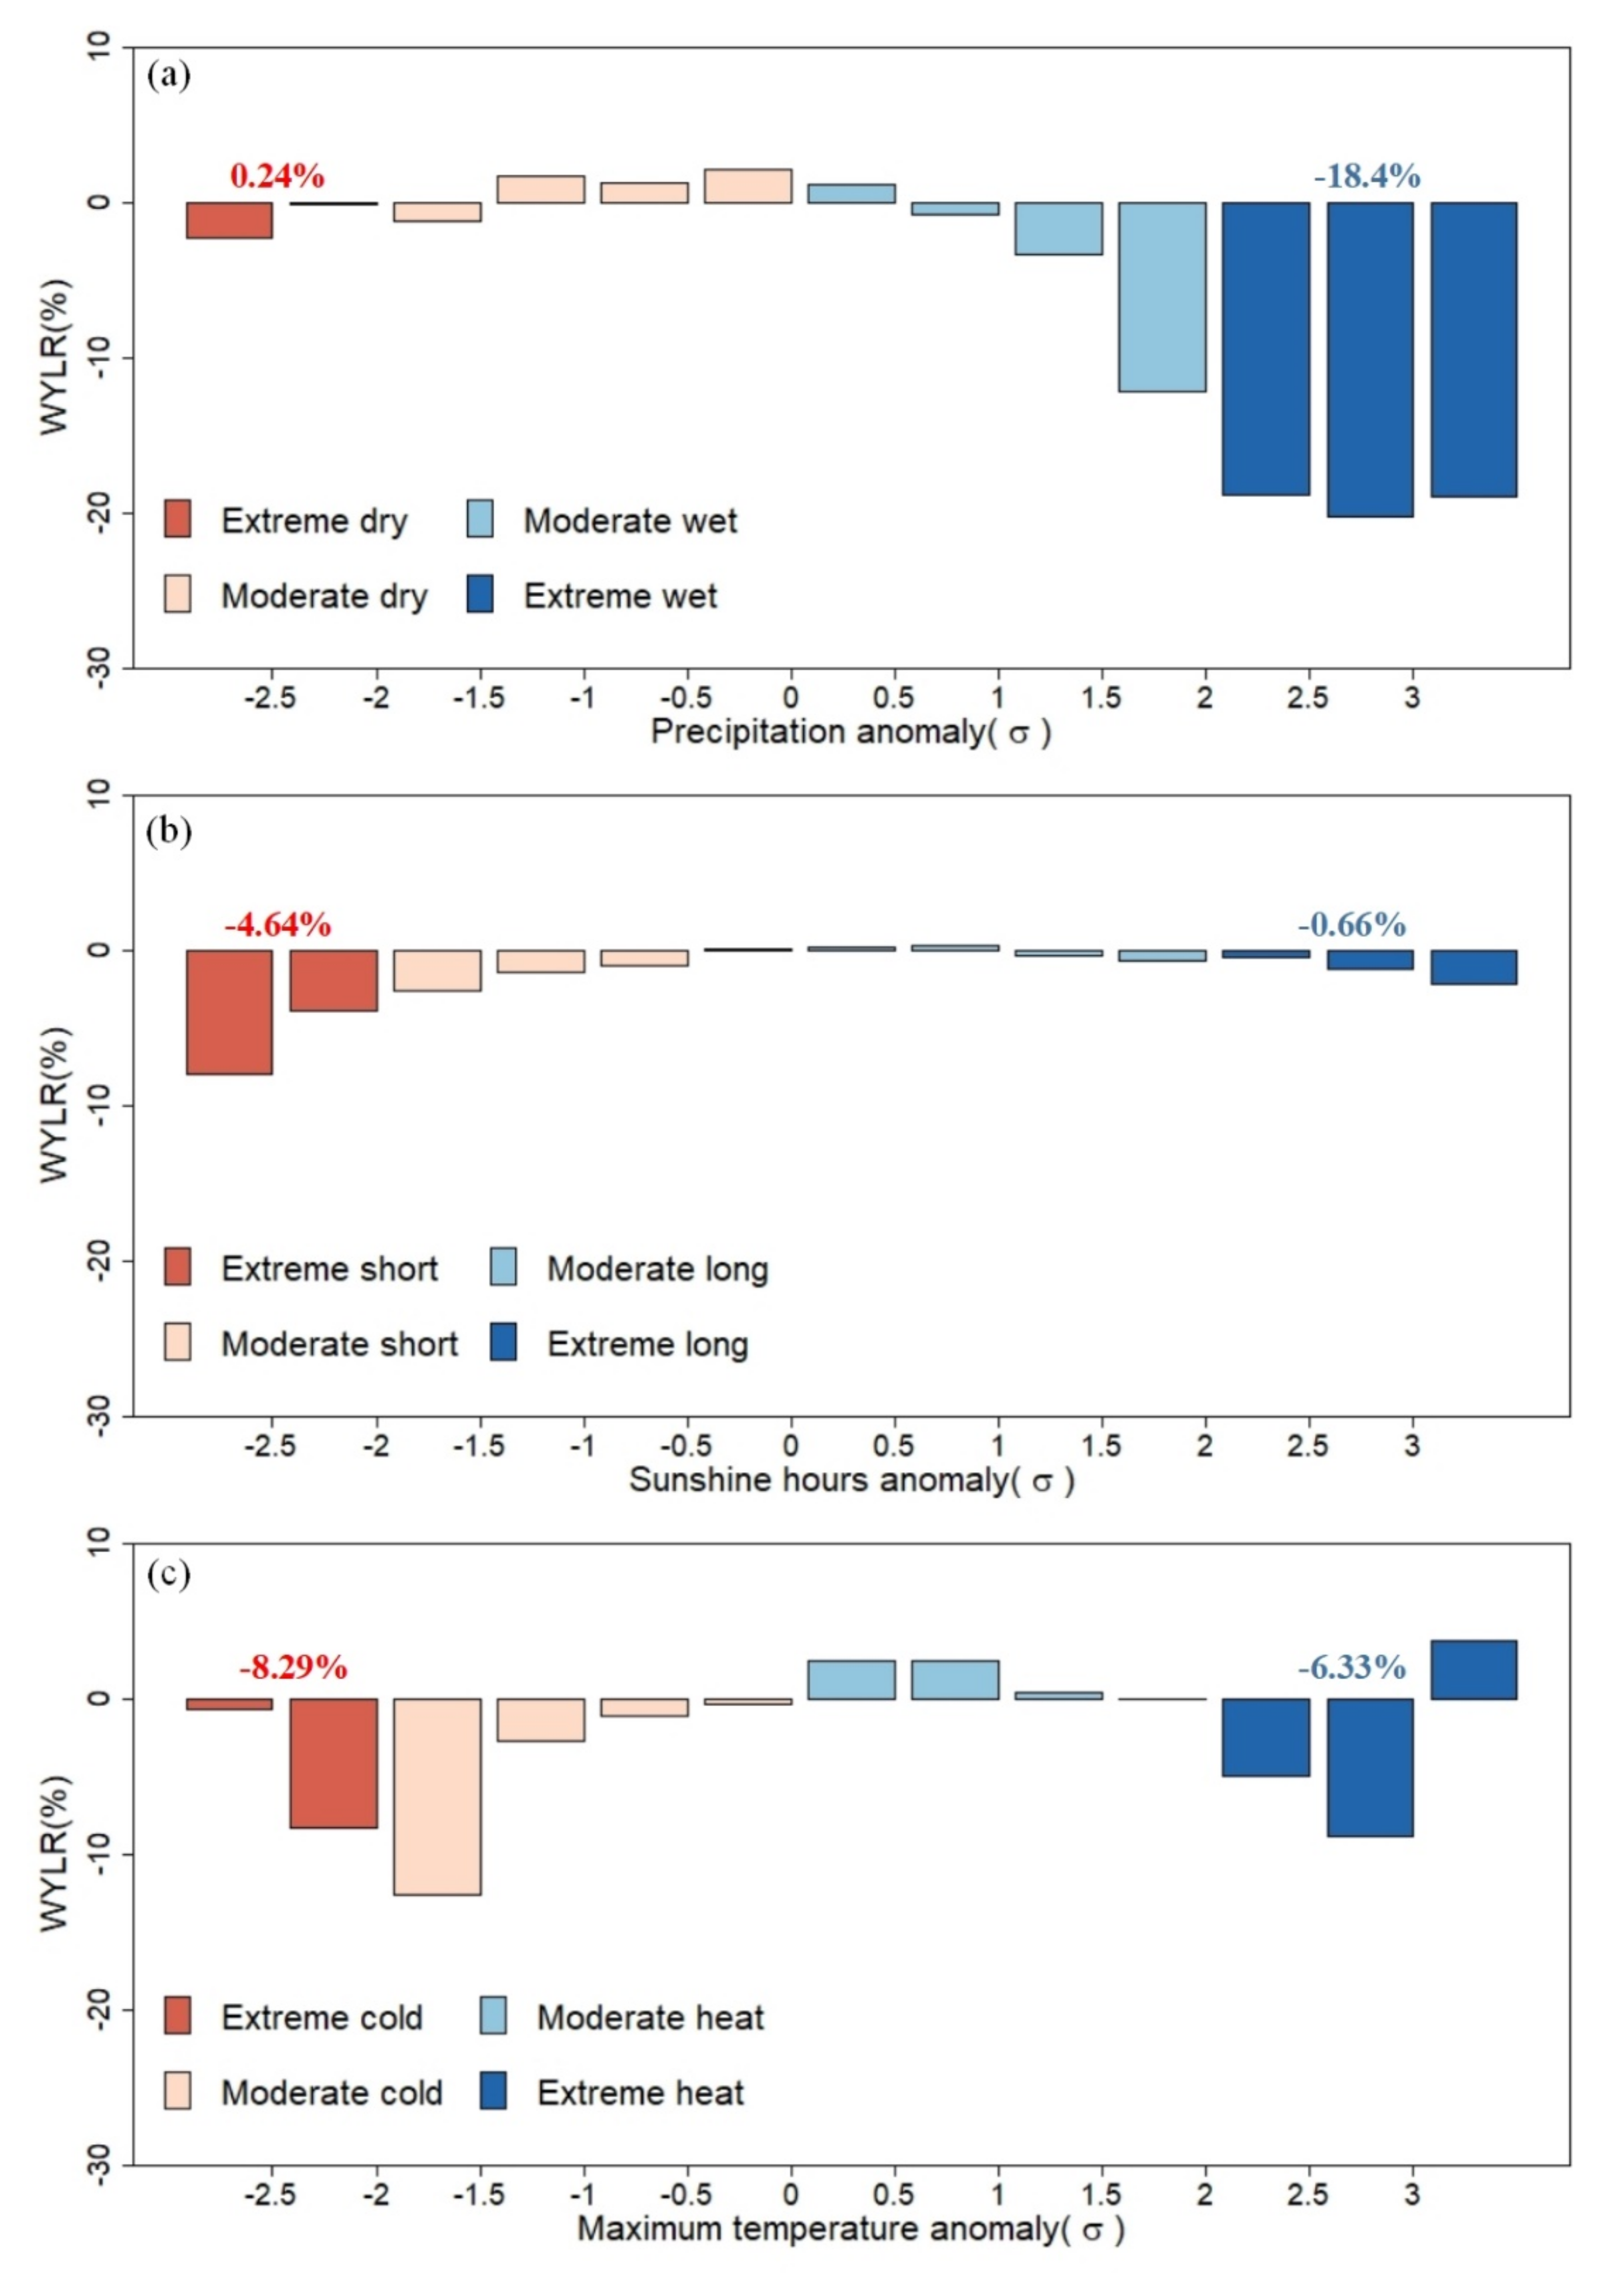
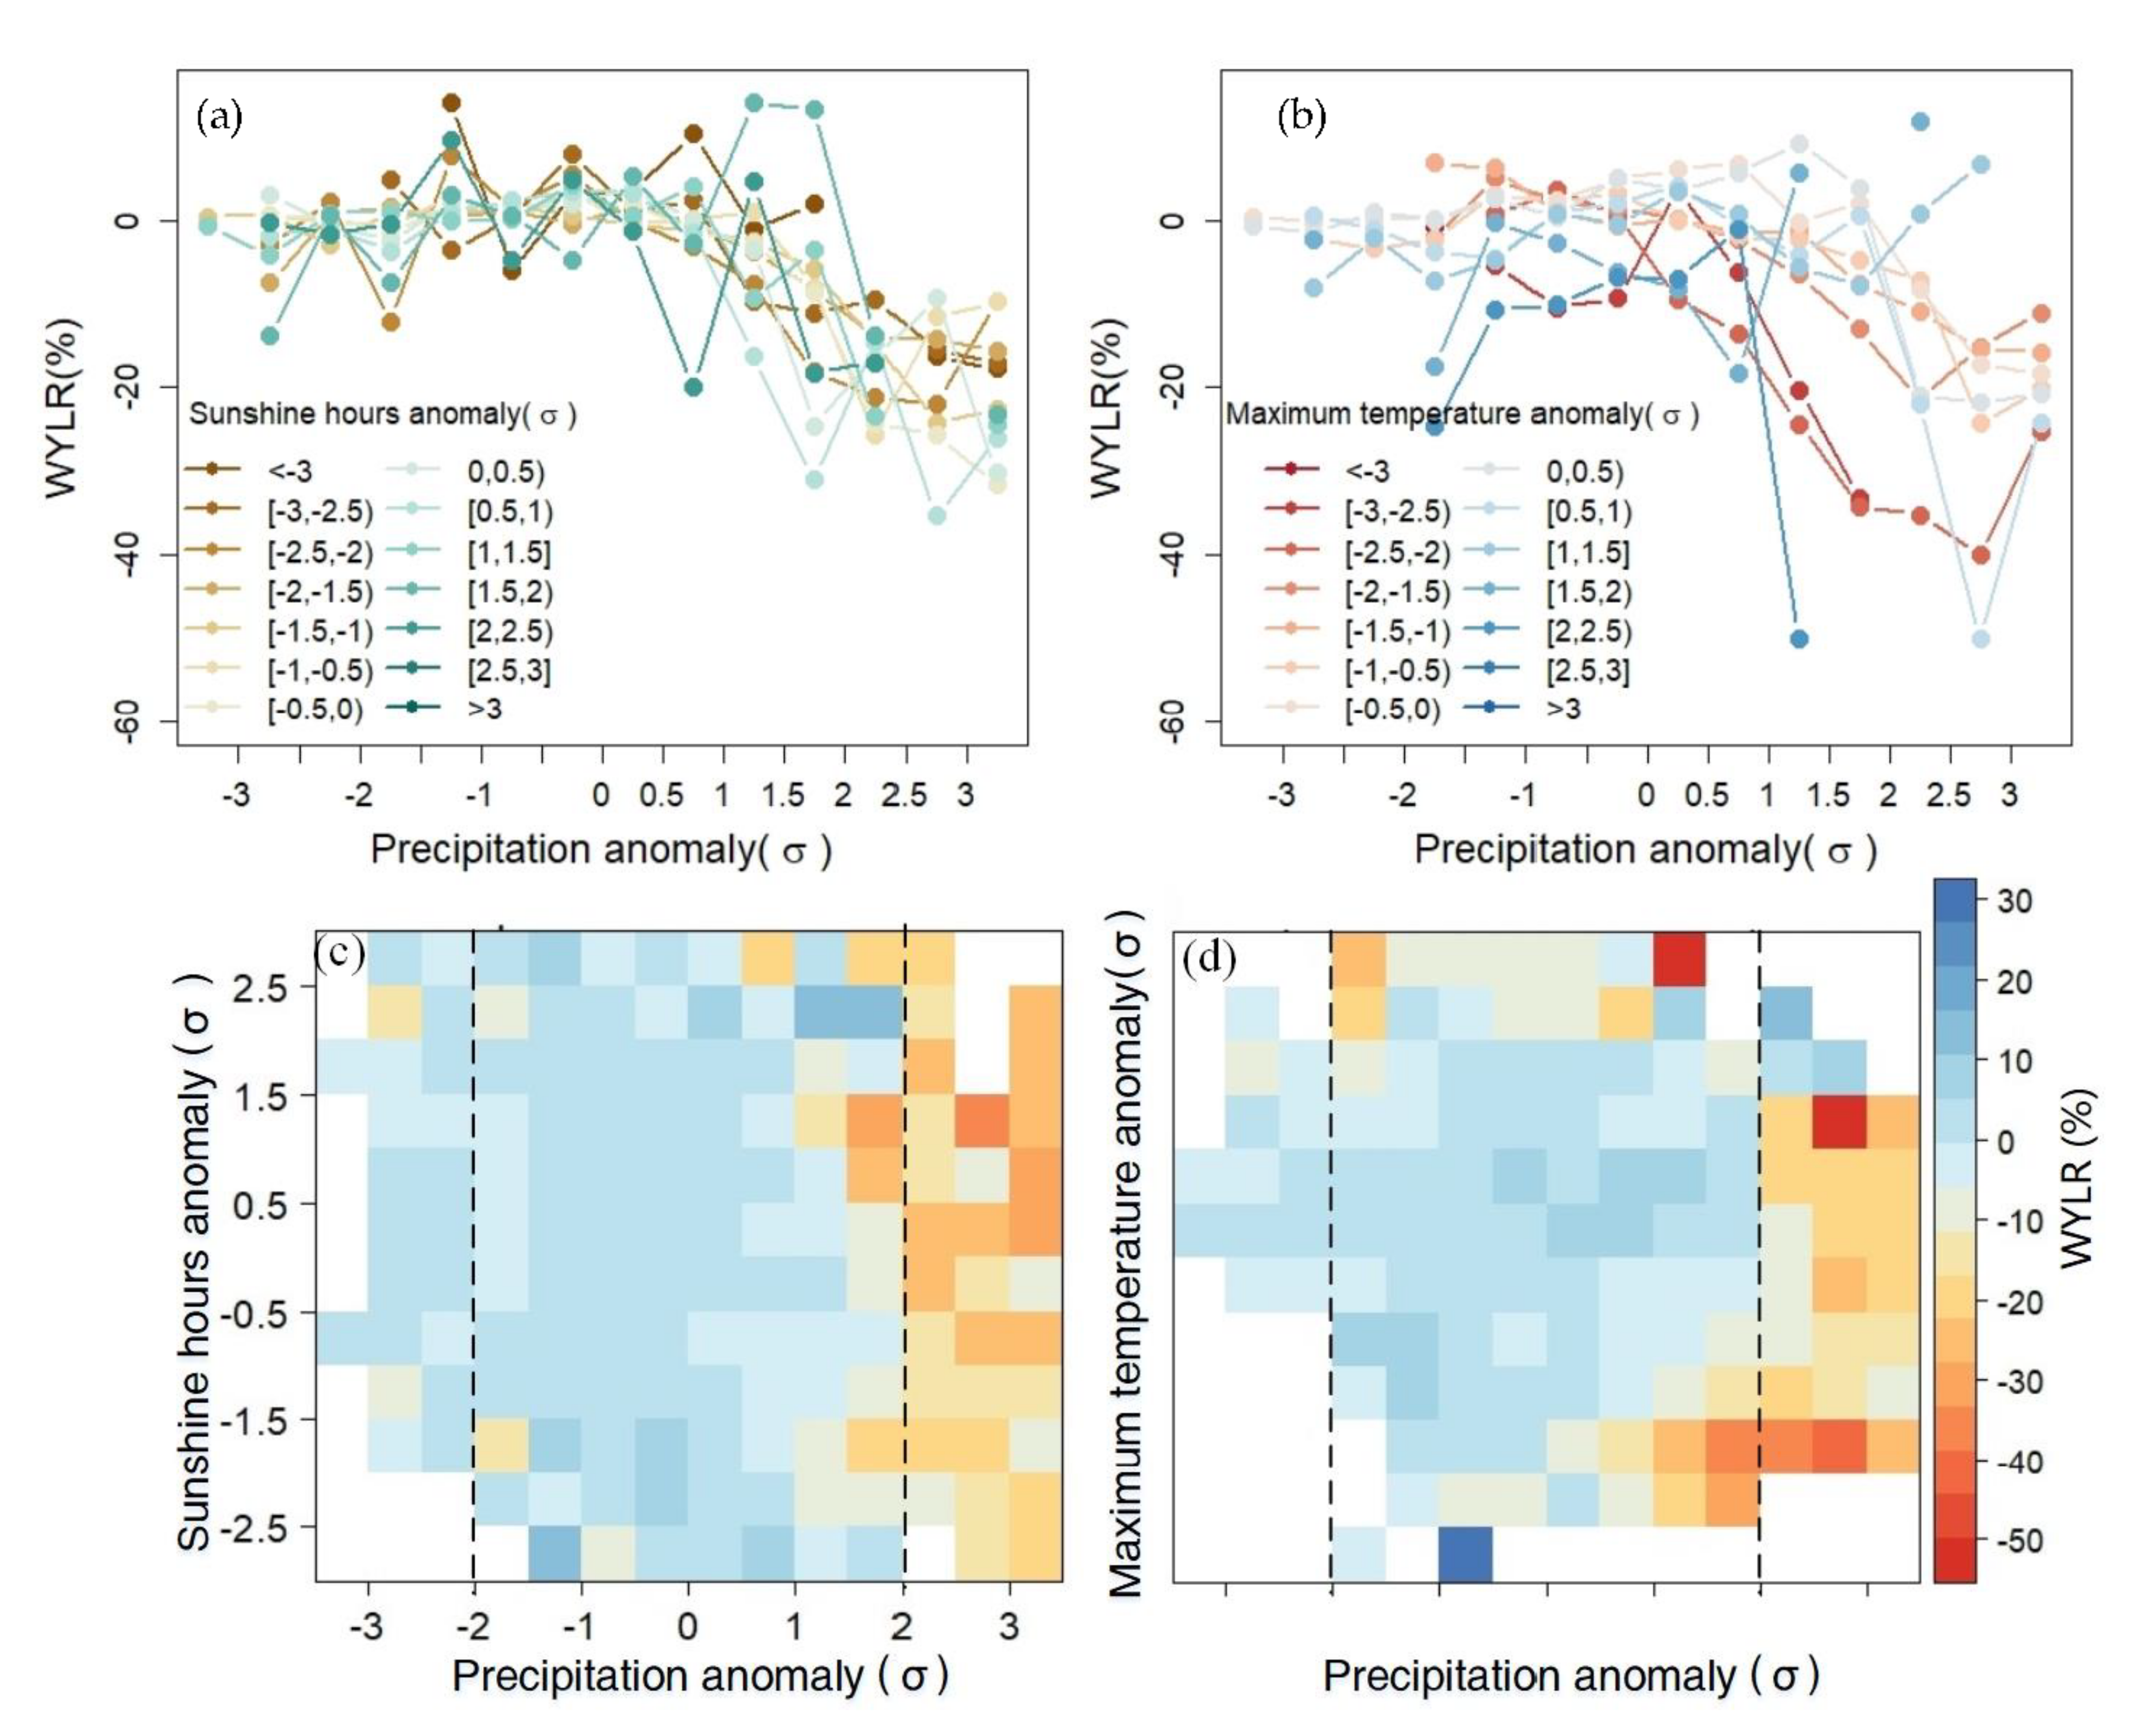
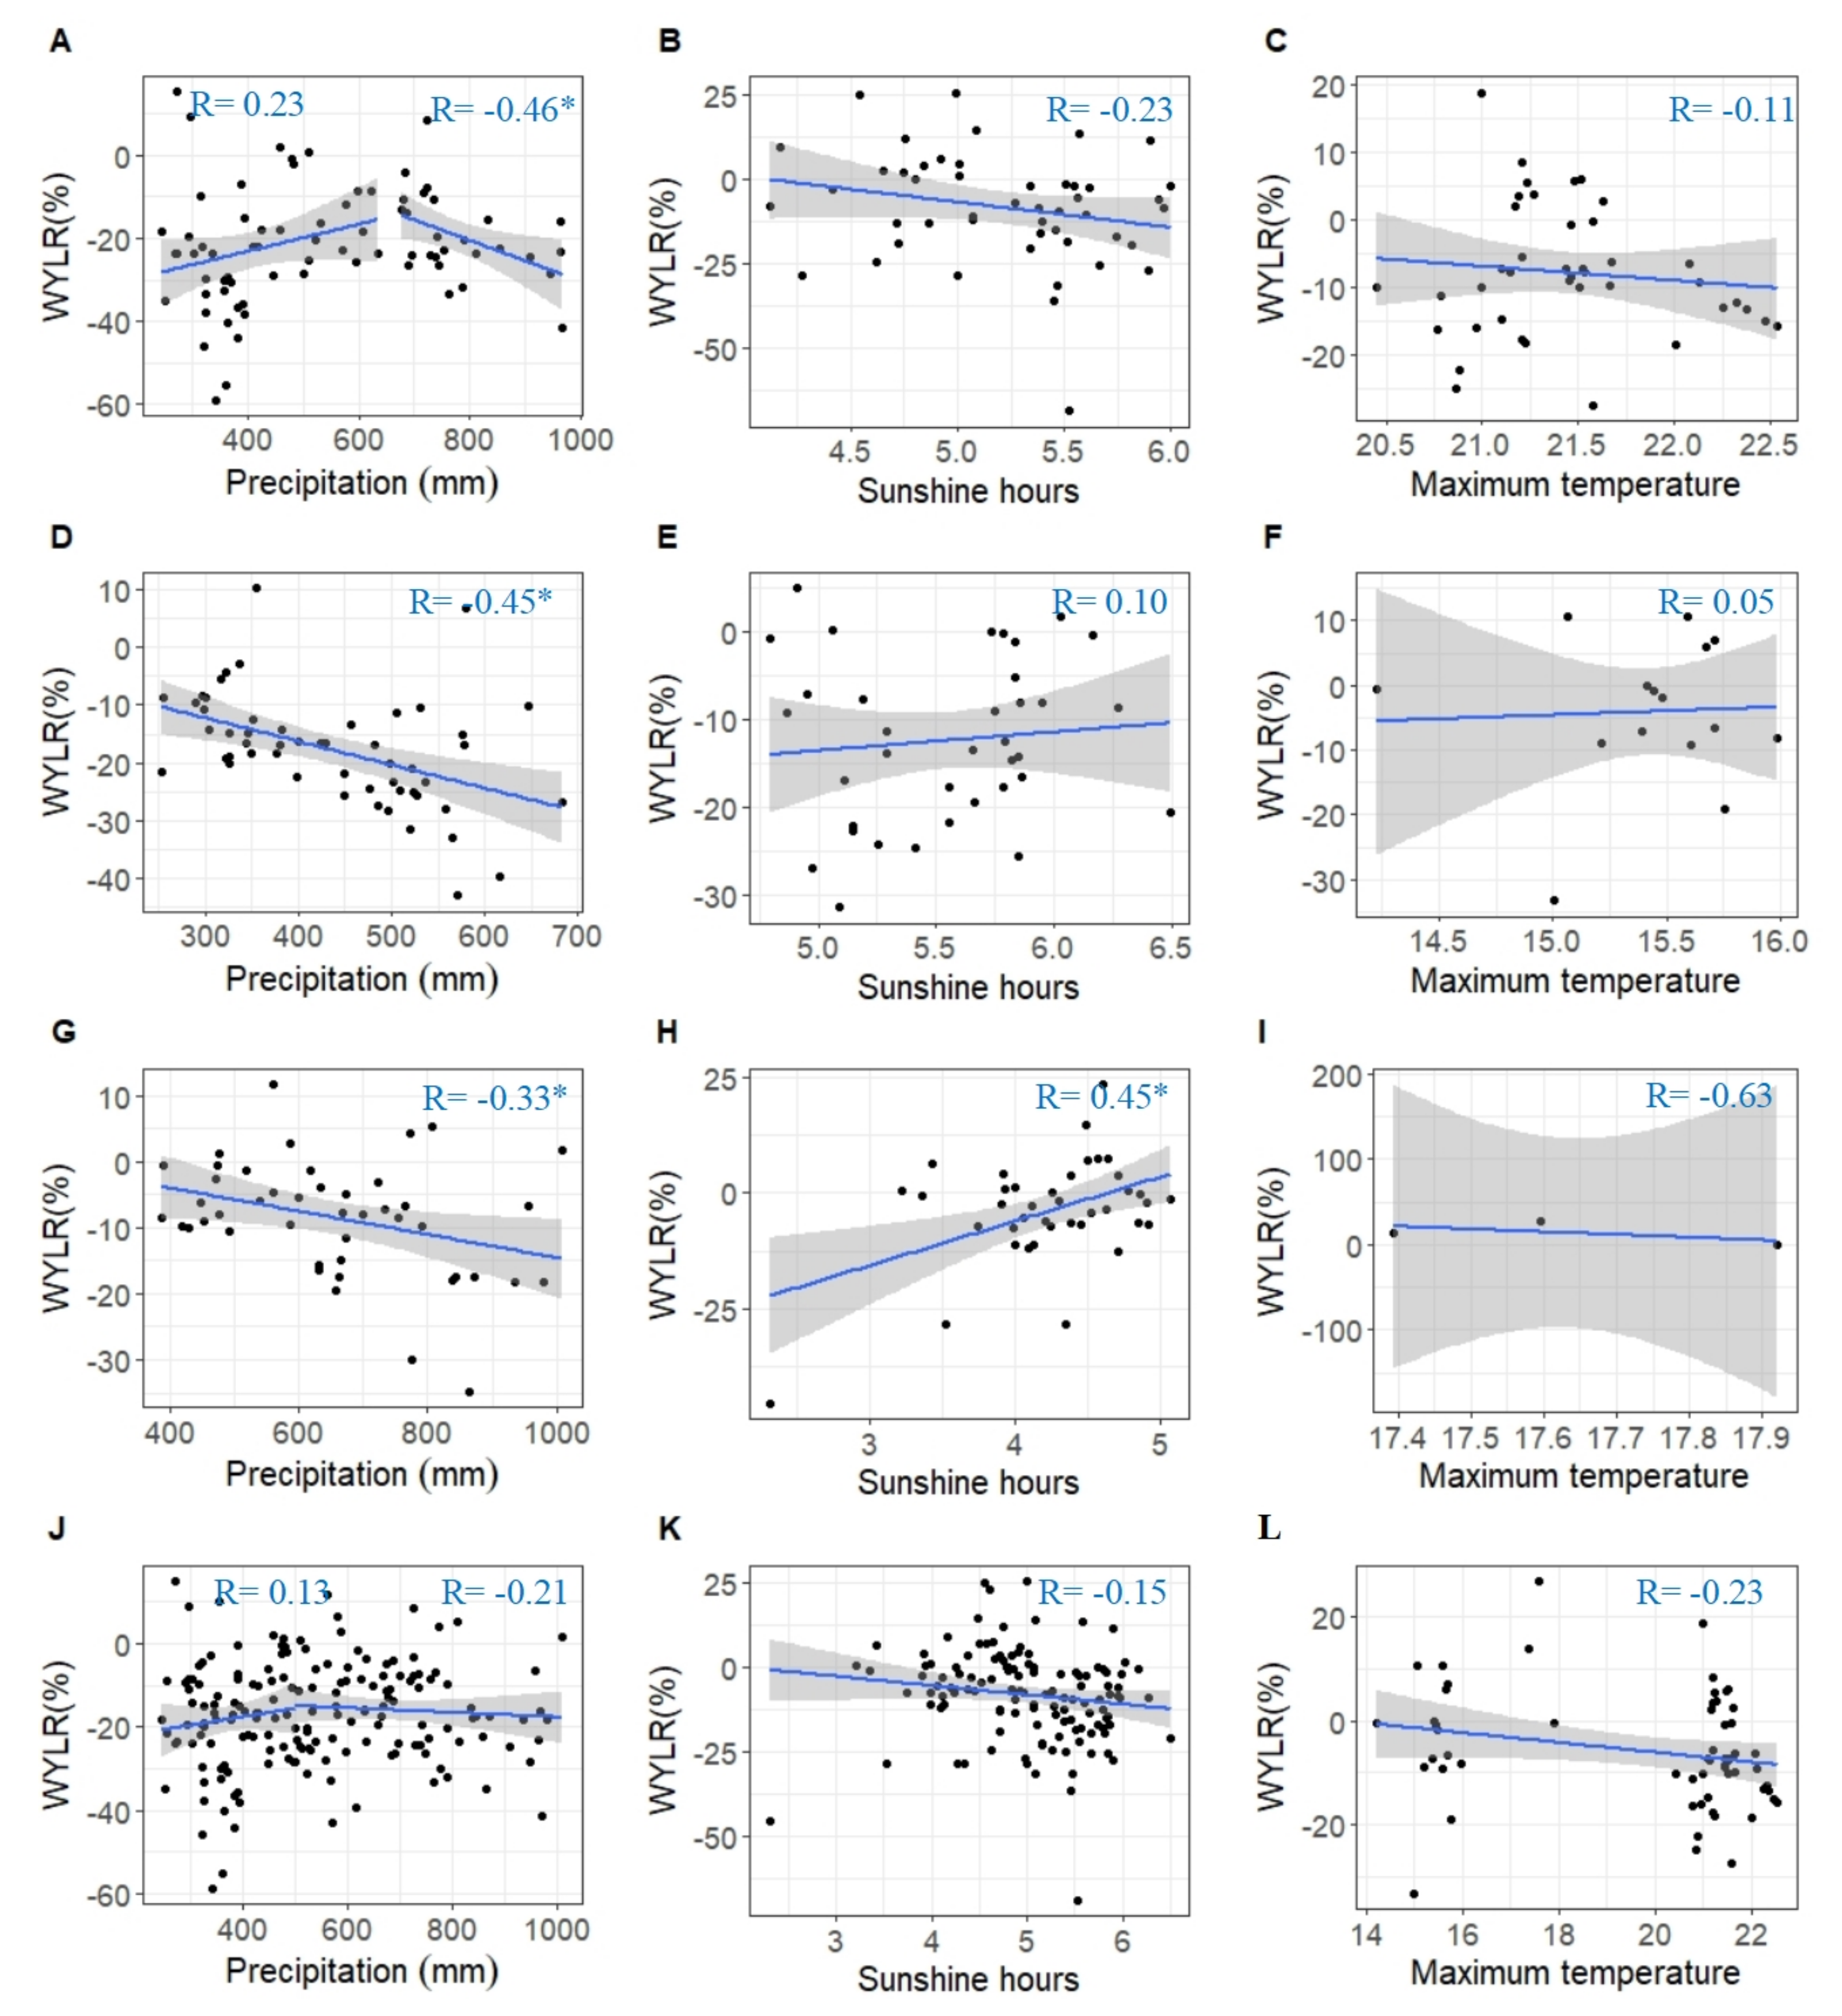
4.3. The Impact of Extreme Climate on Yield

Figure 4 shows the response of winter wheat yield to extreme climate, represented by precipitation, sunshine hours and maximum temperature, ranging from normal to extreme conditions over the decades in the middle to lower reaches of the Yangtze River. The aggregated weighted yield loss ratio was calculated from county–year samples, with climate factor anomalies falling into the extreme intervals (≥2.0 σ or ≤−2.0 σ), reflecting the impact of extreme climate. Similarly, the impact of climate anomaly gradient with an interval of 0.5 σ on yield were also obtained. The results show that positive WYLR was observed when precipitation anomaly ranged from −1.5 σ to 0.5 σ, which means the favorable precipitation condition for winter wheat in our study area is slightly drier than the multi-year average (Figure 4a). However, as the precipitation condition deviates from normal to extreme dry and extreme wet, the positive trend diminished and was replaced by almost zero and −18.4% of WYLR in extreme dry and extreme wet conditions, respectively.
Further analysis of sunshine hours anomaly (Figure 4b) shows short sunshine hours could result in more yield loss than in longer sunshine hours. Additionally, further, when the standard anomaly of sunshine hours gradually decreases from 1 to −2.5, the WYLR gradually decreases, and when standard anomaly is less than −2.5, the reduction in yield is the most (WYLR = −8%). On the other hand, when the standard anomaly of sunshine hours gradually increases from one, the WYLR gradually decreases, but the minimum does not exceed −5%.
As for the maximum temperature (Figure 4c), both extreme heat and extreme cold could inhibit winter wheat yield, with a WYLR of −6.33% and −8.29%, respectively. When the maximum temperature anomaly is in transition from the moderate cold to the extreme cold (from −2 σ to −1.5 σ), winter wheat yield loss is, on average, −12.6%.
In order to separate the effect of excessive rainfall on yield reduction from that of sunshine hours and maximum temperature, we disentangle the respective effects of the three meteorological factors in limiting the yield reduction by exploiting the fact that each meteorological ingredient is decoupled in different bins (Figure 5). We assumed that if the excessive rainfall is the key limiting factor for winter wheat, the corresponding yield reduction in excessive precipitation will be large regardless of sunshine hours or maximum temperature variations, and vice versa. However, when looking at the variation in WYLR across sunshine hours (Figure 5a) and maximum temperature bins (Figure 5b), excessive rainfall reduces yield reduction noticeably in sunshine hours and maximum temperature bins. This shows that extreme sunshine hours or extreme maximum temperature does not limit the yield reduction in the absence of a precipitation–sunshine hours or precipitation–maximum temperature coupling effect. Put another way, the sunshine hours or maximum temperature limitation on yield is largely the product of precipitation–sunshine hours or precipitation–maximum temperature coupling effect. The respective effect of sunshine hours (Figure 5c), and maximum temperature (Figure 5d) on the yield reduction effect of precipitation also illustrated the same results.

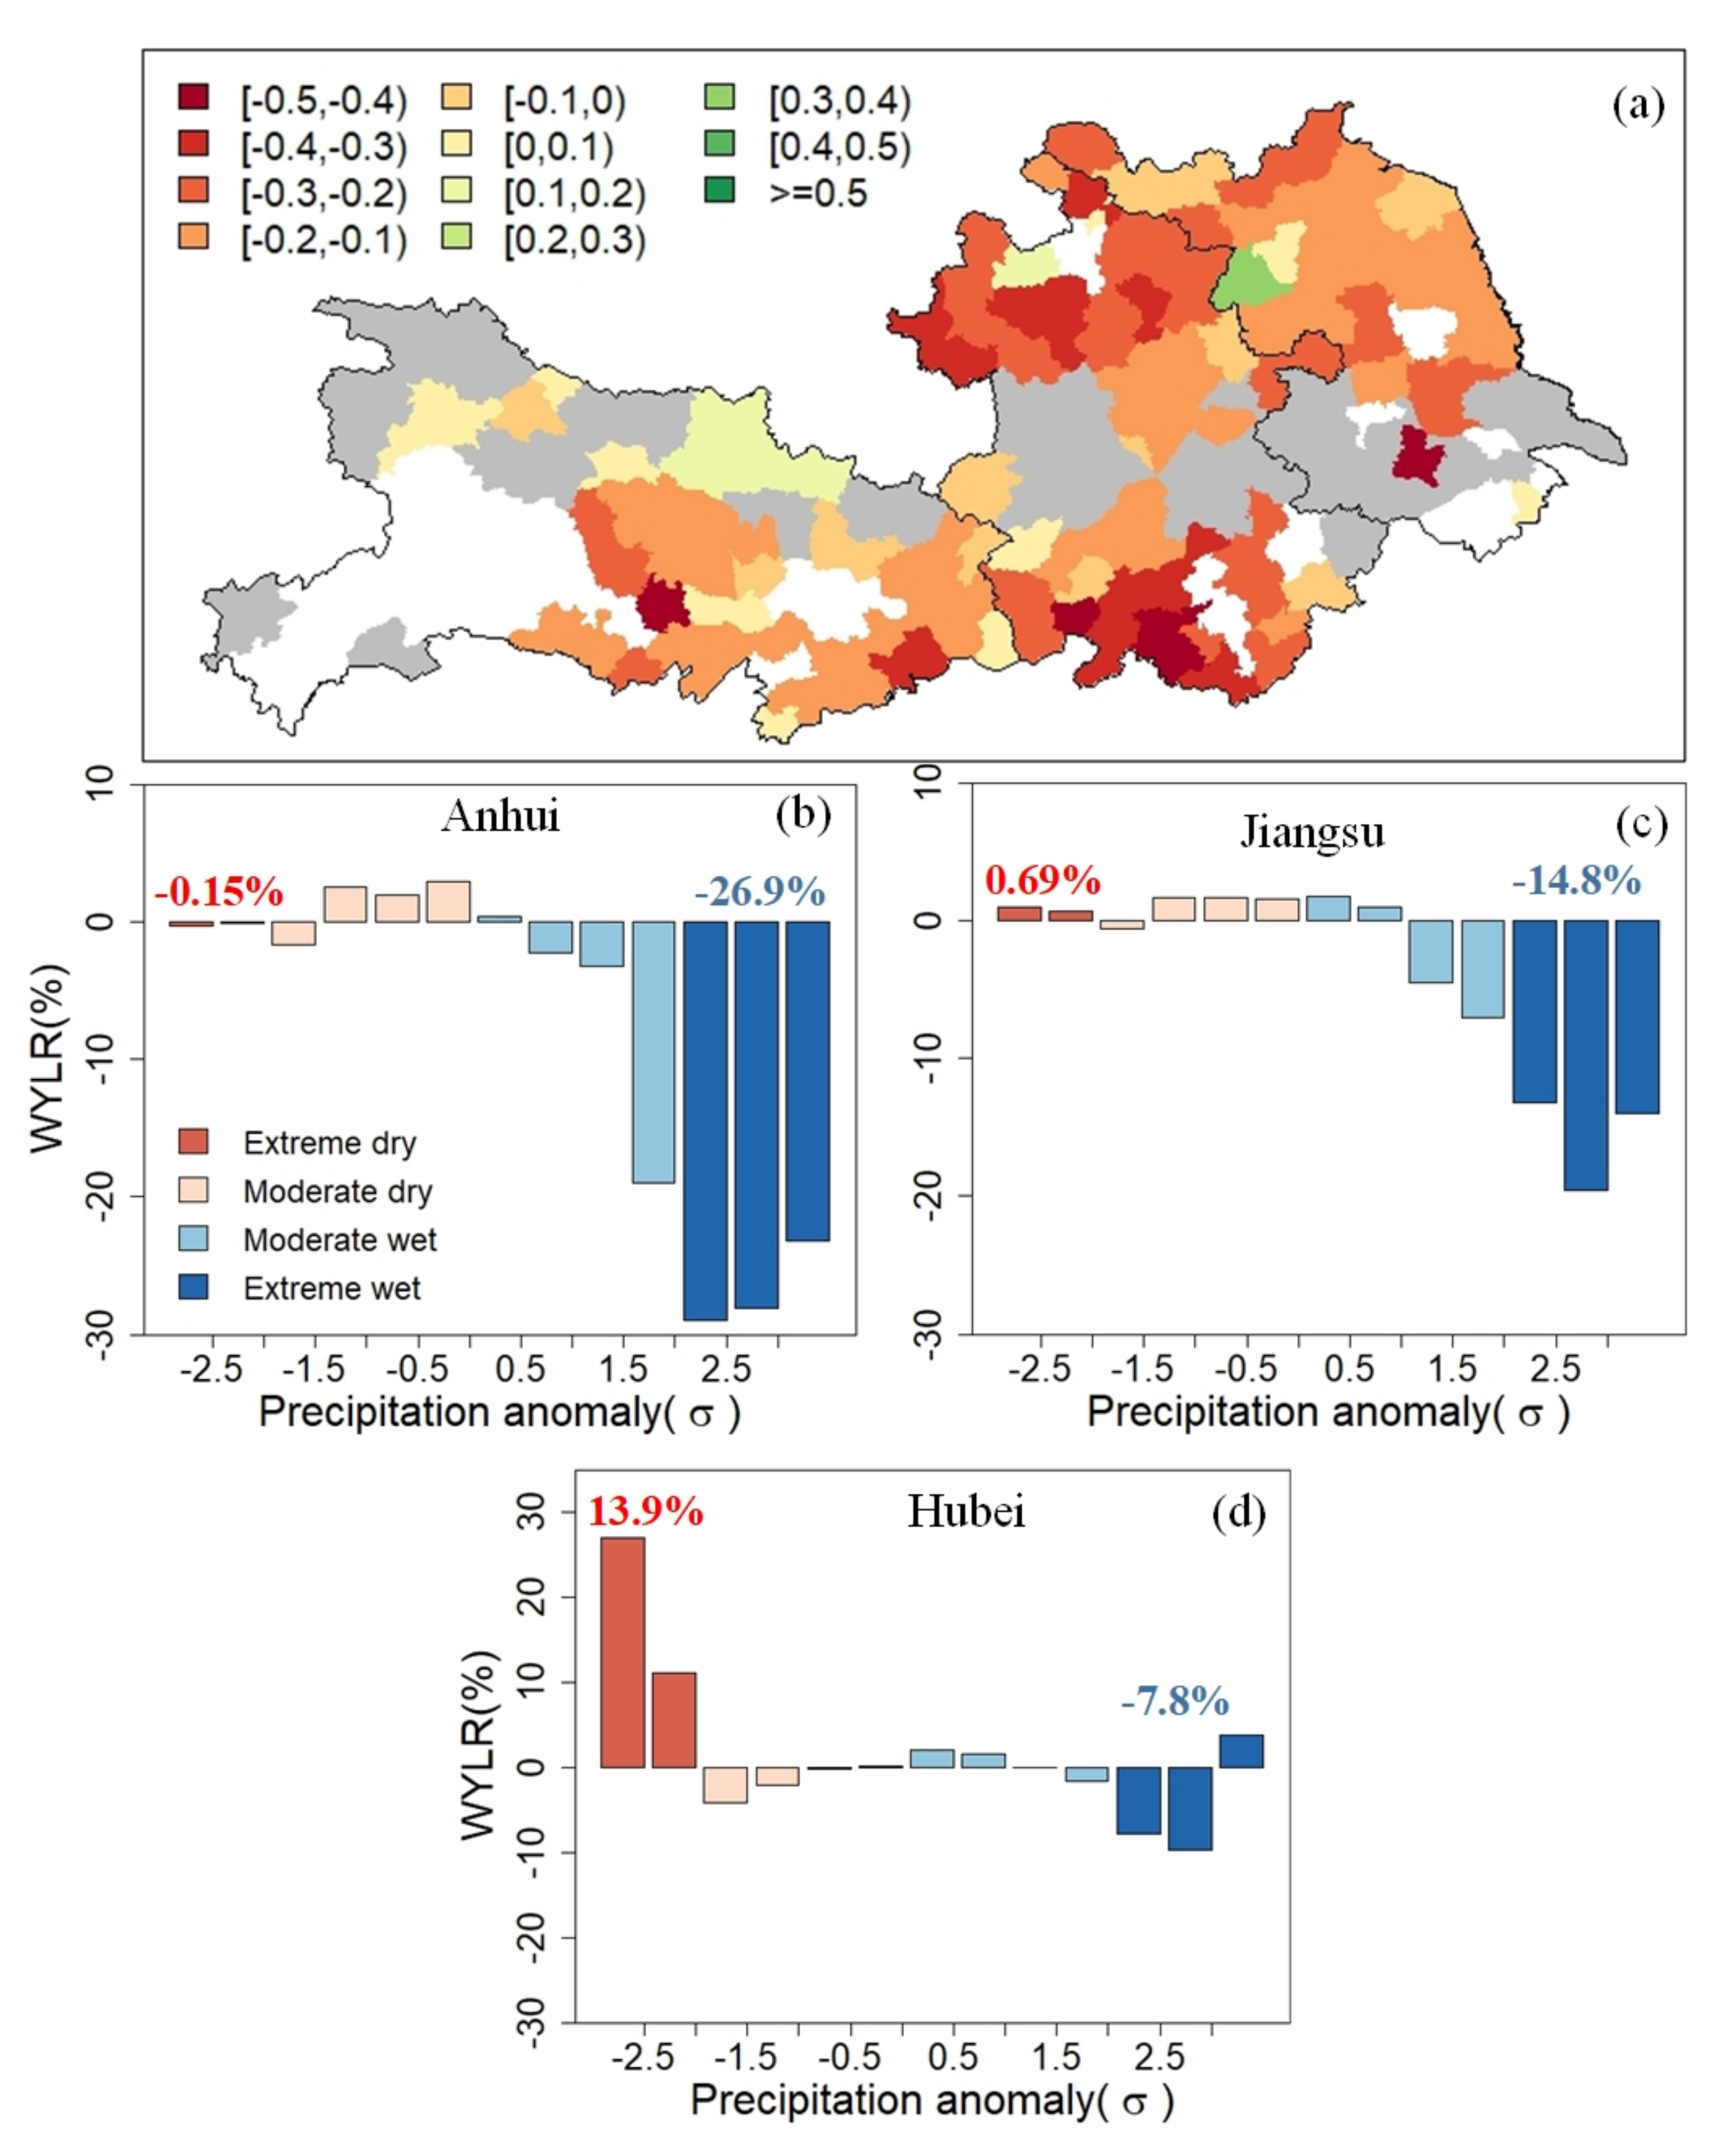
4.4. Spatial Pattern of Excessive Rainfall Impacts

The regional pattern of the impact of extreme wet conditions on winter wheat yield is shown in Figure 6a. We could see that the yield response to extreme wet condition could be negative or positive across space. Among them, 89% of counties showed yield reductions in years with excessive rainfall, while there are no extreme wet year samples in the middle of Anhui, south of Jiangsu and north of Hubei province (gray area in Figure 6a). Spatially, the most negatively affected areas are located in southern Anhui, north of the Huai River, most of the Jiangsu province, and southeast of Hubei province. In contrast, counties north of Hubei showed a positive effect even when the precipitation anomaly exceeds 2.0   σ .The average yield reduction in extreme wet years ranges from −26.9% (Anhui) to −7.8% (Hubei), while that of extreme drought is between 13.9% (Hubei) to –0.15% (Anhui). Anhui province was severely influenced by extreme wet, with a −26.9% reduction in yield, larger than that of counties in the whole study area (−18.4%). That means the positive effect of extreme wet in some counties could offset the negative effect of it in other counties. Counties in Jiangsu province also experienced serious damage from extreme wet (Figure 6c), but compared with Anhui province, yield reduction is slightly lower (−14.8%). Yield reduction caused by extreme drought in Anhui and Jiangsu was negligible, with a WYLR of −0.15% and 0.69%, respectively. Hubei province is the only one in our study area where increased yield was caused by extreme drought.

5. Discussion

5.1. The Reason for Spatial Variability of Meteorological Factors Impact on Winter Wheat Yield

Climate refers to the average physical condition of the atmosphere for many years in a certain area, such as annual average temperature and annual precipitation. Therefore, this section mainly discusses the spatial variation in excessive precipitation (precipitation anomaly 2.0   σ )’s impact on yield considering the local mean climate. Figure 7 shows the relationship between the mean climate conditions (total precipitation, mean sunshine hours and mean maximum temperature) and the corresponding WYLR of each station (county) in the extreme wet years. The results show that the impact of winter wheat yield reduction is mainly related to precipitation (−0.46 *, −0.45 * and −0.33 * for Anhui, Jiangsu and Hubei province, respectively) and, to a lesser extent, regulated by sunshine hours (−0.23, −0.10, and 0.45 *) for Anhui, Jiangsu and Hubei province, respectively. Excessive precipitation will cause a lot of yield reduction in areas with more precipitation (significant negative correlation between precipitation and WYLR in wet year). It has been proven that the positive effect of longer sunshine hours on winter wheat yield would be negated by excessive rainfall during the early seeding stage [36]. However, it has been proven that it is the maximum temperature, not precipitation that has the strongest explanation of the maize yield reduction in extreme wet years of the United States [37]. One possible reason may be that in the humid and semi-humid regions of southeast China, rain-fed agriculture dominates. As a result, there is already too much precipitation in this area for winter wheat, and excessive rainfall further aggravated yield reduction [19,38]. In addition to the excessive rainfall, the low altitude and shallow groundwater level keep the soil water content at a high level throughout the year [39]. Therefore, the more precipitation, the greater the soil water content, the more serious the damage caused by waterlogging damage, and finally the more yield reduction. In Hubei province, however, it is worth noting that for areas with small precipitation within the growing season, the corresponding WYLR is greater than 0 even with extremely dry conditions (Figure 7G). This may be because Hubei province is located inland, and drought has a greater impact on winter wheat in this area [40]. Therefore, when the rainfall is excessive, it may just make up for the water deficit in crop growth. In addition to that, short sunshine hours also play an important role in extreme wet years in Hubei province to compensate for the negative effect of excessive rainfall, while that is not obvious in Anhui and Jiangsu.
In addition to discussing the impact of extreme wet on yield at a provincial scale, we also analyzed the relationship between them of all stations in the three provinces. The results showed that the correlation coefficient of the mean climate conditions did not pass the significance test. An important reason for that is that only the impact of meteorological elements was quantified, and we did not consider the influence of others, geographical and environmental (such as terrain, soil type, and soil moisture content), on yield. Another possible reason is that the relationship between the mean climate conditions and WYLR in each province is a little different, so it is difficult to use a unified law or model to quantify the relationship between them. In general, compared with sunshine hours and maximum temperature, precipitation is the key meteorological factor that limits winter wheat yield in the middle and lower reaches of the Yangtze River.

5.2. Future Research Directions: Monitoring of Waterlogging Damage Based on Daily Precipitation Data

The results of this study indicate that precipitation is the most important meteorological limiting factor affecting winter wheat yield, compared with sunshine hours and maximum temperature. Therefore, in the future, we will consider the waterlogging monitoring of winter wheat based on high-resolution remote sensing precipitation data. However, there may be some difficulties in monitoring waterlogging damage. Take drought as an example for comparison. Although drought and waterlogging are related to abnormal precipitation, the characteristics of the two are significantly different. Drought monitoring is a long-term monitoring process, because only a long period (3 months, 6 months and even 12 months) of precipitation deficit will lead to drought, so the existing drought index is mostly based on 1 month, 3 months, 6 months, 12 months or even 24 months [41]. The characteristics of waterlogging indicate that the time scale of its occurrence is much smaller than that of drought. In the middle and lower reaches of the Yangtze River, where the subtropical humid monsoon climate dominates, continuous rainy processes of more than 30 days are rare, let alone the occurrence of waterlogging at the scale of 3 or 6 months. On the other hand, the occurrence of waterlogging may only be caused by more precipitation in a certain week or ten-day period. The larger the time scale, the more the waterlogging signal will be offset by other normal or precipitation deficit signals. This leads to the time scale of waterlogging monitoring not being able to be too large or too small. In addition, the lower the time resolution of precipitation, the smaller the variability in precipitation in historical period and vice versa. In general, waterlogging monitoring based on precipitation is a potential future research direction.

6. Conclusions

In this study, we proved that, compared with sunshine hours and temperature, excessive precipitation is the key meteorological limiting factor and brought about a −7.8% to 26.8% reduction in winter wheat yield in the middle and lower reaches of the Yangtze River. The knowledge of the possible impact of climate change on winter wheat yield in the study area allows policymakers, agronomists and economists to better forecast a plan that differs from the past. However, these impacts varied substantially between regions and may also interact with other factors that are correlated with winter wheat growth. Therefore, a reinvigoration of national, and even global research is urgently needed, aiming to offset the possible impacts of climate change. In addition to that, historical data could only reveal what happened in the past and cannot predict the future. As a consequence, crop model simulation with possible future climate scenarios would reveal the possible risk of climate impact.

Supplementary Materials

The following supporting information can be downloaded at: https://www.mdpi.com/article/10.3390/agronomy12010050/s1, Figure S1: Areas of covered and affected by excessive rainfall, drought, hailstorm and cold from 1950 to 2019 in China (data source: National Bureau of Statistics of China, http://www.stats.gov.cn/); Figure S2 Areas of affected by excessive rainfall, drought, hailstorm and cold from 1978 to 2018 in Jiangsu (a), Anhui (b) and Hubei (c) province (data source: National Bureau of Statistics of China, http://www.stats.gov.cn/); Figure S3 boxplot of 203 counties from 1961 to 2014.The lower and upper box boundaries of the box plots in the inset figure indicate the 25th and 75th percentiles, the horizontal line within the box represents the median, and the lower and upper whiskers indicate the minimum and 1.5 times the interquartile range for the box; Figure S4 bar plot of sample size of different precipitation anomaly.

Author Contributions

Conceptualization, W.L. and J.H.; methodology, W.L., W.S. and R.H.; software, W.S.; validation, W.L. and W.S.; investigation, J.H.; data curation, H.W. and J.H.; writing—original draft preparation, W.L.; writing—review and editing, R.H.; visualization, W.S.; supervision, R.H.; funding acquisition, W.L. and R.H. All authors have read and agreed to the published version of the manuscript.

Funding

This research was funded by the National Natural Science Foundation of China (Grant No. 42101336, 42101364), the Special Fund for Industrial Scientific Research in the Public Interest (Meteorology) (Grant No.GYHY201406028), and the Zhejiang Provincial Natural Science Foundation (LQ21D010006).

Institutional Review Board Statement

Not applicable.

Informed Consent Statement

Not applicable.

Data Availability Statement

The data presented in this study are available on request from the corresponding author.

Acknowledgments

The authors would like to thank the AMIC, JMIC and HMITSC for providing precipitation data and yield data. We also appreciate the valuable advice from Shouye Liu, Lixia Wang, Yuanyuan Chen, Huaiyue Peng, Li Liu and Yanhong Huang.

Conflicts of Interest

The authors declare no conflict of interest.

References

  1. Prein, A.F.; Rasmussen, R.M.; Ikeda, K.; Liu, C.; Clark, M.P.; Holland, G.J. The future intensification of hourly precipitation extremes. Nat. Clim. Chang. 2017, 7, 48–52. [Google Scholar] [CrossRef]
  2. Hegerl, G.C.; Black, E.; Allan, R.P.; Ingram, W.J.; Polson, D.; Trenberth, K.E.; Chadwick, R.S.; Arkin, P.A.; Sarojini, B.B.; Becker, A.; et al. Challenges in quantifying changes in the global water cycle. Bull. Am. Meteorol. Soc. 2015, 96, 1097–1115. [Google Scholar] [CrossRef] [Green Version]
  3. Allan, R.P.; Soden, B.J.; John, V.O.; Ingram, W.; Good, P. Current changes in tropical precipitation. Environ. Res. Lett. 2010, 5, 025205. [Google Scholar] [CrossRef] [Green Version]
  4. Allan, R.P.; Soden, B.J. Large discrepancy between observed and simulated precipitation trends in the ascending and descending branches of the tropical circulation. Geophys. Res. Lett. 2007, 34, L18705. [Google Scholar] [CrossRef] [Green Version]
  5. Allen, M.R.; Ingram, W.J. Constraints on future changes in climate and the hydrologic cycle. Nature 2002, 419, 224–232. [Google Scholar] [CrossRef]
  6. Chou, C.; Neelin, J.D.; Chen, C.-A.; Tu, J.-Y. Evaluating the “rich-get-richer” mechanism in tropical precipitation change under global warming. J. Clim. 2009, 22, 1982–2005. [Google Scholar] [CrossRef]
  7. Chou, C.; Chiang, J.C.H.; Lan, C.W.; Chung, C.-H.; Liao, Y.-C.; Lee, C.-J. Increase in the range between wet and dry season precipitation. Nat. Geosci. 2013, 6, 263–267. [Google Scholar] [CrossRef]
  8. Foley, J.A.; DeFries, R.; Asner, G.P.; Barford, C.; Bonan, G.; Carpenter, S.R.; Chapin, F.S.; Coe, M.T.; Daily, G.C.; Gibbs, H.K.; et al. Global consequences of land use. Science 2005, 309, 570–574. [Google Scholar] [CrossRef] [Green Version]
  9. Foley, J.A.; Ramankutty, N.; Brauman, K.A.; Cassidy, E.S.; Gerber, J.S.; Johnston, M.; Mueller, N.D.; O’Connell, C.; Ray, D.K.; West, P.C.; et al. Solutions for a cultivated planet. Nature 2011, 478, 337–342. [Google Scholar] [CrossRef] [Green Version]
  10. Iizumi, T.; Luo, J.-J.; Challinor, A.J.; Sakurai, G.; Yokozawa, M.; Sakuma, H.; Brown, M.; Yamagata, T. Impacts of El Niño Southern Oscillation on the global yields of major crops. Nat. Commun. 2014, 5, 3712. [Google Scholar] [CrossRef] [Green Version]
  11. Chen, H.; Liang, Z.; Liu, Y.; Jiang, Q.; Xie, S. Effects of drought and flood on crop production in China across 1949–2015: Spatial hetero-geneity analysis with Bayesian hierarchical modeling. Nat. Hazards 2018, 92, 525–541. [Google Scholar] [CrossRef]
  12. Iizumi, T.; Ramankutty, N. Changes in yield variability of major crops for 1981–2010 explained by climate change. Environ. Res. Lett. 2016, 11, 034003. [Google Scholar] [CrossRef]
  13. Li, Y.; Guan, K.; Schnitkey, G.D.; DeLucia, E.; Peng, B. Excessive rainfall leads to maize yield loss of a comparable magnitude to extreme drought in the United States. Glob. Chang. Biol. 2019, 25, 2325–2337. [Google Scholar] [CrossRef] [Green Version]
  14. Lobell, D.B.; Gourdji, S.M. The influence of climate change on global crop productivity. Plant Physiol. 2012, 160, 1686–1697. [Google Scholar] [CrossRef] [PubMed] [Green Version]
  15. Lobell, D.B.; Hammer, G.L.; Chenu, K.; Zheng, B.; McLean, G.; Chapman, S. The shifting influence of drought and heat stress for crops in northeast Australia. Glob. Chang. Biol. 2015, 21, 4115–4127. [Google Scholar] [CrossRef] [PubMed]
  16. Schauberger, B.; Archontoulis, S.; Arneth, A.; Balkovic, J.; Ciais, P.; Deryng, D.; Elliott, J.; Folberth, C.; Khabarov, N.; Müller, C.; et al. Consistent negative response of US crops to high temperatures in observations and crop models. Nat. Commun. 2017, 8, 13931. [Google Scholar] [CrossRef] [Green Version]
  17. Tack, J.; Barkley, A.; Nalley, L.L. Effect of warming temperatures on US wheat yields. Proc. Natl. Acad. Sci. USA 2015, 112, 6931–6936. [Google Scholar] [CrossRef] [Green Version]
  18. Zipper, S.C.; Qiu, J.; Kucharik, C.J. Drought effects on US maize and soybean production: Spatiotemporal patterns and historical changes. Environ. Res. Lett. 2016, 11, 094021. [Google Scholar] [CrossRef]
  19. Borgomeo, E.; Khan, H.F.; Heino, M.; Zaveri, E.; Kummu, M.; Brown, C.; Jagerskog, A. Impact of green water anomalies on global rainfed crop yields. Environ. Res. Lett. 2020, 15, 124030. [Google Scholar] [CrossRef]
  20. Soureshjani, H.K.; Dehkordi, A.G.; Bahador, M. Temperature effect on yield of winter and spring irrigated crops. Agric. For. Meteorol. 2019, 279, 107664. [Google Scholar] [CrossRef]
  21. Vinnarasi, R.; Dhanya, C.T. Quantifying the shifts and intensification in the annual cycles of diurnal temperature extremes for human comfort and crop production. Environ. Res. Lett. 2019, 14, 054016. [Google Scholar] [CrossRef]
  22. Rezaei, E.E.; Webber, H.; Gaiser, T.; Naab, J.; Ewert, F. Heat stress in cereals: Mechanisms and modelling. Eur. J. Agron. 2015, 64, 98–113. [Google Scholar] [CrossRef]
  23. Siebert, S.; Ewert, F.; Rezaei, E.E.; Kage, H.; Graß, R. Impact of heat stress on crop yield-on the importance of considering canopy temperature. Env. Res Lett. 2014, 9, 044012. [Google Scholar] [CrossRef] [Green Version]
  24. Jin, Z.; Zhuang, Q.; Tan, Z.; Dukes, J.; Zheng, B.; Melillo, J.M. Do maize models capture the impacts of heat and drought stresses on yield? Using algorithm ensembles to identify successful approaches. Glob. Chang. Biol. 2016, 22, 3112–3126. [Google Scholar] [CrossRef]
  25. Vicente-Serrano, S.M.; Gouveia, C.; Camarero, J.J.; Beguería, S.; Trigo, R.; Lopez-Moreno, J.I.; Azorin-Molina, C.; Pasho, E.; Lorenzo-Lacruz, J.; Revuelto, J.; et al. Response of vegetation to drought time-scales across global land biomes. Proc. Natl. Acad. Sci. USA 2013, 110, 52–57. [Google Scholar] [CrossRef] [Green Version]
  26. Hongyan, W.; Ping, G.; Haiyun, M.; Huajun, D. Path analysis on the effects of spring continuous rain on the yield of summer harvesting crops. J. Anhui Agric. 2008, 36, 13596–13597. [Google Scholar]
  27. Lobell, D.B.; Asseng, S. Comparing estimates of climate change impacts from process-based and statistical crop models. Environ. Res. Lett. 2017, 12, 015001. [Google Scholar] [CrossRef]
  28. Lobell, D.B.; Hammer, G.L.; McLean, G.; Messina, C.; Roberts, M.J.; Schlenker, W. The critical role of extreme heat for maize production in the United States. Nat. Clim. Chang. 2013, 3, 497–501. [Google Scholar] [CrossRef]
  29. Asseng, S.; Ewert, F.; Martre, P.; Rötter, R.P.; Lobell, D.B.; Cammarano, D.; Kimball, B.A.; Ottman, M.J.; Wall, G.W.; White, J.W.; et al. Rising temperatures reduce global wheat production. Nat. Clim. Chang. 2015, 5, 143–147. [Google Scholar] [CrossRef]
  30. Tao, F.L.; Rötter, R.P.; Palosuo, T.; Diaz-Ambrona, C.G.; Minguez, M.I.; Semenov, M.; Kersebaum, K.C.; Nendel, C.; Cammarano, D.; Hoffmann, H.; et al. Designing future barley ideotypes using a crop model ensemble. Eur. J. Agron. 2017, 82, 144–162. [Google Scholar] [CrossRef]
  31. Rosenzweig, C.; Tubiello, F.N.; Goldberg, R.; Mills, E.; Bloomfield, J. Increased crop damage in the US from excess precipitation under climate change. Glob. Environ. Chang. 2002, 12, 197–202. [Google Scholar] [CrossRef] [Green Version]
  32. Maiorano, A.; Martre, P.; Asseng, S.; Ewert, F.; Müller, C.; Rötter, R.; Ruane, A.C.; Semenov, M.; Wallach, D.; Wang, E.; et al. Crop model improvement reduces the uncertainty of the response to temperature of multi-model ensembles. Field Crop. Res. 2017, 202, 5–20. [Google Scholar] [CrossRef] [Green Version]
  33. Lobell, D.B.; Sibley, A.M.; Ortiz-Monasterio, J.I. Extreme heat effects on wheat senescence in India. Nat. Clim. Chang. 2012, 2, 186–189. [Google Scholar] [CrossRef]
  34. Large, E.C. Growth stages in cereals—Illustration of the Feekes scale. Plant Pathol. 1954, 3, 128–129. [Google Scholar] [CrossRef]
  35. Nishio, Z.; Uchikawa, O.; Hideshima, Y.; Nishioka, H.; Mihara, M.; Nakamura, K.; Matsunaka, H.; Yamaguchi, K. Influence of precipitations and sunshine hours on yield of paddy field grown wheat (Triticum aestivum L.) in Northern Kyushu, Japan. Plant Prod. Sci. 2019, 22, 479–489. [Google Scholar] [CrossRef]
  36. Zampieri, M.; Ceglar, A.; Dentener, F.; Toreti, A. Wheat yield loss attributable to heat waves, drought and water excess at the global, national and subnational scales. Environ. Res. Lett. 2017, 12, 064008. [Google Scholar] [CrossRef]
  37. Wu, Y.N.; Zhong, P.A.; Zhang, Y.; Xu, B.; Ma, B.; Yan, K. Integrated flood risk assessment and zonation method: A case study in Huaihe River basin, China. Nat. Hazards 2015, 78, 635–651. [Google Scholar] [CrossRef]
  38. Zhao, L.; Yu, J.; Bo, Y.; Yang, J.; Li, H.-Q. Temperal and spatial distribution of drought in Hubei province during 1961–2012 based on SPEI. Resour. Environ. Yangtze Basin 2015, 24, 1230–1237. [Google Scholar]
  39. Hayes, M.J.; Svoboda, M.D.; Whilhite, D.A. Monitoring the 1996 drought using the standardized precipitation index. Bull. Am. Meteorol. Soc. 1999, 80, 429–438. [Google Scholar] [CrossRef] [Green Version]
  40. Aadhar, S.; Mishra, V. High-resolution near real-time drought monitoring in South Asia. Sci. Data 2017, 4, 170145. [Google Scholar] [CrossRef] [PubMed] [Green Version]
  41. Zhang, A.Z.; Jia, G.S.; Wang, H.S. Improving meteorological drought monitoring capability over tropical and subtropical water-limited ecosystems: Evaluation and ensemble of the Microwave Integrated Drought Index. Environ. Res. Lett. 2019, 14, 044025. [Google Scholar] [CrossRef]
Figure 1. Topography and location of study area. Points indicate national ground meteorological observatory.
Agronomy 12 00050 g001
Figure 2. Coefficient of variation (CV) of winter wheat yield over study area (a). Scatter plot of CV of yield and latitude were also given for Anhui (b), Jiangsu (c) and Hubei (d). The asterisk (*) indicates that the correlation between them has passed the significance test. Area with blank means no data and the same below.
Agronomy 12 00050 g002
Figure 3. Spatial pattern of CV of total precipitation (a), average sunshine hours (c) and average maximum temperature (e) across growing season, and the corresponding scatter plots of latitude and CV of total precipitation (b), CV of average sunshine hours (d) and CV of average maximum temperature (f). The asterisk (*) indicates that the correlation between them has passed the significance test.
Agronomy 12 00050 g003
Figure 4. Impact of extreme climate factors, including precipitation (a), sunshine hours (b) and maximum temperature (c) on winter wheat yield middle and lower reaches of the Yangtze River.
Agronomy 12 00050 g004
Figure 5. Disentangling sunshine hours and maximum temperature limitation effects from precipitation. Precipitation versus WYLR, binned by sunshine hours (a) and maximum temperature anomaly (b), respectively. Each circle represents the averaged WYLR within each bin of sunshine hours and maximum temperature anomaly. Average WYLR in each bin of sunshine hours (c) and maximum temperature (d). The dashed line means the threshold value of extreme condition.
Agronomy 12 00050 g005
Figure 6. The impacts of extreme wet on winter wheat yield at the county level (a) and the impact of extreme precipitation on winter wheat yield in Anhui (b), Jiangsu (c) and Hubei (d) province. The excessive rainfall impact for each county is the WYLR of extreme wet years for each county. The counties with gray color means there is no extreme wet or dry samples.
Agronomy 12 00050 g006
Figure 7. The relationship between WYLR in extreme wet years and the three mean climate factors in Anhui (AC), Jiangsu (DF), Hubei (GI) and whole study area (JL). Note: each point represents one station (county) samples that has the extreme conditions of total precipitation, mean sunshine hours, mean maximum temperature and the gray area is the 95% confidence interval of fitted model, and the blue line in the figure represents the linear fitted line. The asterisk (*) indicates that the correlation between them has passed the significance test.
Agronomy 12 00050 g007
Table 1. Specific period information of meteorological observations and county-level yield.
Meteorological
Observatory
County-Level YieldUsed in Our StudyNumber of Stations
Anhui1960–20151949–20141960–201476
Jiangsu1971–20151951–20141971–201460
Hubei1961–20151949–20141961–201467
Publisher’s Note: MDPI stays neutral with regard to jurisdictional claims in published maps and institutional affiliations.

