
Drought-Adaptive Mechanisms of Young Sweet Cherry Trees in Response to Withholding and Resuming Irrigation Cycles


Abstract
:1. Introduction
2. Materials and Methods
2.1. Study Site
2.2. Treatments
2.3. Field Measurements
2.3.1. Soil Water Status
2.3.2. Plant Water Status
2.3.3. Leaf Traits
2.3.4. Leaf Insertion Angle
2.3.5. Vegetative Growth
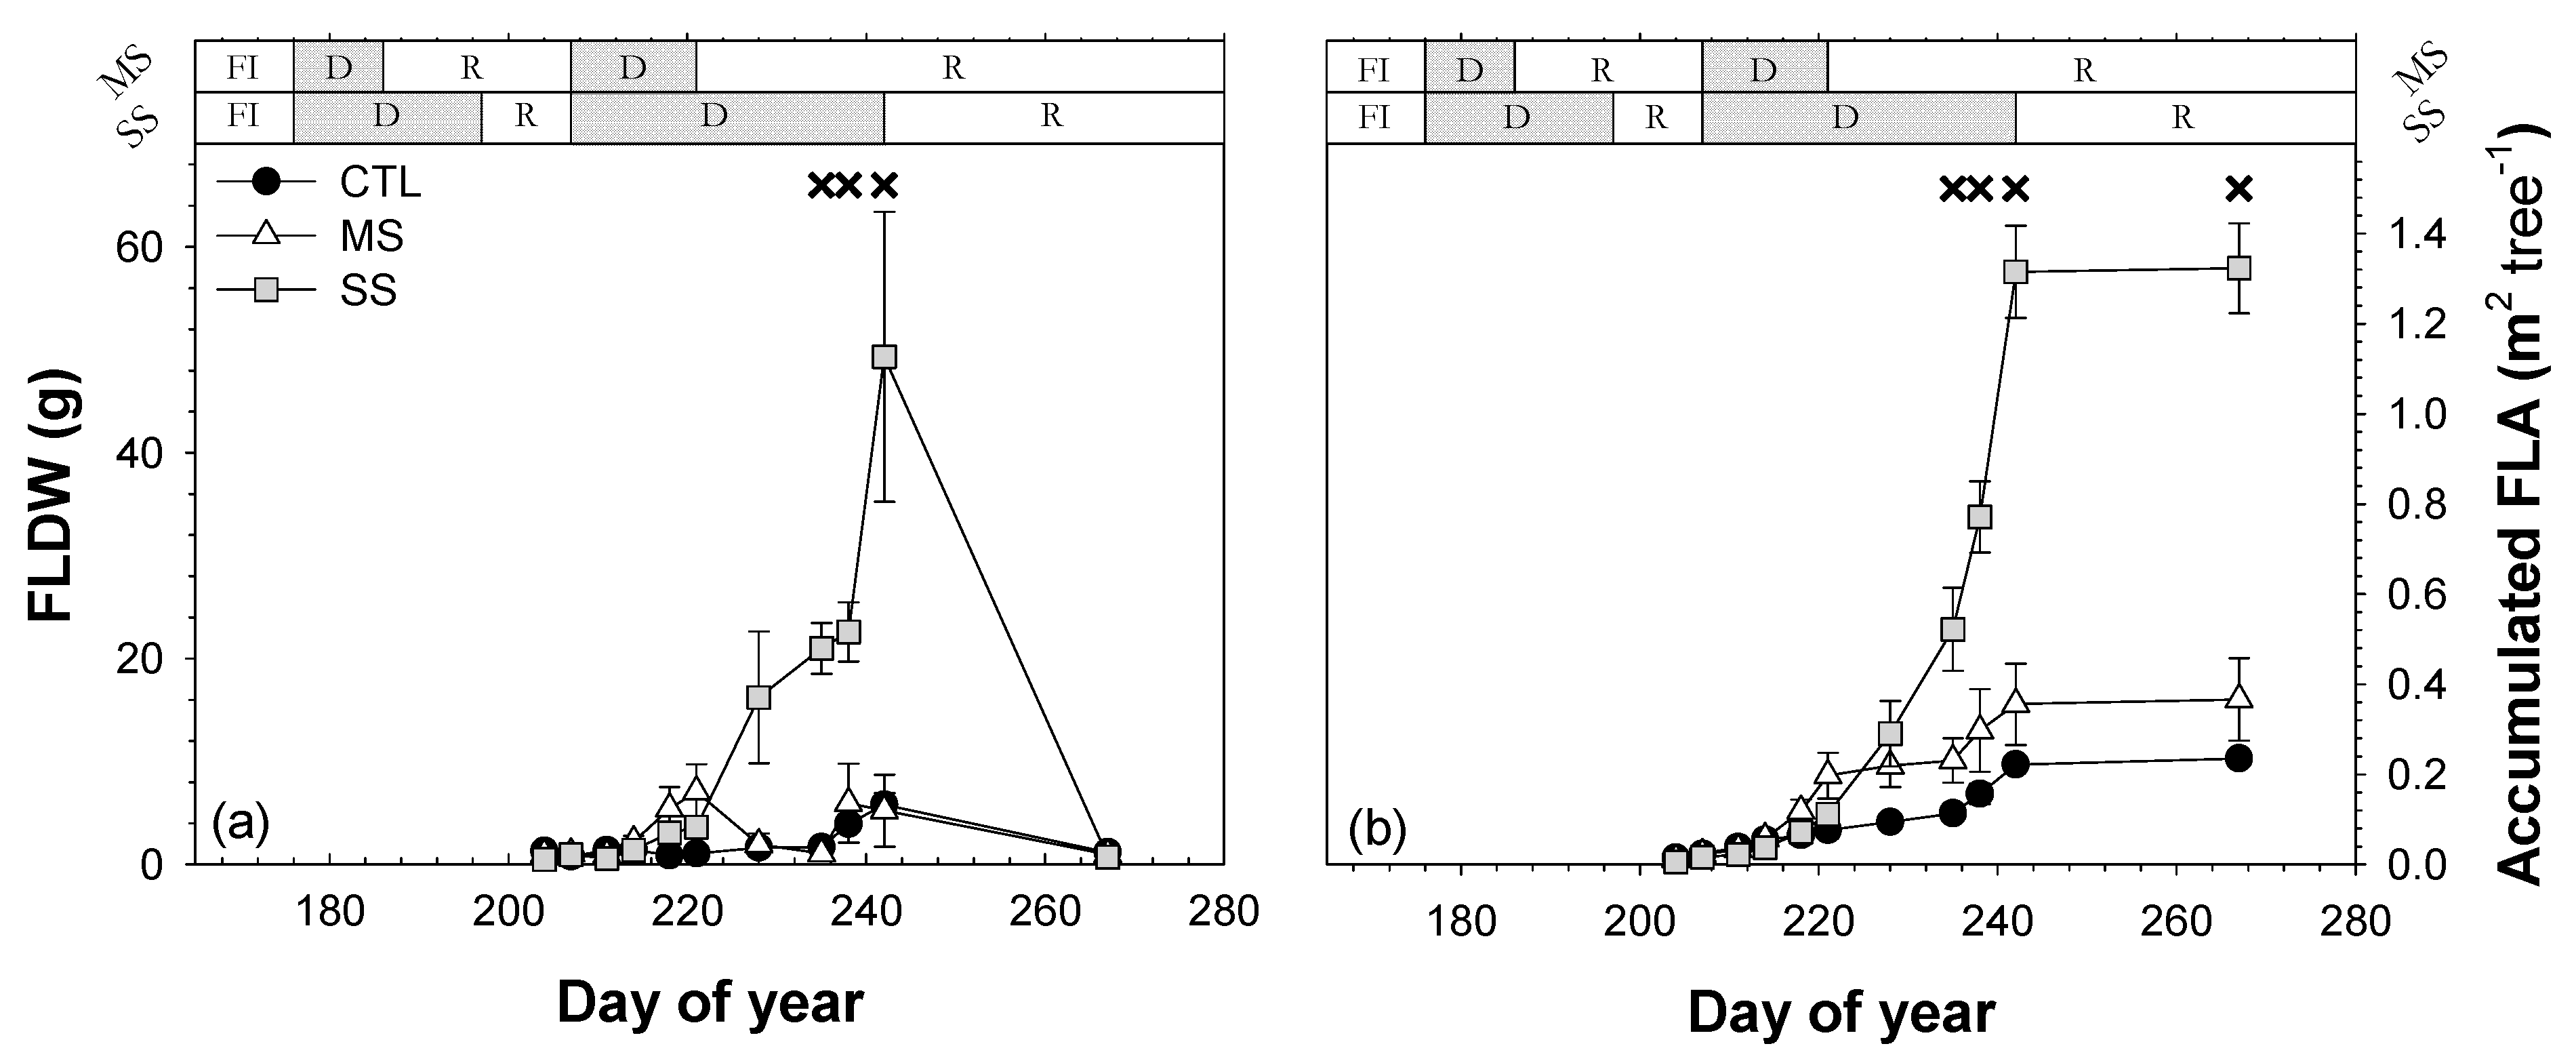
2.3.6. Leaf Defoliation
2.4. Statistical Analysis
3. Results
3.1. Soil Water Status
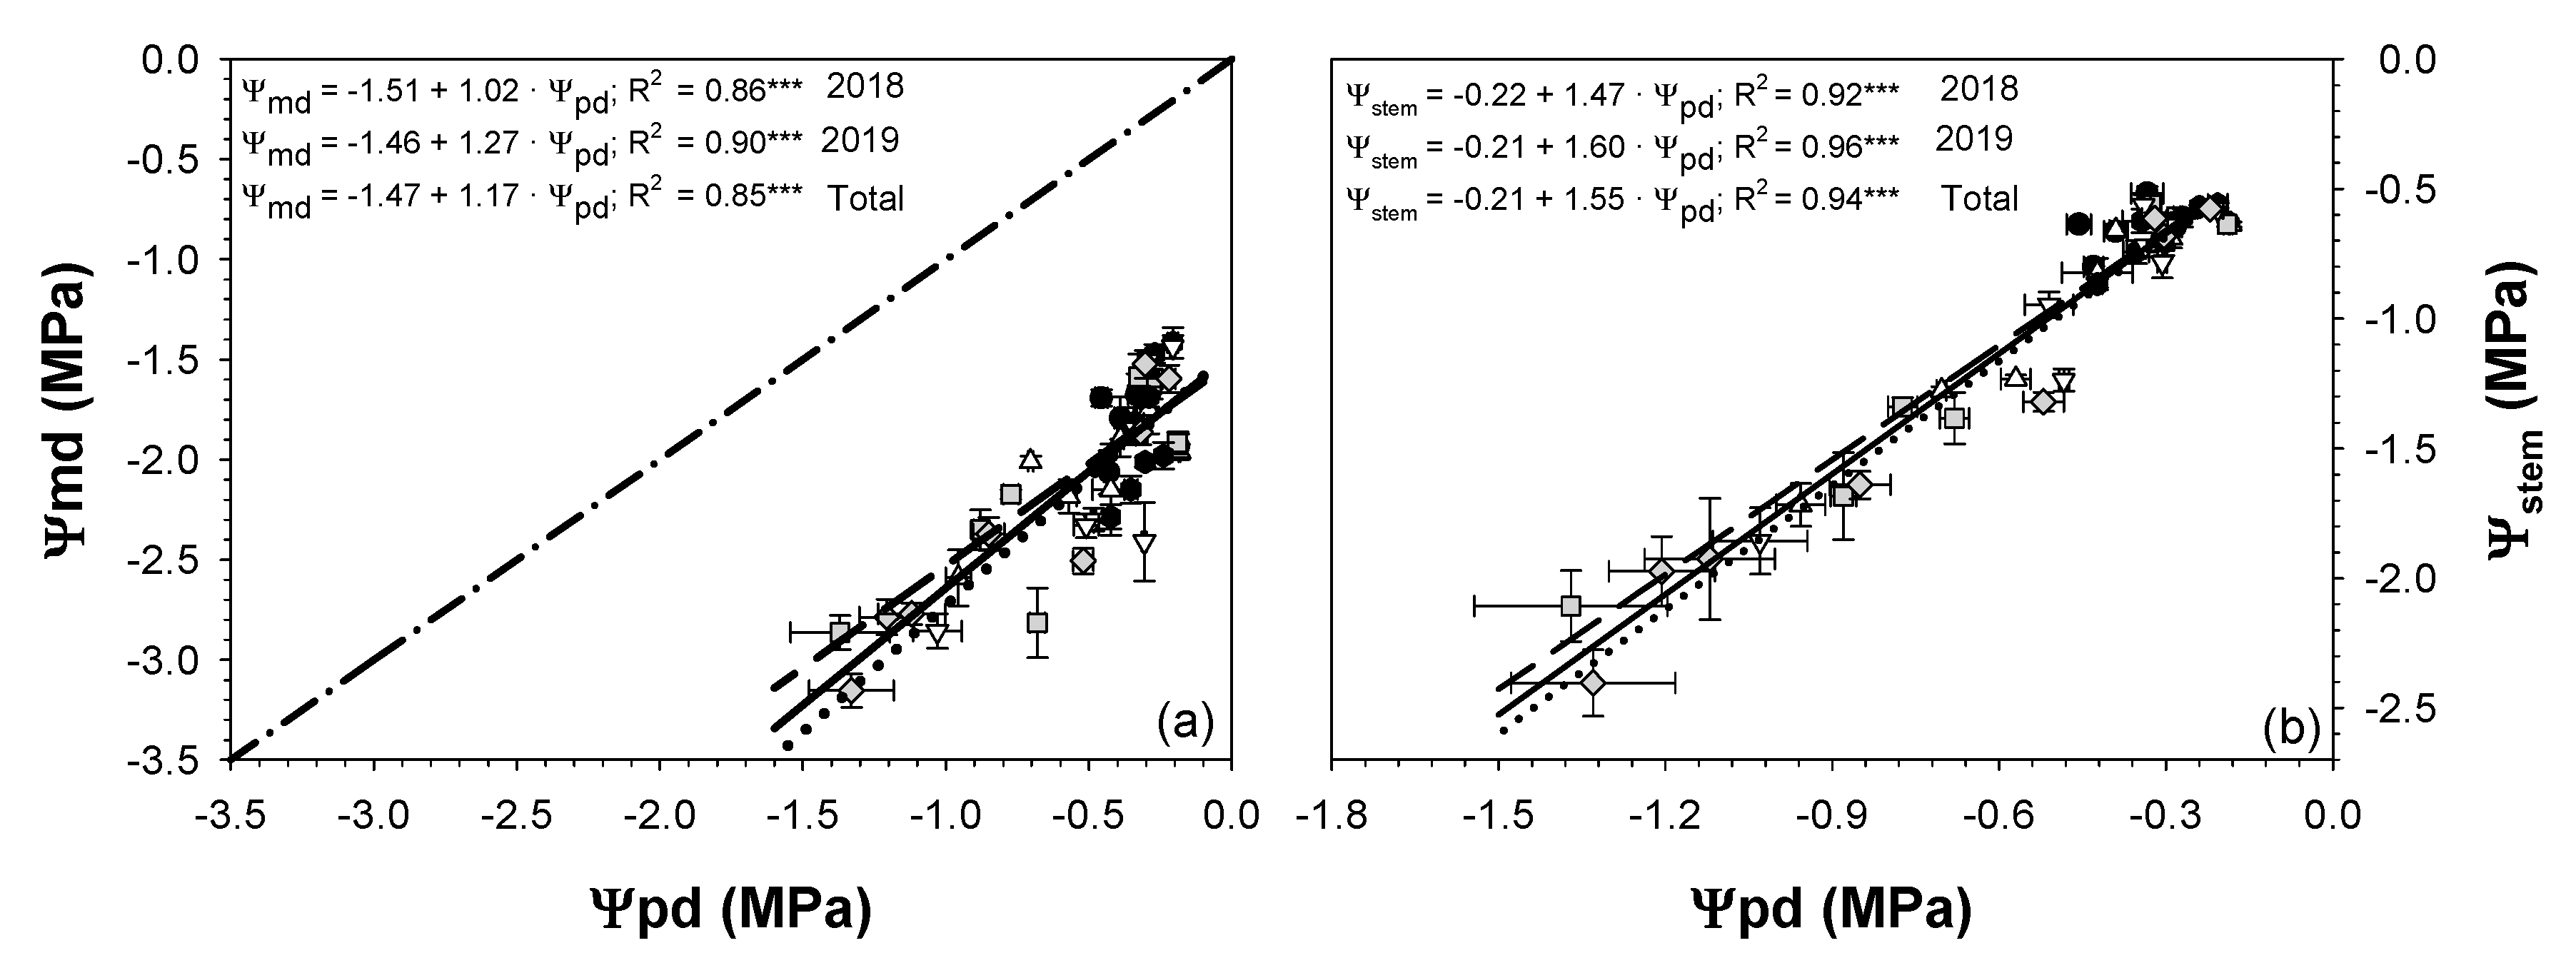
3.2. Plant Water Status
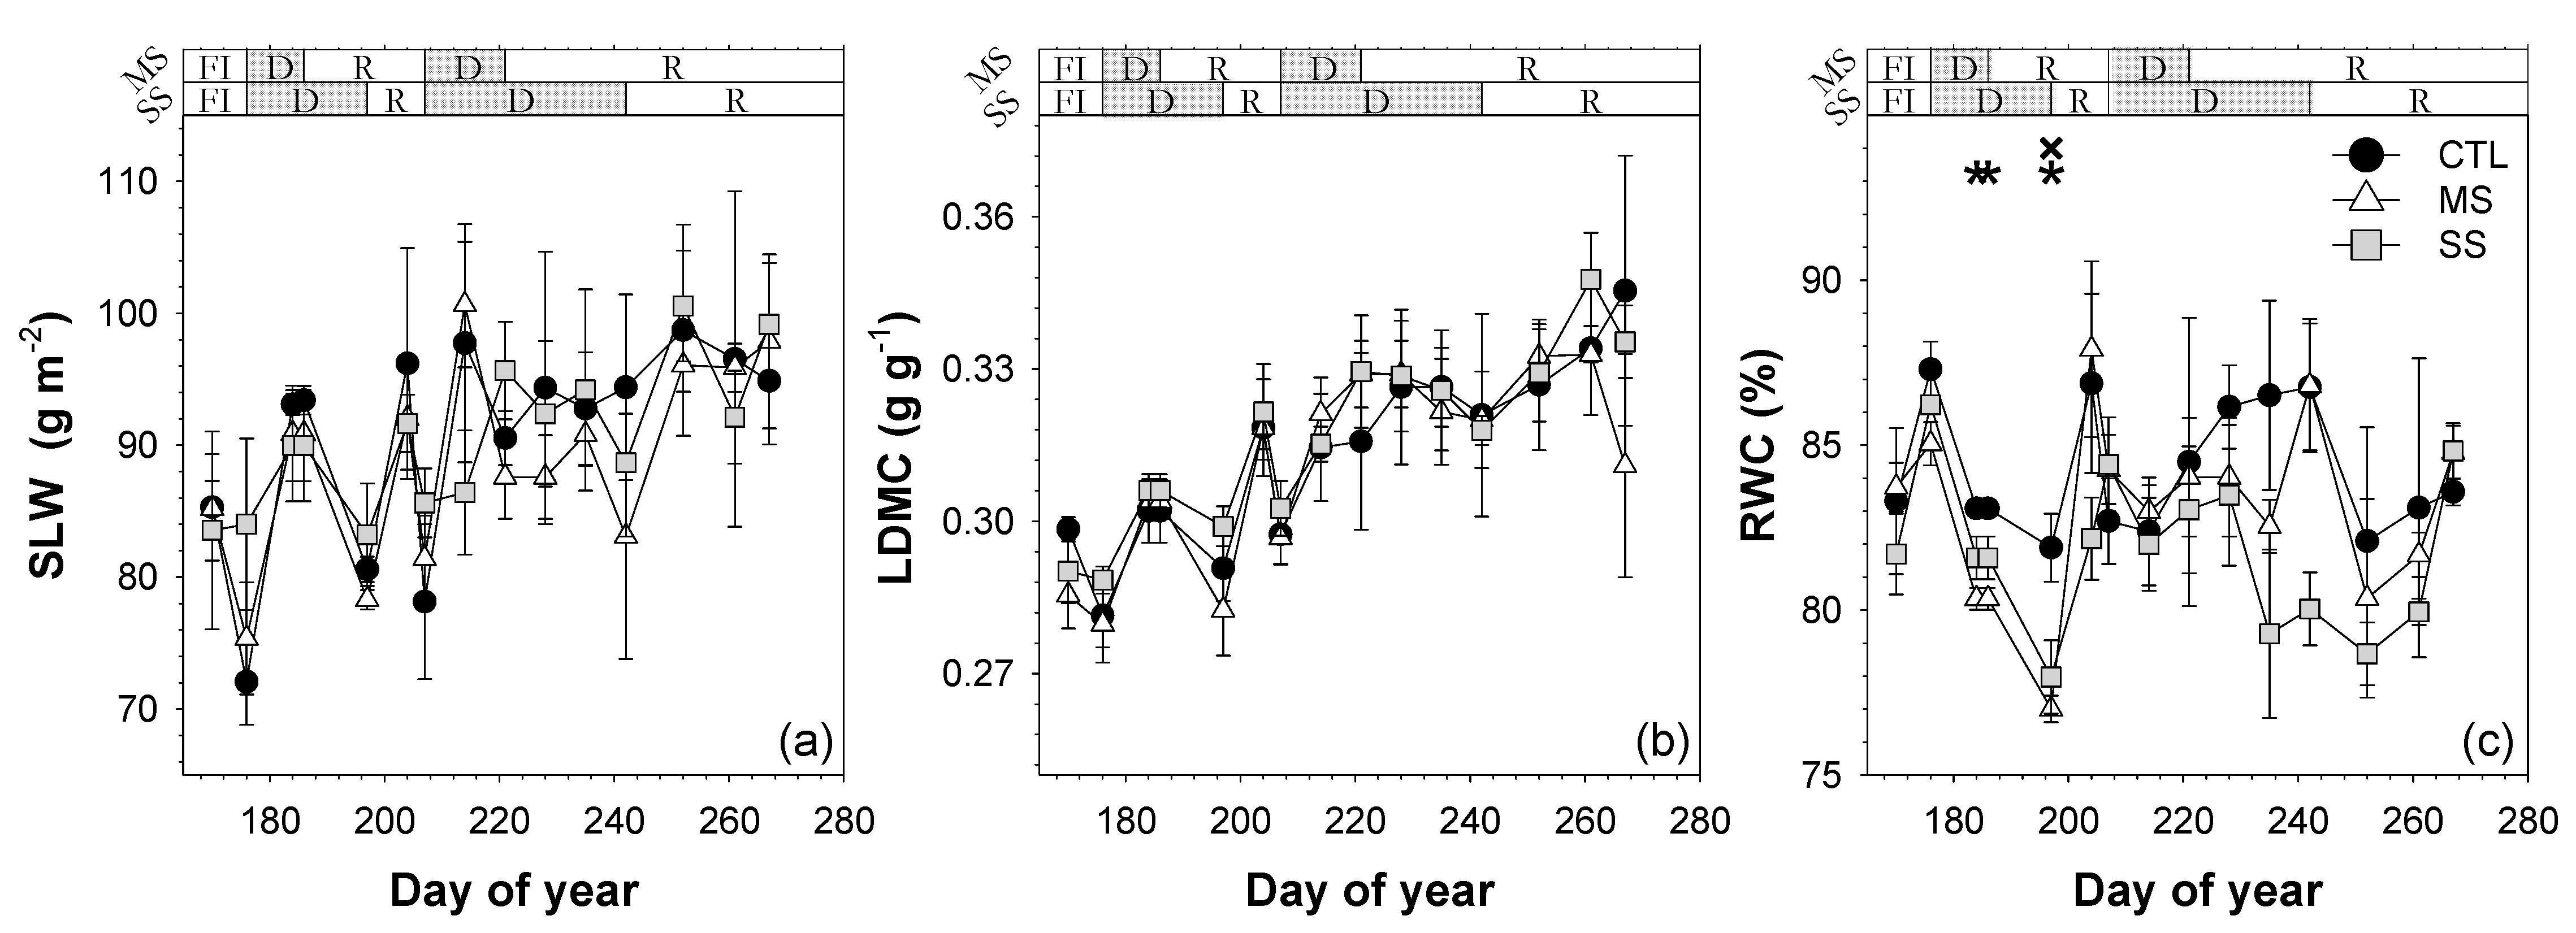
3.3. Leaf Traits
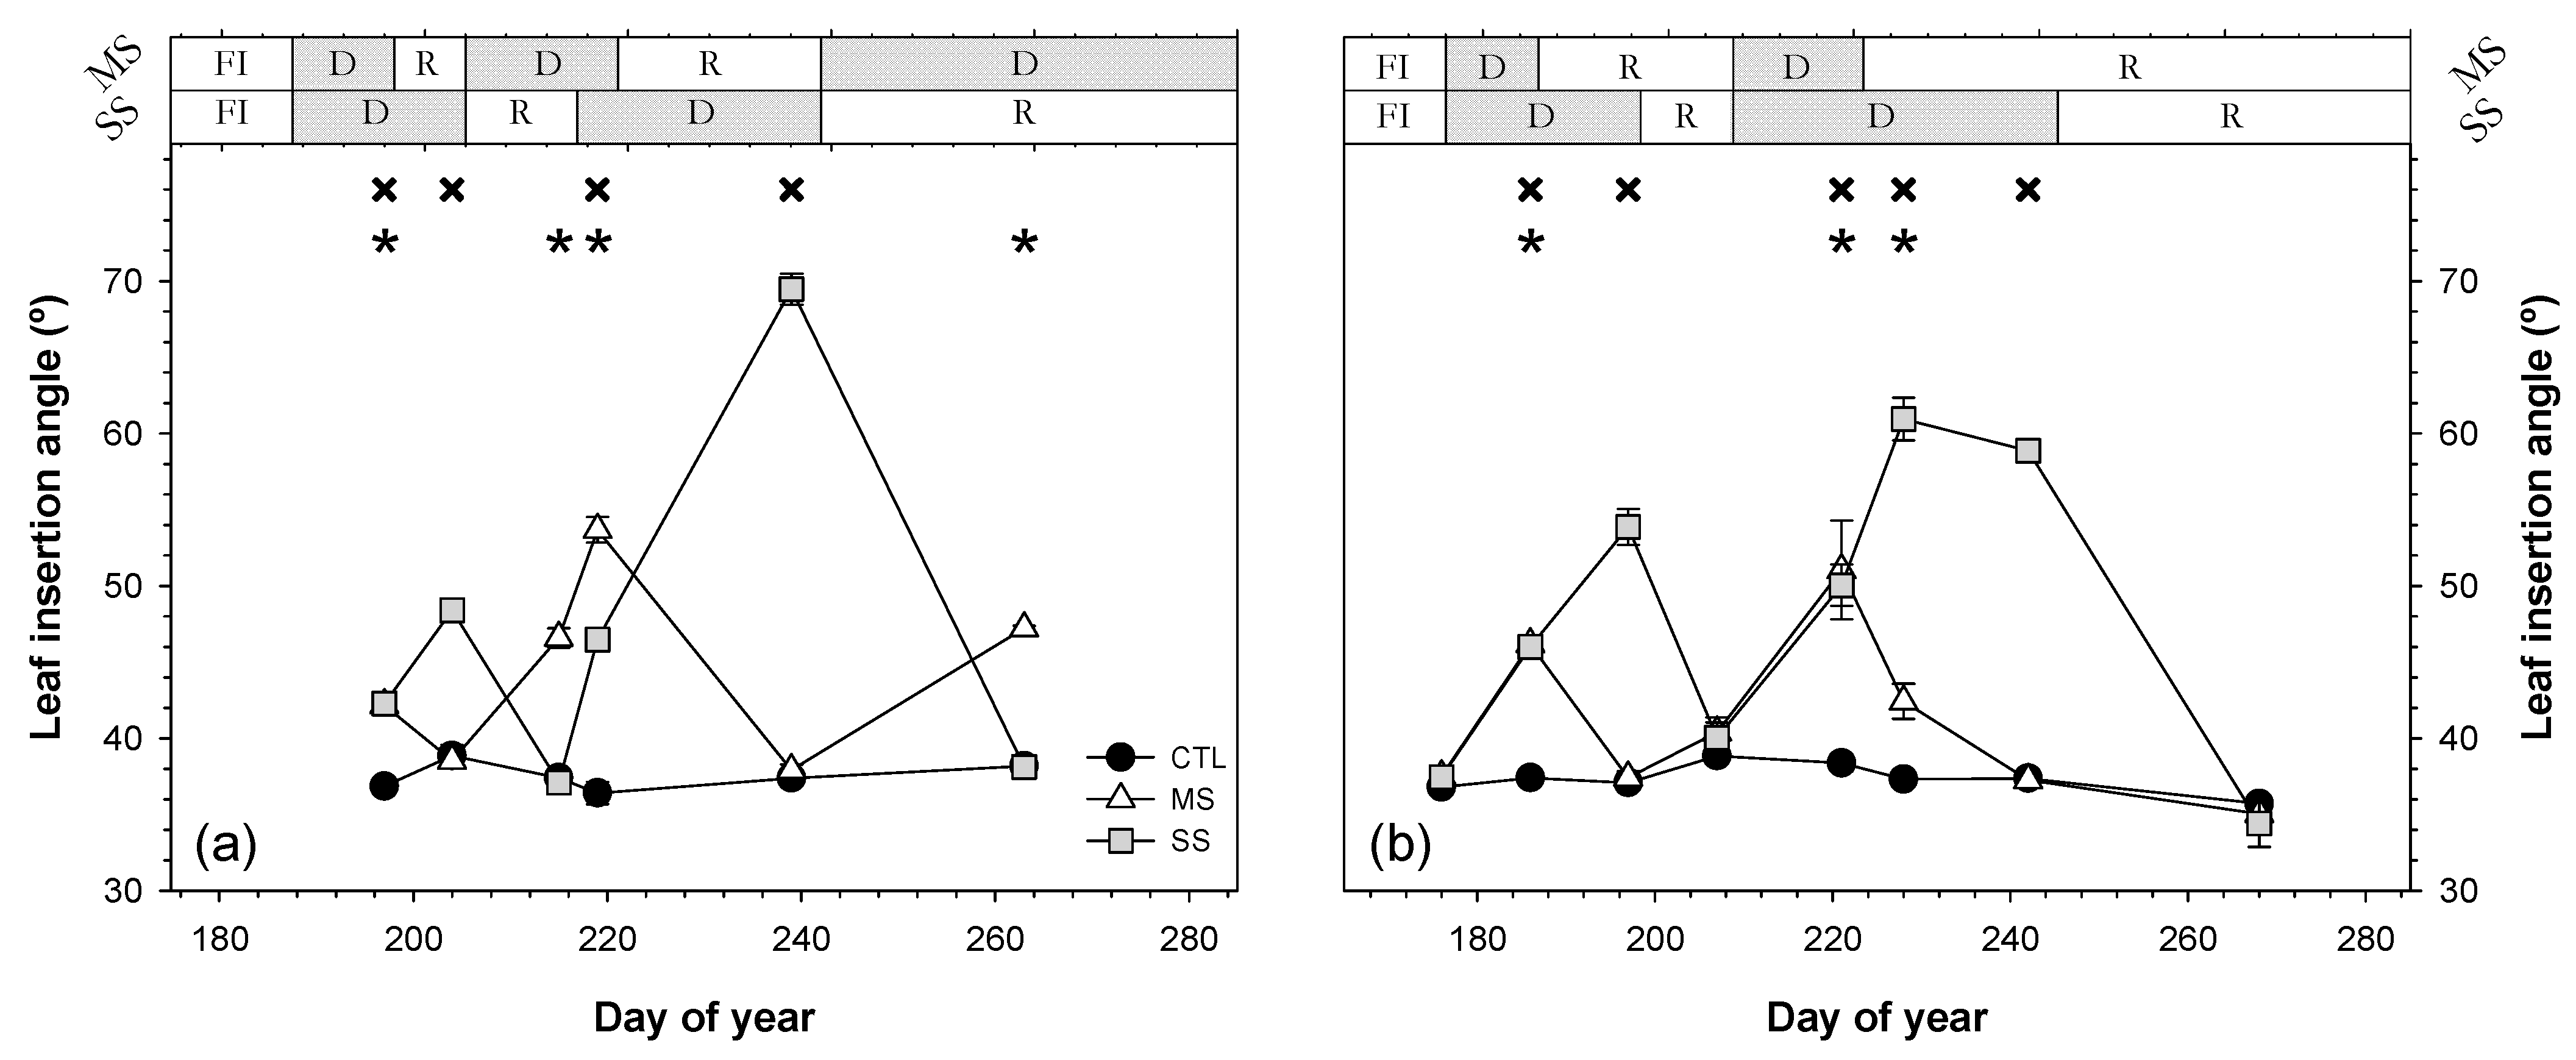
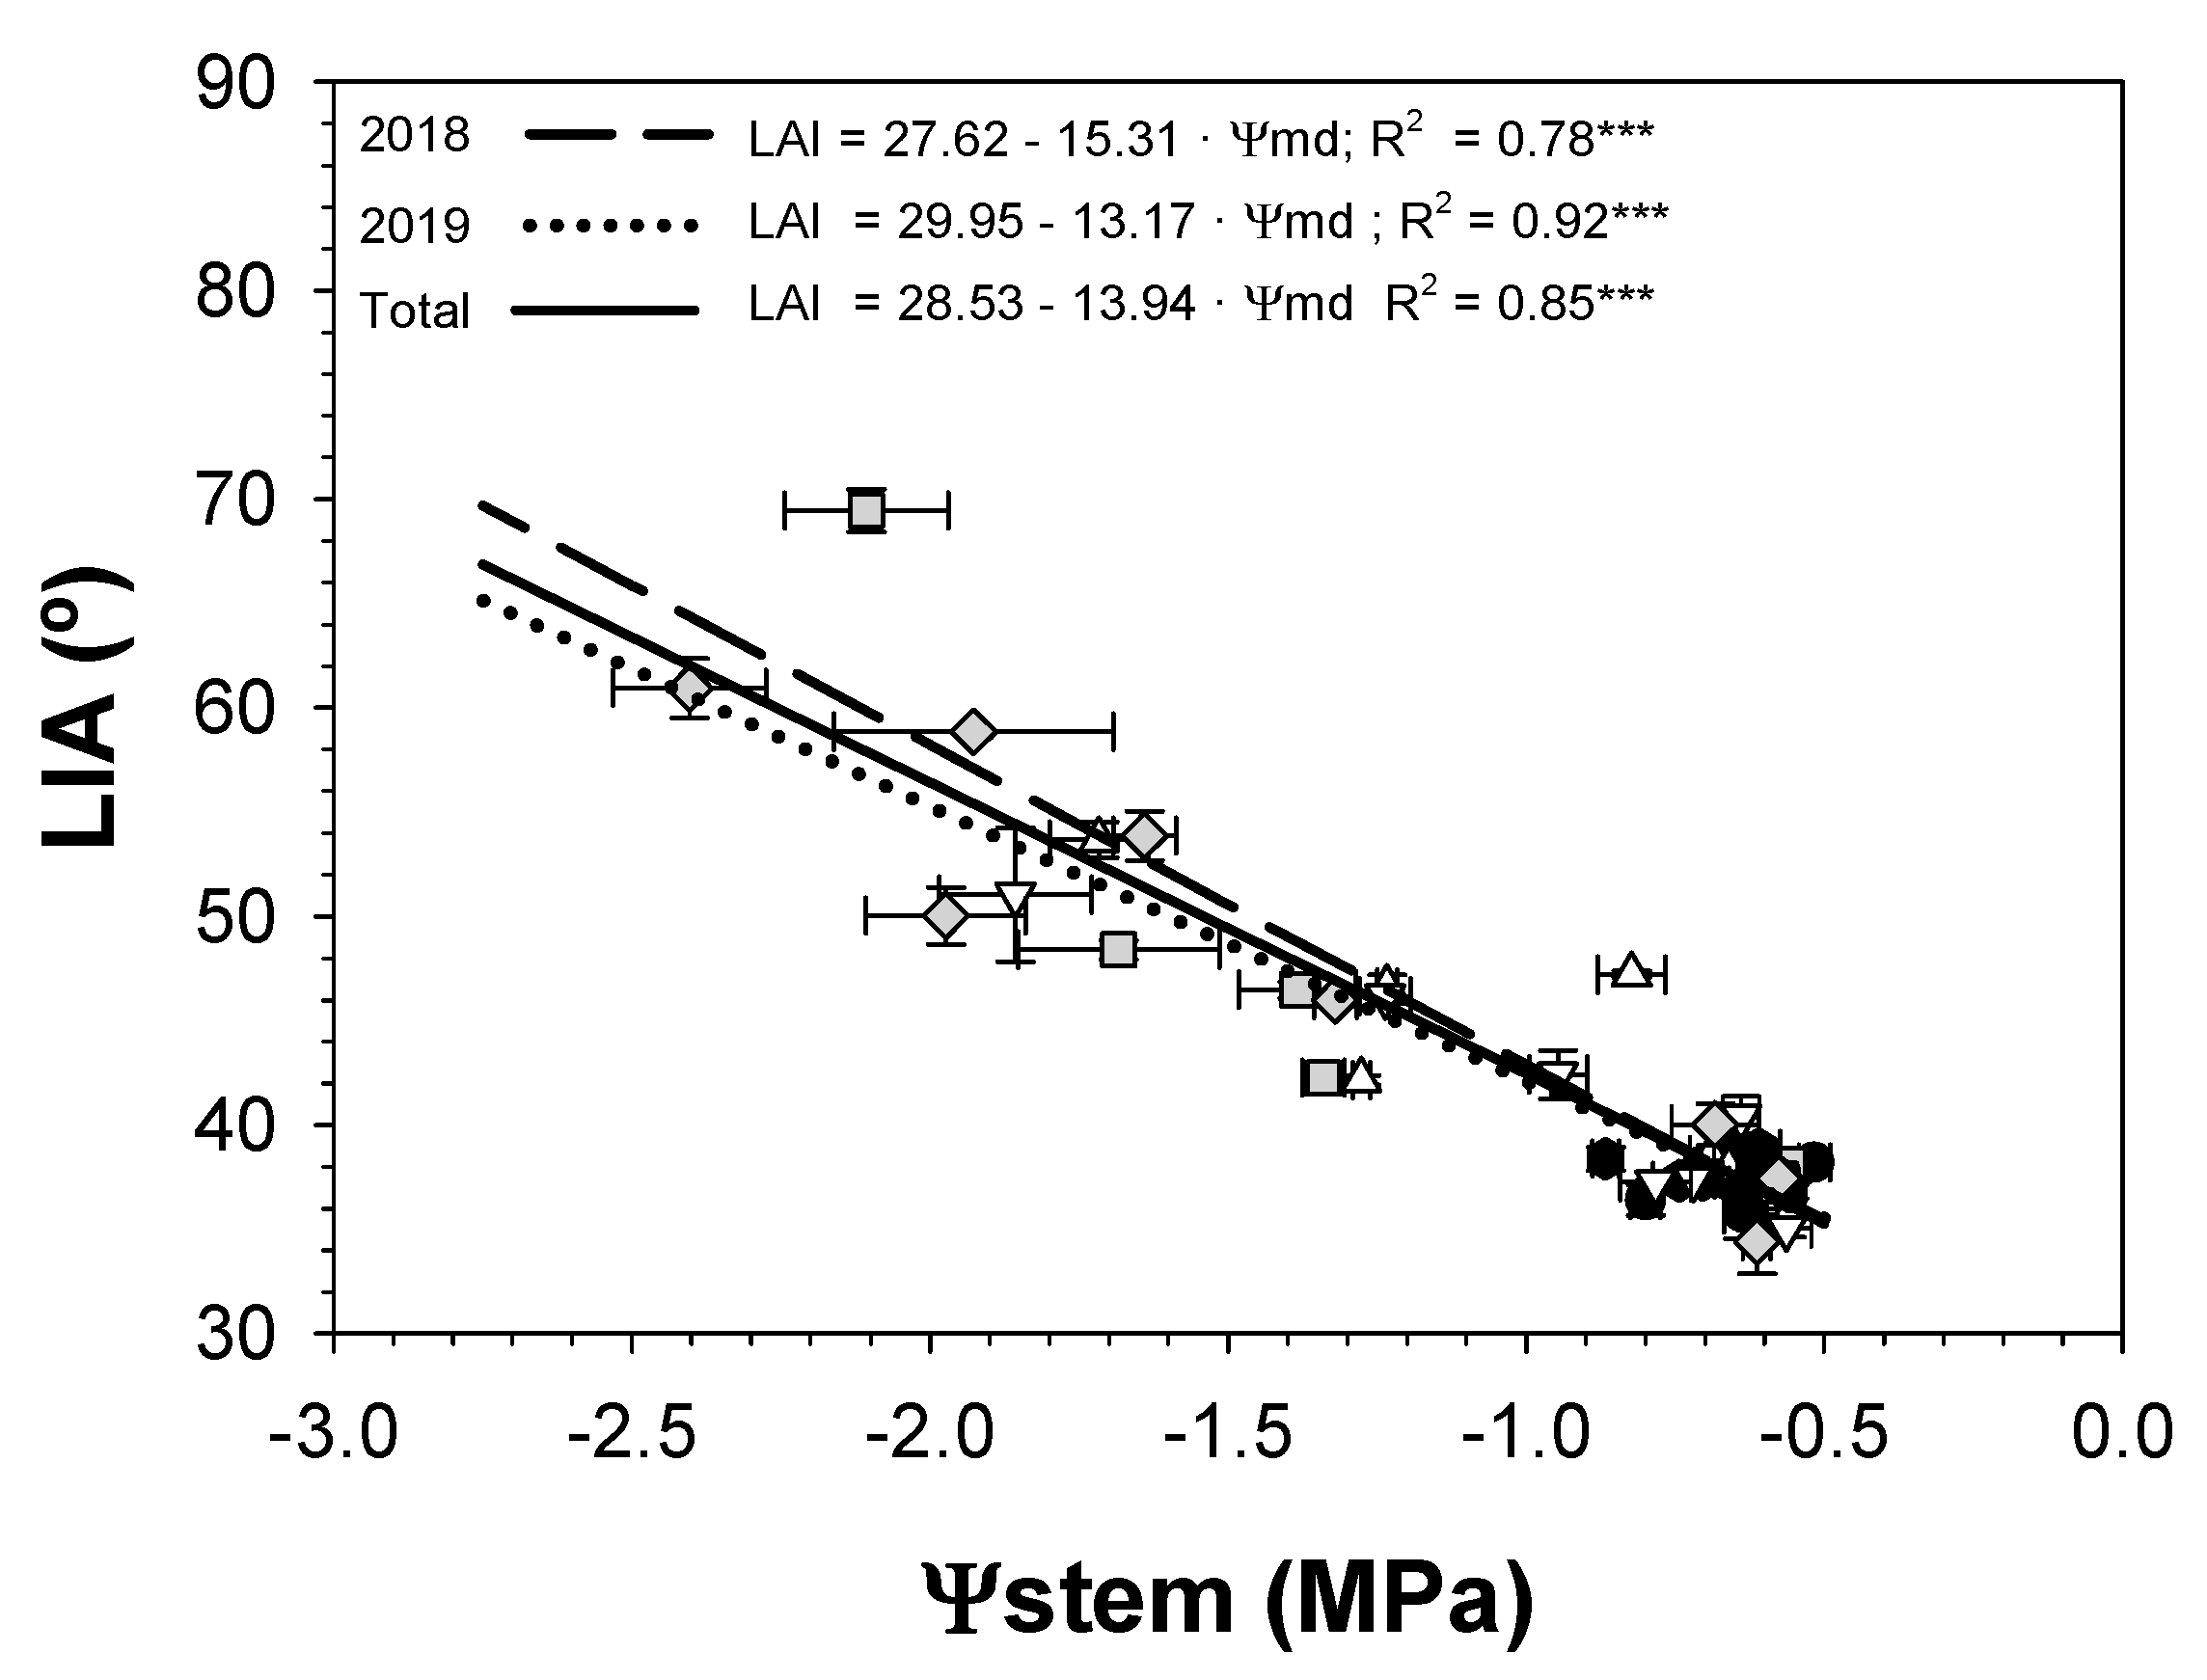
3.4. Leaf Insertion Angle
3.5. Vegetative Growth
3.6. Leaf Defoliation
4. Discussion
5. Conclusions
Author Contributions
Funding
Acknowledgments
Conflicts of Interest
References
- IPCC. IPCC Climate Change 2014: Synthesis Report. In Contribution of Working Groups I, II and III to the Fifth Assessment Report of the Intergovernmental Panel on Climate Change; Core Writing Team, Pachauri, R.K., Meyer, L.A., Eds.; IPCC: Geneva, Switzerland, 2014; p. 151. [Google Scholar]
- Medrano, H.; Bota, J.; Abadía, A.; Sampol, B.; Escalona, J.M.; Flexas, J. Effects of drought on light-energy dissipation mechanisms in high-light-acclimated, field-grown grapevines. Funct. Plant Biol. 2002, 29, 1197–1207. [Google Scholar] [CrossRef] [PubMed] [Green Version]
- Oraee, A.; Tehranifar, A. Evaluating the potential drought tolerance of pansy through its physiological and biochemical responses to drought and recovery periods. Sci. Hortic. 2020, 265, 109225. [Google Scholar] [CrossRef]
- Chaves, M.M.; Miguel Costa, J.; Madeira Saibo, N.J. Recent advances in photosynthesis under drought and salinity. In Plant Responses to Drought and Salinity Stress, 1st ed.; Turkan, I., Ed.; Academic Press: Cambridge, MA, USA, 2011; Volume 57, pp. 49–104. ISBN 9780123876928. [Google Scholar]
- Puértolas, J.; Pardos, M.; De Ollas, C.; Albacete, A.; Dodd, I.C. Soil moisture heterogeneity regulates water use in Populus nigra L. by altering root and xylem sap phytohormone concentrations. Tree Physiol. 2020, 40, 762–773. [Google Scholar] [CrossRef] [PubMed]
- Chaves, M.M.; Maroco, J.P.; Pereira, J.S. Understanding plant responses to drought—From genes to the whole plant. Funct. Plant Biol. 2003, 30, 239–264. [Google Scholar] [CrossRef]
- FAOSTAT FAO—Food and Agriculture Organization of the United Nations. Statistics Division. 2019. Available online: http://www.fao.org/faostat/en/#data/QC/visualize (accessed on 3 June 2021).
- Marsal, J.; Lopez, G.; del Campo, J.; Mata, M.; Arbones, A.; Girona, J. Postharvest regulated deficit irrigation in ‘Summit’ sweet cherry: Fruit yield and quality in the following season. Irrig. Sci. 2010, 28, 181–189. [Google Scholar] [CrossRef]
- Blaya-Ros, P.J.; Blanco, V.; Domingo, R.; Soto-Valles, F.; Torres-Sánchez, R. Feasibility of low-cost thermal imaging for monitoring water stress in young and mature sweet cherry trees. Appl. Sci. 2020, 10, 5461. [Google Scholar] [CrossRef]
- Blanco, V.; Torres-Sánchez, R.; Blaya-Ros, P.J.; Pérez-Pastor, A.; Domingo, R. Vegetative and reproductive response of ‘Prime Giant’ sweet cherry trees to regulated deficit irrigation. Sci. Hortic. 2019, 249, 478–489. [Google Scholar] [CrossRef]
- Blanco, V.; Blaya-Ros, P.J.; Torres-Sanchez, R.; Domingo, R. Influence of regulated deficit irrigation and environmental conditions on reproductive response of sweet cherry trees. Plants 2020, 9, 94. [Google Scholar] [CrossRef] [PubMed] [Green Version]
- Blanco, V.; Martínez-Hernández, G.B.; Artés-Hernández, F.; Blaya-Ros, P.J.; Torres-Sánchez, R.; Domingo, R. Water relations and quality changes throughout fruit development and shelf life of sweet cherry grown under regulated deficit irrigation. Agric. Water Manag. 2019, 217, 243–254. [Google Scholar] [CrossRef]
- Farooq, M.; Hussain, M.; Wahid, A.; Siddique, K.H.M. Drought stress in plants: An overview. In Plant Responses to Drought Stress: From Morphological to Molecular Features; Springer: Berlin/Heidelberg, Germany, 2012; Volume 9783642326, pp. 1–33. ISBN 9783642326530. [Google Scholar]
- Castel, J.R.; Fereres, E. Responses of young almond trees to two drought periods in the field. J. Hortic. Sci. 1982, 57, 175–187. [Google Scholar] [CrossRef]
- Torrecillas, A.; Galego, R.; Pérez-Pastor, A.; Ruiz-Sánchez, M.C. Gas exchange and water relations of young apricot plants under drought conditions. J. Agric. Sci. 1999, 132, 445–452. [Google Scholar] [CrossRef] [Green Version]
- Ruiz-Sánchez, M.C.; Domingo, R.; Torrecillas, A.; Pérez-Pastor, A. Water stress preconditioning to improve drought resistance in young apricot plants. Plant Sci. 2000, 156, 245–251. [Google Scholar] [CrossRef] [Green Version]
- Bhusal, N.; Lee, M.; Lee, H.; Adhikari, A.; Han, A.R.; Han, A.; Kim, H.S. Evaluation of morphological, physiological, and biochemical traits for assessing drought resistance in eleven tree species. Sci. Total Environ. 2021, 779, 146466. [Google Scholar] [CrossRef]
- Abdelfatah, A.; Aranda, X.; Savé, R.; de Herralde, F.; Biel, C. Evaluation of the response of maximum daily shrinkage in young cherry trees submitted to water stress cycles in a greenhouse. Agric. Water Manag. 2013, 118, 150–158. [Google Scholar] [CrossRef]
- Blanco, V.; Domingo, R.; Pérez-Pastor, A.; Blaya-Ros, P.J.; Torres-Sánchez, R. Soil and plant water indicators for deficit irrigation management of field-grown sweet cherry trees. Agric. Water Manag. 2018, 208, 83–94. [Google Scholar] [CrossRef]
- Brito, C.; Dinis, L.; Moutinho-Pereira, J.; Correia, C.M. Drought stress effects and olive tree acclimation under a changing climate. Plants 2019, 8, 232. [Google Scholar] [CrossRef] [PubMed] [Green Version]
- Livellara, N.; Saavedra, F.; Salgado, E. Plant based indicators for irrigation scheduling in young cherry trees. Agric. Water Manag. 2011, 98, 684–690. [Google Scholar] [CrossRef]
- Turner, N.C. Turgor maintenance by osmotic adjustment: 40 years of progress. J. Exp. Bot. 2018, 69, 3223–3233. [Google Scholar] [CrossRef] [PubMed] [Green Version]
- Ranney, T.G.; Bassuk, N.L.; Whitlow, T.H. Turgor maintenance in leaves and roots of ‘Colt’ cherry trees (Prunus avium x pseudocerasus) in response to water stress. J. Hortic. Sci. 1991, 66, 381–387. [Google Scholar] [CrossRef]
- Allen, R.G.; Pereira, L.S.; Raes, D.; Smith, M. FAO Irrigation and drainage paper. In Crop. Evapotranspiration-Guidelines for Computing Crop. Water Requirements; Food and Agriculture Organization: Rome, Italy, 1998; ISBN 9253042192. [Google Scholar]
- Marsal, J. FAO irrigation and drainage paper. In Crop. Yield Response Water. Sweet Cherry; Food and Agriculture Organization: Rome, Italy, 2012; pp. 449–457. ISBN 978-9251072745. [Google Scholar]
- Fereres, E.; Pruitt, W.O.; Beutel, J.A.; Henderson, D.W.; Holzapfel, E.; Schulbach, H.; Uriu, K. Evapotranspiration and drip irrigation scheduling. In Drip Irrigation Management; Leaflet 21259; Division of Agricultural Sciences, University of California: Los Angeles, CA, USA, 1981; pp. 8–13. [Google Scholar]
- Turner, N.C. Measurement of plant water status by the pressure chamber technique. Irrig. Sci. 1988, 9, 289–308. [Google Scholar] [CrossRef]
- Hsiao, T.C. Measurements of plant water status. Agronomy 1990, 30, 243–279. [Google Scholar]
- McCutchan, H.; Shackel, K.A. Stem-water potential as a sensitive indicator of water stress in prune trees (Prunus domestica L. cv. French). J. Am. Soc. Hortic. Sci. 1992, 117, 607–611. [Google Scholar] [CrossRef] [Green Version]
- Gucci, R.; Xiloyannis, C.; Flore, J.A. Gas exchange parameters, water relations and carbohydrate partitioning in leaves of field-grown Prunus domestica following fruit removal. Physiol. Plant. 1991, 83, 497–505. [Google Scholar] [CrossRef]
- Turner, N.C. Techniques and experimental approaches for the measurement of plant water status. Plant Soil 1981, 58, 339–366. [Google Scholar] [CrossRef]
- Blanco, V.; Zoffoli, J.P.; Ayala, M. High tunnel cultivation of sweet cherry (Prunus avium L.): Physiological and production variables. Sci. Hortic. 2019, 251, 108–117. [Google Scholar] [CrossRef]
- Chaves, M.M.; Flexas, J.; Pinheiro, C. Photosynthesis under drought and salt stress: Regulation mechanisms from whole plant to cell. Ann. Bot. 2009, 103, 551–560. [Google Scholar] [CrossRef] [Green Version]
- Marsal, J.; Lopez, G.; Arbones, A.; Mata, M.; Vallverdu, X.; Girona, J. Influence of post-harvest deficit irrigation and pre-harvest fruit thinning on sweet cherry (cv. New Star) fruit firmness and quality. J. Hortic. Sci. Biotechnol. 2009, 84, 273–278. [Google Scholar] [CrossRef]
- Intrigliolo, D.S.; Castel, J.R. Vine and soil-based measures of water status in a Tempranillo vineyard. Vitis J. Grapevine Res. 2006, 45, 157–163. [Google Scholar] [CrossRef]
- Domingo, R.; Ruiz-Sanchez, M.C.; Sánchez-Blanco, M.J.; Torrecillas, A. Water relations, growth and yield of Fino lemon trees under regulated deficit irrigation. Irrig. Sci. 1996, 16, 115–123. [Google Scholar] [CrossRef]
- Martínez-Vilalta, J.; Poyatos, R.; Aguadé, D.; Retana, J.; Mencuccini, M. A new look at water transport regulation in plants. New Phytol. 2014, 204, 105–115. [Google Scholar] [CrossRef] [PubMed] [Green Version]
- Fereres, E.; Cruz-Romero, G.; Hoffman, G.J.; Rawlins, S.L. Recovery of orange trees following severe water stress. J. Appl. Ecol. 1979, 16, 833–842. [Google Scholar] [CrossRef]
- Conesa, M.R.; de la Rosa, J.M.; Domingo, R.; Bañón, S.; Pérez-Pastor, A. Changes induced by water stress on water relations, stomatal behaviour and morphology of table grapes (cv. Crimson Seedless) grown in pots. Sci. Hortic. 2016, 202, 9–16. [Google Scholar] [CrossRef]
- Mellisho, C.D.; Cruz, Z.N.; Conejero, W.; Ortuño, M.F.; Rodríguez, P. Mechanisms for drought resistance in early maturing cvar Flordastar peach trees. J. Agric. Sci. 2011, 149, 609–616. [Google Scholar] [CrossRef]
- Bhusal, N.; Lee, M.; Reum Han, A.; Han, A.; Kim, H.S. Responses to drought stress in Prunus sargentii and Larix kaempferi seedlings using morphological and physiological parameters. For. Ecol. Manag. 2020, 465, 118099. [Google Scholar] [CrossRef]
- Farooq, M.; Wahid, A.; Kobayashi, N.; Fujita, D.; Basra, S.M.A. Plant drought stress: Effects, mechanisms and management. Agron. Sustain. Dev. 2009, 29, 185–212. [Google Scholar] [CrossRef] [Green Version]
- Vile, D.; Garnier, É.; Shipley, B.; Laurent, G.; Navas, M.L.; Roumet, C.; Lavorel, S.; Díaz, S.; Hodgson, J.G.; Lloret, F.; et al. Specific leaf area and dry matter content estimate thickness in laminar leaves. Ann. Bot. 2005, 96, 1129–1136. [Google Scholar] [CrossRef]
- Egea, G.; Nortes, P.A.; González-Real, M.M.; Baille, A.; Domingo, R. Agronomic response and water productivity of almond trees under contrasted deficit irrigation regimes. Agric. Water Manag. 2010, 97, 171–181. [Google Scholar] [CrossRef]
- Sack, L.; John, G.P.; Buckley, T.N. ABA accumulation in dehydrating leaves is associated with decline in cell volume, not turgor pressure. Plant Physiol. 2018, 176, 489–493. [Google Scholar] [CrossRef] [Green Version]
- Ivanov, A.A. Response of wheat seedlings to combined effect of drought and salinity. In Stress Responses in Plants Mechanisms of Toxicity and Tolerance; Springer International Publishing: Cham, Switzerland, 2015; pp. 159–198. ISBN 9783319133683. [Google Scholar]
- Lawlor, D.W.; Cornic, G. Photosynthetic carbon assimilation and associated metabolism in relation to water deficits in higher plants. Plant Cell Environ. 2002, 25, 275–294. [Google Scholar] [CrossRef] [PubMed] [Green Version]
- Ehleringer, J.; Forseth, I. Solar tracking by plants. Science 1980, 210, 1094–1098. [Google Scholar] [CrossRef] [PubMed]
- Briglia, N.; Williams, K.; Wu, D.; Li, Y.; Tao, S.; Corke, F.; Montanaro, G.; Petrozza, A.; Amato, D.; Cellini, F.; et al. Image-based assessment of drought response in grapevines. Front. Plant Sci. 2020, 11, 1–12. [Google Scholar] [CrossRef] [PubMed]
- Wu, N.; Zhang, Y.M.; Downing, A.; Aanderud, Z.T.; Tao, Y.; Williams, S. Rapid adjustment of leaf angle explains how the desert moss, Syntrichia caninervis, copes with multiple resource limitations during rehydration. Funct. Plant Biol. 2014, 41, 168–177. [Google Scholar] [CrossRef] [PubMed] [Green Version]
- Hsiao, T.C. Plant responses to water stress. Annu. Rev. Plant Physiol. 1973, 24, 519–570. [Google Scholar] [CrossRef]
- Puerto, P.; Domingo, R.; Torres, R.; Pérez-Pastor, A.; García-Riquelme, M. Remote management of deficit irrigation in almond trees based on maximum daily trunk shrinkage. Water relations and yield. Agric. Water Manag. 2013, 126, 33–45. [Google Scholar] [CrossRef]
- Martínez-García, P.J.; Hartung, J.; de los Cobos, F.P.; Martínez-García, P.; Jalili, S.; Sánchez-Roldán, J.M.; Rubio, M.; Dicenta, F.; Martínez-Gómez, P. Temporal response to drought stress in several Prunus rootstocks and wild species. Agronomy 2020, 10, 1383. [Google Scholar] [CrossRef]
 ; 2019:
  ); MS (moderate stress; 2018:
  ; 2019:
  ); and SS (severe stress; 2018:
  ; 2019:
  ). Each point is the mean ± SE of 6 trees per treatment. *** correspond to p-values ≤ 0.001.
; 2019: ); MS (moderate stress; 2018: ; 2019: ); and SS (severe stress; 2018: ; 2019: ). Each point is the mean ± SE of 6 trees per treatment. *** correspond to p-values ≤ 0.001.
). Each point is the mean ± SE of 6 trees per treatment. *** correspond to p-values ≤ 0.001.
; 2019: ); MS (moderate stress; 2018: ; 2019: ); and SS (severe stress; 2018: ; 2019: ). Each point is the mean ± SE of 6 trees per treatment. *** correspond to p-values ≤ 0.001.
 ; 2019: ); MS (moderate stress; 2018: ; 2019: ); and SS (severe stress; 2018: ; 2019: ). Each point is the mean ± SE of 6 trees per treatment. ** and *** correspond to p-values ≤ 0.01 and 0.001.
; 2019: ); MS (moderate stress; 2018: ; 2019: ); and SS (severe stress; 2018: ; 2019: ). Each point is the mean ± SE of 6 trees per treatment. ** and *** correspond to p-values ≤ 0.01 and 0.001.
; 2019: ); MS (moderate stress; 2018: ; 2019: ); and SS (severe stress; 2018: ; 2019: ). Each point is the mean ± SE of 6 trees per treatment. ** and *** correspond to p-values ≤ 0.01 and 0.001.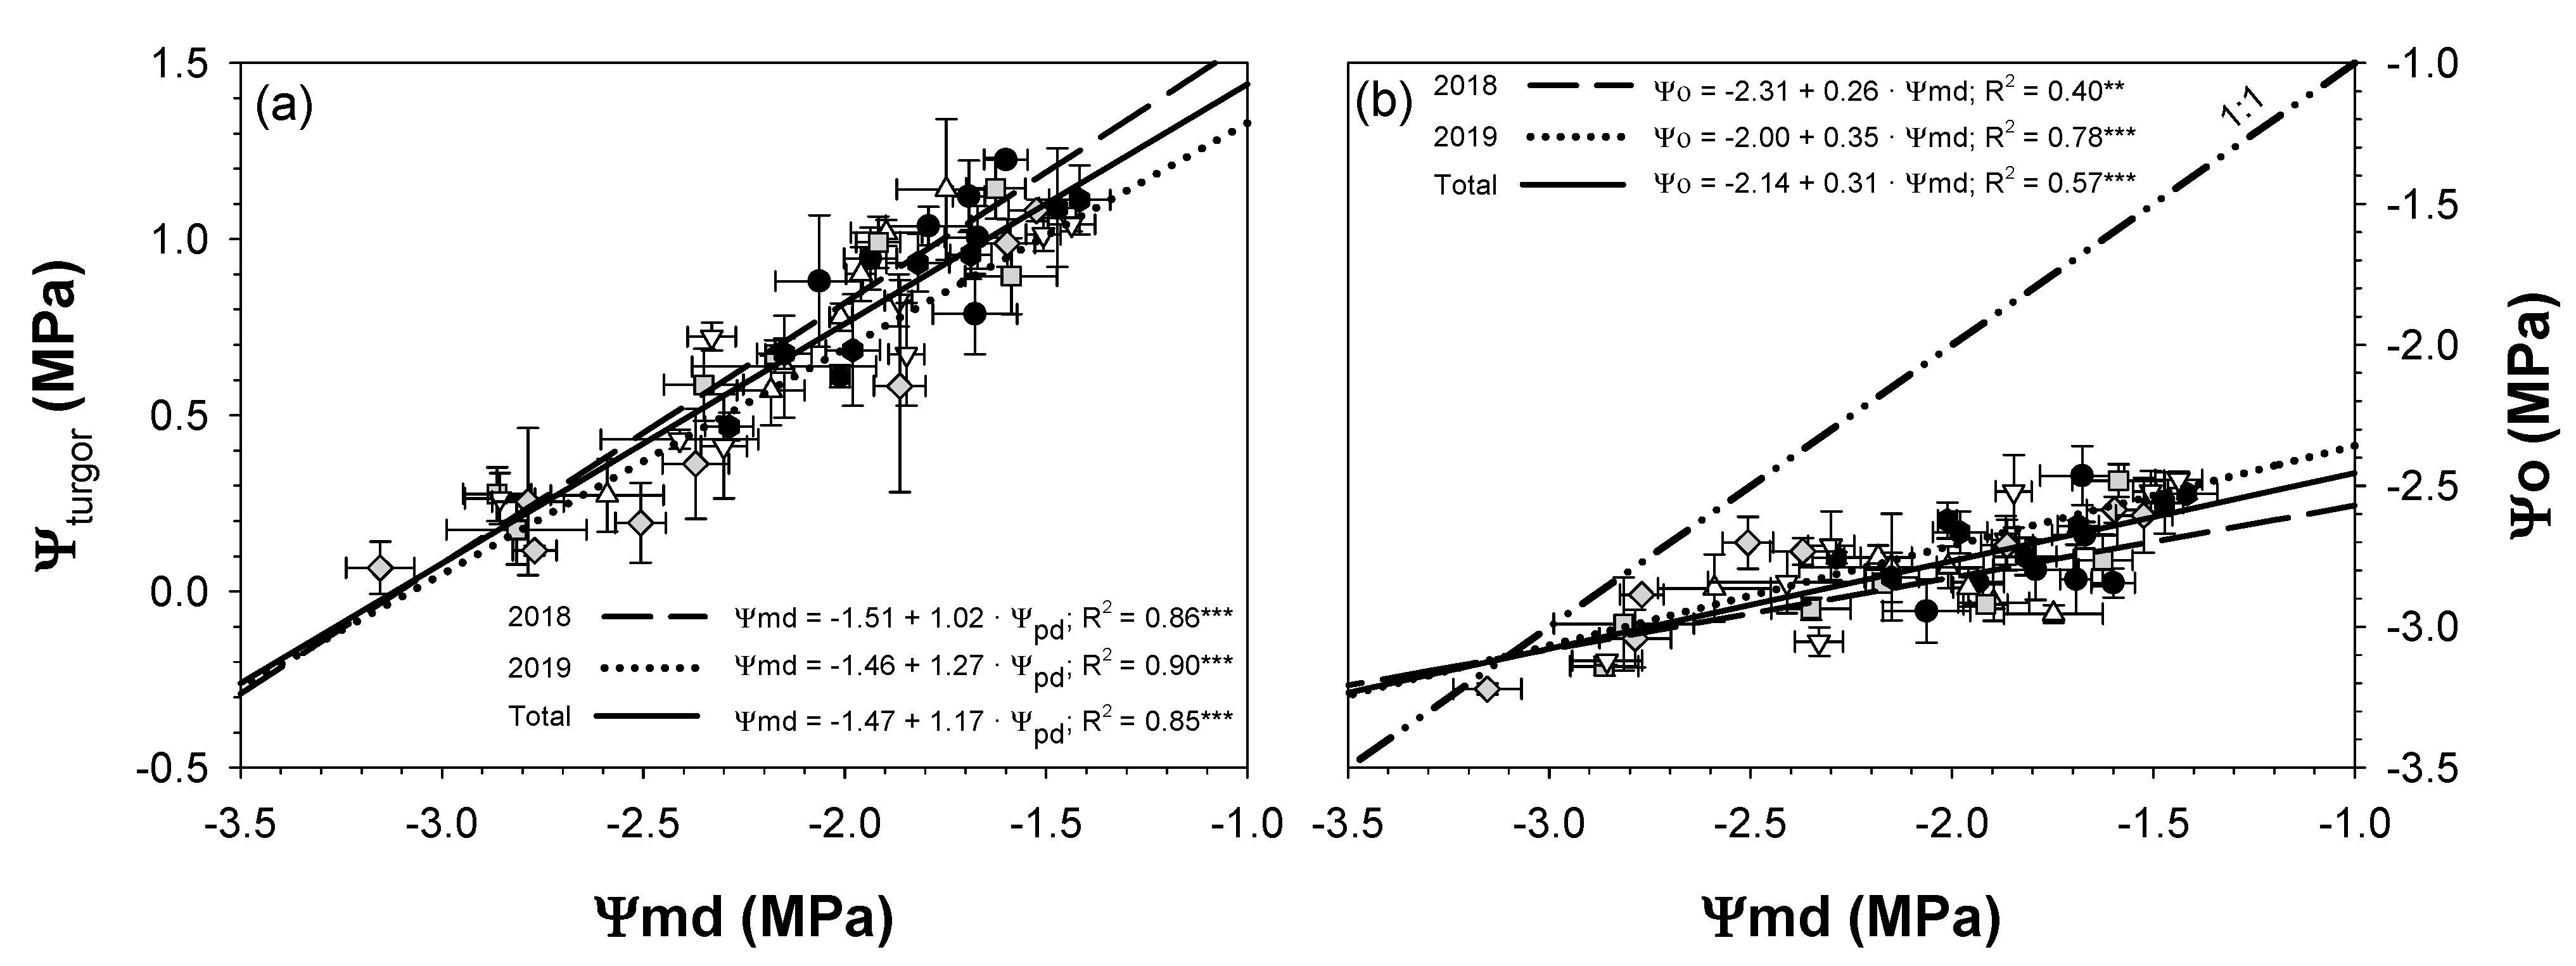

 ; 2019: ); MS (moderate stress; 2018: ; 2019: ); and SS (severe stress; 2018: ; 2019: ). Each point is the mean ± SE of 6 trees per treatment. *** correspond to p-values ≤ 0.001.
; 2019: ); MS (moderate stress; 2018: ; 2019: ); and SS (severe stress; 2018: ; 2019: ). Each point is the mean ± SE of 6 trees per treatment. *** correspond to p-values ≤ 0.001.
; 2019: ); MS (moderate stress; 2018: ; 2019: ); and SS (severe stress; 2018: ; 2019: ). Each point is the mean ± SE of 6 trees per treatment. *** correspond to p-values ≤ 0.001.


| Period | DOY | Treatment | DOY | Treatment | ||
|---|---|---|---|---|---|---|
| CTL | MS | CTL | SS | |||
| Full irrigation | 176 | 364.8 ± 40.8 a | 404.8 ± 23.4 a | 176 | 364.8 ± 40.8 a | 369.3 ± 23.3 a |
| First drought cycle | 186 | 416.3 ± 49.7 a | 228.8 ± 41.7 b | 197 | 401.3 ± 58.4 a | 180.5 ± 14.3 b |
| First recovery cycle | 207 | 350.3 ± 18.3 a | 365.7 ± 9.7 a | 207 | 350.3 ± 18.3 a | 346.3 ± 15.8 a |
| Mid-second drought cycle | - | - | - | 228 | 371.3 ± 27.3 a | 103.2 ± 6.7 b |
| Second drought cycle | 221 | 316.0 ± 13.7 a | 123.7 ± 16.8 b | 242 | 364.3 ± 37.5 a | 100.2 ± 13.5 b |
| Second recovery cycle | 242 | 364.3 ± 37.47 a | 351.7 ± 11.89 a | 268 | 347.7 ± 3.7 a | 329.5 ± 22.4 a |
| Variable | Year | CTL | MS | SS | ||
|---|---|---|---|---|---|---|
| TCSA | cm2 | Initial | 2018 | 19.29 ± 2.11 a | 20.52 ± 1.79 a | 19.90 ± 1.50 a |
| TCSA | cm2 | End | 2018 | 25.94 ± 2.15 a | 25.66 ± 1.86 a | 24.78 ± 1.62 a |
| ΔTCSA | cm2 | - | 2018 | 6.65 ± 0.21 a | 5.15 ± 0.13 b | 4.88 ± 0.12 b |
| TCSA | cm2 | Initial | 2019 | 27.59 ± 2.42 a | 29.67 ± 0.42 a | 26.71 ± 1.51 a |
| TCSA | cm2 | End | 2019 | 39.90 ± 3.39 a | 38.94 ± 0.55 a | 33.57 ± 2.07 b |
| ΔTCSA | cm2 | - | 2019 | 12.31 ± 0.98 a | 9.27 ± 0.41 b | 6.86 ± 0.57 c |
| CV | m3 tree−1 | Initial | 2019 | 1.10 ± 0.15 a | 1.03 ± 0.17 a | 0.94 ± 0.13 a |
| CV | m3 tree−1 | End | 2019 | 2.30 ± 0.16 a | 1.25 ± 0.18 b | 1.16 ± 0.12 b |
| ΔCV | m3 tree−1 | - | 2019 | 1.20 ± 0.17 a | 0.38 ± 0.12 b | 0.22 ± 0.02 b |
| PW | kg tree−1 | - | 2019 | 2.35 ± 0.44 a | 1.46 ± 0.48 ab | 0.85 ± 0.25 b |
| Variable | CTL | MS | SS |
|---|---|---|---|
| Number of leaves per tree | 1611.75 ± 83.74 a | 735.02 ± 80.94 b | 682.57 ± 172.55 b |
| Total leaf area (m2 tree−1) | 11.33 ± 0.59 a | 5.17 ± 0.57 b | 4.74 ± 1.20 b |
| LAI (m2 m−2) | 1.44 ± 0.07 a | 0.66 ± 0.07 b | 0.60 ± 0.15 b |
Publisher’s Note: MDPI stays neutral with regard to jurisdictional claims in published maps and institutional affiliations. |
© 2021 by the authors. Licensee MDPI, Basel, Switzerland. This article is an open access article distributed under the terms and conditions of the Creative Commons Attribution (CC BY) license (https://creativecommons.org/licenses/by/4.0/).
Share and Cite
Blaya-Ros, P.J.; Blanco, V.; Torres-Sánchez, R.; Domingo, R. Drought-Adaptive Mechanisms of Young Sweet Cherry Trees in Response to Withholding and Resuming Irrigation Cycles. Agronomy 2021, 11, 1812. https://doi.org/10.3390/agronomy11091812
Blaya-Ros PJ, Blanco V, Torres-Sánchez R, Domingo R. Drought-Adaptive Mechanisms of Young Sweet Cherry Trees in Response to Withholding and Resuming Irrigation Cycles. Agronomy. 2021; 11(9):1812. https://doi.org/10.3390/agronomy11091812
Chicago/Turabian StyleBlaya-Ros, Pedro José, Víctor Blanco, Roque Torres-Sánchez, and Rafael Domingo. 2021. "Drought-Adaptive Mechanisms of Young Sweet Cherry Trees in Response to Withholding and Resuming Irrigation Cycles" Agronomy 11, no. 9: 1812. https://doi.org/10.3390/agronomy11091812
APA StyleBlaya-Ros, P. J., Blanco, V., Torres-Sánchez, R., & Domingo, R. (2021). Drought-Adaptive Mechanisms of Young Sweet Cherry Trees in Response to Withholding and Resuming Irrigation Cycles. Agronomy, 11(9), 1812. https://doi.org/10.3390/agronomy11091812