Abstract
Barley grass (Hordeum spp.) is a short-lived annual weed which competes with preferred crop and pasture species and frequently contaminates wool and carcasses, and irritates the ears, eyes and noses of sheep. Barley grass, annual ryegrass (Lolium rigidum L.) and wild radish (Raphanus raphanistrum L.) are annual winter crop weeds which reduce grain yield through competition. In three consecutive years (2015 to 2017) cereal, legume and cereal/legume forage crops were grown and harvested in early October, late October or early November consistent with an early silage harvest (ES), late silage harvest (LS) or hay cut (H). A spring wheat cultivar was sown over each site in the following year (2016 to 2018). Weed density was recorded during the forage crop and wheat phases. Forage crop weed populations varied between years. Late paddock preparation for sowing in 2015 effectively eradicated barley grass from all forage crops; however, the competitiveness of legume and cereal/legume crops against annual ryegrass was reduced. In contrast, legume and cereal/legume mixtures tended to have higher barley grass densities than cereal crops in 2016 and 2017, when paddock preparation was earlier. Cutting in October 2015 reduced annual ryegrass and wild radish populations in 2016 wheat by 92.0% and 86.7%, respectively. In 2017 and 2018, regrowth and subsequent seed set following cutting appeared to negate cutting time effects for all crop and crop/legume combinations. Late paddock preparation, an early October forage harvest and effective regrowth control provided the best opportunity for barley grass, annual ryegrass and wild radish control in a single year.
1. Introduction
The traditional mixed farming areas of southern Australia are characterised by winter grain crops grown in rotation with a pasture phase with each phase between one and several years in length. Wheat (Triticum aestivum L.) is the predominant grain crop, but other significant crops include barley (Hordeum vulgare L.), oats (Avena sativa L.), triticale (x Triticosecale), canola (Brassica napus L.) and lupins (Lupinus angustifolia L.). The traditional method of pasture improvement in this region has been autumn sowing of subterranean clover (Trifolium subterraneum L.) [1,2].
Weed incursion occurs naturally during both the pasture and cropping phases, and the impact of weed incursion is dependent on relative abundance of propagules in the seedbank, the capacity of seeds to disperse into production areas (by wind, water or on livestock and machinery), management systems applied and competition between species present in the sown pasture or crop. The two main annual grass species that commonly self-establish in southern Australian pastures are barley grass (Hordeum spp.) and annual ryegrass (Lolium rigidum L.), both of which are highly competitive crop weeds [3,4,5,6]. Barley grass is a relatively short-lived annual that provides high-quality grazing early in the season, but its seed heads cause contamination of wool and sheep carcases. Additionally, seeds cause irritation to the mouth, eyes and nose of sheep and other grazing livestock [7,8,9,10], and it is also a host for cereal pathogens. Annual ryegrass is a desirable pasture plant, producing substantial yields of high-quality grazing, but it is also a major weed of broadacre winter crops [11]. Similarly, wild radish (Raphanus raphanistrum L.) is a major competitor in field crops [11], but of little importance in pastures where it is generally sporadic and eaten by livestock. These species were traditionally controlled by pasture and broadacre herbicides; however, the development of herbicide resistance, particularly in annual ryegrass, has dramatically reduced herbicide efficacy [4,8,12,13,14]. As a consequence, there are populations of these species which cannot be controlled with commonly used herbicides [12,14,15], which has necessitated the investigation and use of alternative weed control strategies.
The transition from pasture to cropping, or vice versa, provides a unique opportunity to evaluate alternative control methods suitable for mixed farming systems. Establishment of competitive crops can effectively suppress the growth of undesirable species [16,17], and mowing or cutting removes seed heads and can reduce overall seed set [18]. In combination, the use of competitive crops, which are grown for forage and cut for hay or silage, has reduced annual ryegrass in the subsequent wheat crop [18,19]. It has also been stated that cutting for silage improves pasture composition in the next year by promoting legume content and reducing weed content [20]. Silage requires less wilting to achieve the target dry matter (DM) content compared to hay (35–50% vs. 87–90%); and can be produced earlier in spring than hay, when weather conditions are less favourable. Consequently, weeds are less mature when cut for silage compared to hay. However, there are very few studies which have quantified the effect of forage harvesting and the timing of forage harvesting on subsequent weed populations.
In this study, a range of forage crops was harvested to test the hypothesis that cutting for silage reduces weed density the following year in comparison to cutting for hay. Differences in weed content of the various forage crop types, and the impact of forage crop type on weed density the following year, were also assessed. This study generated critical information on the effect of forage harvesting on subsequent weed infestations. This information will assist farmers and advisors to make strategic decisions on the implementation of alternative means of weed control.
2. Materials and Methods
A replicated experiment was conducted at the Wagga Wagga Agricultural Institute (35°04′ S, 147°36′ E) on a pasture paddock, which was established by sowing subterranean clover more than 5 years previously. Soil type was a fine red sodosol [21]. The paddock was adjacent to an area used in a concurrent experiment to investigate the effect of forage harvesting on pasture composition [22]. Baseline composition of the pasture was determined on 20 August 2015 from a location adjacent to the experimental area within the paddock and comprised 68% subterranean clover with 19% grass, 11% broadleaf and 2% miscellaneous species. The latter were observed to consist principally of annual ryegrass, barley grass, shepherd’s purse (Capsella bursa-pastoris L.) and capeweed (Arctotheca calendula L. Levyns).
A range of winter cereal crops including barley cvv. Compass, Urambie, Hindmarsh; oats cvv. Mannus, Eurabbie; wheat cvv. Gregory, Wedgetail; triticale cv. Endeavour; cereal rye (Secale cereal L.); winter legume crops including field peas (Pisum sativum L.) cv. Morgan and purple vetch (Vicia benghalensis L.) cv. Popany, were sown as monocultures or mixtures (cereal/legume crops) in three consecutive years (Table 1). These species and cultivars were selected to provide examples of crop types currently grown for forage in southern Australia and would present probable differences in competitiveness between cultivars [23].

Table 1.
Sowing rates and germination counts for winter forage crops grown in 2015–2017 at Wagga Wagga, NSW.
In 2017, the number of forage crops sown for evaluation was reduced due to limited remaining area suitable for crop establishment in the paddock. Cereal rye was removed from the experiment because of very low forage quality in 2015 and 2016; thus, we excluded rye as a viable conservation option in this region. Additionally, one oat, wheat and barley cultivar (i.e., Eurabbie oats, Gregory wheat and Hindmarsh barley) were removed. However, Urambie barley was included for comparison in 2017 based on our observations that it was particularly competitive and suppressive of weeds [24].
Experiments were situated adjacent to each other in the same paddock. Each experimental site was prepared in autumn of that year by application of glyphosate (Roundup® 450; 450 g/L a.i) at 2 L/ha (2015), 1.5 L/ha (2016) or 1.6 L/ha (2017), prior to cultivation. Glyphosate was selected as the most appropriate herbicide for postemergence control of the weed and pasture species present, predominantly barley grass and annual ryegrass. Additionally, glyphosate has limited soil residual activity and therefore would not adversely impact subsequent forage crop establishment. Forage crops were sown on 8 June 2015, 24 May 2016 and 5 June 2107 with 105 kg/ha of Pivot Starter 15® fertiliser (14.2% N; 12.9% P; 10.7% S). Plots were 3.1 m wide by 18 m long and consisted of 18 rows with a 17 cm row spacing. Treatments were allocated to plots in a randomised complete block design, with four replicates. Due to size constraints imposed by cultivation equipment, it was not possible leave a randomly allocated uncultivated area adjacent to each treatment within the experimental site. However, one control plot per replicate, designated ‘Pasture’, was left unsown to quantify the baseline level of invasive species for comparison with the sown crops. Forage crop and weed establishment in each plot were determined on 15 August 2015, 4 June 2016 and 16 August 2017, by counting total plants in four 50 cm by 17 cm wide quadrats across treatment rows.
Forage crops were harvested at three times during the growing season, consistent with industry practice for early silage, late silage and hay for that region; hereafter referred to as ES, LS and H. Harvest times varied between years, in response to seasonal conditions (Table 2). All plots within a replicate were situated horizontally within the same row and divided into three equal sections (subplots) longitudinally. Harvesting and removal of forage was achieved using a commercial mower and rake. This necessitated harvesting the same section of all plots within each replicate to avoid damage to other plots from machinery, and the middle section of each plot was never harvested first. Apart from this limitation, the section harvested within each block was randomly allocated.
Table 2.
Harvest dates of forage crops grown in 2015–2017 at Wagga Wagga, NSW, and forage harvested at three times.
Prior to the harvest, each crop was sampled by cutting a single 45 cm wide section across the plot, approximately 5 cm above ground level to simulate standard commercial cutting height, using an Allen scythe. The harvested sample was weighed, thoroughly mixed subsampled, and this subsample was subsequently split into two subsamples. The first subsample was chopped using a commercial plant mulcher (Hansa®) and was subsequently subsampled. This subsample was dried in a fan forced oven at 80°C for 24 h to determine DM content. The second subsample was used to determine botanical composition.
Wheat treated with 4.5 L/t Jockey® (Fluquinconazole 167 g/L) was sown over all plots at the rate of 60 kg/ha in the following year with 120 kg/ha MAP (10% N; 21.9% P). Sowing dates were 24 May 2016, 5 June 2017 and 20 July 2018 and the cultivars used were Lancer in 2016, and Condo in 2017 and 2018. Weed numbers were determined in four 0.1 m2 quadrats per subplot, on 23 May 2016, 20 April 2017 and 3 July 2018 prior to sowing the wheat. An additional weed count was conducted on 26 July 2016 to account for a second germination of wild radish and fumitory (Fumaria spp.).
Wagga Wagga rainfall data were obtained from the Australian Bureau of Meteorology (http://www.bom.gov.au/climate/data/ accessed on 20 July 2021). Rainfall during the period May to November inclusive exceeded the long-term average (358.0 mm) in 2015 (443.6 mm) and 2016 (607.0 mm) but was less than average in 2017 (234.7 mm) (Table 3).
Table 3.
Monthly long-term average rainfall and temperature and rainfall and temperature during the experimental period at the Wagga Wagga Airport Meteorological Office (Australian Bureau of Meteorology).
Data were categorised into cereal, legume, cereal/legume and pasture forage types. Statistical analyses of the harvest data were conducted using the REML directive in Genstat (ver 20.1) [25]. Forage crop type, harvest, year and all interactions were fixed effects, and crop within type and replicate and plot within year were the random effects. Plant counts were modelled similarly with the addition of a heterogeneous variance structure to accommodate an observed seasonal effect on experimental error, in that seasons with low plant counts had low levels of plot to plot variation compared to seasons with high plant counts. Species presenting counts of zero in all plots within a season were excluded from the analysis. The models were used to estimate mean count for the crops within each season along with standard errors of the means and these are presented graphically. Only data for years when species counts were successfully observed are presented. Plant count analysis was conducted in the R environment with particular use of the ASReml package [26,27].
3. Results
Sown species germination counts in 2015, 2016 and 2017 are presented in Table 1 for each individual forage type. Volunteer plant species present in the forage and subsequent wheat crops included annual ryegrass, wild radish, clover species (Trifolium spp.), barley grass, annual medic species (Medicago spp.), wireweed (Polygonum aviculare L.), capeweed and fumitory, and lesser amounts of other broadleaf and grass weeds. Species observed in very low numbers were not recorded or removed during the statistical analyses.
3.1. Forage Crop Weed Counts
The most prevalent volunteer species was annual ryegrass, which was present at 275, 237 and 163 plants/m2 in 2015, 2016 and 2017, respectively (Figure 1). Annual ryegrass seedling density was consistently lower (p < 0.05) for all forage types in 2017 compared to 2015 and did not vary with forage type. However, in 2015, annual ryegrass density was higher for pasture and legume than for cereal/legume. In 2016, annual ryegrass density was higher (p < 0.05) for pasture than other forage types; and higher (p < 0.05) than in 2017 for pasture, cereal and legume forage types.
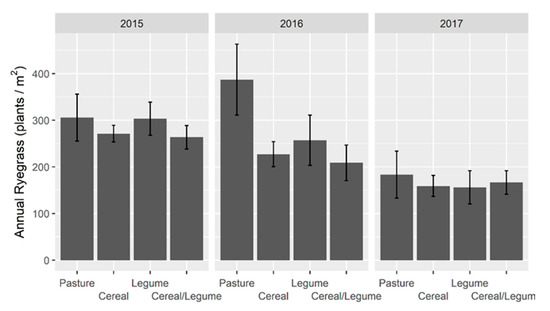
Figure 1.
Annual ryegrass seedling density (plants/m2) in winter forage crops grown in 2015–2017 at Wagga Wagga, NSW. Data displayed as the mean ± 2 × standard error (length of line in each direction).
Barley grass seedlings were evaluated in the 2016 (7.5 plants/m2) and 2017 (11.6 plants/m2) forage crops (Figure 2). Barley grass seedling density was higher (p < 0.05) for legume than cereal/legume and higher (p < 0.05) for pasture than both cereal and cereal/legume in 2016. Additionally, barley grass density was higher (p < 0.05) for legume and pasture than cereal and cereal/legume crops in 2017, and higher (p < 0.05) for legume forages in 2017 compared to 2016.
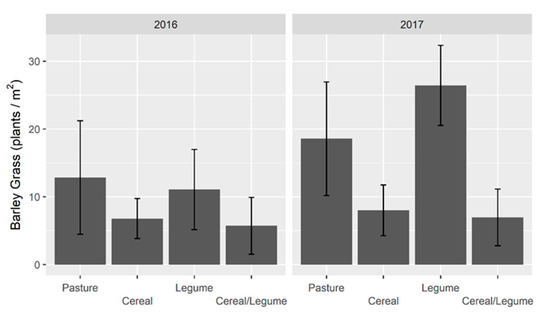
Figure 2.
Barley grass seedling density (plants/m2) in winter. forage crops grown in 2015–2017 at Wagga Wagga, NSW. Data displayed as the mean ± 2 × standard error (length of line in each direction).
3.2. Forage Crop Yield and Species Composition
Total forage yield varied between years, consistent with rainfall differences. Forage crop yield varied with the forage crop × harvest × year interaction (p < 0.001: Table 4). Yields of individual forage crops in 2016 were higher (p < 0.05) than most comparable harvests in 2015 and all comparable harvests in 2017. Yield increased after the ES harvest for all forage crops in 2016, five forages in 2015 and none in 2017, and was again associated with rainfall.
Table 4.
Yield (kg DM/ha) of forage crops grown in 2015–2017 at Wagga Wagga, NSW, and forage harvested as early silage (ES), late silage (LS) or hay (H).
Annual ryegrass content as a proportion (g/kg) of total yield varied with the forage crop × harvest (p = 0.001; Table 5), forage crop × year (p < 0.001; Table 5) and year × harvest (p = 0.022, Table 6) interactions. Annual ryegrass content of pasture was higher (p < 0.05) than all other forages with the exception of legumes in 2017, and lower (p < 0.05) in 2016 than 2017 for all forage types. Annual ryegrass content in 2015 varied relative to 2016 and 2017 such that content was higher (p < 0.05) in 2015 compared to 2016 and 2017 for cereals; higher (p < 0.05) than 2016 and similar to 2017 for cereal/legume; and lower (p < 0.05) than 2017 and similar to 2016 for legume and pasture. Pasture had the highest (p < 0.05) annual ryegrass content of all forage types at all harvests, while annual ryegrass content of legumes was higher (p < 0.05) than cereal at all harvests and cereal/legume at ES and LS. Annual ryegrass content differed (p < 0.05) between years for all harvests such that 2017 > 2015 > 2016.
Table 5.
Annual ryegrass and barley grass content (g/kg) of forage crops grown in 2015, 2016 and 2017, and forage harvested as early silage (ES), late silage (LS) or hay (H) at Wagga Wagga NSW (crop × year).
Table 6.
Annual ryegrass and barley grass content (g/kg) of forage crops grown in 2015, 2016 and 2017, and forage harvested as early silage (ES), late silage (LS) or hay (H) at Wagga Wagga NSW (year × harvest).
Barley grass content as a proportion (g/kg) of total yield varied with the forage crop × year (p < 0.001; Table 5) and year × harvest (p < 0.001, Table 6) interactions. Barley grass content was higher (p < 0.05) in 2016 and 2017 compared to 2015 forage types, except for the comparison between 2015 and 2016 for cereal. Similarly, barley grass content was higher (p < 0.05) in 2016 and 2017 compared to 2015 at all harvests.
Other weed species were present in trace quantities, usually less than 10 g/kg (DM basis), and were typically sporadically distributed across the forage crops and harvests. These included wild radish, subterranean clover, annual medics, wireweed, capeweed (Arctotheca calendula L.), soft brome (Bromus hordaceaus L.), silvergrass (Vulpia spp.), shepherd’s purse (Capsella bursa-pastoris L.), chickweed (Stellaria media (L.) Vill.), Indian hedge mustard (Sysimbrium orientale L.), wild oats (Avena fatua L.) and rough poppy (Papaver hybridum L.).
3.3. Post-Harvest (Wheat Crop) Weed Numbers
Annual ryegrass density was lower (p < 0.05) for all harvests following forage crops in 2016 compared to either 2015 or 2017 (Figure 3), and there was a significant (p < 0.001) year × harvest interaction. The largest contrast occurred post 2015, when density was higher (p < 0.05) after H (838 plants/m2) compared to ES (76 plants/m2) and LS (134 plants/m2) for all crop types, which was a reduction of 90.9% and 84.0%, respectively.
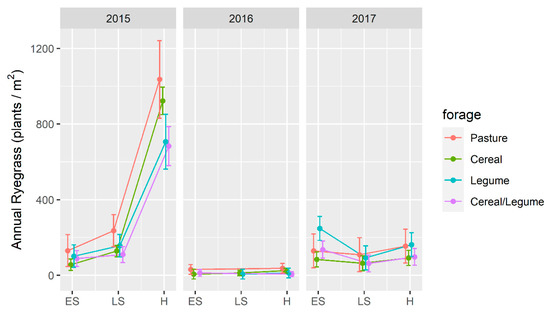
Figure 3.
Annual ryegrass plant density (plants/m2) in a wheat crop in the year following winter forage crops grown at Wagga Wagga, NSW compared to an unsown pasture. Forage crops were grown in 2015–2017, and harvested as early silage (ES), late silage (LS) or hay (H). Data displayed as the mean (•) ± 2 × standard error (length of line in each direction).
Post-harvest barley grass density (Figure 4) similarly differed (p < 0.001) with the year × harvest interaction and was higher following the 2016 and 2017 compared to the 2015 forage crops. The highest incidence (p < 0.05) of barley grass was observed following H in 2016 and was higher than observed for either ES or LS, which reduced barley grass density by 72% in the following year. In contrast, density was unaffected by harvest following the 2015 and 2017 forage crops.
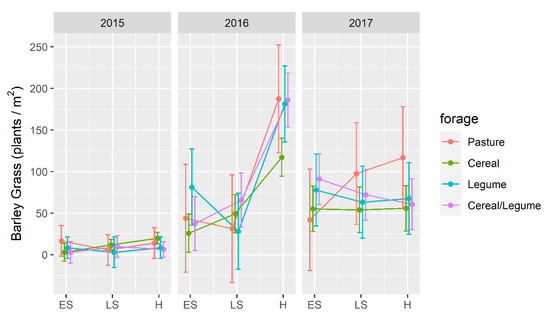
Figure 4.
Barley grass density (plants/m2) in a wheat crop in the year following winter forage crops grown at Wagga Wagga, NSW compared to an unsown pasture. Forage crops were grown in 2015–2017, and harvested as early silage (ES), late silage (LS) or hay (H). Data displayed as the mean (•) ± 2 × standard error (length of line in each direction).
Wild radish was present in wheat crops following forage crops in 2015 (Figure 5), with density significantly higher (p < 0.05) following H compared to ES and LS for both cereal and cereal/legume forages. Overall, we observed a reduction in wild radish for all treatments not unlike that observed with annual ryegrass; however, there was marked variability in wild radish density at the H harvest which reduced the likelihood of a significant effect.
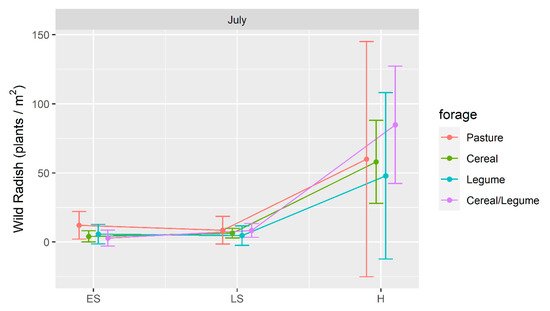
Figure 5.
Wild radish plant density (plants/m2) present in a wheat crop following winter forage crops grown at Wagga Wagga, NSW in 2015 compared to an unsown pasture. Forage crops were harvested as early silage (ES), late silage (LS) or hay (H). Data displayed as the mean (•) ± 2 × standard error (length of line in each direction).
4. Discussion
Variation in weed and forage crop density was dependent on year in addition to management or treatment effects. Density of the major weed species in forage crops was generally lower or similar to the unsown control pasture treatment. The hypothesis that an early silage harvest reduced subsequent weed infestation compared to a hay harvest was consistent with our data for annual ryegrass and barley grass following forage crops in 2015 and 2016, respectively; however, results in 2017 and for other weed species were equivocal. We also observed that the level of weed infestation varied among forage crop treatments, but differences were not consistent and were of lesser magnitude than significant harvest time effects.
Interestingly, an earlier silage harvest was more conducive to subsequent forage crop and weed species regrowth and seed set, and the need to control post-harvest regrowth to prevent production of viable weed seed was also previously reported [28]. The extent of regrowth seed set is typically dependent on plant vigour, competition from other species and environmental conditions, principally available soil moisture. In 2015, regrowth was restricted by dry conditions with less than 40 mm of rainfall during September and October. However, in 2017, we attribute the lack of harvest time differences following forage crops to more favourable moisture conditions in October, and significant regrowth which later produced viable seed. Therefore, our experimental results confirm the importance of follow up post-harvest weed control measures (e.g., spray topping or heavy grazing) to reduce subsequent weed seed set following cutting or grazing. In general, we found that seed shatter occurred prior to or during the H silage harvest, which explained the minimal impact on seed removal; and consequently, there was no impact on the weed seedbank and subsequent establishment the following year.
Barley grass density was higher in the 2016 and 2017 legume crops than in the cereal and cereal/legume crops and we concluded that this was due to the cereal component suppressing germination. From this, we inferred that a low rate of cereal establishment may be sufficient to effectively suppress barley grass germination, though further research is needed to confirm this. The higher barley grass density was reflected in higher barley grass biomass in legume compared to cereal crops at harvest, but not in the cereal/legume crops, and we postulate that reduced seedling vigour of the legume plants compared to cereals and barley grass allowed the barley grass plants in the cereal/legume crops to compensate for lower seedling density. Similarly, in 2016 and 2017, the biomass of annual ryegrass in legume crops was higher than in cereal crops.
Our findings are consistent with other reports that found field peas were less vigorous competitors than either wheat or annual ryegrass [29,30]. Legume and cereal/legume crops sown in late autumn/early winter are therefore at a competitive disadvantage but are also less susceptible to lodging than crops sown earlier and have accumulated greater biomass prior to harvest. Lodging is detrimental to forage quality due to the accumulation of decaying matter and can also adversely affect silage fermentation quality and stability [31]. Additionally, growing legume crops in mixtures with cereals provides feed quality advantages by increasing protein content which benefits livestock [32,33,34].
Annual ryegrass content in the forage crops was lowest in 2016 when forage crop yields were higher, which is also consistent with previous reports that vigorous crop growth will result in weed suppression due to competitive interference [16,29,35]. Further support for this conclusion can be drawn from the pasture treatments which exhibited limited competition but contained a similar proportion of annual ryegrass in 2016 as in 2015. Furthermore, the biomass of annual ryegrass in 2016 pasture was higher than in either 2015 or 2017 pasture. However, this result needs to be considered in the context of 2017, a drought year, in which overall annual ryegrass density was low compared to 2016 and 2018. It is possible that low available moisture content may have limited germination of annual weed species. This may have been responsible, at least in part, for the lack of harvest time effects or a difference between pasture and the forage crops on annual ryegrass density in wheat. Such results further reinforce significant seasonal differences and the importance of monitoring regrowth when considering weed management strategies.
Potential carryover effects of crop type on annual ryegrass and barley grass seedling density in the following wheat crop were present on several occasions, but there was no clear effect of either weed density or biomass in the forage crop on subsequent weed populations. These results highlight the complexity of interpreting carryover effects of forage crop type in the context of variable harvest times on the weed seedbank and the need for further research to elucidate these interactions. Variation due to regional growing conditions and forage cultivar differences should be further examined.
The absence of barley grass in the 2015 forage crops was likely due to the timing of the paddock preparation prior to sowing, which successfully eradicated the barley grass that previously germinated, and no further germination was noted subsequently. This is consistent with the findings that barley grass seeds exhibit little or no dormancy, and will germinate readily once seasonal conditions are suitable; consequently, barley grass seeds do not persist in the seedbank [36]. Therefore, forage crops sown later in the season could provide an opportunity for barley grass control in autumn, which may provide longer term benefits in reducing barley grass infestation in subsequent years.
The feed quality of annual ryegrass and wild radish in October was potentially similar to that provided by a cereal or legume forage, and therefore inclusion of such weeds in fodder would not have adversely affected livestock production and weight gain when fed to sheep and cattle [37]. Therefore, strategic harvesting may prove a viable option for producing a reserve of stored fodder while also reducing annual ryegrass and wild radish in the subsequent year, provided seed set is limited and removal occurs. Barley grass can similarly be removed by an early harvest; however, an earlier harvest for barley grass is recommended than for annual ryegrass or wild radish because of variable phenology and maturity in these species [22]. It is also necessary to consider the potential risks of the presence of mature barley grass seed heads in fodder on animal health as awns can cause mouth lesions and irritate eyes [20]. Similarly, it is also necessary to consider potential detrimental effects on livestock of consuming conserved crops or pastures that contain toxic plants [37]. A multitude of toxic plants occur in different environments globally and, in the absence of data to the contrary, it should be assumed that conservation as either hay or silage does not alter the toxic status of these plants [38].
Our results show that weed control benefits occur from forage conservation as silage in contrast to hay. Furthermore, feed quality of forage crops harvested in early spring is higher than in late spring, and capable of supporting higher growth rates in sheep and cattle [39]. Additionally, conservation of forage as silage significantly reduces the viability of most weed seeds, with a further reduction due to digestion by ruminants [40].
5. Conclusions
Later sowing provided an opportunity for autumn control of barley grass; however, the competitiveness of legume and cereal/legume crops against annual ryegrass was reduced. Harvesting forage crops in early October as silage resulted in removal of both annual ryegrass and wild radish and reduced their prevalence in the subsequent year, provided that post-harvest regrowth control was successful in prevention of further seed set. A strategic forage harvest within an integrated weed control strategy should potentially reduce reliance on herbicides for control of annual ryegrass and wild radish. A late autumn sowing combined with an early October forage harvest and regrowth control provided the best opportunity for barley grass, annual ryegrass and wild radish control in a single year, and also generated a forage resource for livestock production and ability to offset feed deficits. Further research to investigate seasonal, regional and varietal impacts on forage quality is needed to quantify the effects of forage crop harvest time and crop type on the weed seedbank over time.
Author Contributions
Conceptualization, methodology.; project administration and funding acquisition, J.W.P. and L.A.W.; formal analysis and data curation, S.G.M. and J.W.P.; writing—original draft preparation, J.W.P.; writing—review and editing, J.W.P., L.A.W. and S.G.M.; supervision, J.W.P. and L.A.W. All authors have read and agreed to the published version of the manuscript.
Funding
This research received funding from Meat & Livestock Australia through support provided in project B. WEE 0146.
Institutional Review Board Statement
Not applicable.
Informed Consent Statement
Not applicable.
Data Availability Statement
All relevant data is contained within the paper. Contact the corresponding author if further ex-planation is required.
Acknowledgments
We acknowledge the support provided by the NSW Department of Primary Industries, Charles Sturt University and the Graham Centre for Agricultural Innovation.
Conflicts of Interest
The authors declare no conflict of interest.
References
- Wolfe, E.C. Country Pasture/Forage Resource Profiles; Food and Agriculture Organisation of the United Nations: Rome, Italy, 2009. [Google Scholar]
- Wolfe, E.C.; Dear, B.S. The population dynamics of pastures with particular reference to southern Australia. In Competition and Succession in Pastures; Tow, P., Lazenby, A., Eds.; CAB International: Wallingford, UK, 2001; pp. 119–148. [Google Scholar]
- Bowcher, A.J. Competition between Temperate Perennial Pasture Species and Annual Weeds: The Effect of Pasture Management on Population Dynamics and Resource Use. Ph.D. Thesis, Charles Sturt University, Wagga Wagga, Australia, 2002. [Google Scholar]
- Broster, J.C.; Pratley, J.E. A decade of monitoring herbicide resistance in Lolium rigidum in Australia. Aust. J. Exp. Agric. 2006, 46, 1151–1160. [Google Scholar] [CrossRef]
- Eslami, S.V.; Gill, G.S.; Bellotti, B.; McDonald, G. Wild radish (Raphanus raphanistrum) interference in wheat. Weed Sci. 2006, 54, 749–756. [Google Scholar] [CrossRef]
- Kemp, D.R.; King, W.M. Plant competition in pastures. In Competition and Succession in Pastures; Tow, P., Lazenby, A., Eds.; CAB International: Wallingford, UK, 2001; pp. 85–102. [Google Scholar]
- Smith, D.F. The growth of barley grass (Hordeum leporinum) in annual pasture 1. Germination and establishment in comparison with other annual species. Aust. J. Exp. Agric. Anim. Husb. 1968, 8, 478–482. [Google Scholar] [CrossRef]
- Cocks, P.S.; Donald, C.M. The germination and establishment of two annual pasture grasses (Hordeum leporinum Link and Lolium rigidum Gaud.). Aust. J. Agric. Res. 1973, 24, 1–10. [Google Scholar] [CrossRef]
- Kelly, J.E.; Quinn, J.C.; Loukopoulos, P.; Broster, J.C.; Behrendt, K.; Weston, L.A. Seed contamination in sheep: New investigations into an old problem. Anim. Prod. Sci. 2018, 58, 1538–1544. [Google Scholar] [CrossRef]
- Kelly, J.E.; Quinn, J.C.; Nielsen, S.G.; Weston, P.; Broster, J.C.; Weston, L.A. Causative factors influencing epizoochorous dispersal of weed seeds by sheep and associated carcass contamination in southern Australia. Weed Res. 2020, 60, 221–231. [Google Scholar] [CrossRef]
- Llewellyn, R.; Ronning, D.; Clarke, M.; Mayfield, A.; Walker, S.; Ouzman, J. Impact of Weeds on Australian Grain Production: The cost of Weeds to Australian Grain Growers and the Adoption of Weed Management and Tillage Practises; Report for the Grains Research and Development Corporation and the Commonwealth Scientific and Industrial Research Organisation; Grains Research and Development Corporation and the Commonwealth Scientific and Industrial Research Organisation: Canberra, Australia, 2016. [Google Scholar]
- Owen, M.J.; Martinez, N.J.; Powles, S.B. Multiple herbicide-resistant Lolium rigidum (annual ryegrass) now dominates across the Western Australian grain belt. Weed Res. 2014, 54, 314–324. [Google Scholar] [CrossRef]
- Powles, S.B. Evolved glyphosate-resistant weeds around the world: Lessons to be learnt. Pest Manag. Sci. 2008, 64, 360–365. [Google Scholar] [CrossRef]
- Walsh, M.J.; Powles, S.B. Management strategies for herbicide-resistant weed populations in Australian dryland crop production systems. Weed Technol. 2007, 21, 332–338. [Google Scholar] [CrossRef]
- Owen, M.J.; Martinez, N.J.; Powles, S.B. Multiple herbicide-resistant wild radish (Raphanus raphanistrum) populations dominate Western Australian cropping fields. Crop. Pasture Sci. 2015, 66, 1079–1085. [Google Scholar] [CrossRef]
- Lemerle, D.; Verbeek, B.; Orchard, B. Ranking the ability of wheat varieties to compete with Lolium rigidum. Weed Res. 2001, 41, 197–209. [Google Scholar] [CrossRef]
- Lemerle, D.; Luckett, D.J.; Lockley, P.; Koetz, E.; Wu, H.W. Competitive ability of Australian canola (Brassica napus) genotypes for weed management. Crop. Pasture Sci. 2014, 65, 1300–1310. [Google Scholar] [CrossRef]
- Gill, G.S.; Holmes, J.E. Efficacy of cultural control methods for combating herbicide-resistand Lolium rigidum. Pestic. Sci. 1997, 51, 352–358. [Google Scholar] [CrossRef]
- Burnett, V.; Enshaw, T.; Sutherland, S. Advances in weed management for organic cereal production in southeast Australia. In Proceedings of the Researching Sustainable Systems, First Scientific Conference of the International Society of Organic Agriculture Research, Adelaide, Australia, 21–23 September 2005. [Google Scholar]
- Kaiser, A.G.; Doonan, B.M.; Bowcher, A.J. Silage as a pasture management tool. In Successful Silage; Kaiser, A., Piltz, J., Burns, H., Griffiths, N., Eds.; NSW Department of Primary Industries: Orange, NSW, Australia, 2004. [Google Scholar]
- Isbell, R. The Australian Soil Classification. Australian Soil and Land Survey Handbook; CSIRO Publishing: Melbourne, Australia, 1996; Volume 4. [Google Scholar]
- Piltz, J.W.; Flinn, S.J.; Weston, L.A. Comparative effects of grazing, herbicide or forage conservation on barley grass content in Trifolium subterraneum L. clover-based pasture. Crop. Pasture Sci. 2019, 70, 800–806. [Google Scholar] [CrossRef] [Green Version]
- Latif, S.; Gurusinghe, S.; Weston, P.A.; Brown, W.B.; Quinn, J.C.; Piltz, J.W.; Weston, L.A. Performance and weed-suppressive potential of selected pasture legumes against annual weeds in south-eastern Australia. Crop. Pasture Sci. 2019, 70, 147–158. [Google Scholar] [CrossRef] [Green Version]
- Mwendwa, J.M.; Brown, W.B.; Wu, H.W.; Weston, P.A.; Weidenhamer, J.D.; Quinn, J.C.; Weston, L.A. The weed suppressive ability of selected Australian grain crops; case studies from the Riverina region in New South Wales. Crop. Prot. 2018, 103, 9–19. [Google Scholar] [CrossRef]
- Genstat for Windows, 20th ed.; VSN International Limited: Hemel Hempstead, UK, 2020.
- R Core Team. R: A Language and Environment for Statistical Computing; R Foundation for Statistical Computing: Vienna, Austria, 2020. [Google Scholar]
- Butler, D.G.; Cullis, B.R.; Gilmour, A.R.; Gogel, B.G.; Thompson, R. ASReml-R Reference Manual Version 4; VSN International: Hemel Hempstead, UK, 2017. [Google Scholar]
- Burnett, V.; Enshaw, T.; Sutherland, S. Forage management effects on annual ryegrass density and cereal grain yields. In Proceedings of the Managing Weeds in a Changing Climate, Fifteenth Australian Weeds Conference, Adelaide, Australia, 24–28 September 2006. [Google Scholar]
- Lemerle, D.; Verbeek, B.; Coombes, N. Losses in grain yield of winter crops from Lolium rigidum competition depend on crop species, cultivar and season. Weed Res. 1995, 35, 503–509. [Google Scholar] [CrossRef]
- McDonald, G.K. Competitiveness against grass weeds in field pea genotypes. Weed Res. 2003, 43, 48–58. [Google Scholar] [CrossRef]
- Griffiths, N.W.; Mickan, F.J.; Kaiser, A.G. Crops and by-products for silage. In Successful Silage; Kaiser, A., Piltz, J., Burns, H., Griffiths, N., Eds.; NSW Department of Primary Industries: Orange, NSW, Australia, 2004. [Google Scholar]
- Moreira, N. The Effect of Seed Rate and Nitrogen-Fertilizer on the Yield and Nutritive-Value of Oat Vetch Mixtures. J. Agric. Sci. 1989, 112, 57–66. [Google Scholar] [CrossRef]
- Roberts, C.A.; Moore, K.J.; Johnson, K.D. Forage Quality and Yield of Wheat-Vetch at Different Stages of Maturity and Vetch Seeding Rates. Agron. J. 1989, 81, 57–60. [Google Scholar] [CrossRef]
- Karagic, D.; Mikic, A.; Milosevic, B.; Vasiljevic, S.; Dusanic, N. Common vetch-wheat intercropping: Haylage yield and quality depending on sowing rates. Afr. J. Biotechnol. 2012, 11, 7637–7642. [Google Scholar] [CrossRef]
- Mwendwa, J.M.; Brown, W.B.; Weidenhamer, J.D.; Weston, P.A.; Quinn, J.C.; Wu, H.W.; Weston, L.A. Evaluation of Commercial Wheat Cultivars for Canopy Architecture, Early Vigour, Weed Suppression, and Yield. Agronomy 2020, 10, 983. [Google Scholar] [CrossRef]
- Peltzer, S.C.; Matson, P.T. How fast do the seedbanks of five annual cropping weeds deplete in the absence of weed seed input? In Proceedings of the Thirteenth Australian Weeds Conference, Perth, WA, Australia, 8–13 September 2002; pp. 553–555. [Google Scholar]
- Piltz, J.W.; Burns, H.M. Making quality silage and hay from pastures containing weeds. In Proceedings of the Waging War on Weeds: Battle Plans and Winning Strategies, 21st Annual Conference of The Grassland Society of NSW Inc., Wagga Wagga, NSW, Australia, 2 July 2006; pp. 71–75. [Google Scholar]
- Winter, S.; Penker, M.; Kriechbaum, M. Integrating farmers’ knowledge on toxic plants and grassland management: A case study on Colchicum autumnale in Austria. Biodivers. Conserv. 2011, 20, 1763–1787. [Google Scholar] [CrossRef]
- Jacobs, J.L.; Rigby, S.E.; McKenzie, F.R.; Ward, G.N.; Kearney, G. Effect of lock up and harvest dates on dairy pasture dry matter yield and quality for silage in south-western Victoria. Aust. J. Exp. Agric. 1998, 38, 131–138. [Google Scholar] [CrossRef]
- Piltz, J.W.; Stanton, R.A.; Wu, H. Effect of ensiling and in sacco digestion on the viability of seeds of selected weed species. Weed Res. 2017, 57, 382–389. [Google Scholar] [CrossRef]

Publisher’s Note: MDPI stays neutral with regard to jurisdictional claims in published maps and institutional affiliations. |
© 2021 by the authors. Licensee MDPI, Basel, Switzerland. This article is an open access article distributed under the terms and conditions of the Creative Commons Attribution (CC BY) license (https://creativecommons.org/licenses/by/4.0/).