Article

Image Analysis Reveals That Lenticel Damage Does Not Result in Black Spot Development but Enhances Dehydration in Persea americana Mill. cv. Hass during Prolonged Storage

1
Facultad de Ciencias Agronómicas y de los Alimentos, Pontificia Universidad Católica de Valparaíso, Calle San Francisco s/n, La Palma, Quillota 2260000, Chile
2
Sociedad Gardiazabal y Mena Ltd.a, Calle Blanco 512, Quillota 2260000, Chile
3
Department of Computer Sciences, Pontificia Universidad Católica de Chile, Santiago 8320000, Chile
*
Author to whom correspondence should be addressed.
Agronomy 2021, 11(9), 1699; https://doi.org/10.3390/agronomy11091699
Submission received: 3 August 2021 / Revised: 17 August 2021 / Accepted: 20 August 2021 / Published: 26 August 2021

Abstract

:
Black spot corresponds to a physiological disorder of the type of oxidative stress that occurs after the prolonged postharvest storage of Persea americana Mill. cv. Hass fruit. Industry tends to confuse this disorder with pathogen attack (Colletotrichum gloeosporioides), chilling injury, mechanical damage during harvest and transport or lenticel damage. The main objectives of this research were: (i) to develop a method to assess and differentiate lenticel damage and black spot and (ii) to study the correlation between mechanical damage and lenticel damage on the development of black spot. Avocado fruits from different orchards were evaluated at two sampling times using different harvesting systems (conventional and appropriate) and at two times of the day (a.m. or p.m.). Here, we report a method based on image analysis to differentiate and quantify lenticel damage and black spot disorder. In addition, the results show that conventional harvest increased lenticel damage and lenticel damage did not correlate with black spot development but correlated with increased weight loss during prolonged postharvest storage. These results have important commercial implications since the appropriate harvesting of avocado cv. Hass would not only control the incidence of lenticel damage, which would be an advantage in terms of external quality, but also reduce weight loss during transport to distant markets.

1. Introduction

Avocado (Persea americana Mill.) is a subtropical crop that originated in the highlands of Mexico and Guatemala [1]. It belongs to the Laureaceae family and is characterized by fruits with a high content of monosaturated and polyunsaturated fatty acids in addition to other nutrients and micronutrients of interest [2]. In addition to its high nutritional value, it is associated with a high economic value [3].
Chile is the ninth largest avocado-producing country in the world, occupying the fifth place as an exporting country, preceded by Mexico, Netherlands, Peru and Spain [4]. For the 2019/2020 season, Chilean avocado exports were mainly concentrated in Western Europe, South America, North America and the Asian market [5]. Chile has the particularity of being quite distant from its destination markets (21 d, 35 d and up to 55 d to reach USA, Europe and Asia, respectively) [6]. Therefore, it is essential for the fruit to arrive at the destination markets in an excellent condition and with excellent quality.
The commercial harvest of Hass avocado in Chile occurs when it reaches 23% dry matter equivalent to 9% oil [5]. In this case, 90% of the production takes place on hillsides, which makes harvesting complicated, and the fruit may be exposed to mechanical damage and long sun exposure during harvesting. Recent research showed that Hass avocado fruit exposed to mechanical damage (drops of 0.30 m or more) generated lesions in the impact zone and affected other zones of the mesocarp [7]. Thus, when comparing the effect of a conventional harvest versus an appropriate harvest (reducing the risk of generating mechanical damage), an increase of 15% of skin injuries was obtained in conventionally harvested fruit [8], as well as an increase above 40% in the incidence of pulp browning and stem end rot in fruit from a conventional harvesting system. In addition, mechanical damage generates wounds that serve as entry points for pathogens, such as Colletrotrichum gloeosporiodes [9]; it also causes an increase in the respiratory rate and ethylene production, which leads to premature and heterogeneous fruit ripening [8].
Currently, a physiological disorder known as black spot has been manifested on the skin of the fruit without compromising the mesocarp; in years of high incidence, it has reached up to 20% rejection of exports (e.g., 2016/2017 season) [10]. To date, only one study on the potential causes and control of this disorder has been published [10]. These spots are characterized by brown to black patches with a diameter of 2–3 mm or bigger, with a defined edge in the peel that does not affect the mesocarp of the fruit. Symptoms are manifested after prolonged storage (>20 d in cold), mainly in regular atmosphere conditions and, to a lesser extent, in controlled atmosphere conditions [11]. This physiological disorder of the oxidative stress type [10] is usually confused with pathogen attack (Colletotrichum gloeosporioides) or lenticel damage generated at harvest [10,12,13]. Lenticel damage, on the other hand, corresponds to the rupture of the lenticels; they have a diameter of 1–5 mm with brown shades, and lenticel damage is expressed after a few hours after harvest. Past research has reported a higher incidence and severity of lenticel damage when the fruit was harvested after being in contact with water due to a higher susceptibility to cell rupture by friction [12,14]. This problem is detrimental to the appearance of the fruit at destination markets and can be an entry point for pathogens [15,16]. Research in New Zealand thus described black spots generated in the epicarp as medium to dark brown lenticel measles with regular or irregular borders that develop during cold storage [12].
A recent study on black spots on the skin of avocado cv. Hass after prolonged storage in regular air evaluated the effect of climatic variables and the enzymatic and non-enzymatic defense system of the epicarp at harvest and reported a negative correlation between the content of phenolic compounds in the epicarp of the fruit at harvest and during storage in regular air at 5 °C for 40 days with the incidence of black spots in Hass avocados [10]. In addition, variables such as minimum temperatures and lenticel damage were apparently correlated with the development of black spot in the epicarp of Hass avocado after prolonged storage. However, to date no studies have demonstrated that lenticel damage is a direct cause of the physiological “black spot” disorder in Hass avocado.
Due to the lack of clarity and the fact that previous studies have not focused on studying in depth the potential correlation between the effect of mechanical damage at harvest and lenticel damage on the development of this “black spot” disorder, the objectives of this research are: (i) to develop a method that relies on image analysis to quantify and differentiate lenticel damage and black spot lesions and (ii) to evaluate the influence of harvest type (conventional vs. appropriate) and harvest time (a.m. or p.m.) on lenticel damage development and its potential correlation with black spot incidence in three orchards from three agroclimatic zones (coastal, intermediate and interior) and two harvest stages (early and middle) of Chile.

2. Materials and Methods

2.1. Orchard Selection, Geographic Location and Agroclimatic Data Collection

Representative orchards were selected from the different agroclimatic zones of Hass avocado production in central Chile: one orchard in the coastal zone (El Rancho), one orchard in the intermediate zone (Quilhuica) and two orchards in the interior zone (La Ensenada—early harvest and Bartolillo—middle harvest). The coastal zone is less than 10 km from the coast and has an altitude between 100 m above sea level (m.a.s.l.) and 250 m.a.s.l. The intermediate zone is located between 20 km and 45 km from the coast and has an altitude between 300 m.a.s.l. and 400 m.a.s.l. Finally, the interior zone is located at more than 45 km from the coast and has an altitude between 300 m.a.s.l. and 900 m.a.s.l. Agroclimatic data were collected through in situ weather stations using HOBOS (U30—NRC, Bourne, MA, United States) and the climatic variables collected corresponded to temperature (minimum and maximum) and relative humidity (Supplementary Table S1).

2.2. Harvesting Systems and Harvesting Time

The appropriate harvesting system considered delicate handling of the fruit, reducing the risk of mechanical damage and exposure to high temperatures for a prolonged amount of time. At the time of harvesting, rigid harvesting bins of a smaller capacity (12 kg) were used, as well as lids on bins (sponge plus plywood), and the air pressure in the wheels of the bins holders was controlled (~20 psi in each wheel) at the time of transporting the bins to the shade house. On the other hand, the conventional system did not consider precautions in the care of the fruit (increasing the risk of mechanical damage to the fruit); at the time of harvesting, larger capacity (18 kg) canvas bins were used; the bins did not have a sponge to receive the fruit and were placed in direct exposure to solar radiation. In addition, at the time of transport to the shade house, the wheels of the bin holder were inflated > 60 psi (inducing a rebound effect on the fruit).
Each harvesting system was executed at two different times of the day, at 09:00 h (a.m., higher relative humidity and higher water balance) and at 14:00 h (p.m., maximum temperature of the day and lower relative humidity). In addition, the environmental and fruit skin temperature at harvest time were recorded (Supplementary Tables S2 and S3).

2.3. Harvest Stages and Postharvest Storage Conditions

Fruits were sampled at two harvest stages during the 2018/2019 season. These two harvest stages corresponded to early harvest (23–26% dry matter content) and middle harvest (>26–30% dry matter) (Supplementary Table S4). For each condition, 125 fruits were sampled, obtaining 500 fruits for each harvest. Once the sampling was completed, the individual weight of each fruit per condition was recorded, after that were transferred to the laboratory where fruits were stored for 12 h in a regular atmosphere cold room at 5 °C. Prior to storage, the fruits were weighed on a digital balance and evaluated according to external quality parameters described below. The fruits were separated into 5 batches of 25 fruits per condition and were stored for 40 days in regular air at 5 °C, and the corresponding external quality evaluations were carried out. After storage, the batches with the fruits were left in a room at 20 °C and 65–70% RH until they reached edible ripeness (4–14 N mesocarp firmness). A total of 3000 fruits were independently evaluated.

2.4. Evaluations of Internal and External Quality Parameters

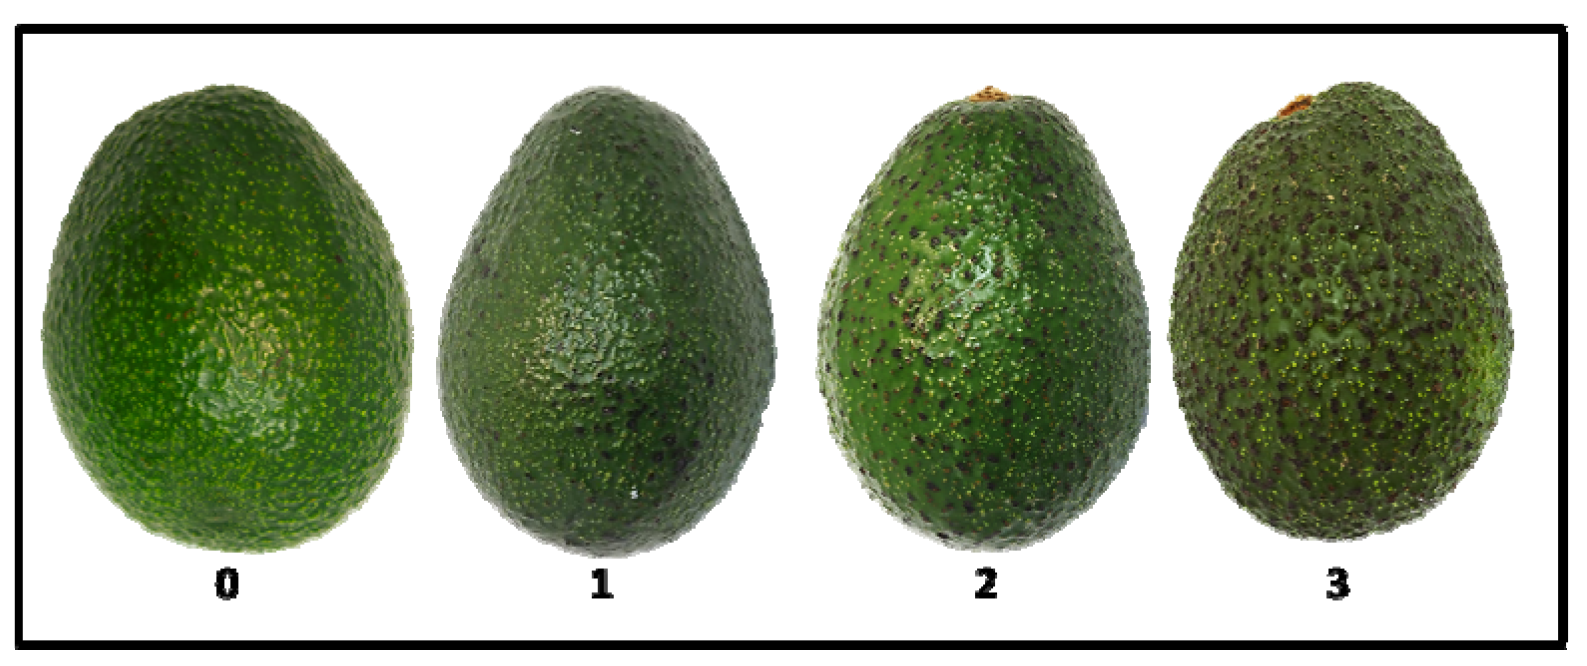
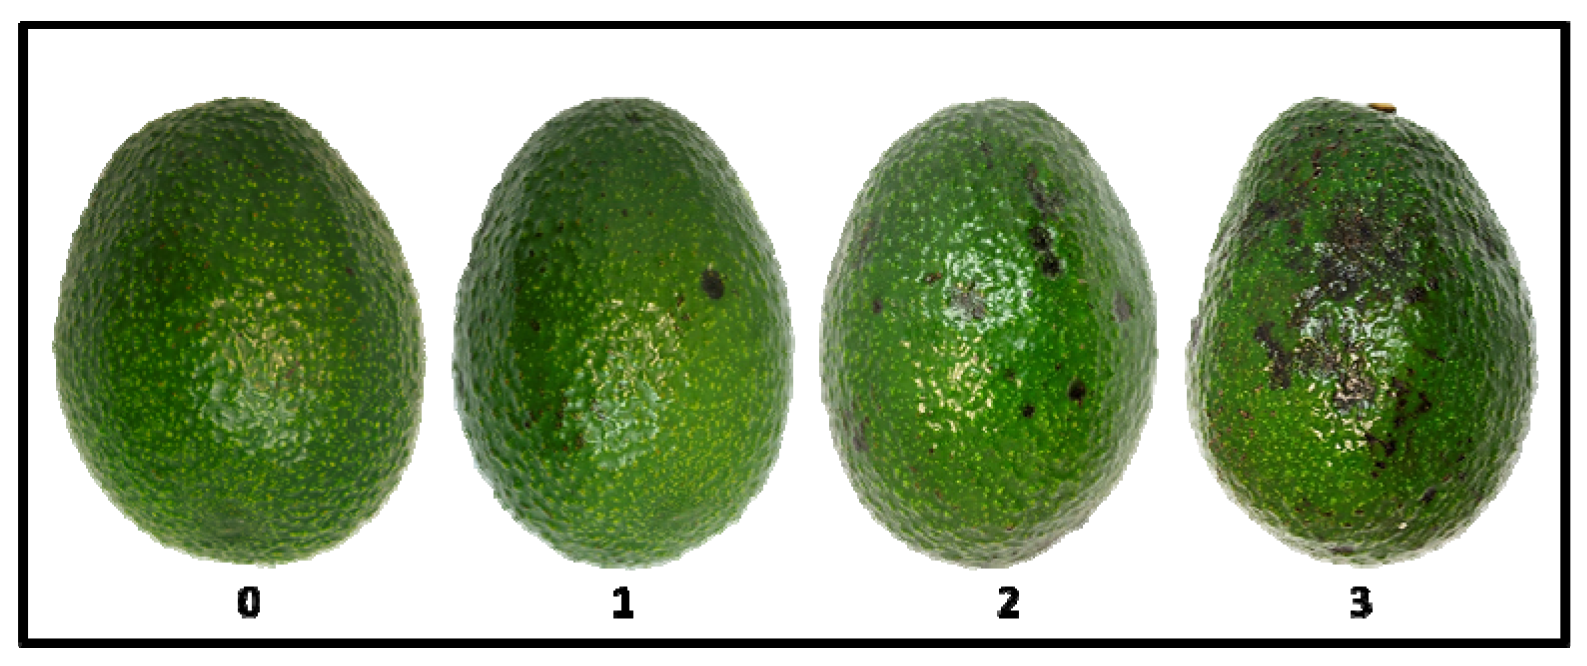
2.4.1. Incidence of Lenticel Damage and Black Spot

To evaluate the incidence and severity of lenticel damage and black spot, a hedonic scale from 0 to 3 was used, where 0 = absence, 1 = less than 25% of the peel with damage, 2 = more than 25% and less than 50% of the damaged surface and 3 = more than 50% of the peel with damage (Figure 1 and Figure 2). The incidence of black spot was evaluated with the same hedonic scale explained above. The severity index (SI) for both external quality problems (lenticel damage and black spot) was calculated from the formula used in previous studies [10,17]:
S I ( % ) = f 1   c 1 + f 2   c 2 + f 3 + f n   c n N   t
The SI of a given disorder (lenticel damage or black spot); c1, c2, c3cn correspond to a specific level or class of the disorder, while f1, f2, f3fn represent the number of fruits at each level of disorder; N is number of classes of a specific disorder; and t is the total fruits evaluated.

2.4.2. Stem End Rot and Anthracnose Incidence

After 40 days of cold storage, the fruits were left in a room at 20 °C and 65% RH to evaluate the number of days it took to reach the ready-to-eat stage (RTE). At the RTE, the incidence (presence/absence) of stem end rot and anthracnose were quantified as a percentage (number of fruits affected by treatment/number of total fruits) using the same protocol reported in recent avocado research [18].

2.4.3. Weight Loss

The weight of each fruit was recorded at different times: harvest, once in cold storage (pulp at 5 °C), after cold storage (40 days) and at RTE. The total weight loss was calculated for each condition.

2.4.4. Determination of Dry Matter and Firmness

The dry matter of 10 independent fruits was measured; the epicarp and seed coat attached to the mesocarp were removed; and then a sample of mesocarp was cut into small pieces, which were placed in an oven at 100 °C for 24 h until a constant weight was reached [18]. The dry matter was expressed as the average of 10 independently measured fruits.
A penetrometer (model FT327) was used to measure firmness destructively. Two measurements per fruit were taken at two equidistant points in the equatorial region of each whole fruit. At harvest, the plunger used had a diameter of 4 mm, while at edible ripeness (RTE), an 8 mm plunger was used. Correction factors were applied according to plunger diameter, and the results were expressed in Newtons (N). Firmness values at harvest and after postharvest storage are provided as Supplementary Tables S5 and S6.

2.5. Image Analysis

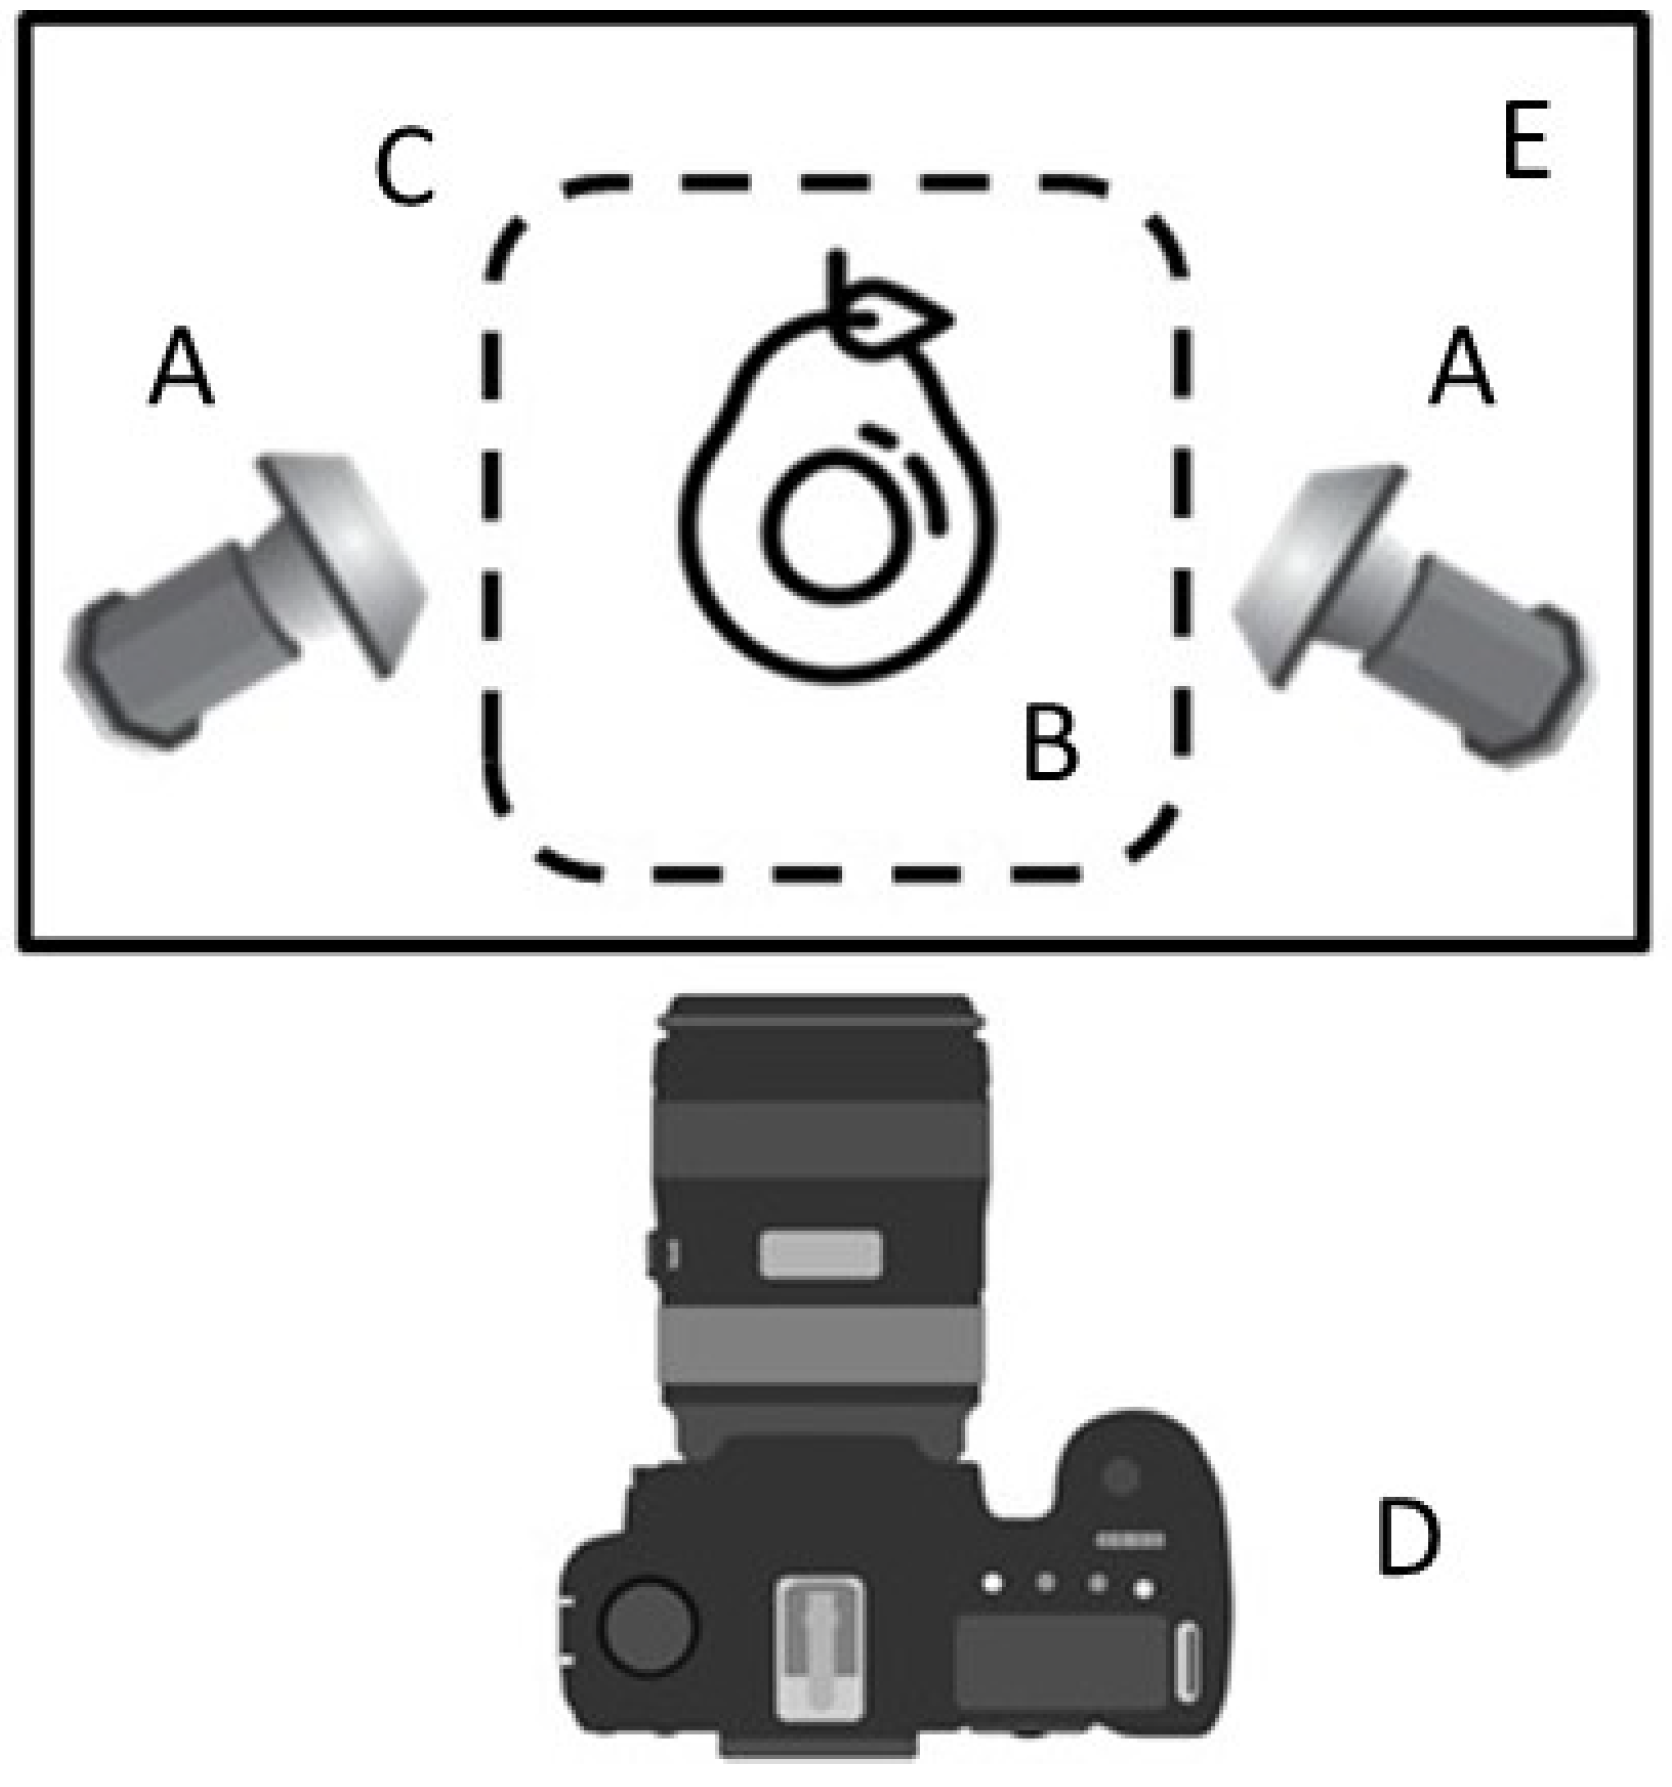
2.5.1. Description of the Photographic System

The photographic set had a dimension of 50 cm (height) × 50 cm (width) × 50 cm (depth) and was composed of a white mesh to avoid light reflection on the fruits. Two LED lights (17 W) were placed at 20 cm equidistant from the set at an angle of 45° with respect to the horizontal. A semi-professional Canon EOS REBEL T31 camera was used, placed on a photography tripod with a height of 1.30 m in a vertical position over the samples at a 40 cm distance. The camera settings were manual mode, ISO speed—100, exposure time 1/3 s, F-stop f/16, no flash and a focal length of 44 mm (Figure 3). The images had a resolution of 5184 × 3456 pixels in CR2 format (high resolution) and were taken according to the evaluation date, establishing the same position and orientation of the avocados.

2.5.2. Photographic Follow-Up on Fruits

In each condition, 20 fruits were randomly selected for photographic monitoring from day 0 (entry into storage) up to day 40 (exit from storage). In this case, 11 image capture dates were considered every 4 days, obtaining a sequence of 11 photos per fruit during storage. For each fruit, three faces were captured (faces A, B and C, respectively), obtaining 33 images per fruit corresponding to 660 images per treatment: 2640 images for orchard, 7920 images for season, and 15,840 images for both harvest stages (early and middle).

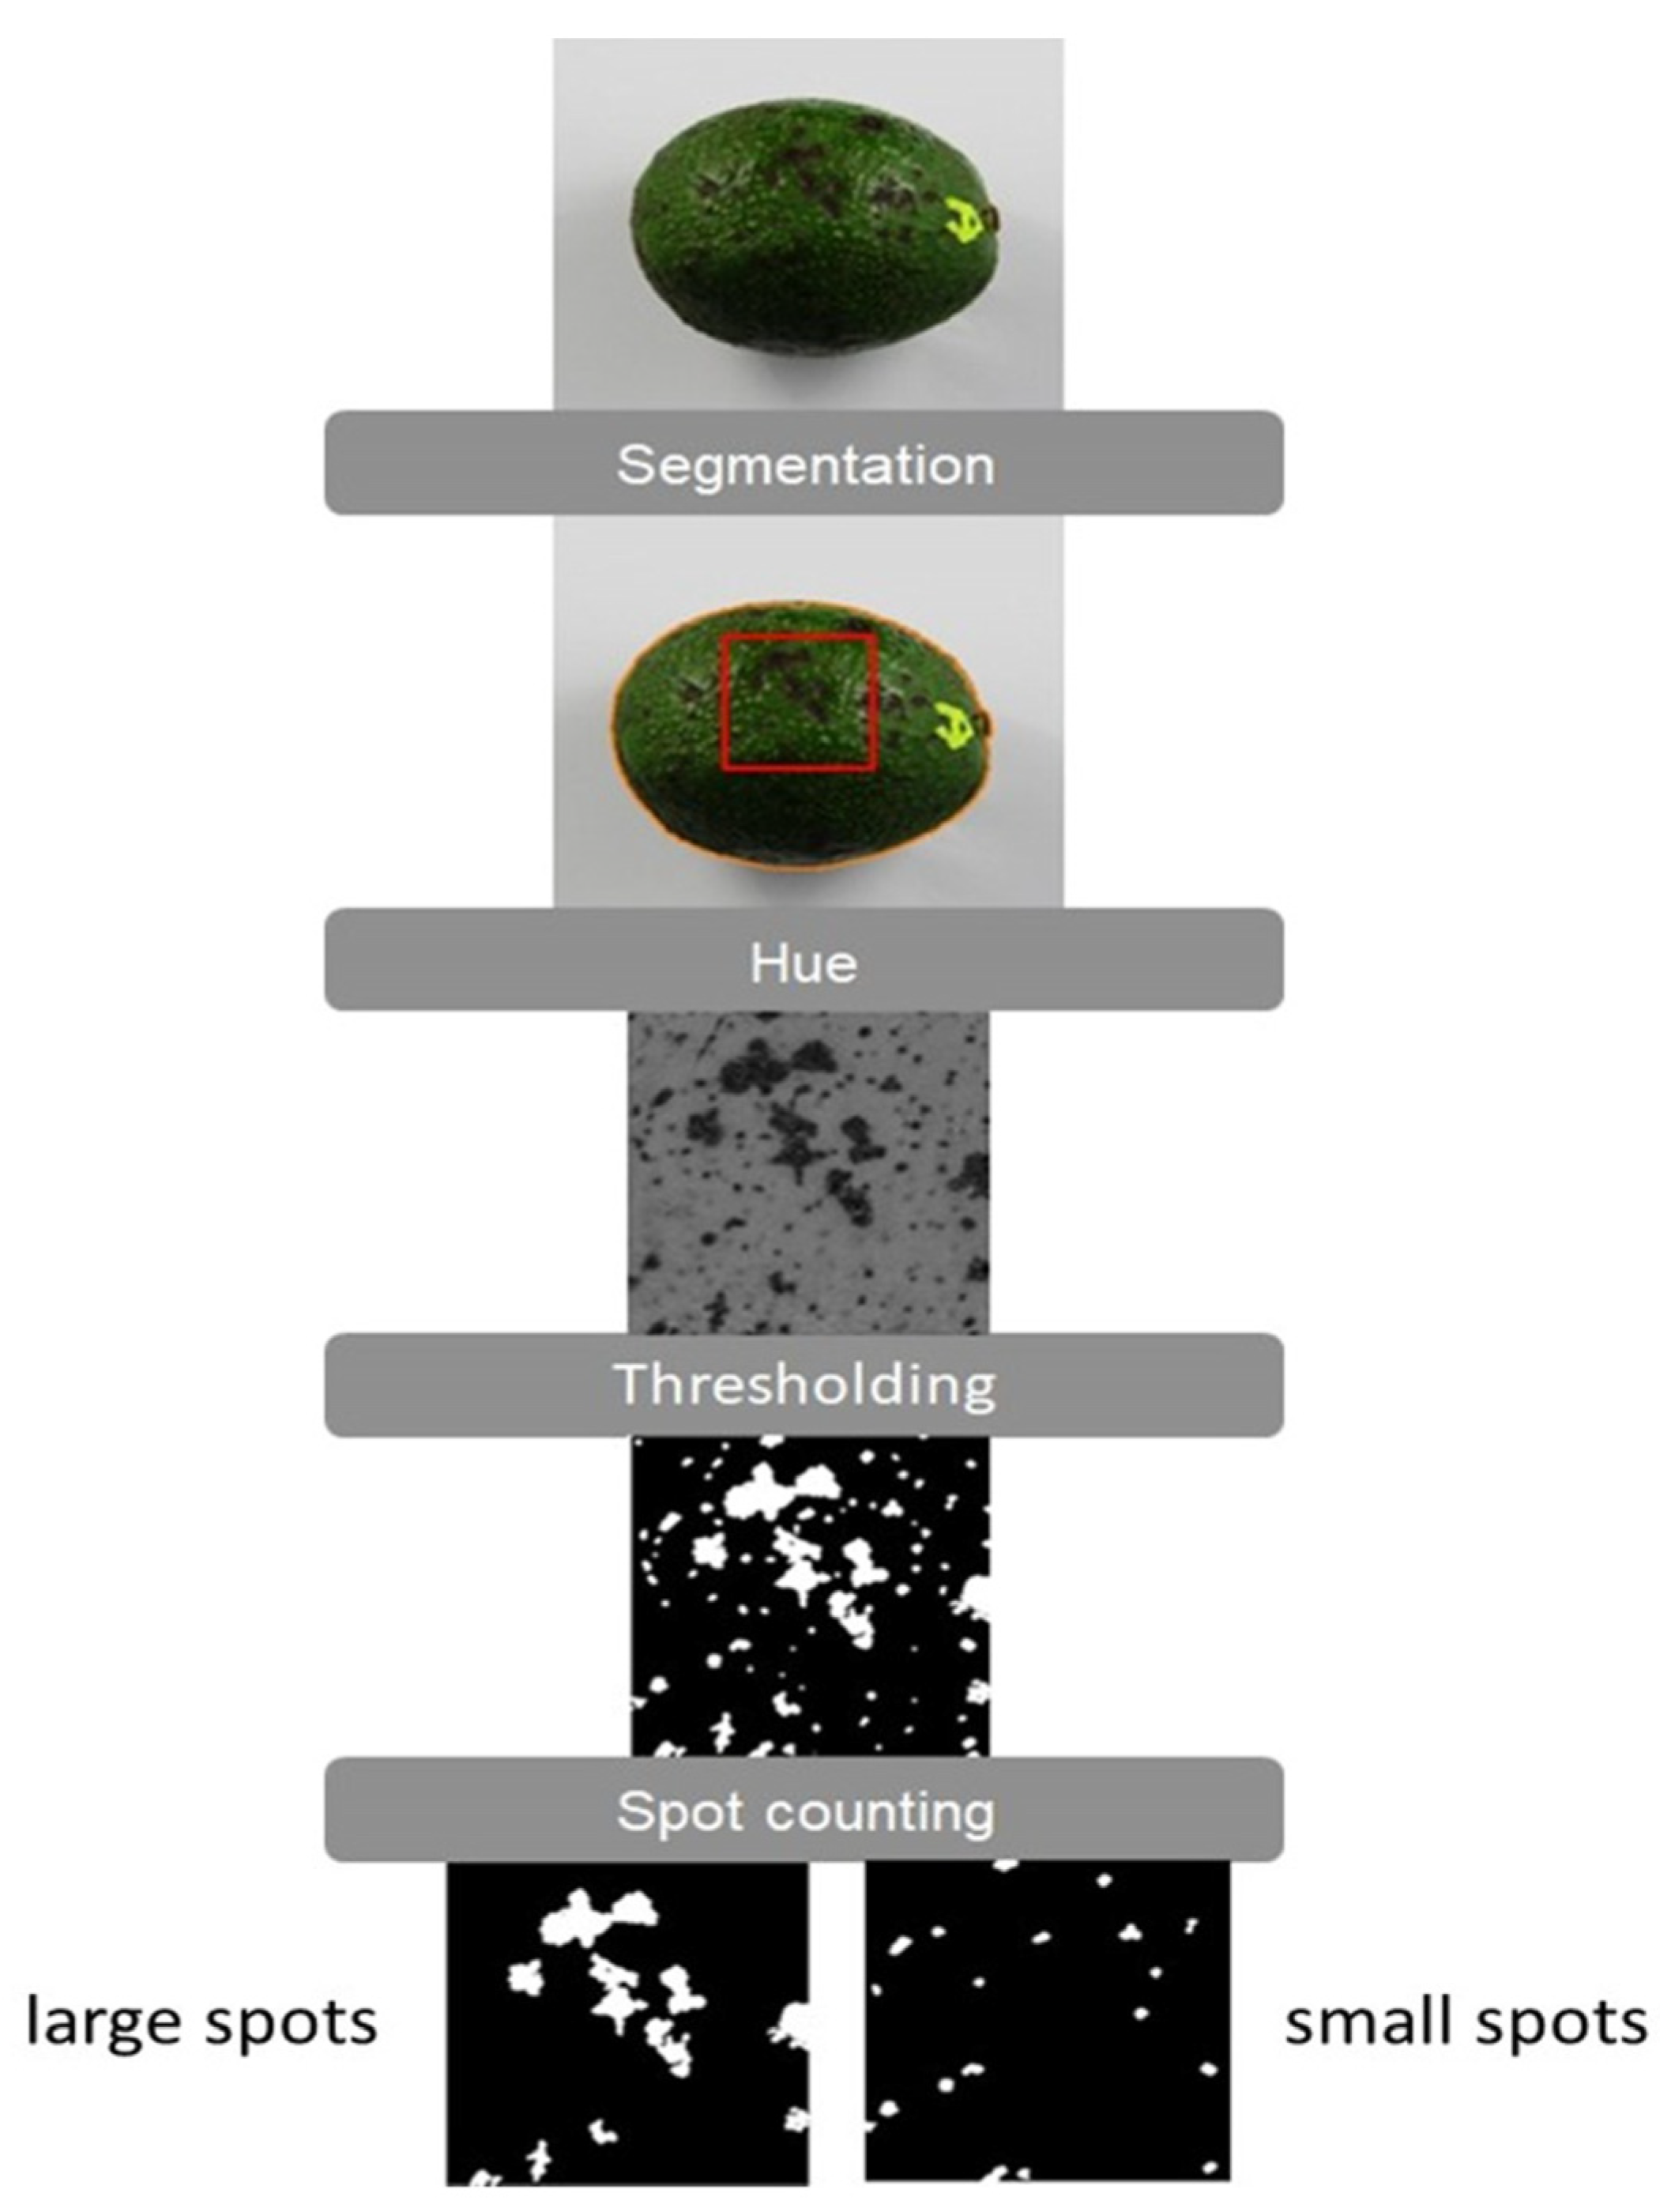
2.5.3. Implementation of Image Analysis Method in Matlab

The method implemented in Matlab consisted of the following four steps (Figure 4): Segmentation: the original image (of 3456 × 5184 pixels) was reduced in size to 25% per dimension (i.e., to 864 × 1296 pixels). Then, the avocado was separated from the background using the segmentation method presented in a research related to image analysis [19]. This method performed a transformation of the color image into a high-contrast gray tone image, which can be easily segmented using thresholding and morphological operations [20]. Once the avocado was segmented, its center of mass in the image was calculated, and a 200 × 200-pixel square centered on the center of the mass was extracted. In this way, an approximately flat area was obtained where the geometric distortion due to the projection of the avocado curvature was slight. (ii) Hue: the selected square was converted to the HSV color space [21], and the H channel was chosen, corresponding to the Hue value, which has values between 0 and 1, where each value corresponds to a specific color. (iii) Thresholding: it was determined experimentally that the spots corresponded to low Hue values. For this reason, the spots were segmented using a threshold of 0.1. Thus, pixels that had a Hue value lower than 0.1 corresponded to pixels that belong to a spot. (iv) Spot Counting: from the last image, each of the regions was isolated and the number of pixels were counted. In our experiments, those regions having less than 25 pixels were considered as noise, those having between 25 and 100 pixels were considered as “small spots” corresponding to “lenticel damage”, and those having more than 100 pixels were considered as “large spots” or “black spot”. Additionally, the number of spots in each category and the portion of area that these spots occupied in the image were counted.

2.6. Statistical Analysis

All data from the experiment were summarized and subjected to normality (Shapiro–Wilk test, p < 0.05) and homogeneity of variances (Levene Test) to verify the Gaussian distribution. Such conditions were not met due to the presence of missing values and differences in factor levels during harvest stages (Supplementary Figure S1). Additionally, the non-parametric two-way ANOVA also failed the mean comparison test (i.e., Dunn’s test was not applicable for two-way ANOVA). Thus, the data were analyzed by means of an aligned ranks transformation ANOVA. This is a non-parametric approach that allows for multiple independent variables, interactions and repeated measures. Post hoc comparisons can be performed for main effects and for two-way models. When differences were observed, Sidak’s correction was used to counteract the problem of multiple comparisons. It is a simple method to control for the familywise error rate. The data were also subjected to Spearman’s correlation (p < 0.05) to check for association between the measured variables.
Finally, a zero/one inflated beta (ZOIB) regression model was applied to understand the relation of weight loss and black spot as a function of lenticel damage across harvest dates. The ZOIB model responses bounded within (0.1), and an underlying Bayesian framework via the Markov Chain Monte Carlo (MCMC) approach was implemented using JAGS to obtain the posterior inferences of model parameters [22,23]. In this analysis, we fitted the ZOIB model with a random component (i.e., lenticel damage) in the link function of the mean of the beta distribution. A posterior mean of predicted weight loss and black spot was plotted against the observed values to check the goodness-of-fit of the model.
Multivariate techniques such as linear discriminant analysis (LDA) was also applied to capture similarities or dissimilarities among orchards in terms of black spot and lenticel damage and most relevant factors involved. Analyses were performed in R software version 3.5.1 (R Core Team, 2018) with scripts produced by our laboratory group.

3. Results

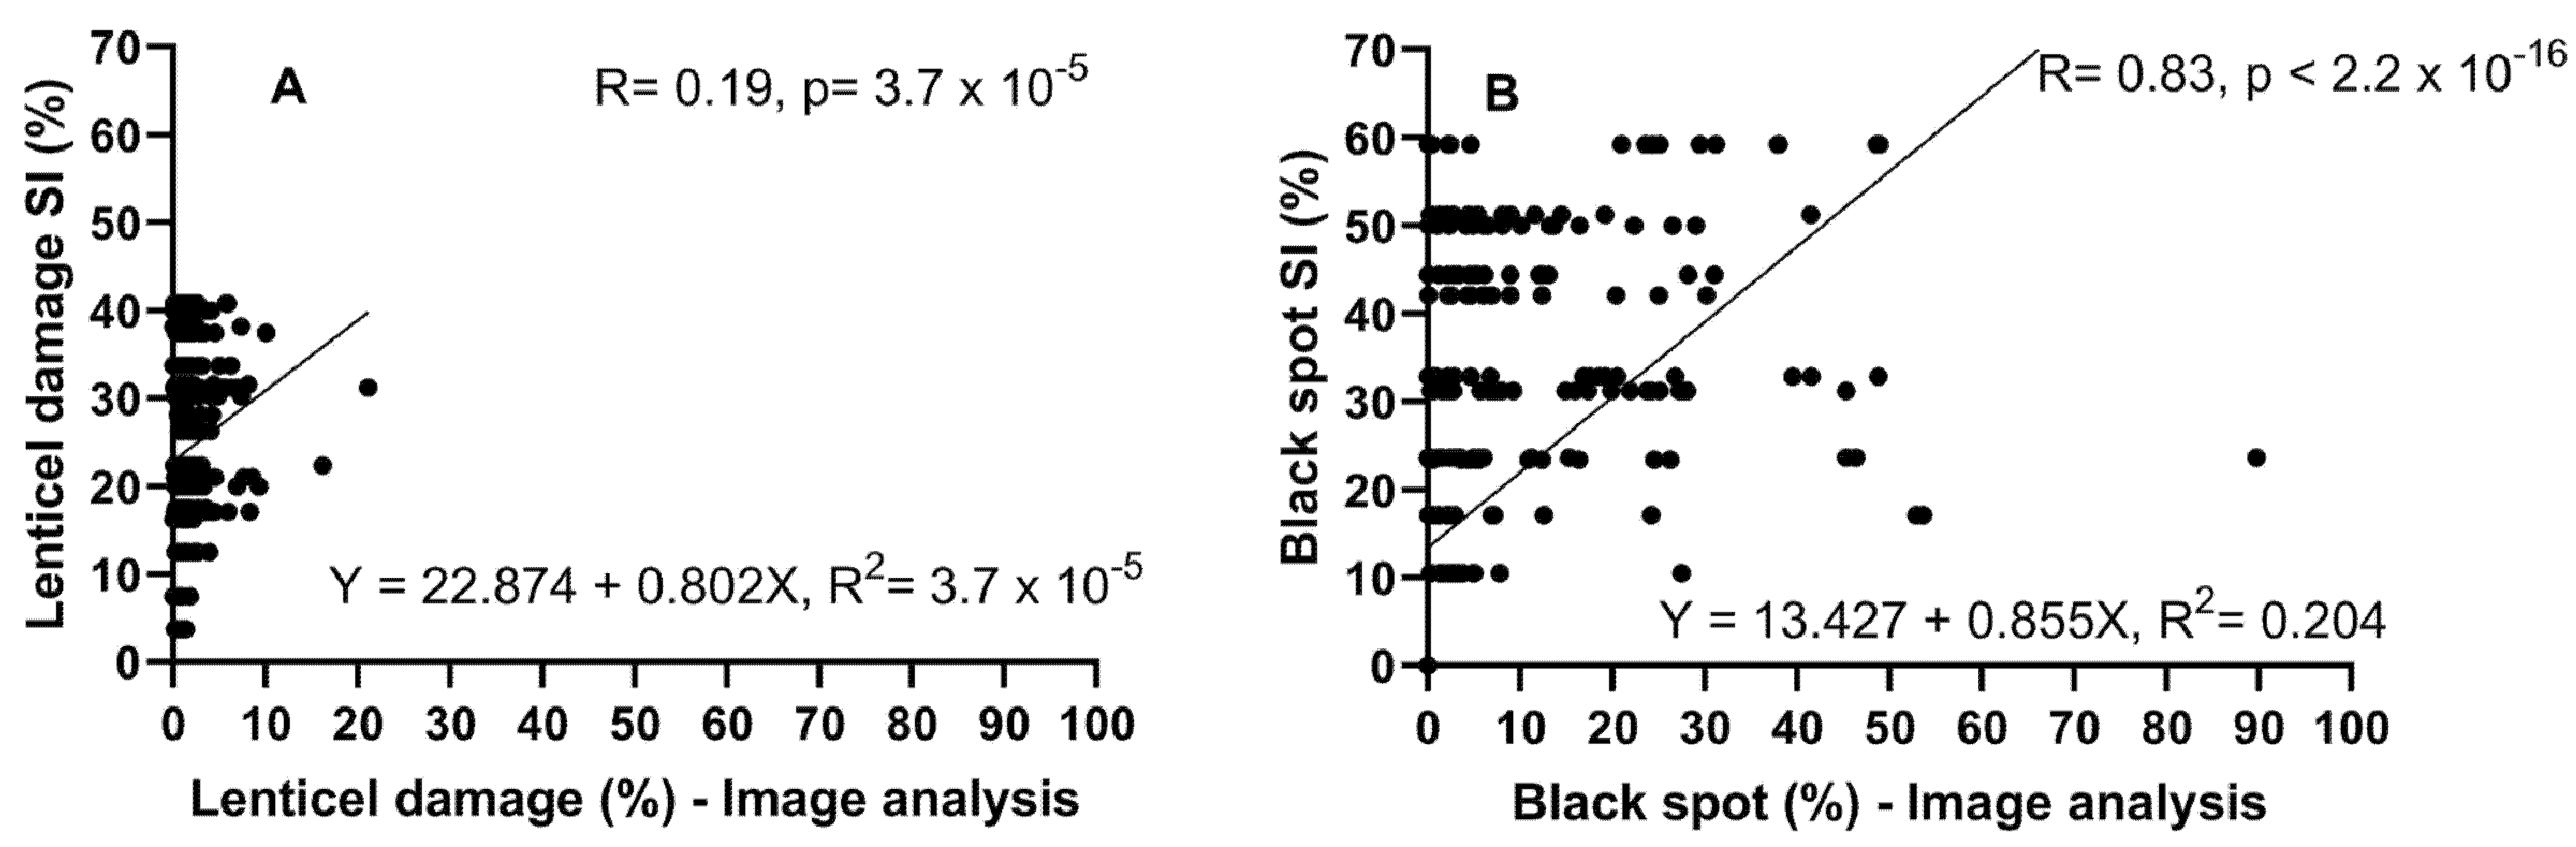
3.1. Development of the Quantification Method for Lenticel Damage and Black Spot

The results of the Spearman correlations (Figure 5) show a positive association between lenticel damage evaluation by image analysis and the hedonic scale evaluation (rho = 0.19) (Figure 5A). The correlation between black spot assessment by image analysis in Matlab, and the hedonic scale presented a higher positive association (rho = 0.83) (Figure 5B).
A linear regression between the evaluation of lenticel damage with the hedonic scale and by image analysis resulted in an R2 = 0.025, (Y = 22.874 + 0.802X), with the variance being explained as quite low 0.025 (Figure 5A), while the regression between the evaluation of black spot by hedonic scale and image analysis presented an explanation of variance of 0.204 (Y = 13.427 + 0.855X) (Figure 5B).

3.2. Effect of Type and Time of Harvest on Weight Loss and Incidence of Rots

Fruit appropriately harvested at 5 °C showed less weight loss than the conventional harvesting system. For the early harvest and for fruit from the Rancho orchard, a difference of 50% more weight loss was observed when fruit were harvested conventionally at both times of the day. Similar results were observed for La Ensenada fruit. However, for middle harvest fruit, a difference between conditions was only observed in the a.m. harvest for Bartolillo fruit, where conventionally harvested fruit presented 50% more weight loss (Table 1).
At the exit of storage (40 d at 5 °C), early harvest fruit from all appropriately harvested orchards presented lower weight loss or dehydration. Likewise, for middle harvest fruit, it was observed that Bartolillo presented significant differences (p < 0.05) between appropriately harvested and conventionally harvested fruit at 09:00 h (a.m.).
At both harvest times (a.m. and p.m.), once the fruit reached edible ripeness (ready to eat, 4–14 N), it was not possible to observe a clear effect of the conditions on weight loss, which could be explained by the incidence of lenticel damage and/or black spot, which could contribute to increasing the transpiration rate of the fruits.
The incidence of anthracnose and stem end rot was low for both harvest times and the three evaluated orchards. Thus, it was not possible to observe an effect of conditions on the incidence of either problem (Supplementary Table S2).

3.3. Evaluation of the Type and Time of Harvest on Lenticel Damage and Black Spot Incidence

Early harvest fruit exclusively presented the problem of black spot in El Rancho orchard, where the fruit subjected to conventional harvesting showed a lower incidence of black spot compared to the appropriately harvested fruit (Table 1). Instead, for middle harvest fruit, the incidence of black spot occurred in El Rancho and Bartolillo orchards (Table 2). However, it was not possible to associate an effect of the conditions with the presence of this problem, since for El Rancho orchard, the condition corresponding to an appropriate harvest at 09:00 h (a.m.) presented a lower incidence compared to the other conditions, while for Bartolillo, the condition with a lower incidence corresponded to the fruit harvested in a conventional manner at 09:00 h (a.m.).
It was possible to observe a clear effect of the conditions on the incidence and severity of the lenticel damage affecting Hass avocado fruit. For early harvest fruit, all appropriately harvested orchards presented a lower SI (%); in the case of Quilhuica, it was possible to observe a significant difference with 8% more affected fruits at 09:00 h (am), while in the afternoon this difference was accentuated by about 20%. For middle harvest fruit, the tendency was similar; the appropriately harvested conditions showed less damage due to less rupture of their lenticels (Table 2).

3.4. Lenticel Damage Correlates to Water Loss during Storage but Not to Black Spot Development

Results from the ZOIB modelling approach showed that posterior means of weight loss obtained from the MCMC approach were well correlated with the observed values of weight loss, yet the posterior mean of black spot development displayed a poor fit with the observed values of black spot (Figure 6). These results highlight that lenticel damage predicts well water loss during storage but not black spot development.

3.5. Data Integration and Multivariate Analysis

Linear discriminant analysis (LDA) is a machine learning technique used as a tool for classification, dimension reduction and data visualization. When all variables evaluated in this study were submitted to LDA analysis, a better classification of the orchards was found, as can be observed in Figure 7A. Orchards with a high incidence of black spot physiological disorder (Bartolillo and El Rancho) were distinguished from those without black spot (La Ensenada and Quilhuica). In total, 99% model accuracy was found, with the main variance due to latent variable 1 (92%). Orchard classification was mainly affected by the harvest stage, followed by the black spot incidence, fruit firmness at harvest, dry matter and harvest time. Sample classification in latent variable 2 was positively contributed to by anthracnose incidence and negatively affected by black spot disorder, firmness at harvest and fruit weight loss at RTE. Finally, aiming to select specific variables related to black spot and those of lenticel damage, a feature selection analysis via the information gain algorithm was applied to the dataset, and the results found four similar variables related to both dependent variables (black spot and lenticel damage), which were the peel temperature, firmness at harvest and cold chamber outlet and fruit dry matter (Figure 7B). Interestingly, for black spot disorder, a specific predictor variable was found to be the orchard, which prompts us to conclude that specific factors related to the orchard may cause the black spot disorder in stored Hass avocado fruits.

4. Discussion

Based on the R2 obtained between the hedonic and image analysis methods to evaluate both disorders (lenticel damage and black spot), it is not possible to use the model to predict a response variable. This is because the evaluation (lenticel damage and black spot) using a hedonic scale is subjective according to the criteria of the evaluator. Even though the same methodology is always used, the observations can vary according to the criteria of the evaluator; thus, the dataset presented a semi-Gaussian distribution (Supplementary Figure S1). The evaluation by image analysis follows a series of automated steps where it is possible to reduce the error; thus, it is possible to observe that the observations obtained through this tool have a positive symmetrical distribution (Supplementary Figure S1). A previous study to capture and quantify spots on mango peel without discrimination of the type (e.g., pathogen attack or other) by image analysis reported an effective classification of 90.7%. However, the criteria for classifying the fruit according to severity was quite vague [24]. The scientific community is aware of the disadvantages of the sorting and grading carried out by humans including trained raters since inconsistent and subjective measurements can be introduced and distort the reality [25,26,27]. The main disadvantages of raters include tiredness and loss of accuracy as the process continues, substantial inter and intra rater variability, promptness to various illusions, among others [27]. In addition, the developed method based on image analysis to discriminate and quantify lenticel damage and black spot disorders in this study included three image captures of the fruit as opposed to most of the studies that only considered one direction [25].
Black spot occurred during the early harvest exclusively in the coastal field (El Rancho), while for middle harvest fruit, the incidence was higher, manifesting this disorder both El Rancho and Bartolillo fruit. Similar results were obtained in recent research [10]; these authors reported a higher incidence of black spot when mesocarp dry matter was higher than 26%, and these same orchards presented incidence of black spot in different harvests including early and middle [10]. However, there is no correlation between dry matter content and black spot incidence. Recent research [11] reported for avocado cv. Hass from the 2018/2019 season that fruit from both El Rancho and Bartolillo orchards had black spot incidence in both early and middle harvests. Unpublished studies from our group that include four full seasons of evaluations have consistently observed that certain orchards independent of production zone (coastal, intermediate or interior) present a record of black spot incidence. Black spot has been confused with chilling injury. Contrary to chilling injury disorder that involves external (e.g., skin pitting and blackening) and internal (e.g., flesh browning, grey pulp, pulp spot and vascular browning) symptoms [28,29], black spot disorder in Hass avocado skin only compromises the skin and not the mesocarp. Previous works have reported methyl jasmonate (MJ) application as effective treatment to control chilling injury in avocados including Hass [30], but unpublished results of our group to control black spot development after prolonged storage using early applications of MeJA did not result in a reduction of this black spot disorder in avocado, confirming black spot is not a chilling injury disorder. Previous studies have reported the use for instance of computer vision systems to assess chilling injury defects in cucumber [31] and to quantify defects and diseases in different species [25] but not to assess this disorder in Hass avocado skin.
The results obtained in this research show association with higher lenticel severity index (SI %) when the fruit was harvested in a conventional way; similar results were reported in research in New Zealand [12]. Our results displayed a higher SI% for the fruit from the three orchards (early and middle harvests) from the conventional harvesting system. Early harvest fruit from Quilhuica revealed a statistical difference between treatments (p < 0.05); fruits harvested appropriately at 09.00 h (a.m.) presented an 11.4 SI %, while fruits harvested conventionally at the same time presented an increase of 7.8%. In the 14:00 h (p.m.) conditions, the conventionally harvested fruit showed a 20 SI % increase compared to the appropriate harvesting system (Table 1). Similar results were obtained for middle harvest fruit; thus, appropriately harvested fruit from El Rancho (a.m. and p.m.) presented significantly lower SI (%) compared to the other conditions corresponding to the conventional harvesting. A similar situation was observed for Quilhuica and Bartolillo (Table 2). Our results coincide with those reported in past research; these authors reported that fruits harvested and subjected to mechanical rubbing presented an increase of up to 35% of fruits with severe lenticel damage [13]. In addition, our results also coincide with research reported in New Zealand where those results showed an increase in the number of lenticel lesions when fruit was subjected to mechanical damage [12]. Lenticel damage whose etiology has not been clear established yet, has been reported to be significant in avocado, increasing during prolonged storage and affecting external quality [16,32].
In both harvests and in the three orchards, it was possible to observe a trend whereby the fruits of the 09:00 h conditions (appropriate and conventional harvesting systems) presented a higher degree of lenticel damage. This is probably due to higher relative humidity values (Supplementary Table S1), increasing the water balance in the fruit epicarp and resulting in cells with greater turgor and at the same time being prone to suffering some degree of cell rupture [12,14,33]. Our results suggest that Hass avocado fruit harvests should be carried out under an appropriately harvesting system to control the development of lenticel damage in the fruit after harvest and during prolonged storage. Previous works have reported improper handling of the fruit not only at harvest, but during handling and storage that incurred in fruit subjected to friction may exacerbate lenticel damage [16,32].
Regarding weight loss monitoring, it was possible to observe that it was higher when fruits were harvested under a conventional system. Early harvest fruit from the coastal orchard presented a statistical difference (p < 0.05) between the appropriate and conventional harvesting systems at both harvest times. A similar situation was observed for the middle harvest interior orchard; appropriately harvested fruit (a.m.) presented a 0.29% weight loss compared to 0.60% for conventionally harvested fruit (Table 1). In addition, at cold exit (day 40) in both harvests and three orchards, fruit harvested conventionally (a.m. and p.m.) presented a greater weight loss (%), a situation similar to that reported where fruit from treatments where mechanical damage was induced presented a greater weight loss [12]. At the ready-to-eat stage, it was not possible to associate a clear effect of the conditions with fresh fruit weight loss. Early fruit from El Rancho showed a greater weight loss in fruits that were appropriately harvested (a.m. and p.m.); however, they also presented a higher severity index of black spot, and these spots may influence the rate of transpiration as the fruits reach edible ripeness [34]. Previous studies have reported water loss in avocado to be mediated by multiple factors such as maturity stage of the fruit, management of storage conditions (temperature and relative humidity) among others [16], however, up to our knowledge, the direct effect of lenticel damage on water loss in avocado has not been reported.
The results obtained from the ZOIB model with the data quantified through image analysis by Matlab for black spot and lenticel damage percentages allow confirmation that lenticel damage does not result in black spot and that lenticel damage is correlated with a higher weight loss after prolonged storage. From a commercial point of view, the results obtained in this study are relevant since an appropriately harvesting system of avocado cv. Hass in Chilean geographical conditions would not only control the incidence of lenticel damage, which is an advantage in terms of external quality [15,16] but would also control weight loss during transport to distant markets with a positive economic impact.
The results of the linear discriminant analysis provide more support in relation to orchard-specific factors being involved in black spot development in Hass avocado peel [11].

5. Conclusions

The results presented show that there is no direct relationship between the harvesting system used and the incidence of black spot disorder on “Hass” avocado fruit. However, it was possible to attribute greater lenticel damage to fruit harvested conventionally. By means of image analysis (Matlab), it was possible to corroborate that lenticel damage does not lead to the appearance of black spot; however, lenticel damage leads to greater dehydration or weight loss of the fruit during prolonged cold storage. On the other hand, an image-based method was developed to differentiate and quantify the incidence of black spot and lenticel damage.

Supplementary Materials

The following are available online at https://www.mdpi.com/article/10.3390/agronomy11091699/s1, Figure S1: Normality results (Q- Q normality plots and histograms with normality curve). A total of 456 (76 fruits per orchard × 3 orchards and at both harvest times) observations were used. Table S1: Climatic conditions during both harvests of season 2018/2019. Table S2: Incidence of anthracnose and stem end rot according to the conditions carried out for both harvests. Table S3: Temperature (°C) of the peel during both harvests of season 2018/2019. Table S4: Dry matter evaluation (%) for both harvests of season 2018/2019 and the three orchards evaluated. Table S5: Evaluation of flesh firmness (N) of 15 fruits per treatment at the time of fruit reception for both harvest stages, three orchards and respective conditions. Table S6: Evaluation of flesh firmness (N) at exit from storage (40 days at 5 °C) of fruit from both harvest stages, orchards and conditions. Average of 15 fruits per condition were evaluated.

Author Contributions

Conceptualization and methodology, V.L., D.M. and R.P.; data collection, V.L. and C.Z.; formal analysis, I.F.C., V.L. and V.U.; software, D.M.; original draft preparation, V.L.; writing—review and editing, I.F.C., D.M., J.E.A., M.V. and R.P.; supervision, R.P. All authors have read and agreed to the published version of the manuscript.

Funding

This research was funded by FONDECYT-ANID N°1180303 and N°3190055 (Chile) and VRIEA-PUCV, Chile [039.426], in addition to the Comité de Paltas Chile and associated producers and exporters (Santa Cruz, El Parque, Jorge Schmidt, Baika, Subsole).

Institutional Review Board Statement

Not applicable.

Informed Consent Statement

Not applicable.

Data Availability Statement

Datasets analyzed during the current study are available from the current author on reasonable request.

Acknowledgments

The authors acknowledge Sociedad Gardiazabal y Mena Ltd.a and Instituto de Investigaciones Agropecuarias (INIA) La Platina.

Conflicts of Interest

The authors declare no conflict of interest.

References

  1. Avocado Source. Available online: http://www.avocadosource.com/Journals/CICTAMEX/CICTAMEX_1998/cictamex_1998_33-51.pdf (accessed on 3 May 2019).
  2. Dreher, M.L.; Davenport, A.J. Hass Avocado Composition and Potential Health Effects. Crit. Rev. Food Sci. Nutr. 2013, 53, 738–750. [Google Scholar] [CrossRef] [Green Version]
  3. World Avocados Market Analysis, Forecast, Size, Trends and Insights (WAMAFSTI). Available online: https://www.researchandmarkets.com/reports/4701142/world-avocados-market-analysis (accessed on 12 August 2021).
  4. Oficina de Estudios y Políticas Agrarias. Ministerio de Agricultura. La Palta Chilena en los Mercados Internacio-Nales. Available online: https://www.odepa.gob.cl/wp-content/uploads/2018/12/palta2018rev1.pdf (accessed on 18 May 2019).
  5. Comité de Palta Hass. Available online: http://www.paltahass.cl (accessed on 15 May 2019).
  6. Olivares, D.; Alvarez, E.; Véliz, D.; García-Rojas, M.; Díaz, C.; Defilippi, B.G. Effects of 1-Methylcyclopropene and Controlled Atmosphere on Ethylene Synthesis and Quality Attributes of Avocado cvs. Edranol and Fuerte. J. Food Qual. 2020, 2020. [Google Scholar] [CrossRef]
  7. Mazhar, M.; Joyce, D.; Hofman, P.; Vu, N. Factors contributing to increased bruise expression in avocado (Persea americana M.) cv. ‘Hass’ fruit. Postharvest Biol. Technol. 2018, 143, 58–67. [Google Scholar] [CrossRef]
  8. Perkins, M.L.; Usanase, D.; Zhang, B.; Joyce, D.C.; Coates, L.M. Impact Injury at Harvest Promotes Body Rots in ‘Hass’ Avocado Fruit upon Ripening. Horticulturae 2020, 6, 11. [Google Scholar] [CrossRef] [Green Version]
  9. Mandemaker, A.J.; Elmsly, T.A.; Smith, D.B. Effects of drop heights and harvesting methods on the quality of “Hass” avocados. NZAGA 2006, 6, 97–104. [Google Scholar]
  10. Uarrota, V.G.; Hernandez, I.; Guequen, E.P.; Cruz, J.V.; Fuentealba, C.; Defilippi, B.G.; Lindh, V.; Zulueta, C.; Chirinos, R.; Campos, D.; et al. Unravelling factors associated with ‘blackspot’ disorder in stored Hass avocado (Persea americana Mill) fruit. J. Hortic. Sci. Biotechnol. 2020, 95, 804–815. [Google Scholar] [CrossRef]
  11. Hernández, I.; Uarrota, V.; Paredes, D.; Fuentealba, C.; Defilippi, B.G.; Campos-Vargas, R.; Meneses, C.; Hertog, M.; Pedreschi, R. Can metabolites at harvest be used as physiological markers for modelling the softening behaviour of Chilean “Hass” avocados destined to local and distant markets? Postharvest Biol. Technol. 2021, 174, 111457. [Google Scholar] [CrossRef]
  12. Everett, K.R.; Hallett, I.C.; Rees-George, J.; Chynoweth, R.W.; Pak, H.A. Avocado lenticel damage: The cause and the effect on fruit quality. Postharvest Biol. Technol. 2008, 48, 383–390. [Google Scholar] [CrossRef] [Green Version]
  13. Zamora-Magdaleno, M.T.; Cajuste-Bontemps, J.; Colina-León, M.T.; Santacruz, U.H. Efecto de los daños mecánicos sobre el comportamiento postcosecha de frutos en aguacate. Rev. Chapingo Ser. Hortic. 1999, 5, 319–328. [Google Scholar]
  14. Duvenhage, J.A. The influence of wet picking on postharvest diseases and disorders of avocado fruit. SAAGA Yearb. 1993, 16, 77–79. [Google Scholar]
  15. Ramírez-Gil, J.G.; López, J.H.; Henao-Rojas, J.C. Causes of Hass Avocado Fruit Rejection in Preharvest, Harvest, and Packinghouse: Economic Losses and Associated Variables. Agronomy 2019, 10, 8. [Google Scholar] [CrossRef] [Green Version]
  16. Ramírez-Gil, J.G.; Henao-Rojas, J.C.; Morales-Osorio, J.G. Postharvest diseases and disorders in avocado cv. Hass and their relationship to preharvest management practices. Heliyon 2021, 7, e05905. [Google Scholar] [CrossRef] [PubMed]
  17. Gancarz, M. At harvest prediction of the susceptibility of potato varieties to blackspot after impact over long-term storage. Postharvest Biol. Technol. 2018, 142, 93–98. [Google Scholar] [CrossRef]
  18. Rivera, S.A.; Ferreyra, R.; Robledo, P.; Selles, G.; Arpaia, M.L.; Saavedra, J.; Defilippi, B.G. Identification of preharvest factors determining postharvest ripening behaviors in ‘Hass’ avocado under long term storage. Sci. Hortic. 2017, 216, 29–37. [Google Scholar] [CrossRef]
  19. Mery, D.; Pedreschi, F. Segmentation of colour food images using a robust algorithm. J. Food Eng. 2005, 66, 353–360. [Google Scholar] [CrossRef]
  20. Mery, D. BALU: A Toolbox Matlab for Computer Vision, Pattern Recognition and Image Processing. 2011. Available online: http://dmery.ing.puc.cl/index.php/balu (accessed on 17 August 2020).
  21. Rastislav, L.; Plataniotis, K.N. (Eds.) Color Image Processing: Method Sand Applications; CRC Press: Boca Raton, FL, USA, 2018. [Google Scholar]
  22. Liu, F.; Kong, Y. Zoib: An R package for Bayesian inference for beta regression and zero/one inflated beta regression. R J. 2015, 7, 34–51. [Google Scholar] [CrossRef] [Green Version]
  23. Plummer, M. JAGS. 2014. Available online: http://mcmc-jags.sourceforge.net/ (accessed on 8 December 2020).
  24. Bermúdez, A.; Ballesteros, D.; Sánchez, G. Image analysis for automatic feature estimation of Mangifera indica fruit. Ing. Y Desarro. 2013, 31, 84–104. [Google Scholar]
  25. Bhargava, A.; Bansal, A. Fruits and vegetables quality evaluation using computer vision: A review. J. King Saud Univ. Comput. Inf. Sci. 2021, 33, 243–257. [Google Scholar] [CrossRef]
  26. Barbedo, J.G.A. Digital image processing techniques for detecting, quantifying and classifying plant diseases. SpringerPlus 2013, 2, 1–12. [Google Scholar] [CrossRef] [PubMed] [Green Version]
  27. Bock, C.H.; Poole, G.H.; Parker, P.E.; Gottwald, T.R. Plant disease severity estimated visually by digital photography and image analysis and hyperspectral imaging. Crit. Rev. Plant. Sci. 2010, 29, 59–107. [Google Scholar] [CrossRef]
  28. Munhuweyi, K.; Mpai, S.; Sivakumar, D. Extension of Avocado Fruit Postharvest Quality Using Non-Chemical Treatments. Agronomy 2020, 10, 212. [Google Scholar] [CrossRef] [Green Version]
  29. Woolf, A.; Cox, K.; White, A.; Ferguson, I.B. Low temperature conditioning treatments reduce external chilling injury of ‘Hass’ avocados. Postharvest Biol. Technol. 2003, 28, 113–122. [Google Scholar] [CrossRef] [Green Version]
  30. Gopu, V.; Meena, C.K.; Shetty, P.H. Quercetin influences quorum sensing in food borne bacteria: In-vitro and in-silico evi-dence. PLoS ONE 2015, 10, e0134684. [Google Scholar] [CrossRef] [Green Version]
  31. Liu, Y.; Chen, Y.R.; Wang, C.Y.; Chan, D.E.; Kim, M.S. Development of hyperspectral imaging technique for the detection of chilling injury in cucumbers; spectral and image analysis. Appl. Eng. Agric. 2006, 22, 101–111. [Google Scholar] [CrossRef]
  32. Mendieta, B.; Olaeta, J.A.; Pedreschi, R.; Undurraga, P. Reduction of cold damage during cold storage of Hass avocado by a combined use of pre-conditioning and waxing. Sci. Hortic. 2016, 200, 119–124. [Google Scholar] [CrossRef]
  33. Everett, K.R.; Hallett, I.; Yeasley, C.; Lallu, N.; Rees-George, J.; Pak, H.A. Morphological changes in lenticel structure resulting from imbibition and susceptibility to handling damage. NZAGA 2001, 1, 47–53. [Google Scholar]
  34. Blakey, R.J.; Tesfay, S.Z.; Bertling, I.; Bower, J.P. Changes in sugars, total protein, and oil in ‘Hass’ avocado (Persea americana Mill.) fruit during ripening. J. Hortic. Sci. Biotechnol. 2012, 87, 381–387. [Google Scholar] [CrossRef]
Figure 1. Hedonic scale for evaluating lenticel damage: 0 = fruit with no damage, 1 = fruit with damage less than 25%, 2 = fruit with damage greater than 25% but less than 50% and 3 = fruit with 50% or more of the surface damaged. Own elaboration.
Agronomy 11 01699 g001
Figure 2. Hedonic scale for black spot severity: 0 = fruit without damage, 1 = fruit with damage less than 25%, 2 = fruit with damage greater than 25% but less than 50% and 3 = fruit with damage greater than 50% damage. Own elaboration.
Agronomy 11 01699 g002
Figure 3. Diagram of the photographic set used to monitor fruit in storage. (A) LED spotlight (17 W); (B) avocado cv. Hass; (C) photographic set; (D) camera, (E) support table.
Agronomy 11 01699 g003
Figure 4. Segmentation and spot counting (“large spots” corresponding to “black spot” and “small spots” corresponding to “lenticel damage”) in each avocado using image analysis. First image corresponds to the input.
Agronomy 11 01699 g004
Figure 5. (A) Spearman’s correlation (rho = 0.19, p = 3.7 × 10⁻⁵) and linear regression (Y = 22.874 + 0.802X, R2 = 0.025) between lenticel damage evaluation by image analysis (small spots) and the evaluation using hedonic scale expressed as SI. (B) Corresponds to the Spearman correlation (rho = 0.83, p < 2.2 × 10⁻¹⁶) and linear regression (Y = 13.427 + 0.855X, R2 = 0.204) between black spot evaluated by image analysis (large spots) and the evaluation using hedonic scale expressed as SI. A total of 480 observations were used, obtained from both harvest stages and three evaluated orchards. Each point represents a condition (20 fruits per condition were evaluated).
Agronomy 11 01699 g005
Figure 6. Predicted and observed values of (A) weight loss and (B) black spot as a function of lenticel damage. Predicted values were obtained as a posterior mean after an MCMC procedure using a Bayesian framework.
Agronomy 11 01699 g006
Figure 7. (A) Multivariate analysis, linear discriminant analysis (LDA). Red spot represents Bartolillo; green spot represents El Rancho; calypso spot represents La Ensenada; and purple spot represents Quilhuica. (B) Feature selection technique via information gain algorithm carried out for black spot and lenticel damage.
Agronomy 11 01699 g007
Table 1. Means followed by standard errors of the mean of weight loss (WL) at 5 °C, at exit of the storage, at the ready-to-eat (RTE) stage, severity index (SI%) of black spot and lenticel damage from each orchard evaluated in an independent form at early harvest. Tukey HSD (p < 0.05) test was used as a mean comparison test. Lowercase letters compare differences between the harvest systems (i.e., appropriate and conventional) in rows, and uppercase letters compare the differences between the harvest time (i.e., harvest at 9 h and 14 h) in columns for each variable evaluated in an independent manner.
OrchardSystemWL at 5 °C (%)WL at Exit Storage (%)WL at RTE (%)Black Spot (SI%)Lenticel Damage (SI%)
9:0014:009:0014:009:0014:009:0014:009:0014:00
RanchoAppropriate0.75 ± 0.11 aA0.54 ± 0.07 aA5.70 ± 0.13 aA5.70 ± 0.13 aA14.3 ± 0.27 aB13.07 ± 0.63 bA22.2 ± 0.0 bA36.8 ± 0.0 bB20.8 ± 0.0 aB16.6 ± 0.0 aA
Conventional1.08 ± 0.07 bA1.01 ± 0.09 bA6.55 ± 0.14 bB5.58 ± 0.13 aA13.7 ± 0.47 aB11.2 ± 0.23 aA19.9 ± 0.0 aA26.8 ± 0.0 aB24.4 ± 0.0 bB23 ± 0.0 bA
QuilhuicaAppropriate0.99 ± 0.12 aA1.50 ± 0.27 aB5.87 ± 0.16 aA6.60 ± 0.39 aA10.26 ± 0.35 aA13.85 ± 0.59 aB0 ± 0.0 aA0 ± 0.0 aA11.4 ± 0.0 aB9.25 ± 0.0 aA
Conventional0.88 ± 0.12 aA1.32 ± 0.10 aB5.95 ± 0.38 aA6.95 ± 0.30 aB12.36 ± 0.83 bA13.29 ± 0.60 aA0 ± 0.0 aA0 ± 0.0 aA19.2 ± 0.0 bA30 ± 0.0 bB
La EnsenadaAppropiate0.39 ± 0.03 aA0.30 ± 0.009 aA4.58 ± 0.23 aA4.53 ± 0.38 aA10.25 ± 0.29 aB8.63 ± 0.26 aA0 ± 0.0 aA0 ± 0.0 aA12.5 ± 0.0 aA30 ± 0.0 aB
Conventional0.88 ± 0.05 bA0.65 ± 0.16 bA4.92 ± 0.31 aA4.59 ± 0.22 aA9.51 ± 0.34 aA8.88 ± 0.29 aA0 ± 0.0 aA0 ± 0.0 aA23 ± 0.0 bA30 ± 0.0 aB
Table 2. Means followed by standard errors of the mean of weight loss (WL) at 5 °C, at exit of the storage, at the ready-to-eat (RTE) stage, severity index (SI%) of black spot and lenticel damage from each orchard evaluated in an independent form at middle harvest. Tukey HSD (p < 0.05) test was used as a mean comparison test. Lowercase letters compare differences between the harvest systems (i.e., appropriate and conventional) in rows, and uppercase letters compare the differences between the harvest time (i.e., harvest at 9 h and 14 h) in columns for each variable evaluated in an independent manner.
OrchardSystemWL at 5 °C (%)WL at Exit Storage (%)WL at RTE (%)Black Spot (SI%)Lenticel Damage (SI%)
9:0014:009:0014:009:0014:009:0014:009:0014:00
Ranchoappropriate0.56 ± 0.10 aA0.49 ± 0.04 aA5.73 ± 0.33 aA5.43 ± 0.09 aA10.09 ± 0.38 aA11.55 ± 0.31 bB4.6 ± 0.0 aA11.88 ± 0.0 bB28.2 ± 0.0 aA28.75 ± 0.0 aB
Conventional0.38 ± 0.03 aA0.53 ± 0.1 aA6.6 ± 0.35 bB5.73 ± 0.33 aA10.03 ± 0.28 aA10.10 ± 0.38 aA11.5 ± 0.0 bB6.58 ± 0.0 aA35 ± 0.0 bB30.26 ± 0.0 bA
Quilhuicaappropriate0.66 ± 0.13 aA0.71 ± 0.009 aA3.31 ± 0.07 aA3.42 ± 0.11 aA8.50 ± 0.19 aA9.69 ± 0.35 bB0 ± 0.0 aA0 ± 0.0 aA27.6 ± 0.0 aB17.8 ± 0.0 aA
Conventional0.73 ± 0.03 aA0.48 ± 0.05 aA4.13 ± 0.42 bB2.89 ± 0.08 aA9.57 ± 0.47 bB7.87 ± 0.29 aA0 ± 0.0 aA0 ± 0.0 aA37.4 ± 0.0 bB19 ± 0.0 bA
Bartolilloappropriate0.22 ± 0.03 aA0.37 ± 0.04 aB4.82 ± 0.14 aA4.57 ± 0.08 aA8.34 ± 0.19 aA7.98 ± 0.18 aA31.75 ± 0.0 bB28.75 ± 0.0 aA36.6 ± 0.0 aB26.6 ± 0.0 bA
Conventional0.61 ± 0.04 bB0.36 ± 0.06 aA6.77 ± 0.41 bB5.21 ± 0.14 aA11.62 ± 0.44 bB8.88 ± 0.21 bA16.75 ± 0.0 aA31.52 ± 0.0 bB53.86 ± 0.0 bB23.8 ± 0.0 aA
Publisher’s Note: MDPI stays neutral with regard to jurisdictional claims in published maps and institutional affiliations.

