Article

Evaluation of Traits’ Performance Contributing to Drought Tolerance in Sorghum

by
Andekelile Mwamahonje
1,2,*,
John Saviour Yaw Eleblu
1,
Kwadwo Ofori
1,
Tileye Feyissa
3,
Santosh Deshpande
4 and
Pangirayi Tongoona
1
1
West Africa Centre for Crop Improvement (WACCI), College of Basic and Applied Sciences, University of Ghana, Accra 00233, Ghana
2
Tanzania Agricultural Research Institute (TARI), Makutupora Centre, P.O. Box 1676, Dodoma 41026, Tanzania
3
Institute of Biotechnology, Addis Ababa University, P.O. Box 1176, Addis Ababa 1000, Ethiopia
4
International Crops Research Institute for the Semi-Arid Tropics, Patancheru 502324, India
*
Author to whom correspondence should be addressed.
Agronomy 2021, 11(9), 1698; https://doi.org/10.3390/agronomy11091698
Submission received: 22 June 2021 / Revised: 20 July 2021 / Accepted: 26 July 2021 / Published: 26 August 2021
(This article belongs to the Collection Crop Physiology and Stress)

Abstract

:
Sorghum (Sorghum bicolor [L.] Moench) is an important food crop for people in semi-arid Africa. The crop is affected by post-flowering drought; therefore, the study was conducted to screen traits contributing to drought tolerance using BC2F4 sorghum genotypes in stressed and unstressed water conditions in a split-plot design. Water stress (0 mm/day) was applied at post-flowering to plant maturity in water-stressed treatment. The genotype SE438 produced the highest grain yield (2.65 ton ha−1) in water-stressed environment and NA316C yielded highest (3.42 ton ha−1) under well-watered (7 mm/day) environment. There were significant differences of most traits evaluated at p < 0.01 across environments. The mean squares of traits for genotypes by environments revealed interactions at p < 0.05 and p < 0.01. The indices geometric mean productivity (GMP) and mean productivity (MP) were highly correlated with yield under well-watered (YP) and water-stressed condition (YS) and each other. The first principal axis (PC1) explained 59.1% of the total variation. It is the best indicator of yield potential and drought tolerance of sorghum genotypes in this study. Therefore, further improvement is needed to strengthen drought tolerance and yield in sorghum.

1. Introduction

Globally, sorghum (Sorghum bicolor [L.] Moench) ranks fifth of the important staple food crops after maize, rice, wheat and barley. It is one of the major food crops to 500 million people in Africa and Asia [1]. Drought is one of the major constraints of sorghum production. Drought tolerance in sorghum is enhanced by different genes; each gene contributes partly to drought tolerance [2]. Breeding sorghum for drought tolerance focuses on the incorporation of many traits; for instance, stay green (STG), lower leaf canopy, leaf rolling, and reduced transpiration. These traits are negatively correlated with yield in sorghum during drought stresses [3]. Plants with a deep root system and STG retention show resistance to post-flowering under limited water condition. Deep roots help plants to uptake sufficient water and nutrients required for plants [4]. The root system in sorghum is well developed, which helps to absorb water and nutrients from the soil for survival of the crop under limited water condition [5]. In addition, leaf dry matter, root biomass, flag leaf area, leaf weight, grain yield and plant height are among the parameters used for multivariate analysis to screen drought-tolerant crops [6,7,8,9]. Multivariate analysis helps to identify traits that contribute to drought tolerance in sorghum [10]. Combinations of different traits contribute to drought tolerance in sorghum; for instance, plants with long root length and root dry weight have higher drought tolerance [11]. Furthermore, leaf rolling is used as an indicator to identify drought-tolerant plants [12].
In sorghum, lines with high tolerance to drought show leaf rolling under limited moisture content in the soil. Leaf rolling is correlated with leaf water potential; leaves start to roll following reduction of leaf water potential; however, it depends on the variety [13]. Plants adjust osmotic water potential under low water leaf potential to reduce leaf rolling during drought stress condition, which favors plant physiological growth and final yield [14]. Leaf-rolling trait is used for screening drought tolerance and high yield sorghum. Drought-tolerant varieties show reduced leaf rolling due to effective adjustment of osmotic potential in low leaf water potential under water stress. Plants use reduction in leaf area, root biomass, dry matter content and yield under drought condition as the mechanism of survival [15]. Drought-tolerant lines produce relative higher grain yield of sorghum compared to susceptible lines. During screening for drought tolerance, lines that are tolerant to drought are screened for agronomic traits useful for the development of new varieties. The objectives of this study were to determine yield performance of sorghum genotypes, evaluate multivariate analysis of traits that contribute to drought tolerance and determine the heritability of drought tolerance (traits) in sorghum under well-watered and water-stressed conditions.

2. Materials and Methods

2.1. Location of the Study

The study was conducted at TARI–Makutupora Centre, located 22 km north of Dodoma municipality in Dodoma region (longitude 35°46.093′ E and latitude 05°58.669′ S) (altitude 1070 m) in Tanzania. The annual rainfall ranges from 300 to 700 mm with an average of 500 mm with poor distribution, temperature varies from 15–35 °C [16]. The area is classified as semi-arid, which is characterized by a monomodal rainfall pattern. The area receives rainfall from December to April, followed by a long dry season from May to November. Soil in the experimental area is classified as Rhodic Cambisol [17]. The use of sorghum plants in the present study complies with international, national and/or institutional guidelines.

2.2. Description of the Plant Materials Used

The donor parent B35 sorghum material was requested from ICRISAT in India and Texas A&M University in United States of America. The recurrent parent Seguifa was requested from ICRISAT Mali. The recurrent parent NACO Mtama 1 and the control Wahi were collected from TARI in Tanzania by complying with the International and National guidelines of seed import. The donor parent B35 contains QTLs that confer drought tolerance in sorghum; it is used for introgression to non-STG sorghum genotypes for the retention of greenness in leaves during post-flowering drought. NACO Mtama 1 and Seguifa are high yielding (2.5 and 2 ton ha−1) varieties under moderate rainfall, but are not tolerant to post-flowering drought, leading to 1 ton ha−1 in sorghum-producing areas. These parents were used to develop BC2F4 genotypes with the STG trait used in this study.

2.3. Description of the Detection of QTLs Conferring Stay-Green Trait in Sorghum

BC2F1 plants were planted for genotyping using SNPs markers to identify plants that contained STG quantitative trait loci (QTL). Previous studies generated SNPs markers associated with STG 3A and 3B QTLs in sorghum using SNPs markers. These markers were used for checking the presence of STG 3A and 3B QTLs before selfing to BC2F4 genotypes for field screening. However, few genotypes that lacked STG QTLs were also included in the field evaluation for performance comparison.

2.4. Multivariate Analysis

Prior to multivariate analysis, BC2F1 plants were self-pollinated before flowering to avoid outcrossing. Each plant was selfed using pollination bags until soft doughing. Seeds were harvested from plants of each BC2F1 populations. Plants with the best performance in terms of heading, grain vigor, grain size and other yield related traits were chosen for generating BC2F2 populations. A total of six genotypes from BC2F1 populations, that is, W82, SE408, SE438, NA307, NA316 and NA241 with B35*Wahi, B35*Seguifa, and B35*NACO Mtama 1 parents background were selected as the best genotypes under genotypic and phenotypic evaluation. Lines having at least one STG QTL were selected and used to generate BC2F2 populations. The genotypes of BC2F2 populations were planted on 29 May 2019 and genotypes of BC2F3 population were planted 25 October 2019 with the spacing of 0.75 m between rows and 0.3 m within rows. Prior to pre-flowering, BC2F2 plants were self-pollinated to generate BC2F3 and BC2F4 populations.
Each genotype treatment in well-watered and stressed environments was treated with 60 kg ha−1 N, 30 kg ha−1 P2O5 and 30 kg ha−1 K2O fertilizers two weeks after seed emergence. Weeding was done thrice from planting to harvest using a hand hoe. The chemical with chlorpyrifos as the active ingredient was sprayed at the rate of 1 L ha−1 to control different kinds of pests in sorghum plants.
Phenotypic data including the number of seeds per panicle and plant height (cm), and the number of leaves were recorded from the breeding site. Plant height was measured at the distance from the ground to the top of the panicle using a tape measure. Leaf length (cm), leaf width (cm), panicle length (cm), panicle width (cm) and panicle exsertion (cm) was measured using a ruler. Data collection included recording the identity of plants that were responding well on yield-related traits; this was then used for field evaluation. A total of eight genotypes from BC2F4 populations, including NA241A, NA241B, NA316A, NA316B, NA316C, NA307, SE408 and SE438, were selected as the best genotypes for generating BC2F4 populations.

2.5. Experimental Design

The experiment was conducted under field condition in two environments, well-watered and stressed conditions, during off-season using a split plot on the complete randomized block design (CRBD) with three replications. The total area for each trial was 1000 m2. Genotypes of BC2F4 sorghum populations were planted in five rows per replication with spacing of 0.75 m × 0.3 m between rows and within rows, respectively. The genotypes were evaluated in well-watered and stressed water environments in one location for two seasons in 2019 and 2020. The main treatment in the main plot was irrigation regimes while subtreatment in the subplot was sorghum genotypes of BC2F4 populations. Well-watered treatment was fully irrigated from the date of planting to 50% physiological maturity. Water was withheld in the water-stressed treatment when plants had reached 50% flowering. The yield-related traits were evaluated in well-watered and stressed plots.
The moisture content in the soil was determined using the ceramic plate method [18]. The average moisture content at field capacity under well-watered condition was 29.1%, and 18.2% under a stressed environment.
The interaction between sorghum genotypes generated and irrigation regimes was determined using the model Yij = µ + gi + ej+ geij +eij, where; Yij is the measured mean of ith genotype and jth environment, µ is the grand mean, gi is the main effect of genotype, ej is the main effect of environment, geij is the interaction of ith genotype and jth environment, eij is an experimental error associated with ith genotype and jth environment.

2.6. Determination of Indices of Drought Tolerance in Sorghum Genotypes

Six selection indices including stress susceptibility index (SSI), stress tolerance index (STI), stress tolerance (TOL) [19], MP [19], GMP, stress intensity (SI) and yield stability index (YSI) were calculated based on grain yield under drought-stressed and irrigated conditions. TOL attributes were computed based on the formula:
SSI = [1 − (Ys)/(Yp)]/SI.
SI is the stress intensity and calculated as:
SI = [1 − (Ȳs)/(Ȳp)],
GMP = √ (Yp × Ys),
TOL = (Yp − Ys) and
MP = (Yp + Ys)/2
YSI = Ys/Yp
Reduction % = (Yp − Ys)/Yp
where Ys and Yp are the yields of B2F3 populations assessed under water stress and well-watered condition trials, and Ȳs and Ȳp are the mean yields over all populations assessed in two conditions.

2.7. Determination of Heritability of Sorghum Parents

The heritability of donor and recurrent parents was determined based on the interaction between genotypes and environments. The interactions of sorghum lines with the environment were determined based on the phenotypic parameters, which were collected in the field trial. Broad-sense heritability (H) of the parent lines was computed using the formula that follows:
H = σ2g/(σ2g + σ2gxe + σ2e)
where σ2g = genotypic variance, σ2gxe = genotype × environment variance and σ2e = environmental variance (residual error).
Genotypic variance was computed as follows:
σ2g = (MSg − MSgxe − MSe)/re
where MSg = mean square of the genotypes, MSgxe = mean square of the genotype × environment interactions, MSe = mean square of the residual error (environmental variance), r = number of replications and e = number of environments.
Genotype x environment interaction variance was computed as follows:
σ2gxe = (MSgxe − MSe)/r.

2.8. Data Collection and Statistical Data Analysis

Ten plants were tagged with labels per plot for data collection. The parameters recorded for drought tolerance indices and yield-related traits were root biomass, stem biomass, chlorophyll content, 1000-seed weight, STG, inflorescence exsertion and panicle weight. Yield of grain weight under well-watered and stress-managed trials were measured using a digital weighing balance. Ten sample plants per plot were used for root and stem biomass evaluation. Root biomass was collected by digging from the ground below the base of plant, stem biomass was taken from above the ground to the base of panicle; these two parameters were subject to oven-drying at 70 °C for three days. Chlorophyll content was measured using atLEAF from a single leaf on the top, middle and bottom part of the plant, where the average chlorophyll content of the three leaves was recorded. Leaf rolling was scored using a scale of 1 to 5 where 1—no leaf rolling, 2—low leaf rolling, 3—intermediate leaf rolling, 4—high leaf rolling and 5—extremely high leaf rolling (death of leaves). STG was scored using susceptibility scale from 1 to 9 where 1—very low or no visible sign of susceptibility, 3—low, 5—intermediate, 7—high and 9—very high. Inflorescence exsertion was recorded using the scale of 1 to 4, where 1—slightly exserted (< 2 cm but ligule of hag leaf definitively below inflorescence base), 2—exserted (2–10 cm between ligule and inflorescence base) 3—well-exserted (>10 cm between ligule and inflorescence base), 4—peduncle recurved (inflorescence below ligule and clearly exposed splitting the leaf sheath). Total number of green leaves per plant at physiological maturity was counted in both well-watered and water-stress trials. The sorghum descriptors used for data collection were developed by collaboration of the International Board for Plant Genetic Resources (IBPGR) in the Netherlands and International Crops Research Institute for the Semi-Arid Tropics (ICRISAT) in India [20].
Multivariate statistical analyses such as the principal component analysis (PCA) were computed by using GENSTAT 12th edition, SAS software version 9.4 and R software of the current version. The mean separation was determined using least significance difference at 5% confidence interval.

3. Results

Segregation was observed among populations evaluated after selfing BC2F1 generation. Ten percent of the total plants planted per BC2F1 populations were screened for performance of traits. A total of six genotypes (NA241, NA307, NA 316, SE408, SE438 and W82) were selected from the best 10% of screened plants (Table 1).

3.1. Grain Yield Performance of Sorghum Populations under Well-Watered and Water-Stress Environments

In well-watered environment, the population NA316C yielded the highest with the mean yield of 3.42 ton ha−1, followed by NA307 with the mean yield of 3.16 ton ha−1, Seguifa (recurrent parent) mean yield of 2.91 ton ha−1 and SE 438 with 2.77 ton ha−1 (Table 2). The lowest yield was recorded in the donor parent B35 with mean yield of 1.77 ton ha−1. Under stress environments, the best performing genotypes included SE438 with mean yield of 2.65 ton ha−1, followed by NA316C with mean yield of 2.59 ton ha−1 and NA307 with 2.56 ton ha−1. The genotype B35 resulted in the lowest mean yield (1.71 ton ha−1) of all populations evaluated. The yield of genotypes SE408 and SE438 in the water-stressed environment outperformed the yield in the unstressed environment.

3.2. Percentage Yield Increases of BC2F4 Genotypes Versus Recurrent Parents under Water-Stressed Condition

Compared with the recurrent parent, the highest (30.7%) percentage yield increase of grain per hectare was recorded in the genotype NA316C followed by NA307 (29.2%) for the recurrent parent NACO Mtama 1 (Table 3). The genotype SE408 had the lowest yield increase of −1.5% when compared with the recurrent parent Seguifa. The percentage yield increase of other backcrosses compared with the recurrent parent ranged from 5.2 to 14%.

3.3. Distribution of Chlorophyll Content in Sorghum Genotypes

The evaluation of chlorophyll content distribution indicated that the highest content was found in the middle leaves of sorghum plants in both environments. Results in the water-stressed environment indicated that the donor parent B35 expressed the highest chlorophyll content with 59.04 g−1 at the top leaf, 60.71 at the middle and 51.4 g−1 at the bottom leaf (Table 4). The genotype SE438 expressed the highest chlorophyll content (47.18, 52.14 and 44.96 g−1) at top, middle and bottom leaves of the plant, respectively. A majority of the genotypes (NA316C, NA307, NA241B, SE408, Seguifa, NACO Mtama 1, Wahi, S438 and B35) had chlorophyll content above 30 g−1 in all parts of the plant that have been recommended for sorghum. However, the overall chlorophyll content was higher in the donor parent and recurrent parents except for genotype SE438.
Results in the well-watered environment showed greater than 35 g−1 of chlorophyll content on top, middle and bottom leaves of all sorghum genotypes. The genotypes SE438, NA316C and the parents B35 and Seguifa resulted in greater than 46 g−1 of chlorophyll content in both parts of the plant. For all genotypes evaluated in the well-watered environment, B35 showed the highest chlorophyll content (66.01, 63.94 and 58.23 g−1) on the top, middle and bottom plant leaves (Table 4).
There were significant differences in traits (plant height, leaf rolling, grain weight per plant, panicle weight per plant and STG) of sorghum genotypes at p < 0.001 under well-watered and water-stress treatments (Table 5 and Table 6). The mean performance of plant height was the highest (142.2 cm) in population NA316, followed by NA316B with 139 cm in the stressed environment. The donor parent exhibited the lowest (95.5 cm) plant height in the water-stressed trial; however, there were no significant differences among populations tested. In the well-watered trial, the genotype NA316A and NA316C indicated the high performance of plant height with 143.3 cm and 140.3 cm, while the lowest plant height (94.6 cm) was recorded in the donor parent B35. There were significance differences of leaf rolling in the genotypes NA241B, NA316A, NA316BB, SE408, local check Wahi and the donor parent B35 in the water-stressed trial (Table 6). The score of leaf rolling for the genotypes NA241A, NA316C, NA307, NACO Mtama 1, Seguifa and SE438 varied but were not significant. The genotypes SE438 and NA316C scored low leaf rolling in both environments. The parent NACO Mtama 1 had the lowest score of leaf rolling under well-watered condition, and the genotypes NA307 and SE438 had the lowest score of leaf rolling for the remaining genotypes under water-stressed condition.
In this study, there were variations (p < 0.05) for the total number of leaves counted at physiological plant maturity among sorghum genotypes evaluated in water-irrigated and water-stressed conditions. The genotype NA307 showed the highest total number of leaves of backcross genotypes across the environments. The donor parent B35 and check Wahi showed the highest (3.53 and 2.73) total number of green leaves at maturity when compared with backcross genotypes under water-stress environment. A similar trend was recorded in the well-watered environment (Table 5 and Table 6).
The genotypes NA316C and NA316A showed 3.87 and 4.2 ratings for STG, similar to the check Wahi and B35 with 3.73 and 4.13 ratings of STG, respectively, in the well-irrigated environment (Table 5). The genotype NA241B and NA316A had 5.6 and 5.8 ratings for STG, similar to the check Wahi, which showed 5.7 STG under water-stressed environment (Table 5). The genotype NA316A performed well across the environments. The lowest STG rating (5.8) was recorded from the genotype NA241B in water-irrigated and the lowest STG (7.3) in the genotype NA241A in water-stressed environment.
Based on the root biomass, genotypes NA316C and NA316A produced greater amounts (0.068 and 0.052 kg) than other backcross genotypes, except parents B35 and Seguifa, which produced the greatest root biomass in water-irrigated condition (Table 5). The lowest (0.04 kg) root biomass was reported on genotype SE408 in unstressed condition. Similarly, there were significant differences among genotypes evaluated in the stressed condition, whereas check Wahi recorded the greatest (0.058 kg) root biomass, followed by B35 (0.048 kg). The genotypes SE 438 and NA307 (45 g) performed well in root biomass accumulation. The genotypes NA241A and SE408 were significantly affected by post-flowering drought, resulting in less than 0.037 kg of root biomass (Table 6).
The genotypes NA307, NA316C and S438 performed well in panicle weight (per plant in well-watered condition, with 0.88, 0.8 and 0.74 kg, and 0.79, 0.7 and 0.74 kg in water-stressed environments, respectively (Table 5 and Table 6). The panicles per plant showed significant differences among the genotypes at p < 0.05.
The genotypes NA316C and NA307 produced high yield across the environments. Genotypes NA316C recorded the highest (0.077 kg) grain yield per plant under well-watered condition (Table 5). The genotype SE438 produced the highest (0.06 kg) grain yield per plant in the water-stress environment (Table 6).
The mean square values of various traits evaluated between genotypes by environments revealed interactions (at p < 0.05 and p < 0.01) (Table 7). The interaction was recorded from nine traits including days to 50% flowering, leaf rolling, chlorophyll content, total number of green leaves at plant maturity, panicle weight per plant, root biomass and stem biomass. The mean squares for genotypes were significant (at p < 0.01) for days to 50% flowering, plant height, chlorophyll content, total number of green leaves at plant maturity and 1000-seed grain weight, and at p < 0.05 for leaf rolling, stem biomass and panicle weight per plant traits. The majority of the traits evaluated for mean square performance between genotypes by environments showed no significant differences except yield of 1000-seed grain weight.
There were positive and negative correlation coefficients among traits contributing to drought tolerance and yield in sorghum populations (Table 8). The traits of panicle weight, panicle width and panicle length were significantly correlated with grain yield. STG and inflorescence exsertion were negatively correlated with grain yield. Panicle width and panicle weight were strongly correlated to grain yield and each other. Chlorophyll content was positive and significantly correlated with total number of green leaves at maturity. Plant height was correlated with panicle weight; however, it was less correlated with grain yield. STG and inflorescence exsertion showed negative correlation with most traits. However, both showed nonsignificant positive correlation with plant height. The largest negative correlation was between traits STG and total number of green leaves at maturity, and STG and chlorophyll content.

3.4. Heritability

The broad-sense heritability estimates varied from 88.2% of plant height to 64.2% of grain weight in water-irrigated condition and from 89.1% of plant height to 65% of leaf rolling in water-stressed condition (Table 9). The traits of stem biomass, root biomass, 1000-seed weight and chlorophyll content recorded above 85% of broad-sense heritability estimates in both environments. The average heritability for both environments was about 80%.
Plant height showed the highest (89.52%) broad-sense heritability of all traits determined by days to 50% flowering (80.88%) and 80% of stem biomass between genotypes by environments. The root biomass indicated the lowest broad-sense heritability (12.38%) followed by STG (17.64%) across the environments (Table 10).

3.5. PCA of the Traits

PCA of YS and YP showed two principal components in which PC1 explained 85.99% of the total variation while PC2 explained 14.01% of the variation (Figure 1).

3.6. Drought Stress Indices

Based on grain yield results, the highest MP and GMP were recorded for populations NA316C (3.42 and 2.59 ton ha−1) and NA307 (3.16 and 2.56 ton ha−1), suggesting these genotypes are stable for high yield across the environments (Table 11). Yield based on STI indicated that the population NA316C (with mean yield 3.42 and 2.59 ton ha−1), NA307 (3.16 and 2.56 ton ha−1) and SE438 (2.77 and 2.65 ton ha−1) performed the best across the environments with the STI values 1.39, 1.27 and 1.15, respectively. The highest values (830, 652 and 607) of TOL were recorded in the populations NA316C (3.42 and 2.59 ton ha−1), Seguifa (2.63 and 1.98 ton ha−1) and NA307 (3.16 and 2.56 ton ha−1). The lowest values (−385, −252 and 66) were recorded in the populations Wahi with mean yield of 2.03 and 2.42 ton ha−1, SE408 (2.04 and 2.3 ton ha−1) and NA316B (2.3 and 2.23 ton ha−1). These populations performed differently across the environments.
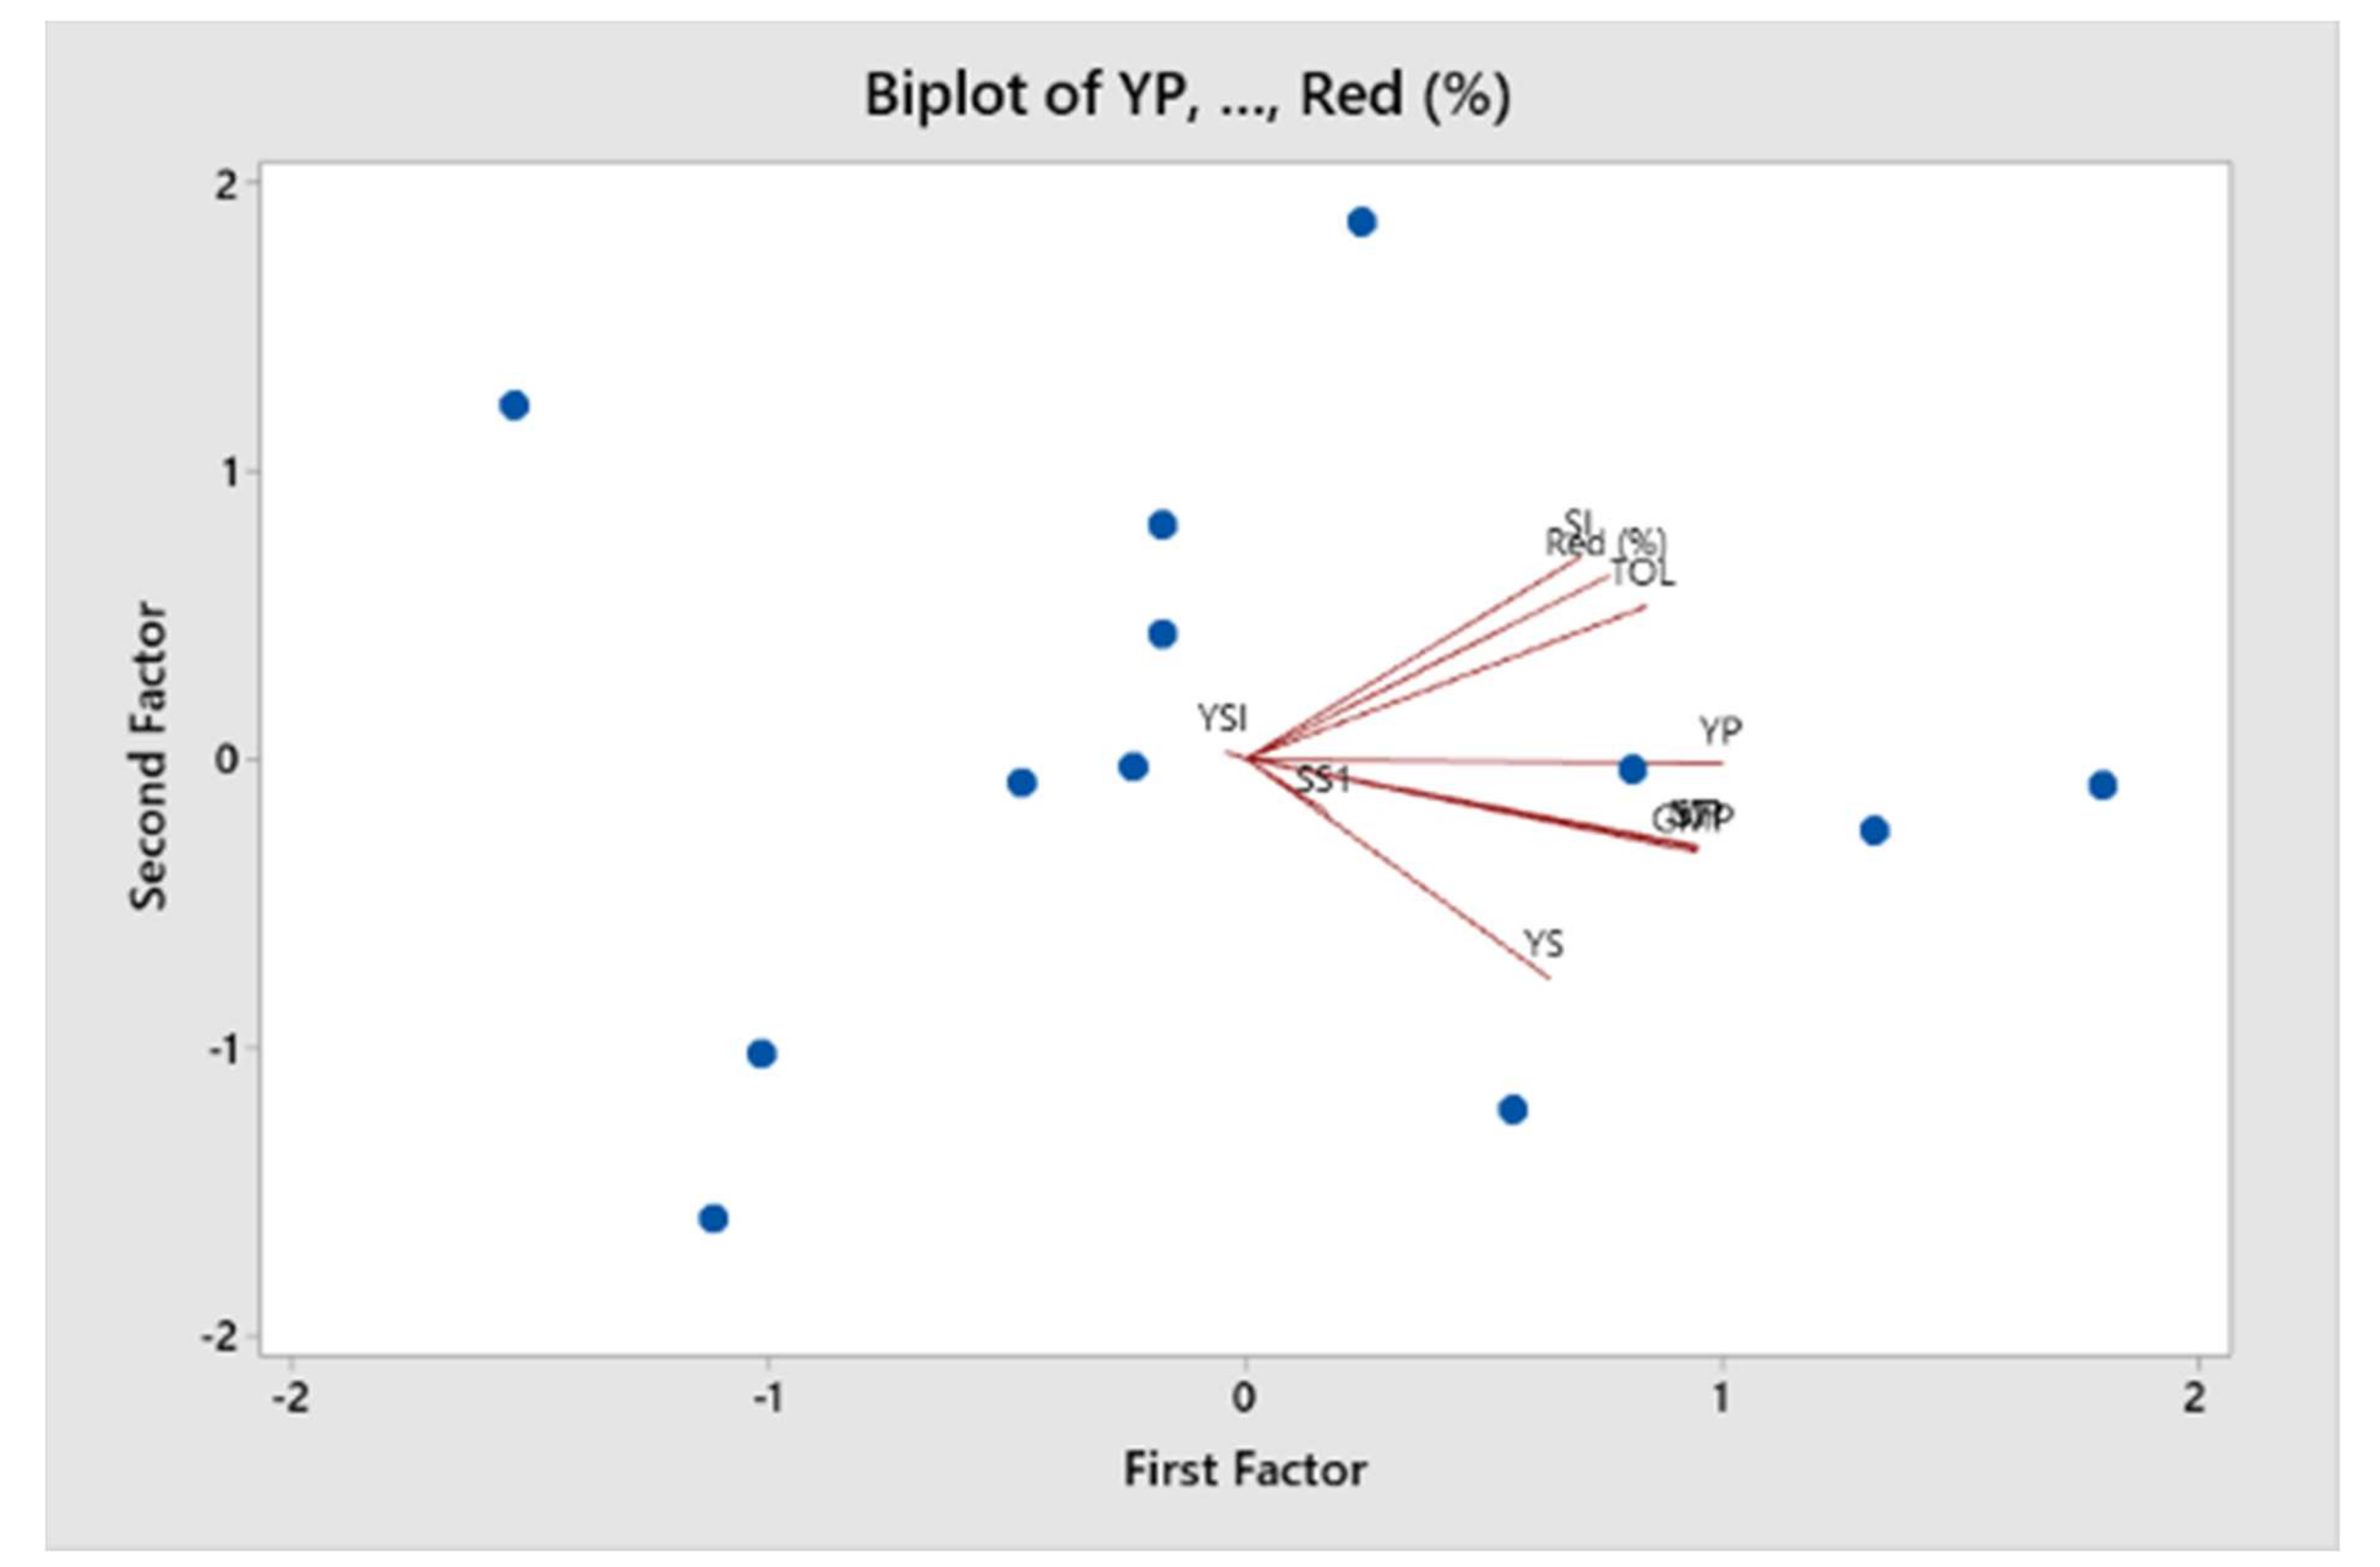
Correlation coefficients were used as a tool to determine the promising criteria for drought-tolerant populations (Table 12). The indices GMP and MP were highly correlated with YP and YS and each other. TOL was positively correlated with yield by 0.83 under water-irrigated environment and low correlation with yield by 0.12 under water-stressed condition. The contrasting correlation between TOL and YP and YS suggested the reduction of grain yield under well-watered condition thus is not recommended for selection of promising populations for drought tolerance indices. There were no significant correlations between SSI and the other indices. SSI is the best index for selection of populations with low yield and drought tolerance to water-stressed condition. YSI was strongly correlated with STI and negatively correlated with YP, TOL, MP, GMP and SSI. Red was only positively correlated with TOL and MP; the remaining indices were negatively correlated and nonsignificant. TOL was positively correlated with MP and GMP but not strongly correlated with YP. Furthermore, SSI indicated nonsignificant correlation with MP and GMP. The lowest correlation was found between Red and YSI and the indices between YSI and TOL.
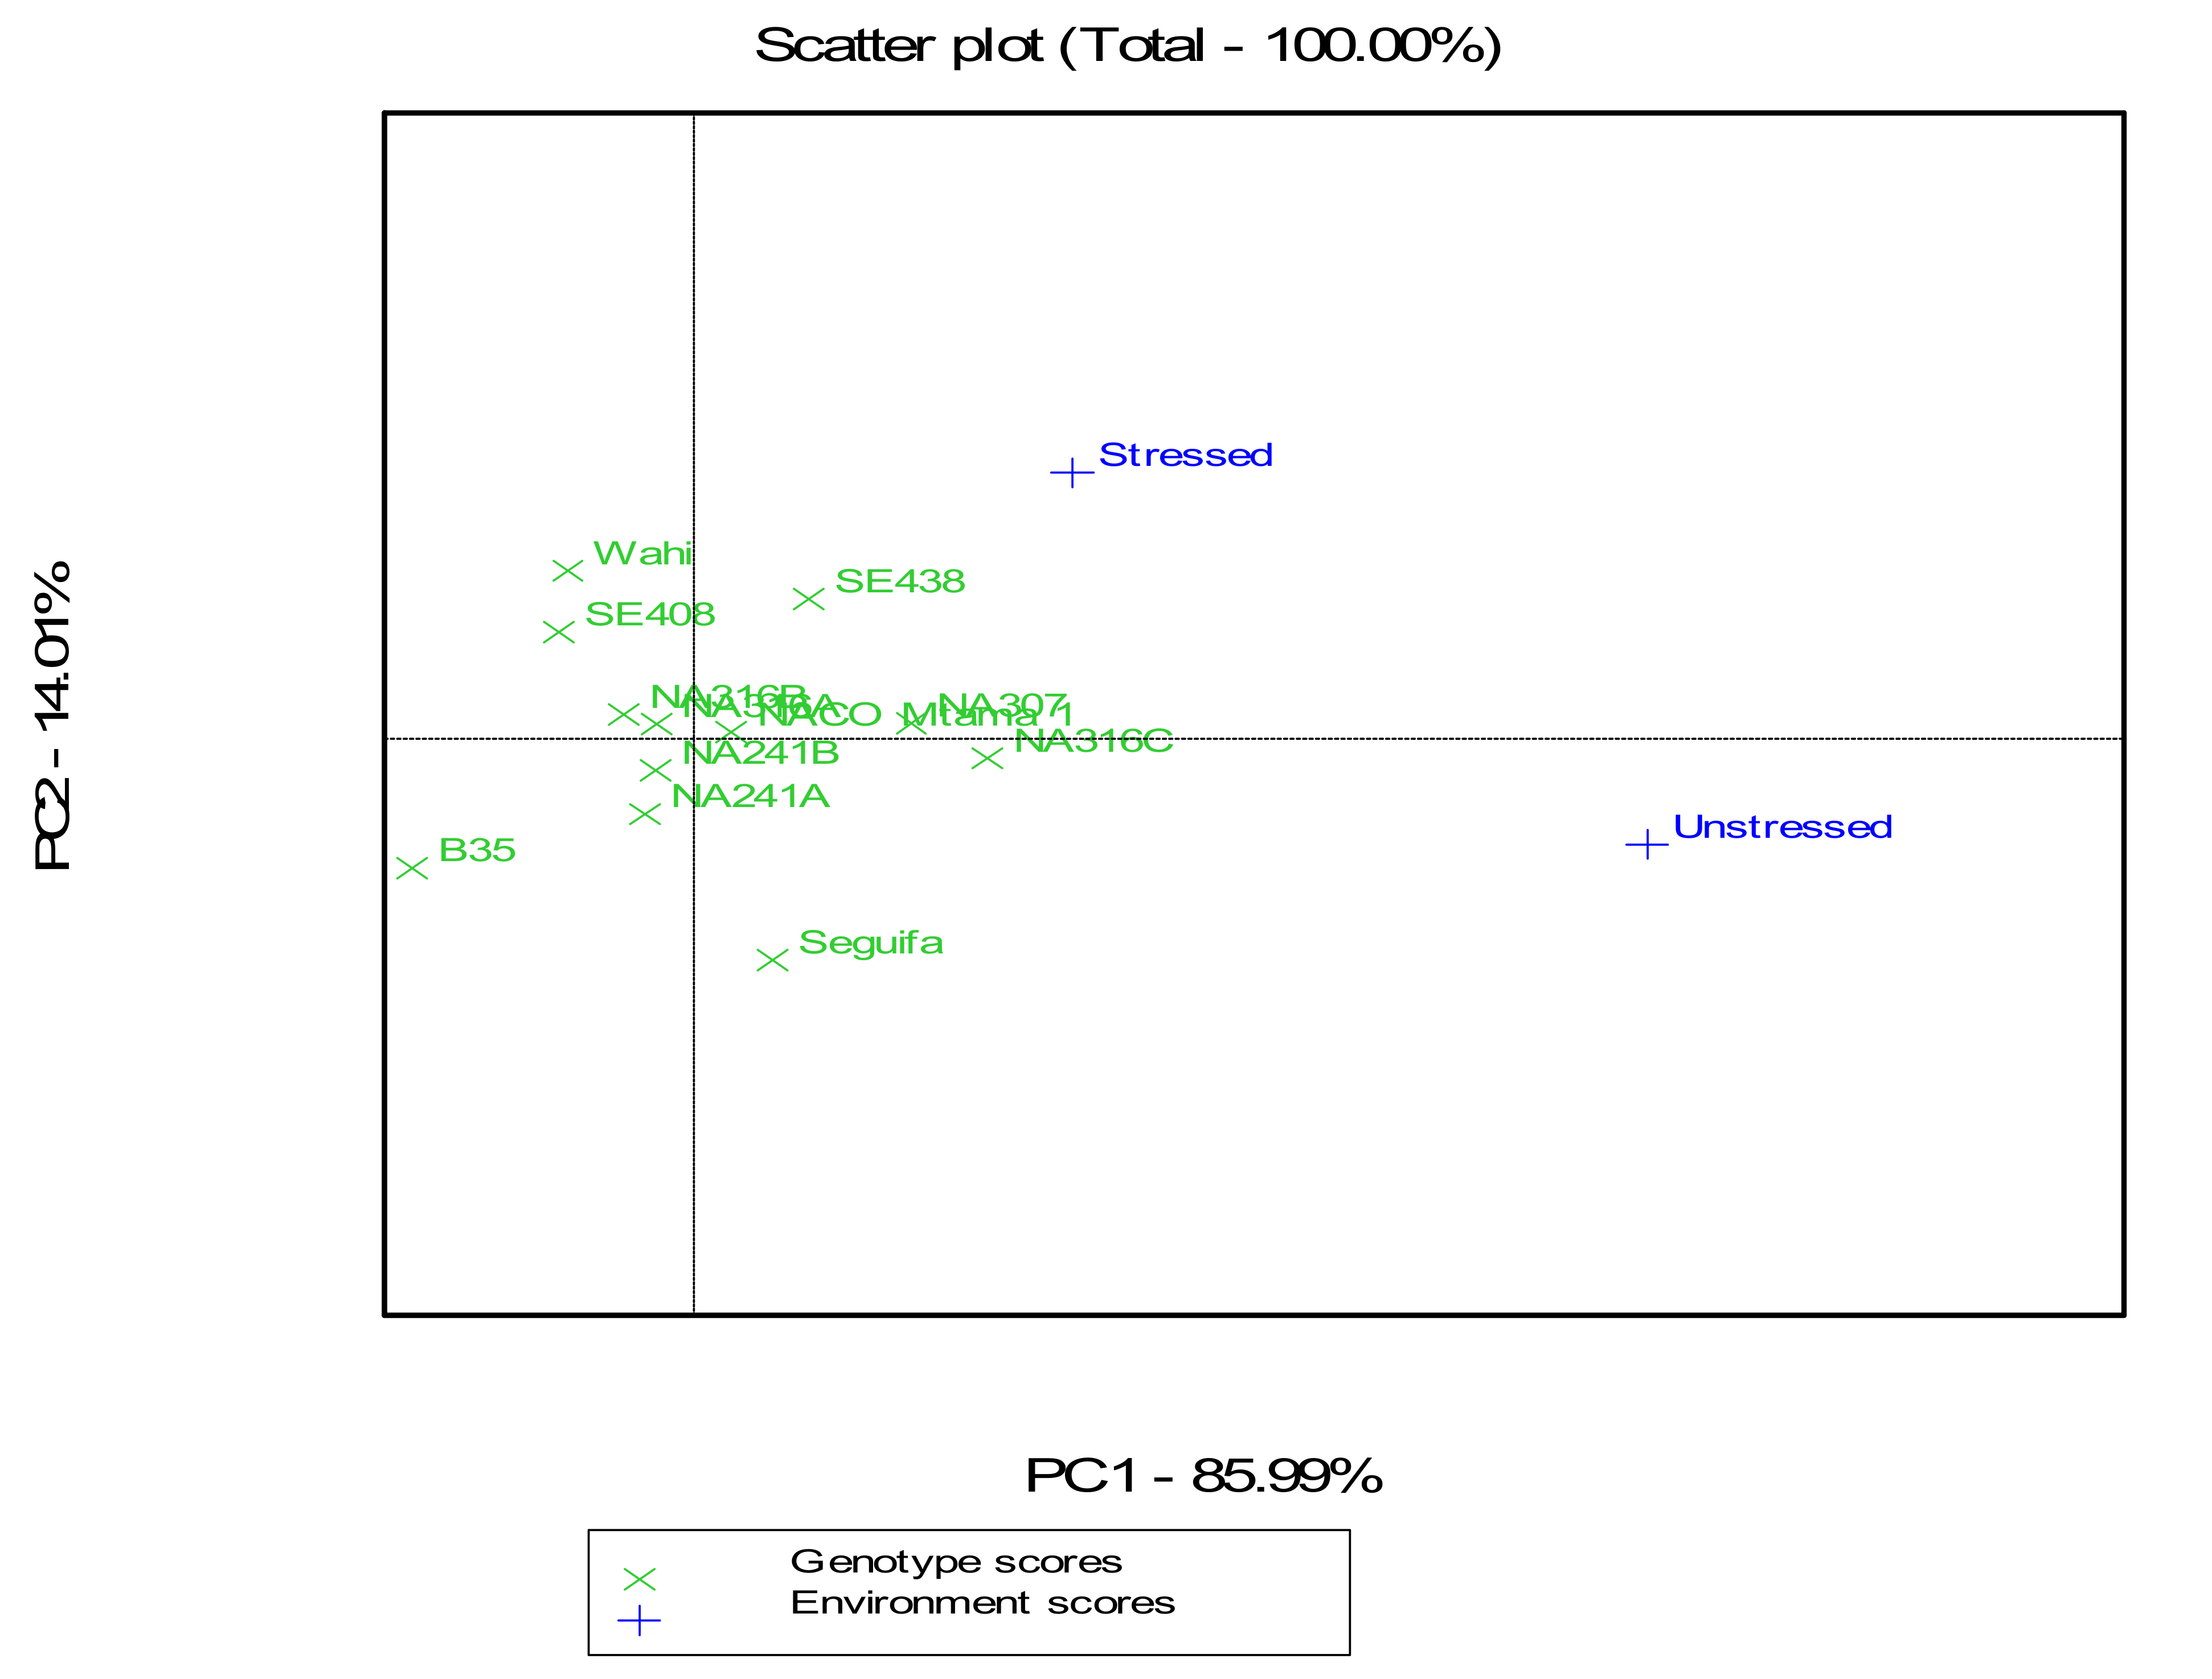
Ten principal axes were generated in the study of PCA in drought tolerance indices. PC1 showed 59.1% of the total variation and positively correlated with YP, YS, TOL, MP, GMP, SI, SSI, STI and Red (Table 13). In this study, the first dimension of the principal component may be selected as the best indicator of yield potential and drought tolerance. The population with high values of PC1 can be high yielding in the water-irrigated and water-stressed environments. PC2 showed 20.8% of the variation and explained the positive correlation with TOL, SI, YSI and Red (Table 13). PC3 indicated 10% variation explaining positive correlation of most of the indices except TOL and SSI. The findings revealed that SSI did not separate the drought-susceptible cultivars. However, the populations with highest PCA1 and lowest PCA2 showed good yield performance in both environments. The remaining of principal axes indicated less than 10% of the total variation.
There was correlation of angles between vectors in the biplot diagram of PCA (Figure 2). There was similarity between STI and MP and strong correlation with GMP. YP and YS were distantly correlated, indicating that water stress reduced the yield.

4. Discussion

Chlorophyll content is an important trait that determines the ability of the plant to photosynthesize. The distribution of chlorophyll content in the plant differs from one part to another [21]. The concentration of chlorophyll is higher in the center portion of the sorghum plant than in the top and bottom parts [21]. This aligns with the current study that noted higher distribution of chlorophyll content in the middle part of the plant than in the top and bottom parts. In sorghum, chlorophyll content is helpful during post-flowering drought to enable a plant to manufacture its own food for use and to maintain physiological plant growth and grain yield. The presence of high chlorophyll content during drought stress delays leaf senescence to retain STG, which accounts for grain yield in sorghum. Xu et al. [22] reported that there is correlation of leaf chlorophyll content and STG expression in sorghum leaves during post-flowering drought, suggesting the use of these traits for screening drought tolerance and yield in sorghum. The chlorophyll content recorded in all parts of the donor parent B35 and the introgressed genotypes in our study indicates that the donor parent B35 contributed part of the improvement. The reduction of chlorophyll content during post-flowering drought initiates leaf senescence and lowers STG [23]. The resistance of sorghum genotypes delays leaf senescence for grain filling and other physiological processes to take place [24].
Drought is the major constraint of crop production globally, and it reduces grain yield of sorghum [25]. STG 1, 2, 3 and 4 QTLs linked to drought tolerance in sorghum have been useful for introgression to non-STG sorghum for enhancing grain yield during post-flowering drought stress [26]. The STG QTLs accounts for grain yield increase in water-stressed condition depending on the period of dry spell and the genetic composition of genotypes [27]. The difference in grain yield performance is affected by water management, where well-watered condition enhances physiological plant growth and yield. A similar finding was reported by [28]. Low water content hinders roots and leaf growth, which is important for water and nutrient uptake and photosynthesis. However, this study identified few genotypes that performed better in a water-stress environment than in the well-watered condition; this is contrary to [29] who recorded higher yield in irrigated than in water-stressed condition. The genotypes with high grain yield in both environments, for example, the genotypes NA307 and NA316C in this study, indicate that these genotypes can perform well for the multilocation trials in the next step of evaluation.
Environmental conditions determine the performance of traits in plant growth. Traits that show good response in contrasting environments are suggested for screening of drought-tolerant genotypes in sorghum. Water stress reduces chlorophyll content, which affects photosynthesis efficiency and grain yield of sorghum [30]. The current study noted higher chlorophyll content in a well-watered environment than in water-stressed condition, which implies that water management affects chlorophyll content. The expression of STG during drought condition prior to flowering and after flowering of plants is the indication of drought tolerance. Nonetheless, in water-stress condition, plants express STG before physiological maturity. Findings of this study revealed that STG expression is affected by water stress more than in well-watered condition because of reduction of moisture in the soil. The study of STG introgression in non-STG sorghum has been done successfully using MABC [31]. This signifies the importance of MABC for improvement of post-flowering drought tolerance in sorghum. Moreover, the amount of nitrogen content used for grain filling in sorghum depends on the amount of nitrogen absorbed by roots, which accounts for STG expression in sorghum during water scarcity [32]. Plants with plenty of nitrogen content have the ability to delay leaf senescence for maintaining photosynthesis for a long period, which helps to produce sufficient carbohydrates for developing grains. STG in sorghum has been associated with high grain yield in rainfall deficit environments, where post-flowering drought is the major challenge [33]. Chlorophyll content and STG are important traits for evaluating drought-tolerant sorghum under water-management environments; similar findings were reported by [34] in maize. The current study revealed that plants respond differently for plant height and root biomass under well-watered and water-stressed conditions. The variation is due to genetic difference of genotypes in the same condition. Kassahun et al. [31] reported similar findings where backcross genotypes had higher root biomass than senescent parents and positive correlation between root biomass and STG.
The interaction of genotypes by environments plays a major role in the study of genetic and phenotypic variance in crop improvement. The genetic and phenotypic variances determine the variations in the performance of traits in sorghum under different treatments. The traits that are positively influenced by the interaction of well-watered and stressed treatments are considered as the best indices of drought tolerance in sorghum. The interaction of well-watered and water-stressed conditions did not influence root biomass or grain yield per plant; low interaction between genotypes by environments could be due to insufficient transfer of STG QTLs from the donor parent to the non-STG parents. The interaction of water management and genotypes is important for the screening of sorghum that promise greater grain yield during post-flowering drought. Furthermore, plants with deep root systems can access water from deep soil in a water-stressed condition to support plant growth and the high grain yield. These plants are used as the basis for improvement of drought tolerance and yield in crops including sorghum.
Heritability estimates are used to evaluate variability of trait performance of crop genotypes [35]. Plant height and days to 50% flowering express higher heritability compared to other traits in crops. Variability of heritability estimates in the sorghum genotypes in this study was influenced by the interactions among genotypes by environments [36]. Hamidou et al. [37] reported high heritability in sorghum for traits of grain yield, plant height and panicle weight; similarly, our results reported ≥80% heritability of plant height, days to 50% flowering and stem biomass, which indicate that these traits were not influenced by the environments. Nevertheless, the percentage of heritability in root biomass, STG and leaf rolling were below 25% because of environmental influences [38]. The target traits with high heritable estimates are considered the best for selection. The interaction of genotype and water management in the current study reduces broad-sense heritability estimates. The reduction of heritability estimates is due to variation in performance of genotypes in the contrasting environments [39].
In the study of drought tolerance indices, STI index appeared to be the best indicator of drought tolerance and can be recommended for the screening of genotypes. The genotype NA316C, which produced the highest grain yield across the environments, also had the highest TOL. These findings contradict reports by [29] who found high values of TOL in sorghum and concluded that such genotypes are susceptible to drought stress.
PCA is essential for grouping genotypes based on the performance of traits of interest. It shows the relationship among genotypes that enable selection of the best traits for different purposes. Plants grow well in a sufficient water condition compared to a limited water condition. However, in sorghum, significant variation occurs at post-flowering drought, which reduces yield studies [29,40]. Contrary to our findings, some genotypes performed better in a stressed environment than in well-watered conditions, suggesting that the variation could be due to differences of soil nutrients.

5. Conclusions and Recommendations

Well-watered and water-stressed environments influenced the variation of trait performance. The interaction of genotypes by environment influenced the performance of various traits. The heritability was higher in well-watered compared to stressed conditions. Chlorophyll content in sorghum leaves vary from one part of the plant to another, but the concentration was highest in the middle part of the plant. For the best screening of plants with drought-tolerant trait in sorghum, chlorophyll content is one of the important traits. The genotypes NA307, NA316C and SE438 were selected as the best performing in terms of grain yield across the environments. Following approval by the seed certification authority in Tanzania, these genotypes are recommended for release as the drought-tolerant varieties for adoption.

Author Contributions

A.M., J.S.Y.E., K.O. and P.T. designed the research study, collected and cleaned data, analyzed the data and developed the first draft of manuscript. T.F. reviewed the first draft of the manuscript. J.S.Y.E., K.O. and P.T. participated in the experimental design and modeling of data analysis, and reviewed the second draft of the manuscript. S.D. provided breeding materials from ICRISAT India to Tanzania and analyzed part of data. All authors have read and agreed to the published version of the manuscript.

Funding

The German Academic Exchange Service (DAAD) is acknowledged for the financial contribution grant number 57377190 to support this research.

Institutional Review Board Statement

Not applicable.

Informed Consent Statement

Not applicable.

Acknowledgments

WACCI and TARI Makutupora Centre are acknowledged for providing technical support when conducting research.

Conflicts of Interest

Authors declare no conflict of interest in this research report.

References

  1. Mindaye, T.T.; Mace, E.S.; Godwin, I.D.; Jordan, D.R. Heterosis in locally adapted sorghum genotypes and potential of hybrids for increased productivity in contrasting environments in Ethiopia. Crop J. 2016, 4, 479–489. [Google Scholar] [CrossRef] [Green Version]
  2. Phuong, N.; Afolayan, G.; Stützel, H.; Uptmoor, R.; El-Soda, M. Unraveling the genetic complexity underlying sorghum response to water availability. PLoS ONE 2019, 14, e0215515. [Google Scholar] [CrossRef]
  3. Ali, M.A.; Abbas, A.; Awan, S.I.; Jabran, K.; Gardezi, S.D.A. Correlated response of various morpho-physiological characters with grain yield in sorghum landraces at different growth phases. JAPS 2011, 21, 671–679. [Google Scholar]
  4. Khatab, I.A.; El-Mouhamady, A.A.; Abdel-Rahman, H.M.; Farid, M.A.; El-Demardash, I.S. Agro-morphological and molecular characterization of sorghum (Sorghum vulgare L.) for water stress tolerance. Int. J. Curr. Res. Biosci. Plant. Biol. 2017, 4, 37–55. [Google Scholar] [CrossRef]
  5. Naoura, G.; Sawadogo, N.; Atchozou, E.A.; Emendack, Y.; Hassan, M.A.; Reoungal, D.; Amos, D.N.; Djirabaye, N.; Tabo, R.; Laza, H. Assessment of agro-morphological variability of dry-season sorghum cultivars in Chad as novel sources of drought tolerance. Sci. Rep. 2019, 9, 19581. [Google Scholar] [CrossRef]
  6. Misra, A.N.; Biswal, A.K.; Misra, M. Physiological, biochemical and molecular aspects of water stress responses in plants and the biotechnological applications. Proc. Indian Acad. Sci. 2002, 72B, 115–134. [Google Scholar]
  7. Khan, I.A.; Habib, S.; Sadaqat, H.A.; Tahir, M.H.N. Selection criteria based on seedling growth parameters in maize varies under normal and water stress conditions. Int. J. Agric. Biol. 2004, 6, 252–256. [Google Scholar]
  8. Kapanigowda, M.H.; Perumal, R.; Djanaguiraman, M.; Aiken, R.M.; Tesso, T.; Prasad, P.V.; Little, C.R. Genotypic variation in sorghum [Sorghum bicolor (L.) Moench] exotic germplasm collections for drought and disease tolerance. Springerplus 2013, 2, 650. [Google Scholar] [CrossRef] [PubMed] [Green Version]
  9. Jabereldar, A.A.; El Naim, A.M.; Dagash, Y.M.; Abdalla, A.A.; Ahmed, S.E. Effect of water stress on drought tolerance index of sorghum (Sorghum bicolor L. Moench) in North Kordofan state. UKJNRES 2017, 10, 11–20. [Google Scholar]
  10. Negarestani, M.; Tohidi-Nejad, E.; Khajoei-Nejad, G.; Nakhoda, B.; Mohammadi-Nejad, G. Comparison of Different Multivariate Statistical Methods for Screening the Drought Tolerant Genotypes of Pearl Millet (Pennisetum americanum L.) and Sorghum (Sorghum bicolor L.). Agronomy 2019, 9, 645. [Google Scholar] [CrossRef] [Green Version]
  11. Brunner, I.; Herzog, C.; Dawes, M.; Arend, C.; Sperisen, C. How tree roots respond to drought. Front. Plant. Sci. 2015, 6, 547. [Google Scholar] [CrossRef] [Green Version]
  12. Kadioglu, A.; Terzi, R. A dehydration avoidance mechanism: Leaf rolling. Bot. Rev. 2007, 73, 290–302. [Google Scholar] [CrossRef]
  13. Amelework, B.; Shimelis, H.; Tongoona, P.; Laing, M. Physiological mechanisms of drought tolerance in sorghum, genetic basis and breeding methods: A review. Afr. J. Agric. Res. 2015, 10, 3029–3040. [Google Scholar]
  14. Morka, E.A. Physiological Indices for Drought Tolerance in Stay-green Sorghum (Sorghum bicolor L. Moench) Accessions. Master’s Thesis, Addis Ababa University, Addis Ababa, Ethiopia, 2015. [Google Scholar]
  15. Maqsood, M.; Ali, S.N.A. Effects of drought on growth, development, radiation use efficiency and yield of finger millet (Eleucine coracana). Pak. J. Bot. 2007, 39, 123–134. [Google Scholar]
  16. TMA, (Tanzania Meteorological Agency). TMA Weather forecast; ISO 9001:2008 Certified (in Aeronautical Meteorological Services). Available online: http://www.meteo.go.tz/index.php (accessed on 5 October 2020).
  17. FAO. World Reference Base for Soil Resources 2014; World Soil Resources Reports No. 106; FAO: Rome, Italy, 2015. [Google Scholar]
  18. Chen, H.; Wei, C.; Yan, R.; Chen, P.; Yi, P. On the determination of the soil-water characteristic curve using the pressure plate extractor. In Advances in Environmental Geotechnics; Chen, Y., Zhan, L., Tang, X., Eds.; Springer: Berlin, Heidelberg, Germany, 2010. [Google Scholar] [CrossRef]
  19. Hossain, A.B.S.; Sears, A.G.; Cox, T.S.; Paulsen, G.M. Desiccation tolerance and its relationship to assimilate partitioning in winter wheat. Crop. Sci. 1990, 30, 622–627. [Google Scholar] [CrossRef]
  20. IBPGR; ICRISAT. Descriptors for Sorghum [Sorghum bicolor (L.) Moench]; International Board for Plant Genetic Resources: Rome, Italy; International Crops Research Institute for the Semi-Arid Tropics, Patancheru, India, 1993.
  21. Dwyer, L.M.; Tollenaar, M.; Houwing, L. A Nondestructive Method to Monitor Leaf Greenness in Corn. Can. J. Plant. Sci. 1991, 71, 505–509. [Google Scholar] [CrossRef]
  22. Xu, W.; Subudhi, P.K.; Crasta, O.R.; Rosenow, D.T.; Mullet, J.E.; Nguyen, H.T. Molecular mapping of QTLs conferring stay-green in sorghum. Genome 2000, 43, 461–469. [Google Scholar] [CrossRef] [PubMed]
  23. Li, Z.; Zhang, Y.; Zou, D.; Zhao, Y.; Wang, H.; Zhang, Y.; Xia, X.; Luo, J.; Guo, H.; Zhang, Z. LSD 3.0: A comprehensive resource for the leaf senescence research community. Nucleic Acids Res. 2020, 48, D1069–D1075. [Google Scholar] [CrossRef]
  24. Wanous, M.K.; Miller, F.R.; Rosenow, D.T. Evaluation of visual rating scales for green leaf retention in sorghum. Crop. Sci. 1991, 31, 1691–1694. [Google Scholar] [CrossRef]
  25. Wenzel, W.G. Effect of moisture stress on sorghum yield and its components. S. Afr. J. Plant. 1999, 16, 153–157. [Google Scholar] [CrossRef]
  26. Sabadin, P.K.; Malosetti, M.; Boer, M.P.; Tardin, F.D.; Santos, F.G.; Guimaraes, C.T.; Gomide, R.L.; Andrade, C.L.T.; Albuquerque, P.E.P.; Caniato, F.F.; et al. Studying the genetic basis of drought tolerance in sorghum by managed stress trials and adjustments for phonological and plant height differences. Theor. Appl. Genet. 2012, 124, 1389–1402. [Google Scholar] [CrossRef]
  27. De Souza, A.A.; Carvalho, A.J.; Bastos, E.A.; Portugal, A.F.; Torres, L.G.; Batista, P.S.C.; Julio, M.P.M.; Julio, B.H.M.; de Menezes, C.B. Grain Sorghum Grown Under Drought Stress at Pre- and Post-flowering in Semiarid Environment. J. Agric. Sci. 2020, 12, 97–105. [Google Scholar] [CrossRef] [Green Version]
  28. Ajeigbe, H.A.; Akinseye, F.M.; Ayuba, K.; Jonah, J. Productivity and Water Use Efficiency of Sorghum [Sorghum bicolor (L.) Moench] Grown under Different Nitrogen Applications in Sudan Savanna Zone, Nigeria. Int. J. Agron. 2018, 2018, 7676058. [Google Scholar] [CrossRef] [Green Version]
  29. Sory, S. Marker assisted selection for post-flowering drought tolerance in Sorghum bicolor [L.] Moench. Ph.D. Thesis, University of Ghana, Accra, Ghana, 2015. [Google Scholar]
  30. Zhang, F.; Zhu, K.; Wang, Y.Q.; Zhang, Z.P.; Lu, F.; Yu, H.Q.; Zou, J.Q. Changes in photosynthetic and chlorophyll fluorescence characteristics of sorghum under drought and waterlogging stress. Photosynthetica 2019, 57, 1156–1164. [Google Scholar] [CrossRef] [Green Version]
  31. Kassahun, B.; Bidinger, F.R.; Hash, C.T.; Kuruvinashetti, M.S. Stay-green expression in early generation Sorghum [Sorghum bicolor (L.) Moench] QTL introgression lines. Euphytica 2010, 172, 351–362. [Google Scholar] [CrossRef] [Green Version]
  32. Borrell, A.K.; Hammer, G.L.; Henzell, R.G. Does maintaining green leaf area in sorghum improve yield under drought? II. Dry matter production and yield. Crop. Sci. 2000, 40, 1037–1048. [Google Scholar] [CrossRef]
  33. Borrell, A.K.; Hammer, G.L.; Douglas, A.C.L. Does maintaining green leaf area in sorghum improve yield under drought? I. Leaf growth and senescence. Crop. Sci. 2000, 40, 1026–1037. [Google Scholar] [CrossRef]
  34. Zaeifizade, M.; Goliov, R. The Effect of the Interaction between Genotypes and Drought Stress on the Superoxide Dismutase and Chlorophyll Content in Durum Wheat Landraces. Turk. J. Boil. 2009, 33, 1–7. [Google Scholar]
  35. Efisue, A.A. Studies of drought tolerance in interspecific progenies of Oryza glaberrlma (steud) and O. Sativa (L) and an appraisal of the use of male gametocides in rice hybridisation. Ph.D. Thesis, University of KwaZulu-Natal, Durban, South Africa, 2006. [Google Scholar]
  36. Phuke, R.M.; Anuradha, K.; Radhika, K.; Jabeen, F.; Anuradha, G.; Ramesh, T.; Hariprasanna, K.; Mehtre, S.P.; Deshpande, S.P.; Anil, G.; et al. Genetic Variability, Genotype × Environment Interaction, Correlation, and GGE Biplot Analysis for Grain Iron and Zinc Concentration and Other Agronomic Traits in RIL Population of sorghum (Sorghum bicolor L. Moench). Front. Plant. Sci. 2017, 8, 712. [Google Scholar] [CrossRef] [Green Version]
  37. Hamidou, M.; Souley, A.K.M.; Kapran, I.; Souleymane, O.; Danquah, E.D.; Ofori, K.; Gracen, V.; Ba, M.N. Genetic Variability and Its Implications on Early Generation Sorghum Lines Selection for Yield, Yield Contributing Traits, and Resistance to Sorghum Midge. Int. J. Agron. 2018, 1864797. [Google Scholar] [CrossRef]
  38. Kiranmayee, K.N.S.U.; Hash, C.T.; Sivasubramani, S.; Ramu, P.; Amindala, B.P.; Rathore, A.; Kishor, P.B.K.; Gupta, R.; Deshpande, S.P. Fine-Mapping of Sorghum Stay-Green QTL on Chromosome10 Revealed Genes Associated with Delayed Senescence. Genes 2020, 11, 1026. [Google Scholar] [CrossRef] [PubMed]
  39. Ye, X.; Avendano, S.; Dekkers, J.C.M.; Lamont, S.J. Association of twelve immune-related genes with performance of three broiler lines in two different hygiene environments. Poult. Sci. 2006, 85, 1555–1569. [Google Scholar] [CrossRef] [PubMed]
  40. Ouedraogo, N.; Sanou, J.; Kam, H.; Traore, H.; Adam, M.; Gracen, V.; Danquah, E.Y. Farmers’ perception on impact of drought and their preference for sorghum cultivars in Burkina Faso. Res. J. Agric. Sci. 2017, 7, 277–284. [Google Scholar]
Figure 1. PCA of grain yield under water-stressed and well-watered conditions.
Agronomy 11 01698 g001
Figure 2. Biplot diagram of PCA of genotype yield under well-watered (YP) and water-stressed conditions (YS).
Agronomy 11 01698 g002
Table 1. Best performing BC2F2 sorghum genotypes.
GenotypePH%GLM%PL%PW%GWT%
NA2411466211.4245.785.5113.45.1
NA307147.8635.7265.88.55.5147.35.1
NA3161455.853.1245.685154.24.8
SE408143.86.145.2206.576.2114.75.4
SE438147.35.534.821.56.376.2103.45.8
W821237.125.7346.389.41016.5
%—percentage, GLM—total number of green leaves at maturity, GWT—grain weight (kg), PH—plant height (cm), PL—panicle length (cm), PW—panicle width (cm).
Table 2. Grain yield of sorghum genotypes under well-watered and water-stress conditions.
Grain Yield (ton ha−1)
PopulationWater IrrigatedWater Stressed
NA241A2.432.08
NA241B2.432.17
NA3073.162.56
NA316A2.402.25
NA316B2.302.23
NA316C3.422.59
SE4082.042.30
SE4382.772.65
Wahi2.032.42
NACO 2.631.98
Seguifa2.912.33
B351.771.71
SE0.0080.005
LSD0.0160.009
CV (%)54.534.3
SE—standard error mean, LSD—least significance difference of the mean, CV(%)—coefficients of variations, NACO—NACO Mtama 1.
Table 3. Percentage yield increases of BC2F4 genotypes versus recurrent parents under water-stress condition.
BC2F4 GenotypesYield (ton ha−1) of BC2F4 GenotypesYield (ton ha−1) of Recurrent Parents% increase of Grain Yield
NACO Mtama 1
NA241A2.081.985.2
NA241B2.171.989.7
NA3072.561.9829.2
NA316A2.251.9813.9
NA316B2.231.9812.7
NA316C2.591.9830.7
Seguifa
SE4082.302.33−1.3
SE4382.652.3314
Table 4. Mean values of chlorophyll content for the top, middle and bottom leaves on sorghum genotypes in stressed and unstressed environments.
Stressed Environment Unstressed Environment
GenotypesCH-Top LeafCH-Middle LeafCH-BOT LeafGenotypesCH-Top LeafCH-Middle LeafCH-BOT Leaf
NA241A27.29 a34.97 ab29.91 aNA241A39.77 a46.89 abc40.67 abc
NA316B29.75 a 34.38 a31.97 aNA316B48.14 bc49.97 bcd42.23 abc
NA316A29.99 a38.62 abc33.63 aNA316A46.52 abc50.91 bcd44.56 bc
NA316C31.46 ab38.72 abc32.88 aNA316C50.99 c56.57 de46.26 c
NA30733.49 abc43.16 bc34.79 aNA30744.46 abc46.53 abc40.54 abc
NA241B33.70 abcd40.93 abc38.10 abNA241B39.84 a42.28 a35.44 a
SE40839.49 bcde43.20 bc38.01 abSE40841.85 ab44.46 ab35.99 ab
Seguifa40.05 bcde42.43 abc36.75 abSeguifa52.23 c53.77 cd47.80 c
NACO40.98 cde44.61 cd38.85 abNACO42.44 ab50.14 bcd41.36 abc
Wahi42.67 de46.86 cd35.29 aWahi47.03 abc49.15 abcd39.04 abc
SE43847.18 e52.14 de44.96 bcSE43847.80 abc51.09 bcd43.73 abc
B3559.04 f60.71 e51.46 cB3566.01 d63.94 e58.23 d
SE2.652.562.74SE2.412.232.6
SLD5.215.045.39SLD4.734.395.12
CV (%)2722.928.5CV (%)19.717.123.5
a,b,c,d,e and f are comparisons for the Bonferroni mean test, BOT—bottom, CH—chlorophyll content (g−1), CV (%)—coefficient of variations of means, LSD—least significance difference of means, NACO—NACO Mtama 1, SE—standard error of deviation.
Table 5. Means of trait performance for sorghum genotypes under well-watered conditions.
GenotypePH LRNLMGLMSTGPWTGWTR B
NA241A132.6 cd1.9 abc6.73 ab3.03 ab4.93 abc0.073 abcde0.055 abc0.045 abc
NA241B134.9 cd2.0 bc6.87 ab2.23 a5.80 c0.071 abcde0.055 abc0.043 ab
NA316A143.3 d1.8 abc6.23 a2.87 ab4.20 ab0.073 bcde0.054 abc0.052 bc
NA316B134.4 cd1.9 abc6.13 a2.77 ab5.00 abc0.067 abcd0.052 abc0.047 abc
NA316C140.3 cd1.7 ab6.63 a3.53 bc3.87 a0.080 de0.077 c0.068 d
NA307133.9 cd2.0 bc7.77 c2.83 ab5.60 bc0.088 e0.071 bc0.047 abc
SE408129.2 c2.1 c6.83 ab2.97 ab5.00 abc0.056 abc0.046 ab0.04 a
SE438138.6 cd1.7 ab6.73 ab3.2 b4.07 a0.074 bcde0.062 abc0.048 abc
Wahi111.9 b2.0 bc7.70 c4.37 c3.73 a0.054 ab0.046 ab0.048 abc
NACO136.4 cd1.6 a6.13 a3.03 ab4.80 abc0.075 cde0.059 abc0.052 bc
Seguifa135.4 cd1.7 a6.70 ab3.13 ab4.53 abc0.079 de0.066 abc0.053 c
B3594.6 a1.9 abc7.50 bc3.63 bc4.13 ab0.052 a0.040 a0.073 d
SE3.60.10.240.330.440.0060.0080.0029
LSD7.080.190.470.640.860.0120.0160.0057
CV10.720.313.633.236.332.754.521.9
a,b,c,d and e are comparisons for the Bonferroni mean test, CV—coefficient of variation, GWT—grain weight per plant (kg), GLM—total number of green leaves at maturity, LSD—least significance difference of means, LR—leaf rolling, NLM—total number of leaves at maturity, PWT—panicle weight per plant (kg), RB—root biomass (kg), SE—standard error of means.
Table 6. Mean values of traits of sorghum genotypes under water-stressed condition.
GenotypePH LRNLMGLMSTGPWTGWTRB
NA241A138.3 b2.3 b6.9 ab2.03 abc7.3 e0.06 abc0.05 ab0.033 a
NA241B135.3 b2.03 ab6.5 a2.6 cd5.6 ab0.064 abcd0.05 ab0.042 bcd
NA316A134.5 b1.98 ab7.0 ab2.5 bcd5.8 abcd0.066 bcd0.051 ab0.042 bcd
NA316B139.0 b2.03 ab6.9 ab1.93 ab6.7 bcde0.062 abcd0.05 ab0.042 bcd
NA316C142.2 b1.85 a6.9 ab1.67 a6.9 de0.07 bcd0.058 b0.04 abc
NA307135.1 b1.8 a7.6 bc2.1 abcd6.9 cde0.079 d0.058 b0.045 cd
SE408134.2 b2.1 ab7.0 ab1.83 a6.3 bcde0.064 bcd0.052 ab0.038 abc
SE438135.9 b1.8 a6.7 ab1.7 a6.1 bcde0.074 cd0.06 b0.045 cd
Wahi106.9 a1.97 ab8.1 c2.73 d5.7 abc0.071 bcd0.054 b0.058 e
NACO136.2 b1.9 a6.4 a1.57 a6.7 bcde0.064 bcd0.052 ab0.037 ab
Seguifa134.5 b1.9 a6.9 ab1.5 a6.3 bcde0.054 ab0.045 ab0.037 ab
B3595.5 a2.1 ab7.5 bc3.53 e4.8 a0.046 a0.039 a0.048 d
SE3.390.110.260.190.360.0050.0050.0021
LSD6.660.220.510.370.70.010.0090.0041
CV102214.334.522.13234.319.1
a,b,c,d and e are comparisons for the Bonferroni mean test, CV—coefficient of variation, LR—leaf rolling, NLM—total number of leaves at maturity, PWT—panicle weight per plant (kg), RB—root biomass (kg), SE—standard error of means, STG (1—full leaf with green color, 9—complete leaf death).
Table 7. Mean squares and significance test effect of water stress and nonstress on sorghum genotypes.
SVDFDFWPHLRCHGLMRB1000_GWSBPW
Rep2258.7748601.59340011.974447367.780.1030.016
Env1158.67 *11.43.626,863520.830,23012,134 *0.010.011
Error (a)24.9431694.54185531.223541154.440.8650.025
Gen112526.78 **22,778 **2.13 *4718 **37.79 **4875925.13 **0.571 *0.009 *
Gen*Env11195.945310.8181013.943554353.61 *0.0330.003
Error (b)4489.418270.927009.42984160.20.1170.004
Rep*Gen*Env136817.241590.14351.030.93313.730.000040.0004
CV (%)-5.69.719.413.7 2.1 1.827.9
*, ** Significant differences at p ≤ 0.05 and p ≤ 0.01 respectively, CH—chlorophyll content (g−1), DF—degree of freedom, DFW—days to 50% flowering, Env—environment, Gen—genotype, GLM—total number of green leaves, 1000_GW—1000 grain weight (g), LR—leaf rolling, PH—plant height (cm), PW—panicle weight per plant (kg), RB-root biomass, Rep—replication, SB—stem biomass (kg), STG, SV—sources of variation.
Table 8. Correlation coefficients of traits contributing to drought tolerance and grain yield of sorghum genotypes under well-watered and water-stressed environments.
TraitGWPWTPHNLBMNGLMPWIEXCHSTGPL
GW-
PWT0.72 **-
PH0.27 **0.41 **-
NLM0.080.17 **−0.13 **-
BM0.26 **0.29 **−0.21 **0.04-
GLM0.18 **0.2 **−0.2 **0.21 **0.39 **-
PW0.53 **0.75 **0.5 **0.040.17 **0.06-
IEX−0.17 **−0.18 **0.2 **−0.070.010.1−0.08-
CH0.25 **0.27 **−0.26 **−0.020.60.53 **0.2 **0.1-
LSN−0.21 **−0.22 **0.09−0.03−0.41 **−0.84 **−0.11−0.15 **−0.56 **-
PL0.35 **0.51 **0.18 **10.29 **0.070.46 **−0.090.14 **−0.1-
** Correlation coefficient is significant at p ≤ 0.01, BM = root biomass, IEX—inflorescence exsertion, GW = grain weight per panicle (kg), PWT = panicle weight (kg), PH = plant height (cm), CH = chlorophyll content (g−1), STG, NGLM = total number of green leaves at maturity, NLM = total number of leaves at maturity, PL—panicle length (cm), PW—panicle width (cm).
Table 9. Broad-sense heritability (%) of parents and backcrosses.
TraitWell WateredWater Stressed
Plant height (cm)88.289.1
Stem biomass (kg)87.389.7
Chlorophyll content (g−1)85.988.4
Root biomass (kg)87.186.9
1000-seed weight8686.3
Panicle length (cm)84.788.5
Leaf width (cm)85.783.6
Number of green leaves at maturity78.984.4
Number of leaves at maturity83.478.3
Panicle width (cm)8270.4
Inflorescence exsertion74.377.4
Panicle weight (kg)76.175.3
Leaf senescence7179.5
Leaf length (cm)75.275.1
Leaf rolling7465
Grain weight (kg)64.265.8
Table 10. Heritability of sorghum genotypes traits under water management environments.
TraitHeritability (%)
Plant height (cm)89.52
Days to 50% flowering80.88
Stem biomass (kg)80
Chlorophyll content (g−1)64.39
Leaf width (cm)62.33
Total number of leaves at maturity62.26
Panicle length (cm)61.26
Panicle width (cm)43.67
Grain weight per plant (kg)42.86
Leaf length (cm)38.95
1000-seed weight (kg)38.4
Total number of green leaves at maturity34.86
Panicle weight (kg)30
Inflorescence exsertion29.36
Leaf rolling23
STG17.64
Root biomass (kg)12.38
Table 11. Drought stress indices and yield under water-irrigated and water-stressed conditions.
PopulationYPYSTOLMPGMPSISS1STIYSIRed (%)
NA241A2.4302.0810.3492.2562.2490.141.030.790.8614.4
NA241B2.4302.1700.2602.3002.2960.110.970.830.8910.7
NA3073.1632.5560.6072.862.8430.191.011.270.8119.2
NA316A2.4002.2520.1482.3262.3240.061.030.850.946.2
NA316B2.2962.2300.0662.2632.2630.030.970.80.972.9
NA316C3.4152.5850.8303.02.9710.241.011.390.7624.3
SE4082.0442.296−0.252.172.166−0.121.030.740.12−12.3
SE4382.7702.6520.1182.7112.7100.041.081.150.964.3
Wahi2.0302.415−0.392.2232.214−0.1910.771.19−19
Seguifa2.6301.9780.6522.3042.2810.320.780.820.7524.8
NACO M2.9112.3260.5852.6192.6020.121.681.060.820.1
B351.7701.7110.0591.7411.7400.031.10.480.973.3
Note: NACO M—NACO Mtama 1, Red (%)—percentage reduction.
Table 12. Correlation coefficients of drought stress indices and yield under water-irrigated and water-stressed conditions.
IndicesYPYSTOLMPGMPSS1STIYSIRed
YP -
YS0.648 * -
TOL0.832 **0.116 ns -
MP0.955 **0.846 **0.628 * -
GMP0.95 **0.853 **0.617 *0.997 ** -
SS10.168 ns0.129 ns0.125 ns0.168 ns0.171 ns -
STI−0.599 *0.118 ns−0.866 **−0.373 **−0.362 ns0.322 ns -
YSI−0.748 ns0.009 ns−0.982 **−0.52 **−0.511 ns−0.109 ns0.897 ** -
Red0.748 ns−0.009 ns0.982 **0.52 **0.511 ns0.109 ns−0.897 **−1 ** -
Note: * = significance at p = 0.05, ** = significant at p = 0.01, ns = not significant at 5% or 1% probability level.
Table 13. PCA of yield under well-watered (YP), yield under water-stressed (YS) and drought tolerance indices.
VariablePC1PC2PC3PC4PC5PC6PC7PC8PC9PC10
YP0.411−0.0130.0020.007−0.19−0.3140.0080.199−0.350.733
YS0.261−0.5270.0330.1240.41−0.107−0.0030.327−0.44−0.4
TOL0.3460.367−0.022−0.08−0.54−0.3310.0130.021−0.17−0.55
MP0.39−0.2150.0140.0530.03−0.2620.0050.2680.81−0.02
GMP0.389−0.2240.0180.0520.114−0.0890.178−0.86200
SI0.2890.4860.0080.1040.4640.023−0.67−0.06900
SS10.071−0.129−0.098−0.970.10.005−0.143−0.01200
STI0.39−0.210.0170.051−0.380.778−0.2190.05800
YSI-0.020.0170.994−0.1−0.02−0.013−0.012−0.00200
Red 0.3140.4410.006−0.10.3450.3130.6710.17300
Eigenvalue5.9052.0820.9990.9870.020.0040.002000
Proportion0.5910.2080.10.0990.00200000
Cumulative0.5910.7990.8990.9970.99911111
YP = yield under well-watered condition, YS = yield under drought-stress.
Publisher’s Note: MDPI stays neutral with regard to jurisdictional claims in published maps and institutional affiliations.

