Article

Low-Cost Spore Traps: An Efficient Tool to Manage Fusarium Head Blight through Improved Cropping Systems

by
Hans-Rudolf Forrer
1,
Annegret Pflugfelder
2,
Tomke Musa
1 and
Susanne Vogelgsang
1,*
1
Ecological Plant Protection in Arable Crops, Plant Protection, Agroscope, 8046 Zurich, Switzerland
2
Center for Organic Farming, University of Hohenheim, 70599 Stuttgart, Germany
*
Author to whom correspondence should be addressed.
Agronomy 2021, 11(5), 987; https://doi.org/10.3390/agronomy11050987
Submission received: 10 April 2021 / Revised: 10 May 2021 / Accepted: 13 May 2021 / Published: 15 May 2021
(This article belongs to the Special Issue Fungal Disease Management and Mycotoxin Prevention in Cereals)

Abstract

:
Fusarium head blight (FHB) is a devastating disease of wheat. Worldwide, Fusarium graminearum is the most dominant FHB-causing species. Its most common toxin, deoxynivalenol (DON), impairs food and feed safety and has an enormous economic impact. Agronomic factors such as crop rotation, soil management and host genotype strongly influence the occurrence of F. graminearum. Infected plant debris from previous crops, on which perithecia and ascospores develop, represent the main source for FHB, and hence, improved cropping systems aim to reduce this inoculum to decrease the infection risk. The best measure to evaluate the disease pressure is spore traps that detect deposited airborne ascospores. Commercial spore traps are expensive and require power sources, thus, they are not suitable for investigations in field experiments with different treatments. In consequence, we developed spore traps containing a Petri dish with Fusarium-selective agar, protected by aluminum dishes and attached on a wooden board. We compared the data of our low-cost trap with those of a commercial high-throughput jet sampler and obtained equivalent results. In field experiments to compare cropping systems, we observed a high correlation between the DON content in wheat grains and the number of colonies from deposited spores. Our spore trap proved to be a highly valuable tool to not only study FHB epidemiology but also to identify innovative cropping systems with a lower risk for FHB and DON contamination.

1. Introduction

Fusarium head blight (FHB) is a devastating disease with an enormous economic impact on wheat (Triticum aestivum L.), barley (Hordeum vulgare L.) and oat (Avena sativa L.) production [1]. In central Europe, the most important FHB causing species are F. graminearum Schwabe (sensu stricto), F. poae, F. avenaceum, F. langsethiae, F. cerealis (syn. F. crookwellense) and F. culmorum [2,3,4,5]. On a global scale, F. graminearum is considered as the most important FHB causing species in wheat [6]. FHB outbreaks are mainly caused by ascospores of Gibberella zeae (teleomorph of F. graminearum). The ascospores are formed in perithecia produced on host residues, such as maize stems or wheat grains and spikelets, that remain at or above the soil surface [7,8]. In field trials from 1995 to 1997 in Minnesota (USA) with wheat cropped after maize and wheat or soybean cultivated with a plough or conservation tillage, the highest FHB incidence and severity was observed when wheat followed maize with no-till or conservation tillage [7]. The effects of cultural practices and the previous crop used in rotation, tillage, genetic characteristics of the cereal cultivar and fungicide applications on FHB epidemiology were reviewed by Fernando et al. in 2020 [1].
To develop integrated strategies for the control of FHB in wheat cropped after grain maize or sorghum, the effect of individual and combined agronomic factors was compared in field trials in Italy with a directly sown, FHB susceptible wheat variety. With ploughing instead of direct sowing, the deoxynivalenol (DON) content of the FHB susceptible wheat was reduced by 32%, while growing a moderately resistant variety reduced it to 39%. Furthermore, the combination of ploughing with a moderately resistant variety reduced the DON content even by 91% [9].
One of the most effective factors to reduce FHB risk is the abandonment of a maize/wheat rotation with reduced tillage, although this has negative impacts on economic profit and soil protection. Therefore, in on-farm experiments, maize residue treatment studies were conducted in grain maize/winter wheat rotations with no-tillage in Switzerland. Compared with samples from fields, where no maize residue treatments were conducted, fine mulching or mulching with the superficial incorporation of maize residues reduced the average DON content in wheat grains between 21 and 38% [10]. To obtain a better understanding of the epidemiology of the Fusarium species, we started to measure deposited airborne ascospores with spore traps in these field trials during wheat anthesis, when the susceptibility of the crop is highest [11].
Commercial spore traps can provide valuable insight into FHB epidemiology, such as the daily and seasonal dynamics of airborne spores of F. graminearum and other Fusarium species sampled in wheat plots [12,13]. However, these spore traps are expensive and require power sources, thus, they are unsuitable for investigations in field experiments with a high number of treatments. Hence, in preliminary trials, we constructed and compared different types of spore traps. The best-performing model, containing a Petri dish with Fusarium-selective agar protected by aluminum dishes and attached on a wooden board [4]), was compared with a Burkard high-throughput jet sampler (Figure 1). Our low-cost spore traps provided similar results (e.g., number of deposited ascospores and resulting fungal colonies) as the high-throughput jet sampler.
The main aims of the current investigation were (1) to examine if low-cost spore traps are suitable to monitor airborne ascospores of F. graminearum and other Fusarium species in wheat canopies, (2) to evaluate if they can be used to compare the infection pressure in field trials with different cropping methods and systems and (3) to show how these spore traps should be used and positioned to obtain substantial correlations with the disease pressure of different treatments measured by the DON content in wheat grains.

2. Materials and Methods

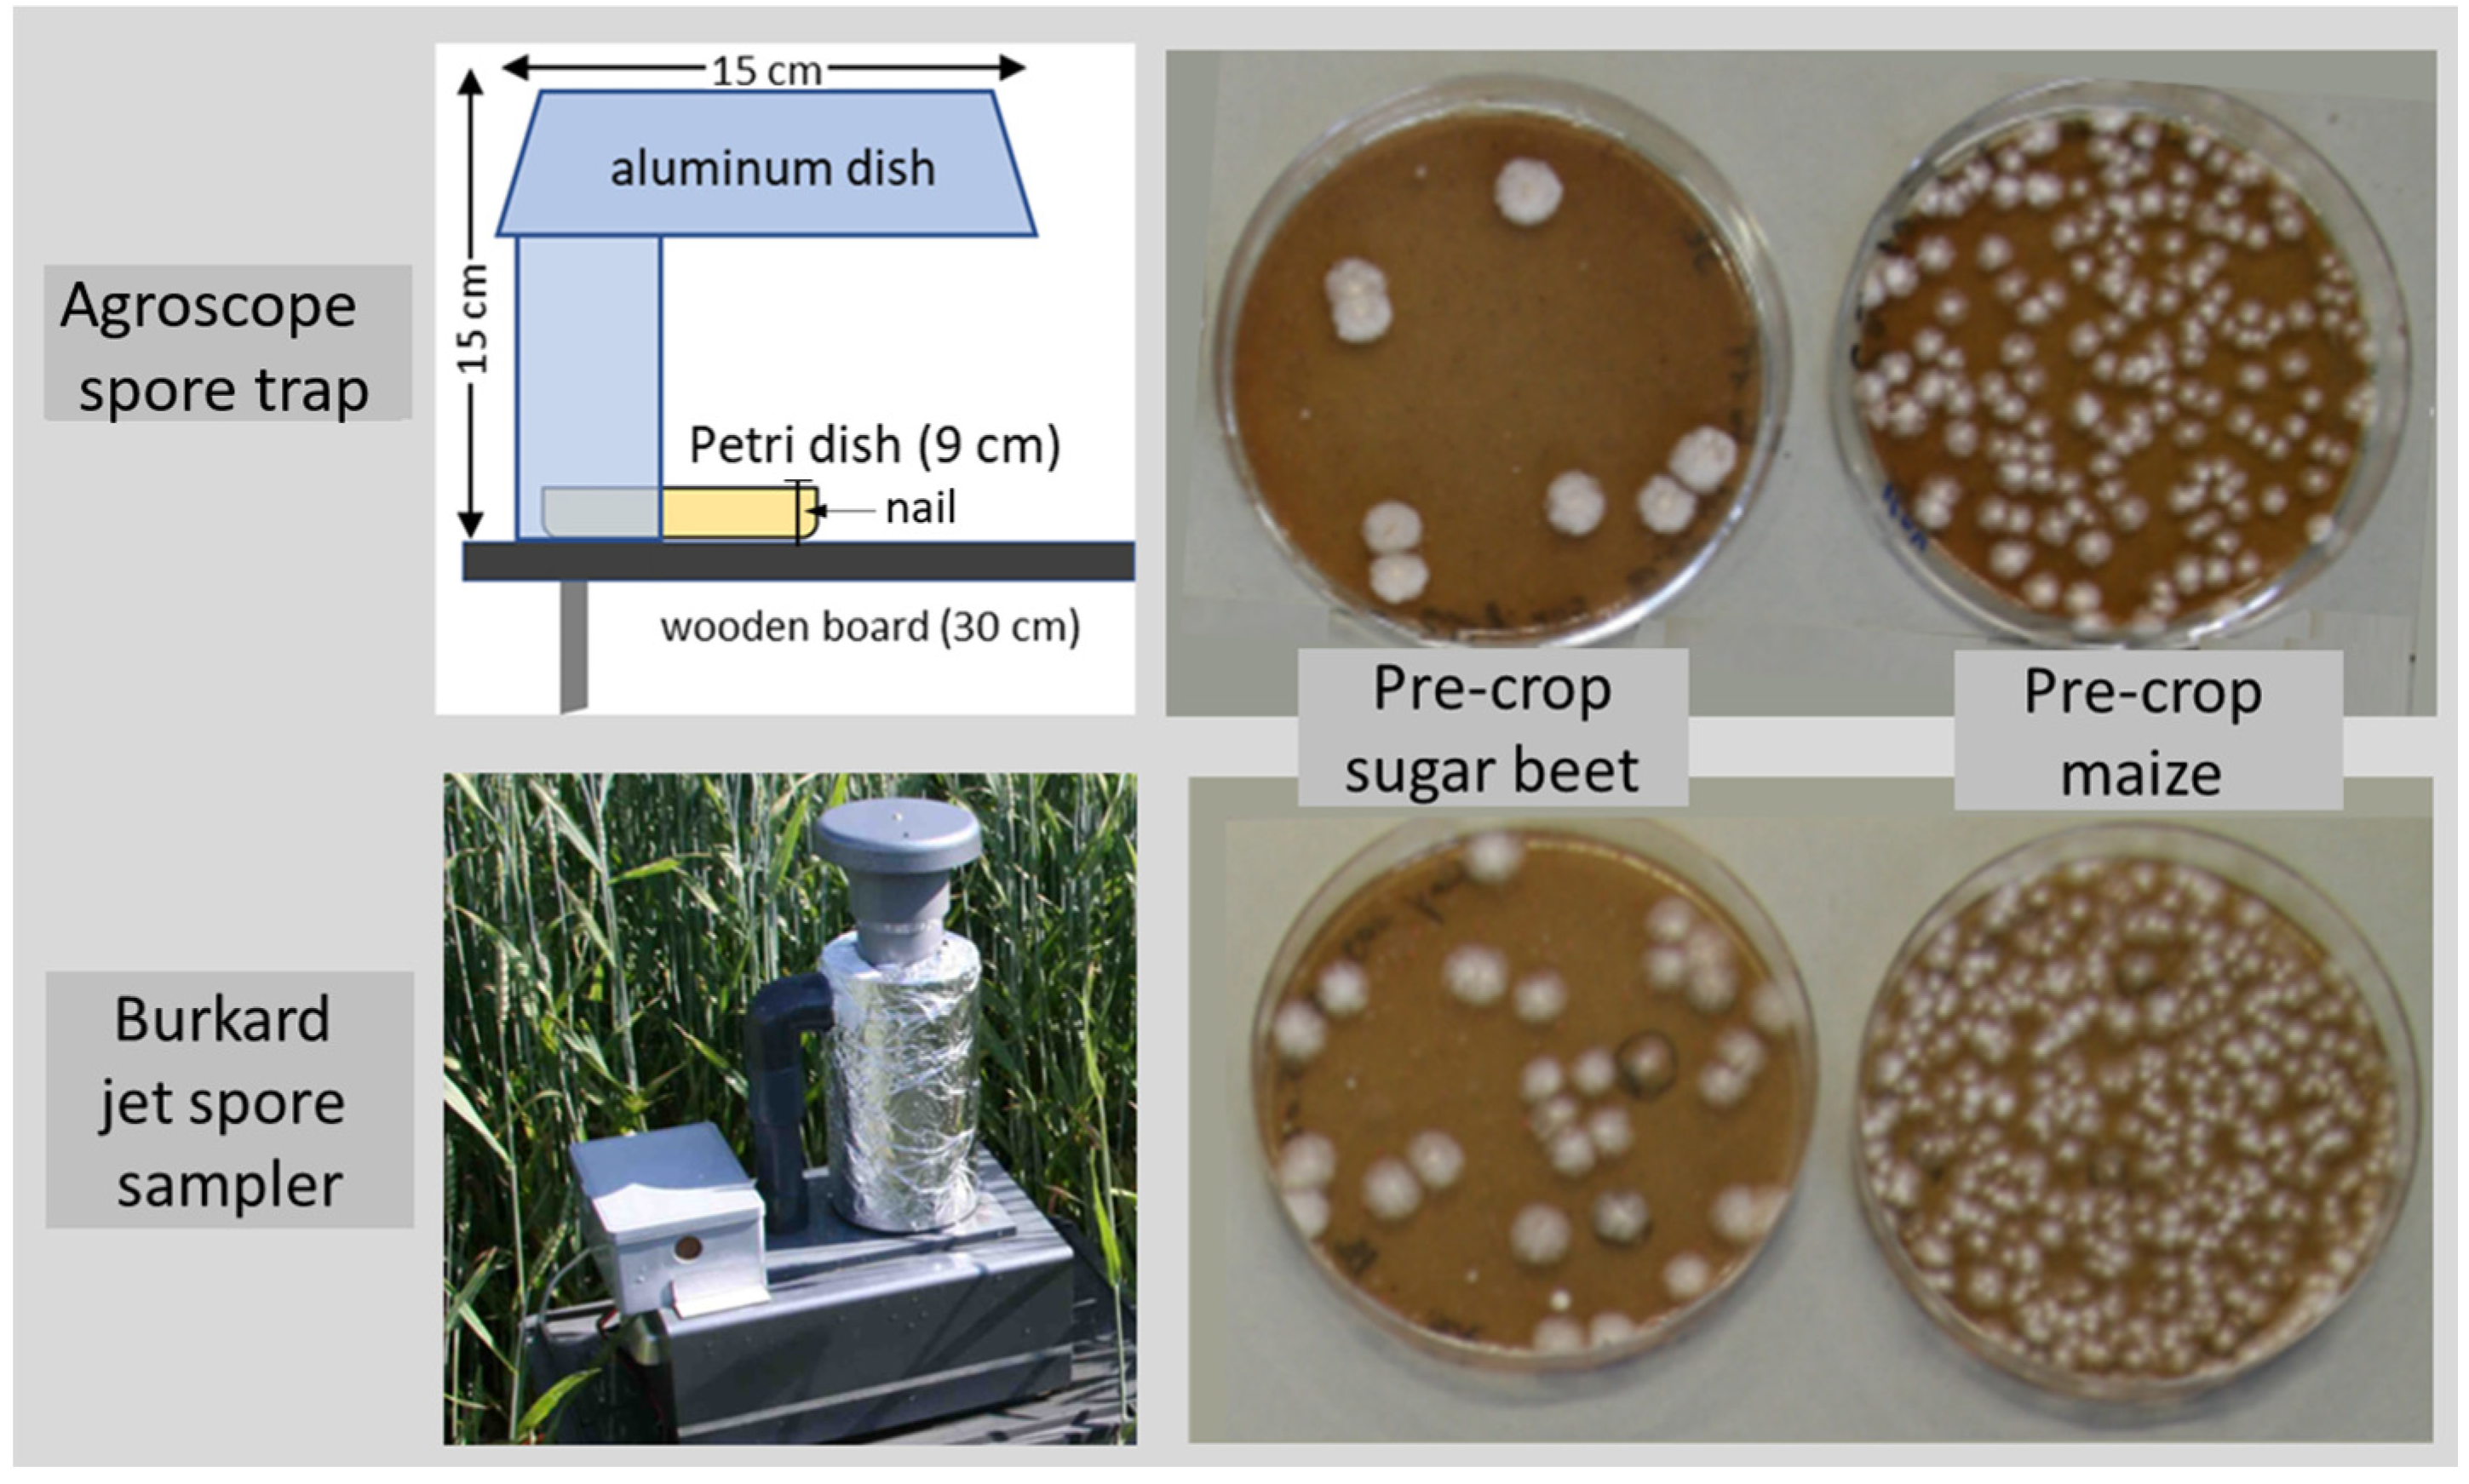
2.1. Spore Trap Construction and Utilisation

For the monitoring of spore deposition from Fusarium species in field trials, spore traps were constructed (Figure 1). A wooden board, approximately 30 cm long and 10 cm wide, was fixed onto an iron rod. An aluminum dish (15 cm × 11 cm × 4.5 cm, type 150550, Company Pacovis AG, Stetten, Switzerland) was fixed in a vertical position on the board. At the upper end of the aluminum dish, a second dish of the same type was attached in a horizontal position. A Petri dish (∅ 9 cm) with a Fusarium-selective agar medium, containing 48 mL pentachloronitrobenzene (PCNB) (Sigma-Aldrich®, Buchs, Switzerland) agar, also known as Nash-Snyder medium [14], was placed near the bottom of the vertical and under the horizontal aluminum dish. Two small nails were placed at a distance of 9 cm from the bottom of the vertical aluminum dish in order to fix the Petri dish onto the board. The aluminum dishes protected the agar plates not only from wind and rain but also from high temperatures and irradiation at noon and thereby prevented the dehydration of the agar. The so-called Agroscope (AGS) spore traps were placed at a height of 20, 50 or 90 cm (the latter approximately at the height of the wheat heads).
For the evaluation of the AGS spore trap and to compare it with a commercial spore trap, a Burkard high-throughput jet spore and particle sampler was used (High throughput ‘Jet’ spore and particle sampler—Burkard Manufacturing Co Ltd., Woodcock Hill Industrial Estate, Rickmansworth, Hertfordshire WD3 1PJ, UK). The jet spore sampler (JSS) collects spores by impaction onto a selective media, and captured colonies can be transferred to other culture media for identification [12]. Due to its properties and the impaction on selective agar, the jet spore sampler was used as a benchmark for the low-cost AGS spore trap. To limit the heating of the cylinder of the jet spore sampler with the agar plate, the Plexiglas cylinder was covered with aluminum foil (Figure 1). As with the AGS spore trap, airborne spores were deposited on PCNB agar. The height for the spore collection was at 50 cm and spores were sucked in every half hour for 2 minutes. One AGS trap at 50 cm near the JSS trap was used for the AGS/JSS comparison (experiment 3, Table 1). In experiment 1, in the center of the 3 fields, 1 AGS trap was placed at 20, 50 and 90 cm, while for experiment 2, only 1 trap was used at 50 cm (Table 1).
For the on-farm experiments with maize residue treatments (experiments 4–6, Table 1), one AGS spore trap was placed during anthesis at 50 cm and 90 cm height in the center of each plot. For all experiments and both trap types, the Petri dishes, filled with PCNB agar, were exchanged every 24 h at 8, 9 or 10 am in experiments 1, 3 and 4–6, respectively. In experiment 2, the agar plates were exchanged every 2 h for 48 h (Table 1). Subsequently, the PCNB agar plates were incubated at 12 h UV/12 h darkness at 18 °C for 6 days growth of fungal colonies.

2.2. Deposition of Fusarium Colonies on Agar Plates and Species Identification

After incubation, the Fusarium colonies were counted. For colony numbers above 300, only a representative quarter of the agar surface was counted using a jig with two-eighth segments. For the identification of the species on agar plates with more than 10 colonies, 10 colonies were selected using a grid (∅ 9 cm) with 230 numbered squares and a random number service (Random Integer Generator: http://www.random.org/integers/ accessed on 14 May 2021). Selected colonies were transferred onto potato dextrose agar (PDA; CM0139, Oxoid Ltd., Basingstoke, UK) as well as on “Spezieller nährstoffarmer Agar” (SNA) [15] containing a filter paper to promote sporulation [16]. Plates were incubated for at least 12 days at 18 °C with alternating darkness and UV light using a 12 h photoperiod. Fusarium species were identified based on macroscopic (mycelium shape and pigmentation) and microscopic characteristics (presence/absence and shape of macroconidia, microconidia, chlamydospores) [17,18].

2.3. Field Experiments: Locations, Cropping Systems and Weather Data

In Table 1, the geographical locations of experimental sites, previous crop and soil management, experimental question and period of the spore trapping with the Agroscope (AGS) and Burkard jet spore sampler (JSS) are listed (experiments 1–6). The maize residue field experiments (exp. 4–6) were set up in a randomized complete block design with 5–6 treatments, 3 replicates per treatment and a plot size of 18 m × 20 m. Residue treatments were conducted immediately after grain maize harvest and before the sowing of winter wheat. The treatments of the field experiments in 2007 and 2008 (experiments 4 and 5) included an untreated control or treatments with a field shredder, a field shredder combined with a rotary tiller, a forage harvester, a forestry mulcher as well as a disc harrow in 2008. Detailed information for the machinery is described in Vogelgsang et al. [10]. The treatments in 2009 (experiment 6) were an untreated control with maize residues left undisturbed on the soil surface, spread by a combine harvester (1), a mulching treatment using a field shredder with horizontal axis, equipped with forged hammer knives (2) and a Kuhn shredder with Y-shaped blades (3) (www.Kuhn.com accessed on 14 May 2021). Treatments 4–6 were equal to 1–3 except for the maize harvest: there, a combined harvester with a header for shredding and chopping (Geringhoff Horizon Star, https://www.geringhoff.com accessed on 14 May 2021) instead of a header with a rotary mower (Olimac Drago, https://dragotec.eu accessed on 14 May 2021) was used.
The weather data for experiments at or near Agroscope Zurich were obtained from a nearby (<500 m) weather station (MeteoSwiss, Federal Office of Meteorology and Climatology, Switzerland). For on-farm field experiments in the canton of Berne and Zurich forecasts, the FusaProg system (www.FusaProg.ch) was used. Based on regional weather data of SwissMetNet, the automatic monitoring network of MeteoSwiss, the Swiss Fusarium forecasting system FusaProg indicates days with medium and high infection risks for F. graminearum in wheat [19].

2.4. Wheat Harvest and Analyses of Deoxynivalenol (DON)

To examine the DON content in wheat grains, a bunch of wheat haulms with ears approximately 50 cm around the spore traps were collected on 5 occasions (experiment 1). Wheat plants from the on-farm maize residue field experiments (experiments 5–7) were collected immediately before harvest by the grower. For each plot, plants from 3 m2 were harvested by placing a U-shaped iron device of 0.71 cm side length (0.5 m2) on 6 randomly chosen spots and by cutting all wheat plants within the device right above the soil surface. Grains from wheat plants of experiments 1 and 5–7 were obtained by using a thresher designed for individual plants (Hege 140, H.U. Hege Maschinen, Waldenburg, Germany). Subsequently, grains and straw were dried with forced air at 32 °C for 2 days.
For the quantification of DON in experiment 1, liquid chromatography tandem mass spectrometry (LC-MS/MS) using a 1200 L system (Varian Inc., Walnut Creek, CA, USA) was performed. Details including the wheat cleaning and extraction are described in Forrer et al. [20]. The limit of quantification (LoQ) for DON was 20 μg/kg. Extraction and determination of DON content in grain samples of the field experiments 4–6 were conducted with an ELISA kit (Ridascreen DON, R-Biopharm, Darmstadt, Germany; LoQ for DON 220 μg/kg) according to the manufacturer’s protocol [10].
To determine the incidence (percentage of infection) by F. graminearum and other Fusarium species in wheat grains, a seed health test was conducted as described by Vogelgsang et al. [21]. Fungal colonies were identified according to Leslie and Summerell [18].

2.5. Statistical Analysis

Correlations between Fusarium colony-forming units (CFUs) of traps placed at different heights (Figure 2), between CFUs of different trap types or between CFUs and DON content in wheat grains were performed with Pearson product-moment correlations. To discriminate CFU sampling results, a Kruskal–Wallis one-way analysis of variance on ranks was used. To identify the groups that differ from the others, an all pairwise multiple comparison procedure was carried out (Tukey Test or Dunn’s method). To discriminate DON results in experiment 6, a two- or three-way analysis of variance was performed. All statistical analyses were performed using Sigma-Stat® 3.5 (Systat Software, San Jose, CA, USA) except for the relation of spore deposition and relative humidity of the air, for which the exponential function of Microsoft Office Excel 2016 was used.

3. Results

3.1. Use and Potential of the Agroscope Spore Trap

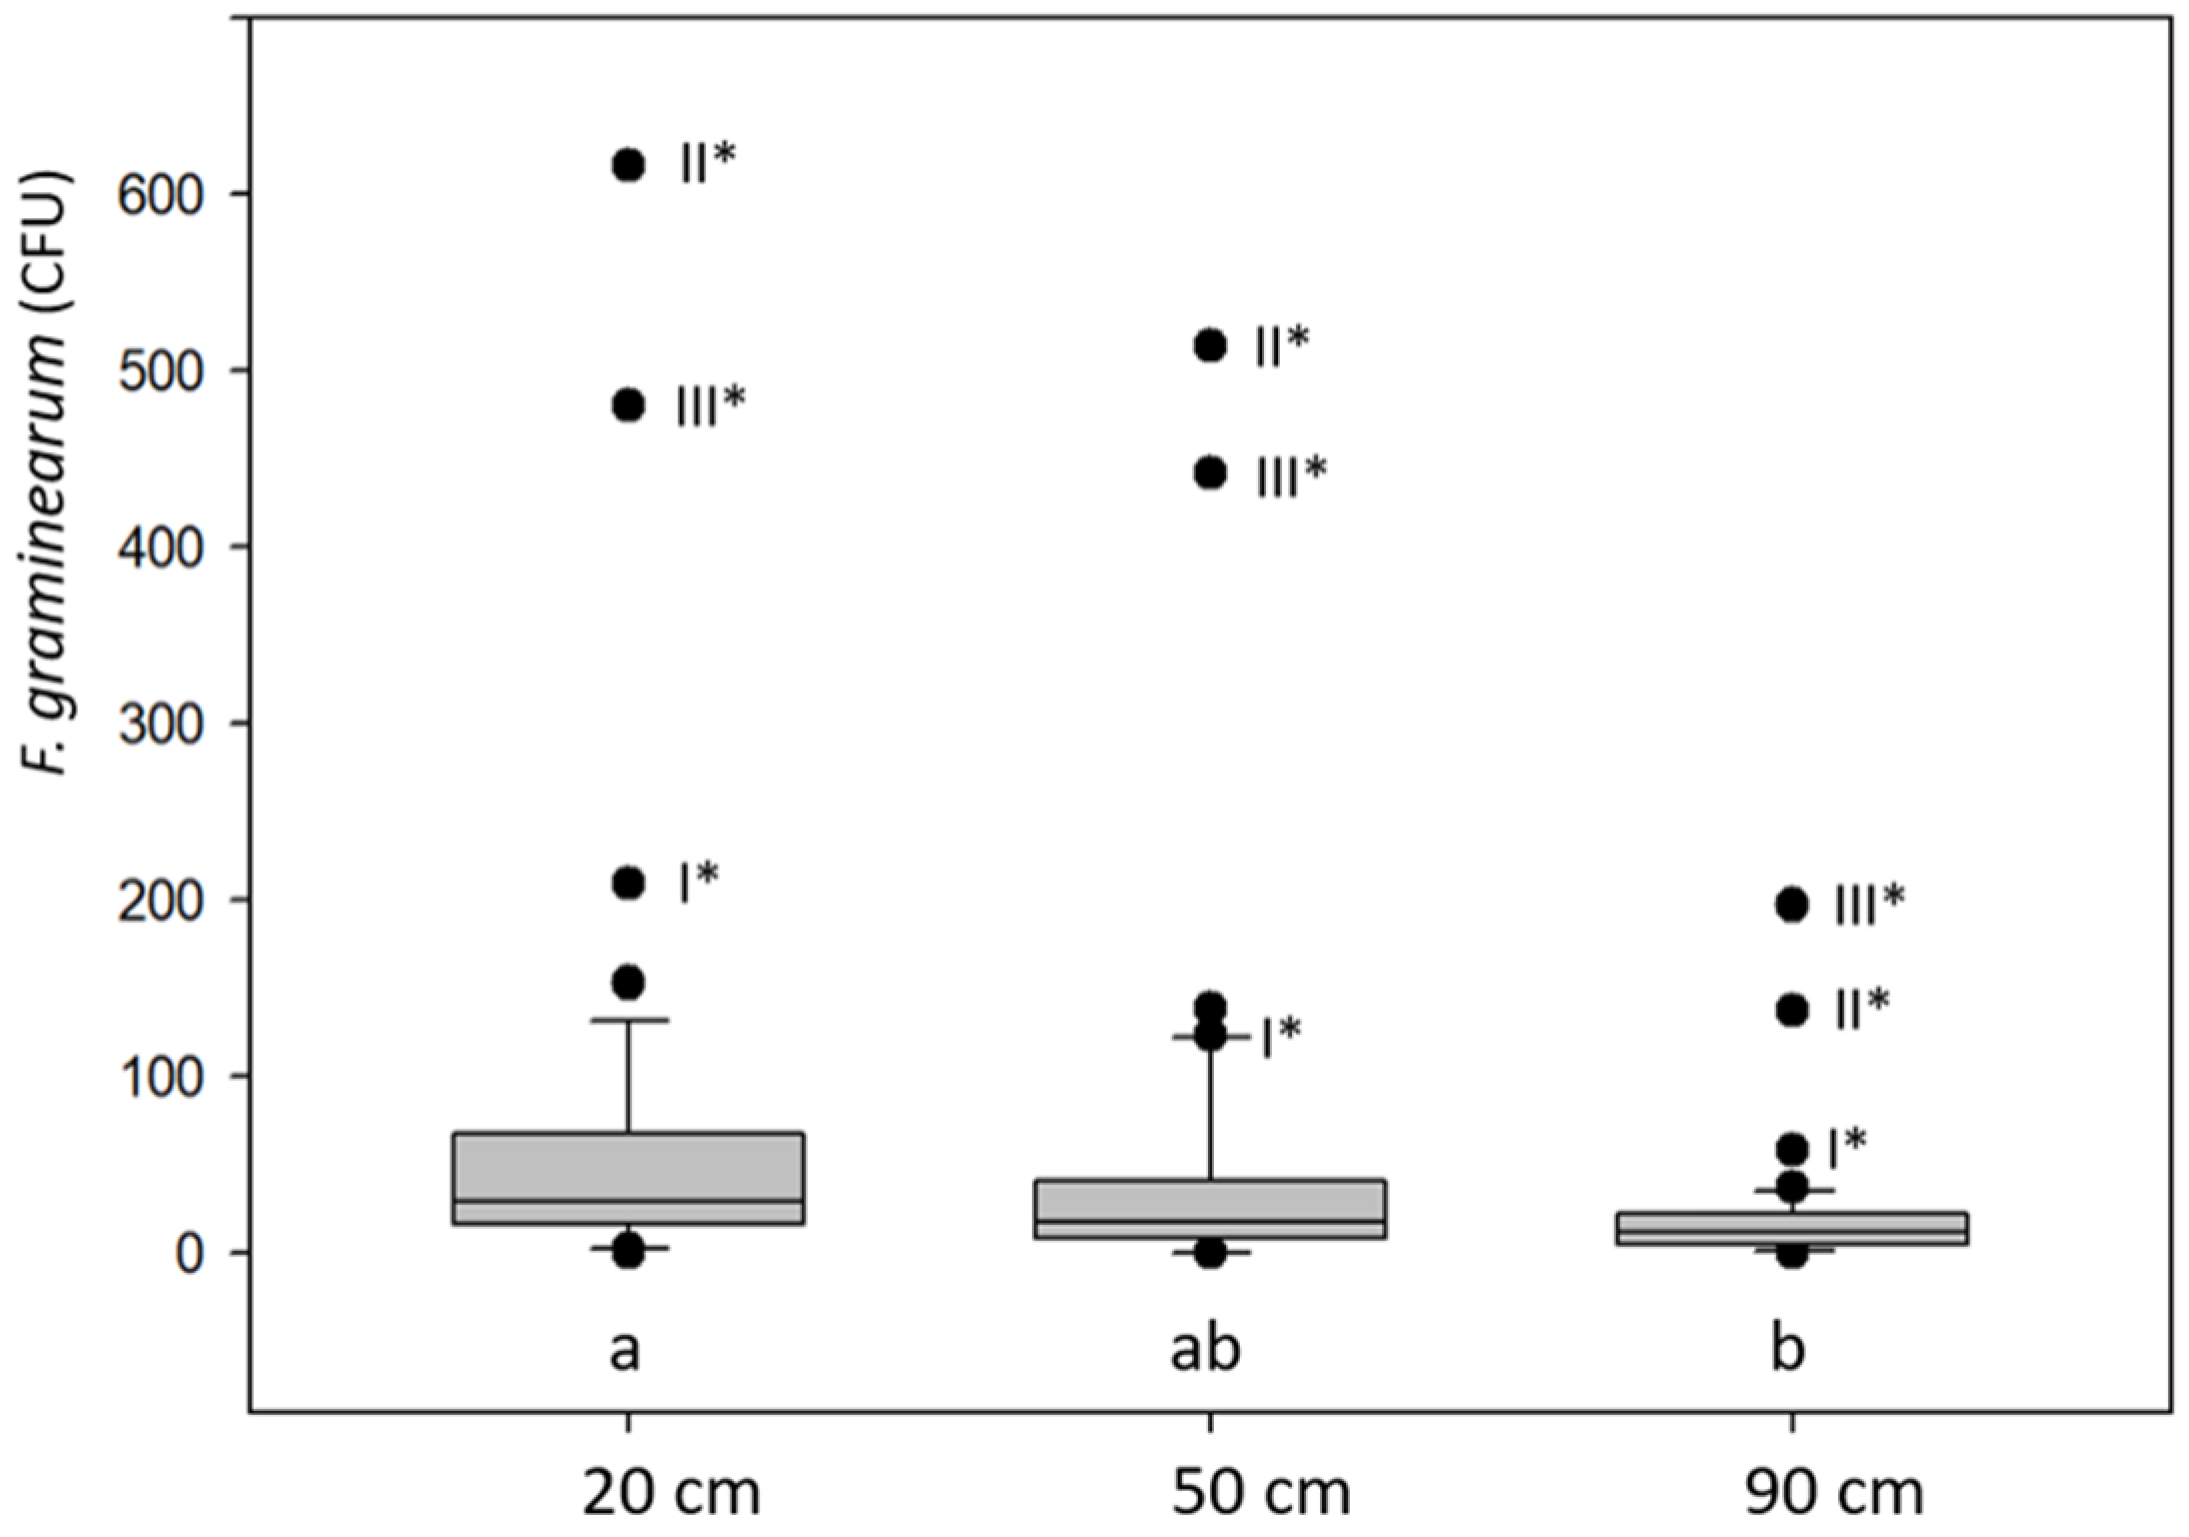
3.1.1. Deposition of F. graminearum Colony Forming Units (CFU) in Different Cropping Systems and Correlation of the Number of CFUs Sampled at Different Heights in the Wheat Canopy (2008)

Based on the previous crops and the tillage method of the three plots A, B and C, large differences of FHB and DON contaminations were expected. In fact, the average DON content in the wheat samples of A, B and C with three replicates differed greatly with 0.077, 0.132 and 2.072 mg/kg, respectively. The number of F. graminearum colonies on the agar showed a highly positive correlation with the DON content in the wheat grain samples, regardless of the height position of the spore traps (Table 2). On 22 May, the number of F. graminearum colonies reached the maximum. The highest CFU/DON correlation coefficients were observed with the spore traps at 90 cm (height of the wheat ears) with 0.991 and 0.997 (p < 0.0001) for the period from 15 to 29 May and on 22 May, respectively (Table 2).
Derived from the high DON content in grains from field C, the spore trap CFU data were used to examine the effect of the position of the spore traps at different heights in the wheat canopy. The median FG CFU for the traps at 20, 50 and 90 cm were 29, 18 and 12, respectively (Figure 2). Thereby, the number of CFUs in the 50 and 90 cm traps were 38% and 59% lower than in the trap at 20 cm. The correlation of the CFUs between the traps at 20 and 50 cm was 0.978, 0.915 between 20 and 90 cm and 0.917 between 50 and 90 cm (p < 0.0001). This close relationship is illustrated by the outlier values of the box plots in Figure 2. For all three box plots, four positive outlier values were observed and three of them were the results obtained from the sampling of 22 May. The CFU outlier values I, II and III (number of replicates) from the trap at 90 cm were highly correlated (r = 1.00 p = 0.0114) with the DON content of the wheat samples with 0.994, 2.186 and 3.035 mg/kg, respectively. For the whole period from 15 to 29 May, the Pearson correlation coefficient for CFU and DON was 0.997 (p = 0.049). For the spore traps at 20 and 50 cm, no significant correlations were detected. However, based on the declining number of CFUs from the 20 to 50 to 90 cm traps, all data are clear indications that the source of the CFUs was from local debris on the soil surface.

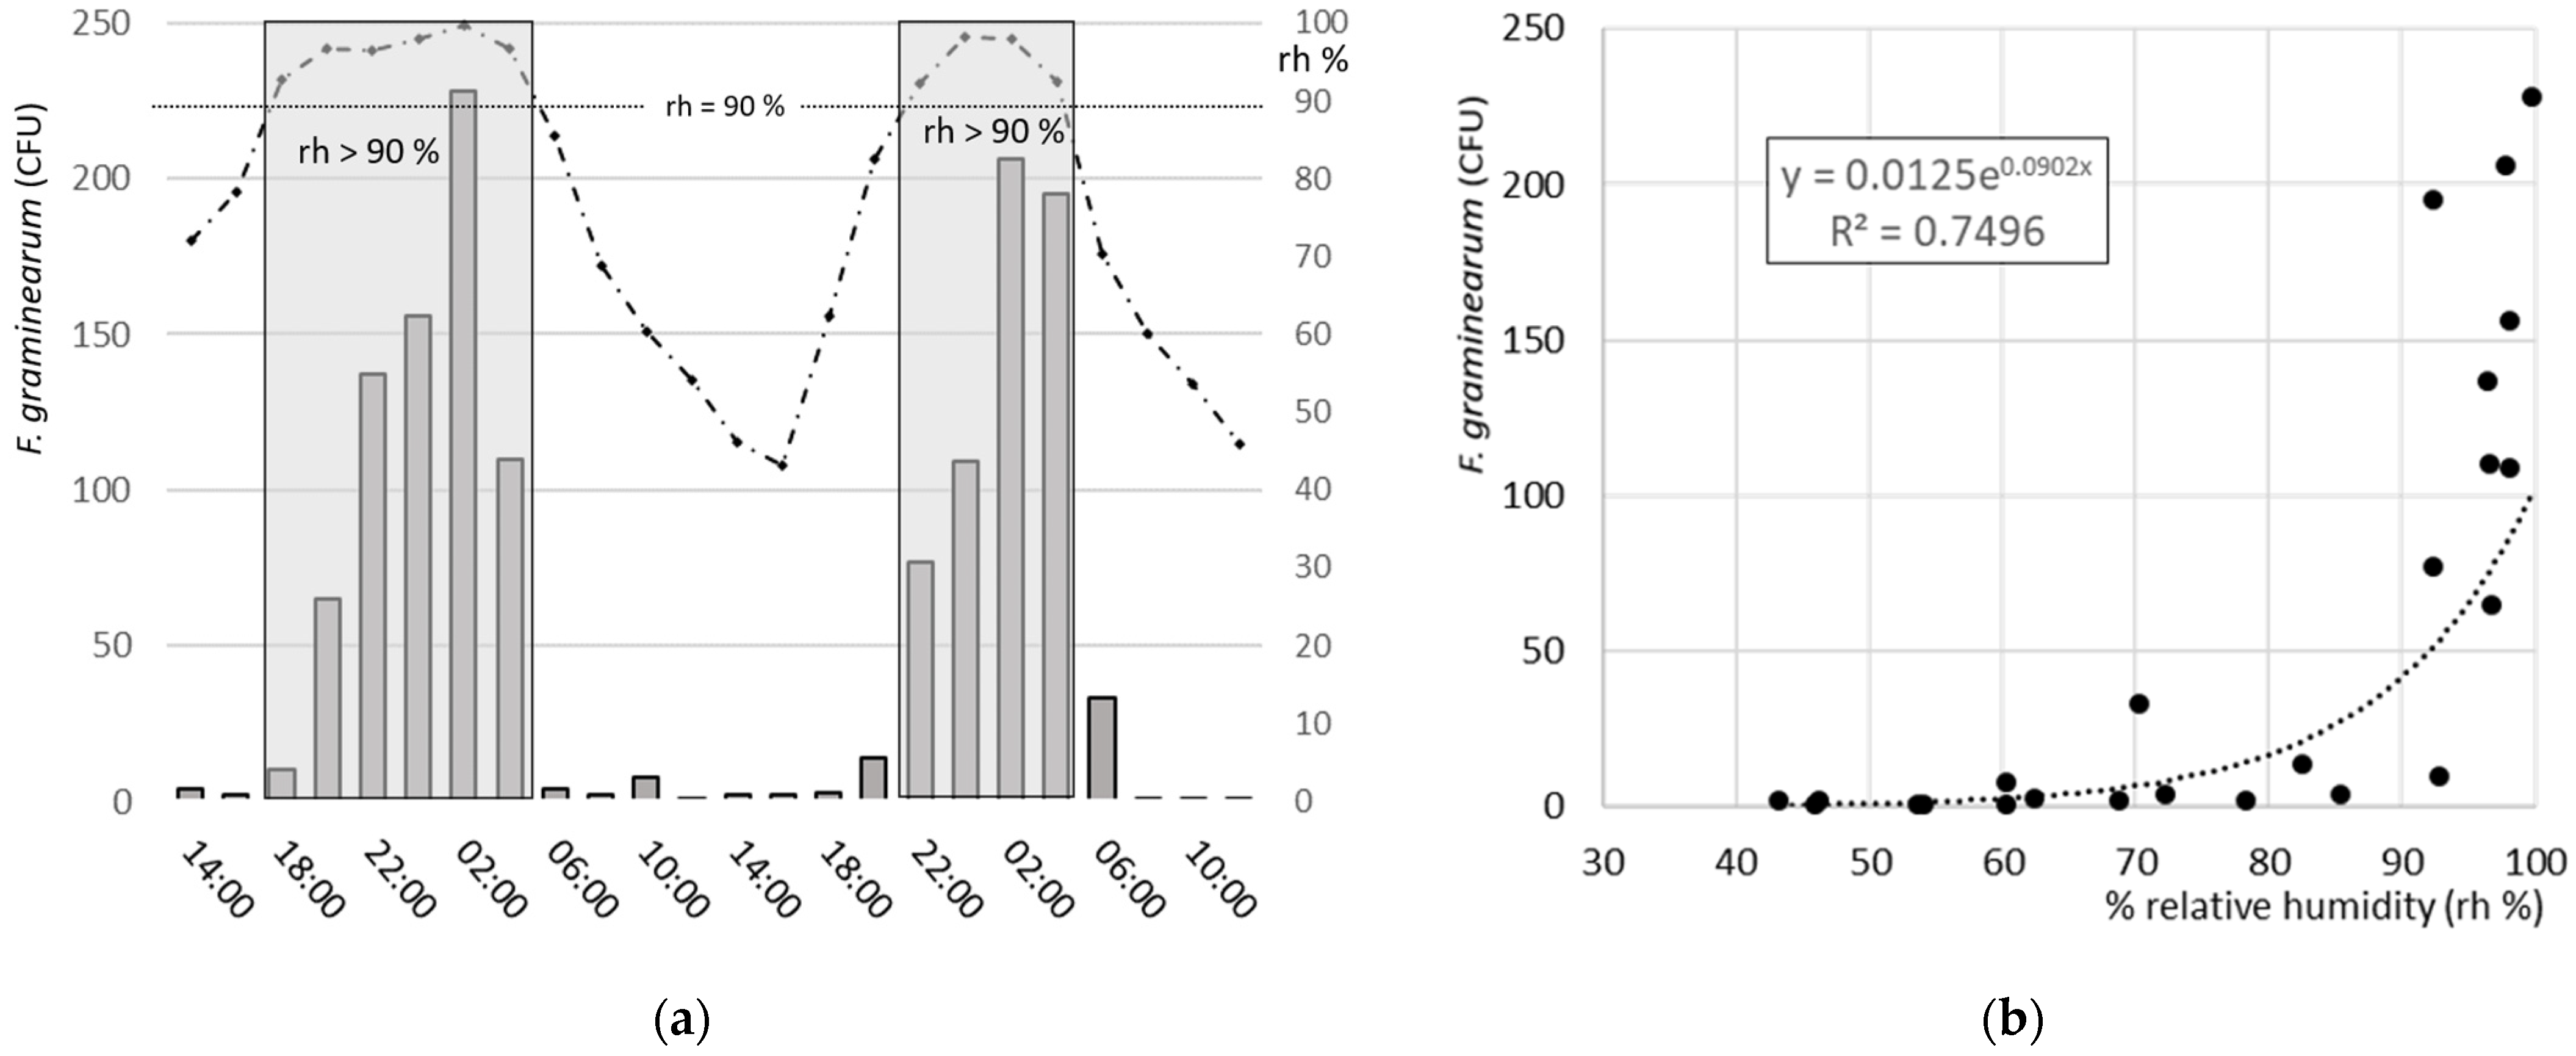
3.1.2. Deposition of F. graminearum Colony-Forming Units (CFU) during the Day and Night and Their Relationship with the Relative Humidity of the Air (2008)

In field trial 2 (Table 1), the release of CFUs over night and day and the relationship with the relative humidity of the air were examined. The 48 h sampling period from 17 June (14:00) to 19 June (14:00) 2008 was favourable for this experiment since from 16 to 17 June at 08:00, 10.6 mm of rain provided ample humidity on the soil and maize debris. During the sampling period, there was no rain and the daily average temperatures for 17–19 June were 14.2, 17.2 and 18.9 °C, respectively, favourable for FHB infections [1].
The spore release was mainly concentrated between 20:00 in the evening and 5:00 in the morning. The release seemed to be triggered by high relative humidity above 90%. The relationship between spore deposition and relative humidity is best described with the exponential function with an r2 = 0.750 (Figure 3).

3.2. Comparison of the Agroscope (AGS) Spore Trap with a High-Throughput Jet Spore Sampler

3.2.1. Deposition of F. graminearum Colony-Forming Units (CFU) from April until August 2010

From the beginning of April until the end of August 2010, the AGS spore trap was compared with a Burkard high throughput jet sampler. With respect to F. graminearum, the range of spore sampling reached from 0 to 1′097 and 928 F. graminearum CFU for the AGS spore trap and the high throughput jet sampler (JSS) in August, respectively (outliers) (Figure 4). Though the number of CFUs was higher with the AGS trap, the CFU numbers across the five months were not significantly different. Furthermore, the JSS sampler sucked two times per hour for 2 minutes, hence a longer suction time would have resulted in more CFUs. In fact, the Pearson product-moment showed a very strong correlation (0.932, p < 0.0001, n = 144) in CFUs between the two trap types for the entire sampling period.

3.2.2. Deposition of Various Fusarium Species in Three Periods from April until August 2010 on the Agroscope (AGS) Spore Trap and the High Throughput Jet Sampler (JSS)

One day after the first sampling period ended (10 June), artificial infections with four different Fusarium species were conducted in field A. Within this first sampling period, 213 and 108 Fusarium colonies were detected with the AGS and the JSS spore trap, respectively. Most prominent were F. graminearum with 57% and 58% and F. avenaceum with 20% and 18% deposited in the AGS and the JSS spore traps, respectively. The ratios of the eight species groups sampled with the AGS and JSS spore traps were almost equal with a correlation coefficient of 0.997. In the second period, which ended just before the harvest of the wheat in field A, the percentage of F. graminearum CFUs was 31% higher in JSS than in AGS traps. However, the correlation coefficient for the distribution of the species was still 0.977. In the third period from harvest until the end of August, F. graminearum strongly dominated the species distribution with 85% and 96% in the AGS and JSS traps, respectively, and the correlation coefficient was 0.998 (Table 3). Overall, both spore traps allowed the identification of different Fusarium species and proved to be appropriate to measure the deposited airborne spores from very low to very high quantities.

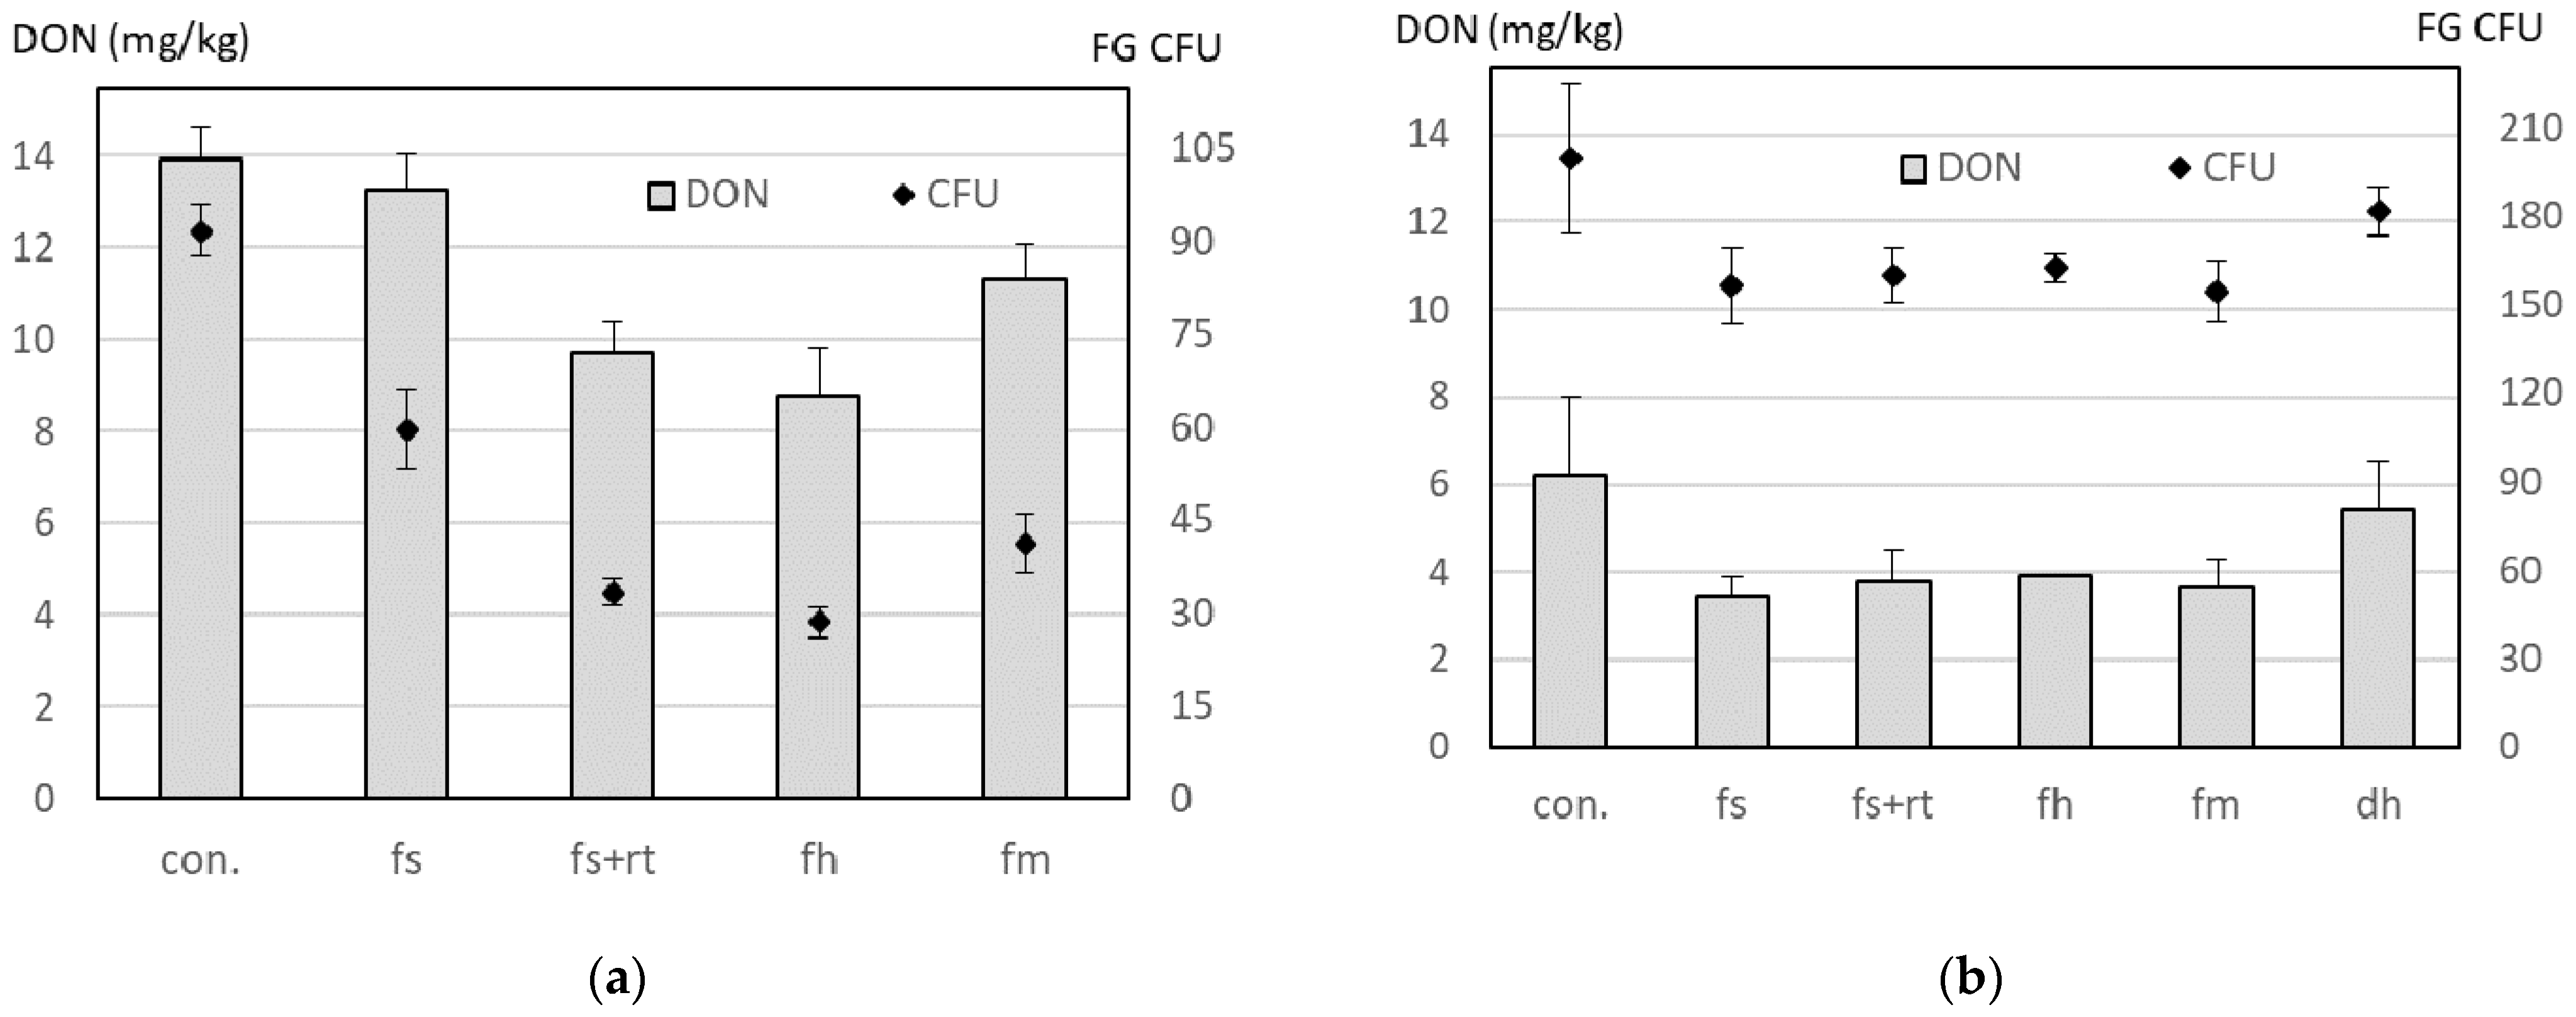
3.3. Relationship between Deposited Spores on Agroscope (AGS) Spore Traps in No-Tillage on-Farm Field Experiments and Deoxynivalenol (DON) Content in Wheat Grains

In 2007 and 2008, the AGS spore trap was used for the first time in field experiments on a no-till farm in Ballmoos in the canton Berne (Table 1, experiment 4). In these experiments with a grain maize/winter wheat rotation, the effect of different maize residue treatments on FHB and DON contamination in wheat (2007: variety Ludwig, 2008: Runal) was evaluated [10].
In the experiment of 2007, spore sampling was conducted only once on 5 June during wheat anthesis. Just 2 days later, FusaProg [19] indicated a day of high infection risk and in the following 15 days, 8 days with high and 3 days with low risk. This high-risk situation can explain the high DON content of up to 13.9 mg/kg measured in the wheat grains (Figure 5a). The effect of the residue treatments on the FG CFU and the DON content revealed a strong correlation coefficient of 0.808 (p < 0.001) (Table 4).
In the experiment of 2008, spore sampling was performed on 4 days during growth stages 57–69 [22]. Compared with 2007, the mean DON content across all treatments was 60% lower and reached in the control treatment without residue treatment a maximum of 6.2 mg/kg (Figure 5b). On 11 June, FusaProg predicted a day with high infection risk. However, in contrast to 2007, in the following 15 days, only a low infection risk was predicted. Nevertheless, as observed in 2007, the effect of the residue treatments on the FG CFU and the DON content showed a strong correlation coefficient of 0.897 (p < 0.0001) (Table 4). Correlation coefficients for individual days and 3–4-day periods, as well as for sampling at 50 cm and 90 cm height, are given in Table 4.
In 2009, another on-farm experiment with maize residue treatments was conducted in Ossingen (experiment 6, Table 1) in the canton of Zurich. The main goal of this experiment was to test the effect of field shredders with horizontal axis fitted with hammer or Y-shaped blades as well as the effect of a subbase chopper at the maize combine harvester. Compared to the directly sown control treatment, the DON content in the wheat grains was reduced by two residue treatments up to 49% (Figure 6). However, due to high variability between the replicates, no significant differences were detected. Due to an error in planning, the sampling of Fusarium spores started only at the end of wheat anthesis (GS 69–71) from 8 to 10 June. The correlation between DON and the number of CFUs for the trap at 50 cm height for this 3-day period was not significant, with a coefficient of 0.449. Significant DON/CFU correlations were observed for the trap at 90 cm with a coefficient of 0.669 (p < 0.001) but also for the average of both traps with a coefficient of 0.606 (p < 0.01) (Table 4).

4. Discussion

Innovations in the development and use of air-sampling devices since the first description of the Hirst spore trap in 1952 as well as novel technologies used for the detection of FHB and airborne inoculum are described by West et al. [23,24]. Other studies report about short and long-distance transport of spores. To examine the effect of temperature and moisture on the development and maturing of perithecia of F. graminearum, airborne ascospores were sampled on microscope slides at a distance of 3–5 cm from infected maize stalks [25]. In another investigation, the long-distance transport of viable spores across large regions was examined with remote-piloted vehicles. To these vehicles, spore traps consisting of vertically mounted Petri dishes with Fusarium-selective agar were attached [26]. In Belgium, a method for monitoring of field local airborne F. graminearum inoculum was elaborated, combining the use of Burkard 7-day air samplers and qPCR. The airborne inoculum was measured above five wheat fields for 3 years from 15 April until 31 July. For this period but also for shorter periods, correlation coefficients of up to 0.90 between the F. graminearum inoculum and the DON content were detected [13].

4.1. Spore Dispersal in Different Cropping Systems and Spore Deposition at Different Height in the Wheat Canopy

There are few reports on spore trapping at different heights in wheat fields. In one study, spore traps were placed at 0, 30 and 100 cm above the ground to examine the dispersal of rain-splashed ascospore and macroconidia spores from maize debris. However, we assume that the rain splash infections of F. graminearum on wheat after maize with ascospores and macroconidia are less important than airborne infections from ascospores. Nevertheless, the results are not contradictory with our results since the spore density was generally higher at 0 and 30 cm than at 100 cm [27]. In another study, the distribution patterns of ascospores and conidia were assessed using traps placed at 10, 30, 60 and 90 cm (wheat head) height. Of the total spores counted, 93% were ascospores and 7% were conidia, and at 90 cm, 99.7% of the spores were ascospores. Approximately 41, 22, 19 and 18% of the ascospores were sampled at 10, 30, 60 and 90 cm [28], respectively. The mean reduction for 10 and 30 cm, approximately corresponding to our trap at 20 cm, was 32%. The reduction to 18% ascospores sampled at 90 cm corresponds to a reduction of 57% between 20 (mean of 10 and 30 cm) and 90 cm. Based on the median of CFUs sampled in our experiment from 15 May until 29 May, a reduction of 59% between the 20 and the 90 cm trap resulted. Our and the cited results manifest a vertical distribution pattern indicating an upward movement of F. graminearum CFUs from maize residues on the ground.

4.2. Dispersal of Fusarium graminearum Spores over Day and Night

In response to environmental stimuli such as rainfall and high relative humidity (RH), the ascospores are forcibly discharged from perithecia because of a build-up of turgor pressure [29]. In fact, we observed a diurnal pattern with the main spore release between 18:00 and 06:00, a period with relative humidity (RH) of ≥90%. The spore release pattern and the weather conditions before and during the experiment are strong indications that most of our CFUs are produced by ascospores as observed elsewhere [28]. It has been repeatedly reported that ascospore release occurs in a diurnal pattern for 1 to 4 days after 5 mm or more rainfall. This usually starts around 17:00–18:00 with a rise in RH early in the evening, peaks between 21:00 and midnight and continues until 04:00 [12,30,31].

4.3. Comparison of Spore Traps and Seasonal Dynamics of Airborne Fusarium graminearum and Other Fusarium Species

To clarify daily and seasonal dynamics of airborne F. graminearum and other Fusarium species in Ontario (Canada), Burkard high-throughput jet spore and particle samplers (JSS) proved to be most valuable. The JSS sampler allows the identification of species and provides cultures that can be used for further studies [12]. In our study, the comparison of the F. graminearum spore sampling with the AGS and the JSS traps from 1 April until the end of August 2010 demonstrated that the traps provided similar results for all 5 months. Only 0.03 F. graminearum CFUs per day were registered in April, but very high quantities of 513 and 306 F. graminearum CFUs per day in August were sampled with the AGS and the JSS trap, respectively. The strong correlation coefficient of 0.932 between the two traps for the whole period is another strong indication for an equal sampling pattern. Furthermore, the equal ratios of Fusarium species deposited on the AGS and the JSS traps are yet another indication that both devices give equal results. The correlation coefficients for the species ratios varied only between 0.977 and 0.998.

4.4. Correlation between Colony Forming Units Sampled with the Agroscope (AGS) Spore Trap and the Deoxynivalenol (DON) Content in Wheat Grains in On-Farm Experiments with Maize Residue Treatments

The AGS spore trap was developed to measure the effect of maize residue treatments on F. graminearum spore dispersal in an on-farm experiment with maize/winter wheat rotations. The first application of the trap in 2007 already revealed a strong relationship between the F. graminearum CFU deposition and the DON content in wheat grains.
In field experiments in 2017 and 2018 at Agroscope-Reckenholz in Zurich, mulch layers and botanicals were utilized to investigate prevention measures to suppress FHB infections in wheat from F. graminearum-infected maize residues and to reduce mycotoxins in wheat. Spore deposition was measured three times during anthesis with one AGS spore trap per plot at the same height as the flowering heads (~90 cm). Petri dishes were placed in the evening (18:00–19:00) in the traps and collected on the following morning (09:00–10:00), allowing a period of 14 to 16 h for ascospore deposition, an approach that is probably well suited for the collection of F. graminearum ascospores. There was a good correlation between ascospore deposition and DON content, with a coefficient of 0.71 and 0.75 (p < 0.001) in the first and the second year [32]. In our on-farm experiment in 2008, we also obtained a CFU/DON correlation coefficient of 0.76 for three-time spore collection at 90 cm, and 0.89 for the collection at 50 and 90 cm. In 2007, with only one sampling day, we observed a correlation of 0.81 with traps at 50 and 90 cm and only 0.65 for the trap at 90 cm. Therefore, it seems to be appropriate to collect plot-specific F. graminearum CFUs not only at the height of the wheat heads, but also in the wheat canopy at about 50 cm.
In further field experiments in 2017 and 2018 at Agroscope-Reckenholz in Zurich, the potential of biological control agents (BCAs) against F. graminearum on infected maize stalks was evaluated. With AGS spore traps, significant reductions of F. graminearum CFUs of up to 64% were detected when maize stalks were treated with the fungal BCA Clonostachys rosea. Four spore samplings were conducted during anthesis with one trap per plot at the height of the wheat heads. Principal component analysis on F. graminearum spore deposition, disease symptoms (FHB severity), number of F. graminearum genome copies (DNA), F. graminearum incidence and DON content in the harvested grain showed that spore deposition and DON content are strongly linked [33].
To reduce the risk of FHB infections, the presented on-farm field experiments proved that spore traps are a highly valuable tool to identify the most suitable maize residue treatments. The investigations on mulch layers and botanicals [32] as well as BCA applications on maize residues [33] are fully in line with our results and underline that plot-specific traps allow comparing the effect of different maize residue treatments.
Apart from the strong correlation between the spore deposition and the DON contamination in wheat, the current study has shown that the spore deposition identifies the epidemiological value of a particular treatment. Recently, applications of C. rosea on wheat heads reduced DON by 45–69% but showed no effect on zearalenone (ZEN) [34]. With applications on maize residues, and thereby taking the epidemiology of F. graminearum into account, both DON and ZEN in wheat were reduced by 80–90% [33].

5. Conclusions

Airborne inoculum is the most important factor in FHB epidemics and the contamination of small grains with mycotoxins. All of our experiments revealed that the sources of FHB epidemics are local, farm-based and regulated by various cropping factors such as crop rotation and tillage. This is clearly true for F. graminearum, worldwide the main cause of FHB epidemics in wheat and barley, and of which the life cycle is known. However, the impact of long-distance spore transport should not be underestimated, as it can be the source of new and possibly more virulent Fusarium strains.
The AGS spore trap proved to be a highly valuable tool to compare the FHB infection pressure in field experiments with different crop management treatments. Due to their low cost and simple construction with no need for a power supply, the AGS trap is highly suitable for field-based monitoring. To our knowledge, the presented approach to use spore traps as a means to measure the risk of FHB, not only in commercial fields but also in field experiments, is unique. Based on the collection of viable airborne spores of Fusarium species and due to their reliability, the AGS trap is also highly useful to investigate and develop innovative and sustainable cropping systems and methods, reducing the risk of FHB epidemics. Thereby, and considering the strong correlations between F. graminearum CFUs sampled during anthesis and the DON content in harvested wheat grains, the application of spore traps can help to develop sustainable cropping systems and thus improve food and feed security in small-grain production.
The construction of the traps, the Petri dishes with semi-selective agar as well as the detection of colonies and identification of Fusarium species offers low requirements to laboratories and their infrastructure. Based on all these features, there is a high potential for worldwide applications of the AGS spore trap. The traps and their application could also be an excellent tool for the training of students in applied epidemiology.

Author Contributions

Conceptualization, H.-R.F. and S.V.; methodology, H.-R.F., S.V., A.P. and T.M.; validation, A.P., T.M. and S.V.; formal analysis, H.-R.F. and S.V.; investigation, H.-R.F.; resources, A.P., T.M. and S.V.; data curation, H.-R.F.; writing—original draft preparation, H.-R.F. and S.V.; writing—review and editing, H.-R.F. and S.V.; visualization, H.-R.F. and S.V.; supervision, H.-R.F. and S.V.; project administration, S.V.; funding acquisition, H.-R.F. and S.V. All authors have read and agreed to the published version of the manuscript.

Funding

This research received no external funding.

Institutional Review Board Statement

Not applicable.

Informed Consent Statement

Not applicable.

Data Availability Statement

The data presented in this study are available on request from the corresponding author.

Acknowledgments

We are grateful to Irene Bänziger, Eveline Jenny and to our late colleague, Andreas Hecker, for excellent technical assistance. We also thank Thomas D. Bucheli and Felix E. Wettstein for the analysis of mycotoxins (all Agroscope Zurich, Switzerland).

Conflicts of Interest

The authors declare that there are no conflict of interest.

References

  1. Fernando, W.G.D.; Oghenekaro, A.O.; Tucker, J.R.; Badea, A. Building on a foundation: Advances in epidemiology, resistance breeding, and forecasting research for reducing the impact of fusarium head blight in wheat and barley. Can. J. Plant Pathol. 2021. [Google Scholar] [CrossRef]
  2. Vogelgsang, S.; Beyer, M.; Pasquali, M.; Jenny, E.; Musa, T.; Bucheli, T.D.; Wettstein, F.E.; Forrer, H.-R. An eight-year survey of wheat shows distinctive effects of cropping factors on different Fusarium species and associated mycotoxins. Eur. J. Agron. 2019, 105, 62–77. [Google Scholar] [CrossRef]
  3. Edwards, S.G. Fusarium mycotoxin content of UK organic and conventional oats. Food Addit. Contam., Part A. 2009, 26, 1063–1069. [Google Scholar] [CrossRef] [Green Version]
  4. Schöneberg, T.; Musa, T.; Forrer, H.-R.; Mascher, F.; Bucheli, T.D.; Bertossa, M.; Keller, B.; Vogelgsang, S. Infection conditions of Fusarium graminearum in barley are variety specific and different from those in wheat. Eur. J. Plant Pathol. 2018, 151, 975–989. [Google Scholar] [CrossRef] [Green Version]
  5. Xu, X.M.; Berrie, A.M. Epidemiology of mycotoxigenic fungi associated with Fusarium ear blight and apple blue mould: A review. Food Addit. Contam. 2005, 22, 290–301. [Google Scholar] [CrossRef] [PubMed]
  6. van der Lee, T.; Zhang, H.; van Diepeningen, A.; Waalwijk, C. Biogeography of Fusarium graminearum species complex and chemotypes: A review. Food Addit. Contam. Part A. 2015, 32, 453–460. [Google Scholar] [CrossRef] [PubMed] [Green Version]
  7. Dill-Macky, R.; Jones, R.K. The effect of previous crop residues and tillage on Fusarium head blight of wheat. Plant Dis. 2000, 84, 71–76. [Google Scholar] [CrossRef] [PubMed] [Green Version]
  8. Khonga, E.B.; Sutton, J.C. Inoculum production and survival of Gibberella zeae in maize and wheat residues. Can. J. Plant Pathol. 1988, 10, 232–239. [Google Scholar] [CrossRef]
  9. Blandino, M.; Haidukowski, M.; Pascale, M.; Plizzari, L.; Scudellari, D.; Reyneri, A. Integrated strategies for the control of Fusarium head blight and deoxynivalenol contamination in winter wheat. Field Crops Res. 2012, 133, 139–149. [Google Scholar] [CrossRef] [Green Version]
  10. Vogelgsang, S.; Hecker, A.; Musa, T.; Dorn, B.; Forrer, H.R. On-farm experiments over five years in a grain maize—winter wheat rotation: Effect of maize residue treatments on Fusarium graminearum infection and deoxynivalenol contamination in wheat. Mycotoxin Res. 2011, 27, 81–96. [Google Scholar] [CrossRef] [PubMed]
  11. Trail, F. For blighted waves of grain: Fusarium graminearum in the post genomics era. Plant Physiol. 2009, 149, 103–110. [Google Scholar] [CrossRef] [PubMed] [Green Version]
  12. Fernando, W.G.D.; Miller, J.D.; Seaman, W.L.; Seifen, K.; Paulitz, T.C. Daily and seasonal dynamics of airborne spores of Fusarium graminearum and other Fusarium species sampled over wheat plots. Can. J. Plant Pathol. 2000, 78, 497–505. [Google Scholar]
  13. Hellin, P.; Duvivier, M.; Dedeurwaerder, G.; Bataille, C.; De Proft, M.; Legrève, A. Evaluation of the temporal distribution of Fusarium graminearum airborne inoculum above the wheat canopy and its relationship with Fusarium head blight and DON concentration. Eur. J. Plant Pathol. 2018, 151, 1049–1064. [Google Scholar] [CrossRef]
  14. Papavizas, G.C. Evaluation of various media and antimicrobial agents for isolation of Fusarium from soil. Phytopathology 1967, 57, 848–852. [Google Scholar]
  15. Nirenberg, H. A simplified method for identifying Fusarium spp. occurring in wheat. Can. J. Bot. 1981, 59, 1599–1609. [Google Scholar] [CrossRef]
  16. Singh, K.; Frisvad, J.C.; Thrane, U.; Mathur, S.B. An Illustrated Manual on Identification of some Seed-borne Aspergilli, Fusarium, Penicillia and their Mycotoxins; Danish Government, Institute of Seed Pathology for Developing Countries: Copenhagen, Denmark, 1991. [Google Scholar]
  17. Nelson, P.E.; Toussoun, T.A.; Marassas, W.F.O. Fusarium Species: An Illustrated Manual for Identification; Pennsylvania State University Press: State College, PA, USA, 1983. [Google Scholar]
  18. Leslie, J.F.; Summerell, B.A. The Fusarium Laboratory Manual; Blackwell Publishing: Ames, IA, USA, 2006; p. 388. [Google Scholar]
  19. Musa, T.; Hecker, A.; Vogelgsang, S.; Forrer, H.R. Forecasting of Fusarium head blight and deoxynivalenol content in winter wheat with FusaProg. EPPO Bull. 2007, 37, 283–289. [Google Scholar] [CrossRef]
  20. Forrer, H.R.; Hecker, A.; Musa, T.; Schwab, F.; Bucheli, T.D.; Wettstein, F.E.; Vogelgsang, S. Fusarium head blight control and prevention of mycotoxin contamination in wheat with botanicals and tannic acid. Toxins 2014, 6, 830–849. [Google Scholar] [CrossRef] [PubMed] [Green Version]
  21. Vogelgsang, S.; Sullyok, M.; Hecker, A.; Jenny, E.; Krska, R.; Schuhmacher, R.; Forrer, H.-R. Toxigenicity and pathogenicity of Fusarium poae and Fusarium avenaceum on wheat. Eur. J. Plant. Pathol. 2008, 122, 265–276. [Google Scholar] [CrossRef]
  22. Zadoks, J.C.; Chang, T.T.; Konzak, C.F. A decimal code for the growth stages of cereals (maize, sorghum, forage grasses and dicotyledonous crops). Weed Res. 1974, 14, 415–421. [Google Scholar] [CrossRef]
  23. West, J.S.; Kimber, R.B.E. Innovations in air sampling to detect plant pathogens. Ann. Appl. Biol. 2015, 166, 4–17. [Google Scholar] [CrossRef] [Green Version]
  24. West, J.S.; Canning, G.G.M.; Perryman, S.A.; King, K. Novel technologies for the detection of Fusarium head blight disease and airborne inoculum. Trop. Plant Pathol. 2017, 42, 203–209. [Google Scholar] [CrossRef] [PubMed] [Green Version]
  25. Manstretta, V.; Rossi, V. Effects of temperature and moisture on development of Fusarium graminearum perithecia in maize stalk residues. Appl. Environ. Microbiol. 2016, 82, 184–191. [Google Scholar] [CrossRef] [PubMed] [Green Version]
  26. Maldonado-Ramirez, S.L.; Schmale, D.G.I.; Shields, E.J.; Bergstrom, G.C. The relative abundance of viable spores of Gibberella zeae in the planetary boundary layer suggests the role of long-distance transport in regional epidemics of Fusarium head blight. Agric. For. Meterol. 2005, 132, 20–27. [Google Scholar] [CrossRef]
  27. Paul, P.A.; El-Allaf, S.M.; Lipps, P.E.; Madden, L.V. Rain splash dispersal of Gibberella zeae within wheat canopies in Ohio. Phytopathology 2004, 94, 1342–1349. [Google Scholar] [CrossRef] [PubMed] [Green Version]
  28. Manstretta, V.; Rossi, V. Effects of weather variables on ascospore discharge from Fusarium graminearum perithecia. PLoS ONE 2015, 10, e0138860. [Google Scholar] [CrossRef] [Green Version]
  29. Trail, F.; Xu, H.; Loranger, R.; Gadoury, D. Physiological and environmental aspects of ascospore discharge in Gibberella zeae (anamorph Fusarium graminearum). Mycologia 2002, 94, 181–189. [Google Scholar] [CrossRef] [PubMed]
  30. Paulitz, T.C. Diurnal release of ascospores by Gibberella zeae in inoculated wheat plots. Plant Dis. 1996, 80, 674–678. [Google Scholar] [CrossRef]
  31. Inch, S.; Fernando, W.G.D.; Gilbert, J. Seasonal and daily variation in the airborne concentration of Gibberella zeae (Schw. Petch) spores in Manitoba. Can. J. Plant Pathol. 2005, 27, 357–363. [Google Scholar] [CrossRef]
  32. Drakopoulos, D.; Meca, G.; Torrijos, R.; Marty, A.; Kägi, A.; Jenny, E.; Forrer, H.-R.; Six, J.; Vogelgsang, S. Control of Fusarium graminearum in wheat with mustard-based botanicals: From in vitro to in planta. Front. Microbiol. 2020, 11, 1595. [Google Scholar] [CrossRef] [PubMed]
  33. Gimeno, A.; Kägi, A.; Drakopoulos, D.; Bänziger, I.; Lehmann, E.; Forrer, H.-R.; Keller, B.; Vogelgsang, S. From laboratory to the field: Biological control of Fusarium graminearum on infected maize crop residues. J. Appl. Microbiol. 2020, 129, 680–694. [Google Scholar] [CrossRef] [PubMed] [Green Version]
  34. Gimeno, A.; Leimgruber, M.; Kägi, A.; Jenny, E.; Vogelgsang, S. UV protection and shelf life of the biological control agent Clonostachys rosea against Fusarium graminearum. Biol. Control 2021, 158, 104600. [Google Scholar] [CrossRef]
Figure 1. Colonies of Fusarium species after ascospore deposition on 30 May 2007 in wheat grown after (pre-crop) sugar beet or maize at the research station of Agroscope in Zurich, collected with a Burkard high-throughput jet spore sampler or with a low-cost Agroscope spore trap containing Petri dishes with a Fusarium-selective medium and protected with aluminum dishes. Two nails fixed the Petri dish onto the wooden board.
Agronomy 11 00987 g001
Figure 2. Box plots of Fusarium graminearum colony-forming units (CFUs) sampled with Agroscope (AGS) spore traps at 20, 50 and 90 cm height in a wheat canopy from field C (adjacent to the research station of Agroscope in Zurich, Table 1) from 15 to 29 May 2008. * The labels I, II and III beside the outlier values indicate the replicates in the field. All these outliers originate from sampling on 22 May. Boxes marked with the same letter are not significantly different from each other according to an ANOVA on ranks and a Tukey test (p < 0.05).
Agronomy 11 00987 g002
Figure 3. (a) Fusarium graminearum colony-forming units (CFUs in bars) sampled in 2-hour periods with an AGS spore trap at 50 cm in the wheat field C (Table 1) from June 17 (14:00) until 19 June (14:00) 2008. The dotted line indicates the corresponding relative humidity (rh%) measured at 2 m and the grey areas highlight the periods with a relative humidity of 90–100%. (b) Relationship between the relative humidity and F. graminearum CFUs (black circles). The relationship is best described with the exponential function with an r2 = 0.750.
Agronomy 11 00987 g003
Figure 4. Box plots of Fusarium graminearum colony-forming units (CFU) sampled in field A (Table 1) from 1 April until 31 August with an AGS spore trap (grey) or a high-throughput jet spore sampler (chequered). Same letters below the boxes indicate that the CFU data from the 2 spore trap types were not significantly different according to a Kruskal-Wallis one-way analysis of variance on ranks followed by a Dunn’s test. For the figure, ln(x + 1) transformed CFU data were used.
Agronomy 11 00987 g004
Figure 5. Effect of maize residue treatments on deoxynivalenol (DON) content (bars) of directly sown wheat and on Fusarium graminearum colony-forming units (CFU) (rhombi) in field experiments at Ballmoos (canton Berne) in (a) 2007 and (b) 2008 (experiment 4 and experiment 5, Table 1). In 2007, the sampling was conducted only on 5 June. In 2008, sampling was performed on 2, 5, 9 and 12 June and the mean value of these days is depicted. In both cases, the number of CFUs is the mean of data from AGS spore traps at 50 cm and 90 cm height. Error bars represent the standard error of the mean. The maize residue treatments were an untreated control (con.) or treatments with a field shredder (fs), a field shredder combined with a rotary tiller (fs+rt), a forage harvester (fh), a forestry mulcher (fm) and in 2008, also a disk harrow (dh).
Agronomy 11 00987 g005
Figure 6. Effect of maize residue treatments on the deoxynivalenol (DON) content of directly sown (DS) wheat (bars) and Fusarium graminearum colony-forming units (CFU) (circles) in a field experiment in Ossingen (canton of Zurich) (experiment 6, Table 1) in 2009. The spores were sampled from June 8 to 10 with Agroscope (AGS) spore traps at 50 cm and 90 cm height and the mean CFUs are depicted. Error bars represent the standard error of the mean. The maize residue treatments were an untreated control (DS) or mulching with a hammer-type shredder (DS + K) or a shredder with Y-shaped blades (DS + Y). For treatments marked with a * (dark grey bars), a combine harvester with a header for shredding and chopping was used.
Agronomy 11 00987 g006
Table 1. Year and geographical locations of experimental sites, previous crop (pre-crop), tillage, experimental question and period of spore trapping with the Agroscope (AGS) and Burkard jet spore sampler (JSS). CFUs: colony-forming units, DON: deoxynivalenol, rh%: relative humidity of the air.
Field Experiment Number/Year and SitePlot CodeGeographic
Location
Wheat
Variety (FHB
Resistance) a
Previous Crop and
Tillage
Experimental QuestionPeriod of Spore
Trapping
1/2008
Agroscope *
AN 47° 25′ 44″ E 08° 30′ 51″Titlis (+)Pasture ploughComparison of cropping
systems and deposition of
F. graminearum CFUs in AGS traps at 20, 50 and 90 cm height. Correlation of CFU numbers and DON
19–29 May
1/2008
Agroscope *
BN 47° 25′ 47″ E 08° 30′ 57″Titlis (+)Maize plough
1/2008
Agroscope **
CN 47° 25′ 47″ E 08° 30′ 42″Zinal (∅)Maize
no-tillage
2/2008
Agroscope **
CDay and night spore
deposition (AGS trap, 2 h
interval) and relation with rh%
17 June (14:00) to 19 June (14:00)
3/2010
Agroscope *
AN 47° 25′ 44″ E 08° 30′ 51″Levis (-)Wheat
no-tillage
Comparison of CFUs and
ratios of Fusarium species sampled with the AGS and the JSS spore traps
Beginning of April–end of
August
4/2007
Ballmoos (BE)
N 47° 02′ 24″ E 07° 28′ 32″Ludwig (∅)Maize
no-tillage
Correlation of spore
deposition in the AGS spore trap and the DON content in wheat grains after maize
residue treatments in on-farm field trials
5 June
5/2008
Ballmoos (BE)
N 47° 02′ 41″ E 07° 28′ 03″Runal (∅)Maize
no-tillage
2, 5, 9 and 12 June
6/2009
Ossingen (ZH)
N 46° 57′ 04″ E 07° 26′ 19″Ludwig (∅)Maize
no-tillage
8, 9 and 10 June
Fields * at or ** directly adjacent to the research station of Agroscope at Zurich-Affoltern; a FHB (Fusarium head blight) resistance according to the Swiss list of recommended varieties (www.swissgranum.ch accessed on 14 May 2021): + = medium to good, ∅ = medium, − = medium to poor.
Table 2. Fusarium graminearum colony-forming units (FG CFU) sampled with Agroscope (AGS) spore traps in 3 plots at or adjacent to the research station of Agroscope in Zurich (A, B, C codes in Table 1) in May 2008 and their correlation with the deoxynivalenol (DON) content in wheat grains.
Date of SamplingHeight of Spore Trap Above GroundFG CFU on AGS Spore Traps 1 from PlotCorrelation 2 with DON
ABC
22 May 200820 cm5.311.0435.00.944 *
50 cm6.05.0359.70.958 **
90 cm8.37.0130.70.997 **
Average between
15 and 29 May 2008
20 cm1.61.864.40.949 **
50 cm1.71.249.50.952 **
90 cm1.71.420.20.991 **
DON (mg/kg) 1 in wheat grains0.0770.1322.072
% Wheat grains with FG 10.30.029
1 Average of 3 replicates, 2 Pearson product-moment correlation, * = p < 0.001, ** = p < 0.0001.
Table 3. Ratios of Fusarium species (%) based on deposited spores in the Agroscope (AGS) spore trap and the high-throughput jet spore sampler (JSS) in 3 periods in field A at Agroscope (Zurich) in 2010. The first period was before the application of artificial infection with Fusarium graminearum in a neighbouring plot, the second period from then until the wheat harvest and the third period was in August after harvest. F. spp. represents Fusarium isolates that could not be identified.
Period1 April–10 June11 June–30 July1 August–31 August
Type of Spore TrapAGSJSSAGSJSSAGSJSS
F. graminearum575855728596
F. avenaceum201816841
F. equiseti446520
F. cerealis1110210
F. oxysporum431200
F. tricinctum124100
F. poae002100
F. spp.12156972
Total nb 1 of colonies2301083′7722′37317′0848′734
Total nb 1 of isolates *214108588351328284
Correlation AGS/JSS **0.9970.9770.998
1 number, * Isolates for the determination of species (if more than 10 colonies grew on the Petri dish, 10 colonies were randomly selected for isolation, identification of species and to calculate the ratio of species), ** Pearson product-moment correlation, p < 0.0001, n = 8 (Fusarium species).
Table 4. Correlation between the number of Fusarium graminearum colony-forming units (CFU) sampled with AGS spore traps at 50 and 90 cm height and the deoxynivalenol (DON) content in wheat grains in field experiments in Ballmoos (canton of Berne) in 2007 and 2008 and in Ossingen (canton of Zurich) in 2009. In the field experiments, the effect of different maize residue treatments on DON was investigated. GS: growth stage of wheat [22].
YearDate of Sampling Correlation between CFU and DON (Coefficient)
GS50 cm90 cmMean of 50 and 90 cm
20075 June65–690.860 ***0.650 **0.808 ***
20082 June570.846 ***0.662 **0.864 ***
5 June590.610 **0.567 *0.679 **
9 June630.476 *0.592 **0.666 **
12 June690.514 *0.727 ***0.742 ***
Ø 2–9 June (3 d)57–630.856 ****0.761 ***0.890 ****
Ø 2–12 June (4 d)57–690.879 ****0.802 ****0.897 ****
2009Ø 8–10 June (3 d)69–710.449 ns0.669 ***0.606 **
Pearson product-moment correlation: ns = not significant, * = p < 0.05, ** = p < 0.01, *** = p < 0.001, **** = p < 0.0001.
Publisher’s Note: MDPI stays neutral with regard to jurisdictional claims in published maps and institutional affiliations.

