Abstract
Several studies have recommended the incorporation of environmental fluctuations in indoor experiments if closer-to-natural results in plant experiments are desired. Previous authors have suggested that if these fluctuations are not applied in synchrony, a stress effect could be present since plants have evolved to cope with synchronic environmental fluctuations. This study aimed to identify the effect of disparity in fluctuations of two important environmental variables, light quantity and temperature, on the growth of seven plant species from different functional plant types. A full-factorial combination of light and temperature under fixed or variable conditions was applied in phytotrons, and plant performance under these conditions was compared with a previous field trial. In all phytotron treatments, the average light and temperature conditions were the same as in the initial field trial. Productivity, leaf gas exchange, chlorophyll fluorescence, pigmentation, and other leaf traits were recorded in all species at the end of the experiments. Most plant trait responses were highly dependent on species and treatment, but some general trends were observed. Light fluctuations were mainly responsible for increases in specific leaf area (SLA) and chlorophyll a concentration, as well as for reductions in total dry weight and chlorophyll a/b ratio, independent if in combination with fluctuation or fixed temperatures. When fixed light conditions were combined with variable temperatures, the plants showed on average lower Fv/Fm values, Amax, and CO2 yield, while under variable light conditions and fixed temperatures, Fv/Fm increased compared with fully fixed or variable conditions. Although significant differences of plant traits between the field trial and all phytotron treatments were present (likely due to differences in other parameters that were not controlled in the phytotrons), our results still suggest that a synchronous variation of environmental factors lead to a more natural-like plant growth than if these factors are fixed or vary asynchronously.
1. Introduction
Due to the sessility of plants, they are constantly exposed to changes in environmental conditions, and in a plant species’ evolution, it needs to adapt to the site-specific variation in climate. In agronomic systems, strong deviations from the optimum climate for a crop can negatively affect yields, and since the beginning of farming, humans have selected for crops that can cope with climatic variations and adjusted farming practices to avoid extreme climatic conditions. By employing glasshouses and indoor growth facilities, individuals can grow plants under semi-controlled and controlled conditions, thereby increasing crop yield. Besides agriculture, indoor growth facilities are also used in plant sciences to grow plants independently of the outside climate, under precisely defined conditions. However, an absence of climatic variability under indoor conditions can induce unnatural plant growth, and in some cases, these simplified scenarios have led to errors in our predictions of plant–climate relations under natural conditions (e.g., [,]). Over the last years, some authors have proposed several factors that are mainly responsible for unnatural plant growth in indoor growth facilities, including light quantity, plant density, plant age, and the absence of climatic fluctuations [].
Almost three decades ago, it was suggested that with a sufficiently high level of climatic control, one would also be able to mimic the natural stochastic changes in environmental conditions in indoor growth facilities [], especially when using light emitting diodes (LED) lighting that enables a more precise temperature control in indoor plant growth facilities, compared with, e.g., high-pressure sodium lamps (HPS) []. Positives effects of more natural temperature fluctuations have been described before (e.g., []), but it took almost 30 years to see the LED light applications for plant production in practice. In the last couple of years, several authors have suggested that higher levels of light and temperature variation, within a non-stressful range for plants, could have a positive effect on plant development and lead to more natural-like plant growth and development [,]. With the advancement of technology, availability, and associated cost reduction in equipment (e.g., []), the possibility to apply more natural-like climatic fluctuations in indoor facilities has become reality and has been recommended by the scientific community [,,], but it is still not commonly applied in most plant biological research institutions, and much less in indoor farming. Previous authors have demonstrated that the application of fluctuating temperature and light has an important role in Arabidopsis [,,] by revealing plant characteristics that are not expressed under constant climatic conditions, while other factors such as light quality may play a secondary role within reasonable limits. In their experiments, the authors of [,] showed that fluctuations in temperature play a less important role at the metabolic level compared with light fluctuations. Reference [] confirmed that the application of fluctuating light is possible in indoor experiments without adding a higher complexity to their experiments. Reference [] demonstrates the importance of applying fluctuation climate conditions in genotype selection, wherein the more sensible accessions of Arabidopsis to light fluctuations were the fast-growing accessions under constant light.
With the higher prevalence of comprehensive climate control in indoor facilities, an increasing number of strategies to control the environmental variables have appeared over the last years. Reference [] reviewed different algorithms for climate control in indoor plant chambers to maximize cucumber yield production in greenhouses, emphasizing the importance of understanding and quantifying the effect of different environmental dynamics for plant growth. Our own previous studies demonstrated that the lack of these variations affect plant performance and lead to non-natural plant growth [,]. However, if climatic variations are applied in asynchrony in plant production facilities, there is a high probability of inducing an additional stress in these plants. This could be especially the case at high levels of light where lower temperatures could reduce the speed of the photosynthetic apparatus, increasing photo damage or vice versa where low levels of light at high temperatures may increase plant respiration unproportionally over photosynthesis. These conditions can occur in agriculture, e.g., in greenhouse plant production, when applying constantly high temperatures on heavily overcast days, or when applying fixed high levels of lights in cold days.
In this study, we aimed to experimentally identify and quantify how two different environmental variables (temperature/humidity and light) can affect plant growth, morphology, and photosynthesis depending on their dynamics and synchrony in indoor conditions compared with an outdoor control treatment. To arrive at more general conclusions, we investigated these effects in seven plant species from different functional groups. We hypothesized that plants would show more natural growth when fluctuating conditions were applied in synchrony, where plants should show stress indications, if only one of the two environmental parameters was fluctuating. We additionally hypothesized that light fluctuations would potentially have a stronger effect than temperature fluctuations in our non-extreme scenario, where minimum and maximum temperatures were within physiological non-stressful ranges for the tested species.
2. Materials and Methods
2.1. Plant Materials and Pre-Growing Conditions
A total of 7 plant species representing 3 different functional plant types (herbs, trees, grasses) were studied under different climatic treatments in LED-lit walk-in growth chambers (phytotrons). Herbs were represented by basil (Ocimum basilicum L. var Adriana), lettuce (Lactuca sativa L.), melissa (Melissa officinalis L.), and radish (Raphanus raphanistrum L. subsp. sativus); trees were represented by black alder (Alnus glutinosa L., provenance HG4, Zurich, Switzerland) and Scotch elm (Ulmus glabra HUDS, provenance Merenschwand, Aargau, Switzerland); and grasses were represented by winter wheat (Triticum aestivum L.). All herb seeds were purchased from Wys Samen und Pflanzen AG (Zuchwil, Switzerland); seeds for the 2 tree species were supplied by the Swiss federal institute for forest, snow, and landscape research (WSL, Birmensdorf, Switzerland); and seeds of winter wheat were obtained from Sativa Rheinau AG (Rheinau, Switzerland). In the following, the species are referred to by their scientific genus names only. All plants were germinated for 15–42 days at 190 to 240 µmols m−2 s−1 of photosynthetic photon flux density (PPFD: 400–700 nm) depending on the species and time of germination. More details on the germination conditions can be found in [,]. During the germination period, the seedlings were exposed to 25 °C/50% relative humidity during daytime and 15 °C/83% relative humidity during night, with 10 h day and 1-hour light/temperature/humidity ramping pre- and post-day.
At the beginning of the experiment, all plants were transplanted to round 2 L pots (13.5 cm diameter, Poppelmann, Lohne, Germany) with a single individual in each pot. An exception was Triticum with 10 plants per pot. The pots were filled with the same substrate as used in the germination trays (pH 5.8, N 250 mg L−1, 180 P2O5 mg L−1, K2O 480 mg L−1, Ökohum, Herrenhof, Switzerland), and 4 g of Osmocote slow-release fertilizer (Osmocote exact standard 3–4, Scotts, Marysville, OH, USA)—containing 16% total N, 9% P2O5, 12% K2O, and 2.5% MgO—was added to each plot. All plants were watered daily in the morning throughout the experiment.
2.2. Natural Field Conditions and Climatic Treatments in the Phytotrons
In order to compare plants from the phytotron experiments with naturally grown plants and identify any possible source of stress within the experiments, we initially grew all 7 species in a field trial for 35 days (4 August 2017–7 September 2017) at the botanical garden of the University of Basel, Switzerland, with n = 9 per species, which was a common field control treatment for several experiments. More information on this field trial is given in our previous studies [,]. During the field trial, the in situ climate and the natural sunlight spectrum was recorded (more details about environmental variables records can be found in []. A posteriori, the same set of plant species (n = 9 per species) were grown in phytotrons under 4 different air temperature × light treatments as combinations of 2 levels of complexity: fixed and variable conditions, giving the following treatments: fix light and fix temperature conditions; fix light and variable temperature conditions; variable light and fix temperature conditions; and, finally, variable light and variable temperature conditions (Figure 1). Air humidity was also modified together with air temperature, giving similar vapor-pressure deficits (VPD) across the applied temperature ranges. The fixed condition treatments corresponded to the average day and night values of temperature/humidity and light of the 35 days field trial, applied continuously over the duration of the experiment, while the variable conditions closely followed the recorded values from the field conditions with target temperature, humidity, and light parameters adjusted every 5 min (Figure 1). It is important to mention that although the control treatment has been previously used and published, the phytotron experiments here presented were conducted independently from our previous studies and represent a different dataset.
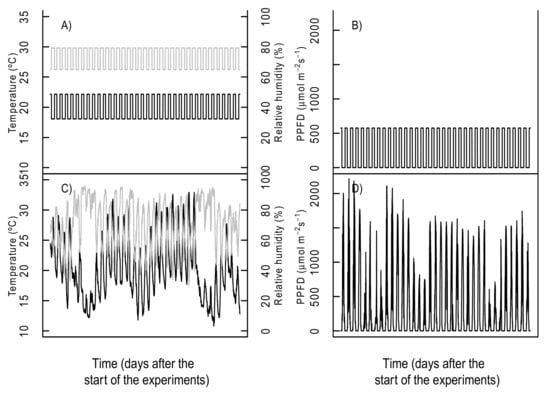
Figure 1.
Applied temperature and light conditions for the phytotron treatments. The upper panels correspond to the applied fixed temperature/humidity ((A) temperature = black line, relative air humidity = grey line) and photosynthetic active photon flux density (B). The lower panels correspond to the applied variable temperature/humidity ((C) temperature = black line, relative air humidity = grey line) and light (D), corresponding to the climatic records during the 35 days of the natural field trial and applied under the variable conditions.
The experiment was performed in 4 walk-in phytotrons (1.5 m × 2.5 m) with movable ceiling to adjust the distance between lamps and plants (prototypes, Enersign GmbH, Basel, Switzerland). In each treatment, the applied climatic conditions resulted in the same average values as in the field trial across the 35 days growth period. The airflow in the chambers was applied evenly from below, ensuring a uniform temperature and humidity distribution within the chambers. The used light spectra (provided by 18 blue (B), green (G), red (R), far-red (FR) LED panels per chamber, see [] for details) in the phytotrons (Figure S1) corresponded to a spectral composition that promotes close to natural plant growth as tested in []. The light intensity was regulated through changes in electric current and ceiling height keeping similar light spectra across most light intensities. For moments where very high light intensities in the variable light treatments were not possible, higher amounts of B and R light were applied to reach the target intensity, keeping the same B/R ratio. The R/FR ratio was kept at 1.8 for all treatments, and no additional UV light was applied.
2.3. Measured Parameters
The height of the 9 plants was measured after 35 days of exposure to the different treatments, as total height from the substrate to the apical meristem. In the case of flowering or plants without a clear stem, the extended leaf length was recorded as the height, except for Lactuca where height was not recorded. Two fully grown leaves from the top 3 leaves were taken from each plant to measure surface area (LI-3100, Licor, Licoln, NE, USA) and dry weight to calculate specific leaf area (SLA). For each plant, dry weight (DW) was measured separately for roots, stems, and leaves after 10 days drying at 80 °C in a drying oven (UF 260, Memmert, Schwabach, Germany). Due to the lack of a clearly identifiable stem, only total aboveground and root biomass was determined for Lactuca, Melissa, and Triticum. All reported organ masses and the below-to-above biomass ratio (root to shoot ratio, R/S) refer to dry biomasses.
The night before the end of the experiment, fast chlorophyll fluorescence was measured on 1 of the top 4 leaves of 4 randomly chosen plants of each species and treatment by using a continuous excitation fluorometer (Pocket PEA, Hansatech Instruments Ltd., Nordfolk, UK). The plants were dark-adapted for at least 20 min (night measurements), and Fv/Fm and Pi absolute [] were recorded. At the end of the experiment, 2 discs of 1.13 cm2 from 2 of the top 4 fully developed leaves were punched and collected in a 1.5 mL Eppendorf tube together with 4–6 glass beads of 0.1 mm diameter for later chlorophyll and carotenoid analyses in 4 different plants per species. The tubes were rapidly frozen in liquid nitrogen and then stored at −80 °C until analysis. On the day of pigment measurement, the tubes were agitated using a mixing device (Silamat S6, Ivoclar Vivadent, Schaan, Liechtenstein) during 2 rounds of 10 s to triturate the tissue. Then, 0.7 mL of acetone was added to each tube, agitated again for 10 s, and then centrifuged at 13,000 rpm at 4 °C for 2 min; 0.25 mL of the supernatant was taken and dissolved in 0.75 mL of acetone. The spectra of the extracts were measured using a spectrometer (Ultrospec 2100 pro, Biochrom, Holliston, MA, USA). Chlorophyll a and b, the chlorophyll a to b ratio, and total carotenoid concentrations were calculated from the spectrum using the absorption values at 470, 646, and 663 nm, respectively, as described by [] and expressed as milligram per gram of dry biomass using the average SLA of each species and treatment.
Six days before the end of the experiment, 3 light-response curves of net CO2 leaf-exchange were measured on 1 of the top 3 leaves of three randomly chosen plants per species using a portable photosynthesis system (LI-COR 6800, Licor, Lincoln, NE, USA). The light reaction curves were measured under the applied light spectra in the phytotrons (Figure S1) using a clear top leaf chamber. Due to the lower maximum irradiance in the phytotron at the same spectra, the light curves with growing light were measured only up to a maximum radiation of 700 µmol m−2 s−1 of PPFD (700, 480, 380, 200, 100, 60, 30, 20, 17, 15, and 0 µmol m−2 s−1 of PPFD) to maintain the spectral quality. All leaf CO2 exchange measurements were conducted at 400 µmol CO2, 60% relative air humidity, and 20 °C leaf temperature, with 60 to 120 s as the threshold for stability after each light change. Stability of readings was assumed when the different of the slopes between infra-red gas analyzers (IRGAs) was smaller than 0.5 and 1 µmol m−2 s−1 for CO2 and H2O, respectively. For each curve, 12 different light models were fitted, including a model for photo inhibition [,], and the model with the lowest sum of squares was selected in each case. From the selected model, we calculated 4 different parameters: maximum photosynthesis within the range of measured light (A700), quantum yield for CO2 fixation (α) as the slope of the curve between 0 and 100 µmol m−2 s−1 of PPFD, dark respiration (DR), and the light compensation point (CP).
2.4. Statistical Analysis
For each individual species, 9 pots were used as replicates. To avoid border effects, we randomly distributed all plants within each phytotron on 2 tables, and the tables were rotated by 90° every day. In the field trail, the plants were placed on the same table plates with the identical spacing as in the phytotron experiments.
To evaluate the effect of the treatments, we performed a two-way analysis of variance (ANOVA) for all measured parameters, considering the light and temperature treatments as fixed factors, with 2 different levels, and the species of each treatment as random effect, without considering the field treatment (Table 1). All data were checked for normal distribution, independence, and homogeneity of the variance.

Table 1.
p-values of the two-way ANOVA excluding the field trial and considering different treatments as a fixed factor and species as random effect. Bold numbers corresponded to significant values (α = 0.05).
To enable a direct visible and statistical comparison of the treatment effects across species in relation to the field trial, we normalized each measured trait relative to its mean value on the field trial for each species (the raw trait values per species and treatments are available in Table S1). The normalized dataset was used to perform a one-way ANOVA through considering each combination of the different treatment levels as fixed factor and species as random factor (Table S2), where the significance of the random factor was evaluated using a restricted likelihood ratio test. A Tukey pairwise multiple comparison test was used for post hoc analysis. All analyses were performed using R (version 3.6.2, []) and the packages plyr and reshape2 for data processing, lm4, car, RLRsim, and emmeans for data analysis, and multicomp and vegan for statistically significant representations.
3. Results
3.1. Plant Morphology and Biomass Distribution
On average across all species, plant height was significantly lower in all phytotron treatments compared with the field grown plants (Figure 2A). This was especially the case for plants grown under fixed light and fixed temperature conditions, with about 26% lower plant heights across species compared with the outdoor treatment. No interaction between the temperature and light treatment was found for the indoor treatments, where only the light treatments had a significant effect on height (Table 1). Almost all species followed the same trend of lower height under fixed light conditions, independent of the temperature regime. The only exception was Ocimum, which had taller plants under fixed light conditions, even taller than in the outdoor control treatment.
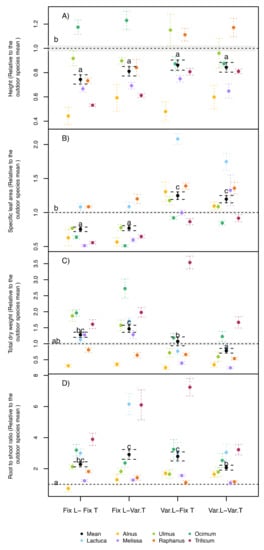
Figure 2.
(A) Plant height, (B) specific leaf area, (C) total plant dry weight, and (D) root to shoot ratio of seven different species normalized to an outdoor control treatment under four treatment combinations (fixed, Fix., or variable, Var.) of two environmental factors (light, L, and air temperature, T). Error bars correspond to the standard error. N = 9 for each species, where N for the average = 63. Different letters indicate significant differences (p < 0.05, by Tukey post hoc tests) among treatments (including the outdoor trials) using species as random effect.
Averaged across all species, higher SLA values (thinner leaves) were observed under variable light compared with the field control and the fixed light conditions, while variable light led to significantly higher SLA, although this was not the case for all species (Figure 2B). Interestingly, the absence or presence of dynamic temperature variations did not have an additional effect across species under fixed or variable light conditions (Table 1).
The total dry biomass showed an opposite trend to plant height, where on average across species, only the treatment with fixed light and variable temperature had significant higher values than the field control (+28%, Figure 2C). All other treatments did not differ from the field control, and when the field-grown plants were not included, an interaction between the light and temperature treatments was found (Table 1). The response was similar across species, except for Triticum, which showed exceptionally high biomass at variable light and fixed temperatures (Figure 2C). A comparison of investment into shoots and roots revealed higher R/S ratios compared to the field control plants across all species (Figure 2D). The slightly higher R/S values at fixed light/variable temperature and variable light/fixed temperature conditions were largely driven by Raphanus and Triticum in the former and Triticum in the latter case. These results were confirmed by the interaction between the light and temperature treatments within the statistical test among the phytotron treatments (Table 1).
3.2. Chlorophyll and Photosynthetic Parameters
Exceptionally strong reactions were found in the leaf chlorophyll content among treatments. Averaged across all species and independent of temperature dynamics, the variable light treatments induced 45% higher chlorophyll (Chl) a leaf concentrations compared to the field control plants, while both treatments with fixed light led to significantly reduced Chl a concentrations (−37%) than in the field (Figure 3A) The ANOVA revealed a significant treatment interaction (Table 1), where additionally all species reacted similar to the different treatments (Figure 3A).
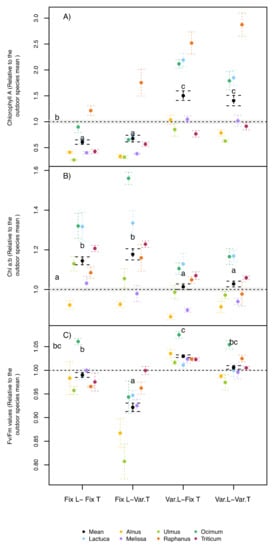
Figure 3.
(A) Chlorophyll a leaf concentrations, (B) leaf chlorophyll a to b ratios, and (C) Fv/Fm values of seven different species normalized to an outdoor control treatment under four treatment combinations (fixed, Fix., or variable, Var.) of two environmental factors (light, L, and air temperature and humidity, T). Error bars correspond to the standard error. N = 3 for each species, where N for the average = 21. Different letters indicate significant differences (p < 0.05, by Tukey post hoc tests) among treatments (including the outdoor trials) using species as random effect.
While the treatments had strong effects on Chl a, they had a similar but smaller effect on the leaf Chl b concentrations (data not shown). As a net result, the Chl a/b ratio showed the opposite trend to Chl a concentrations (Figure 3B). Independent of the temperature dynamics, the fixed light treatments produced plants with significantly higher Chl a/b ratios (+15% on average) than both variable light treatments and the field trial. Interestingly, similar Chl a/b levels were reached between the field control and the variable light treatments in the phytotrons (Figure 3B), where only the light treatments had a significant effect between the indoor treatments.
As a relative indicator for plant stress, Fv/Fm values were generally similar across the different treatments and species with a maximum variation of around 10%, indicating no extensive stress in response to all treatments. However, when fixed light was combined with variable temperatures, Fv/Fm values decreased significantly across all species compared to the field trial (−8%, Figure 3C), with significantly stronger declines in both tree species (Alnus and Ulmus). An interactive effect between the light and temperature treatments on Fv/Fm values was found for the indoor treatments (Table 1).
All the measured leaf photosynthetic parameters revealed interactive effects between the temperature and light treatments among the phytotron experiments (Table 1). In contrast to the other investigated plant traits, the average values for Amax were not significantly different among all indoor treatments when the field trial was included (Figure 4A), but all phytotron treatments had significant higher maximum photosynthesis values in comparison with the field-grown plants (+64%). Although all species showed similar trends, there were large differences in the size of the Amax reactions between species. Up to 2.5 times higher values than in the field control were reached by phytotron-grown Ocimum and Lactuca, while other species, such as Alnus and Melissa, deviated significantly less from the outdoor treatment (Figure 4A). Interestingly, there was a tendency for lower Amax values under fixed light and variable temperature conditions, corresponding to the lower Fv/Fm values in this treatment (Figure 4C). The light compensation point of photosynthesis was not significantly different from the field control in any phytotron treatment, but it was significantly higher for the fixed light/variable temperature treatment compared to both treatments with variable light conditions (Figure 4B). This was especially the case for Melissa and Raphanus. Finally, when analyzed across all species, the CO2 yield of all indoor treatments was on average significantly higher compared with the field-grown plants (Figure 4C), with the fixed light/variable temperature treatment showing significantly lower values than the other phytotron treatments, again correlating to the lower Amax and Fv/Fm values in this treatment. Almost every species followed this trend, except for Triticum, which showed generally much higher CO2 yields in all phytotron treatments than in the field trial (Figure 4C).
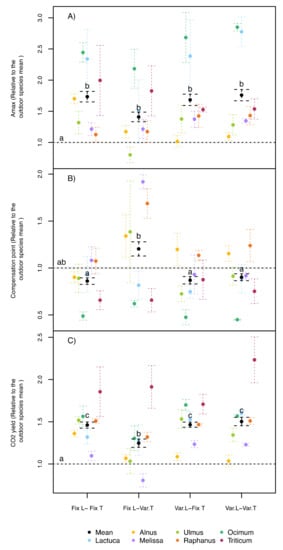
Figure 4.
(A) Maximum photosynthesis (Amax), (B) light compensation point of photosynthesis (CP), and (C) photosynthetic CO2 yield of seven different species normalized to an outdoor control treatment under four treatment combinations (fixed, Fix., or variable, Var.) of two environmental factors (light, L, and air temperature and humidity, T). Amax and CP were measured under a standard light source (70%R (red) and 30%B (blue)). Error bars correspond to the standard error. N = 3 for each species, where N for the average = 21. Different letters indicate significant differences (p < 0.05, by Tukey post hoc tests) among treatments (including the outdoor trials) using species as random effect.
4. Discussion
A clear effect of asyncronic variations in the environmental variables on plants could be revealed with our experiments at the chemical and photosynthetic level, but also at the level of plant growth and productivity. In our experimental setup, these effects were especially strong when constant light conditions were combined with fluctuating temperatures.
Several studies demonstrated the effects of light and temperature fluctuations on plant traits, where strong effects were generally attributed to daily differences (DIFs) between day and night temperatures. For example, Reference [] reviewed the topic and found that a positive DIF, i.e., a higher temperature during the day than during the night, applied either as a continuous difference between the day and night temperature, or as a single short period of temperature drop over the night, can stimulate cell elongation due to changes in the gibberellin (GA) concentrations that promotes shoot elongation, leaf orientation, chlorophyll content, and lateral branching among others. Reference [] demonstrated in tomato that not only plant growth can be affected, but also the net photosynthesis rate, stomatal conductance, Fv/Fm, quantum yield of PSII chemistry (ΦPSII), and photochemical quenching (qp), which all increased under positive DIF, while Chl a/b ratio and non-photochemical quenching (NPQ) were reduced. However, despite these significant influences of diurnal temperature changes on plant development, most greenhouse experiments are currently still keeping temperature relative constant with small variations between day and night, either for practical reasons or technical limitations.
Interestingly, Reference [] incorporated temperature fluctuations in a controlled greenhouse environment, concluding that no further effects were found at the metabolic nor at the genetic levels. This is in line with the present study, wherein we found relatively minor effects of variable temperature in comparison to variable light conditions. This might be explained by the fact that in [], as well as in the current study, the temperature amplitude of the variable temperature treatments was kept within a range that was not growth-limiting to the plants (Figure 1) and that may have additionally avoided the interactive effect between irradiance and temperature DIF, which was previously reported by [].
In contrast to temperature, the possible influence of light fluctuations during the day has gained stronger attention only over the last years (e.g., [,,,,]). These studies suggest that across species, light fluctuations are generally considered as a source of stress at either leaf or the whole plant level, mainly due to the asynchronies between different plant processes during photosynthesis (e.g., a faster reaction of the light apparatus compared with either the rubisco activity, or the slow response of stomata to changing light environments). These effects have previously been quantified also at the metabolic level []. Although light fluctuations are basically a stress, fluctuating light within physiological unproblematic ranges can also strengthen a plant, make it more resistant and lead to more natural plant growth. Hence, recently, several publications recommended more natural climatic conditions in indoor experiments that incorporate these fluctuations in order to gain more natural-like plant growth [,,,].
A clear effect of light fluctuations on SLA was reported by [], where light fluctuations produced thinner leaves compared with a constant light treatment (around 25% thinner leaves, on average, independent of the used level of light). In the same study, Reference [] further reported a decrease of the Chl a/b ratio under fluctuating light (around −12% higher under variable light). With respect to temperature fluctuation effects on chlorophyll, Reference [] reported 23% higher Chl a and a 9% reduction of Chl a/b under +16 °C temperature DIF compared with 0 °C temperature DIF. Our results, together with these previous studies, suggest that the effect of temperature and light variation is not additive, and interactions must exist at the leaf level. This is most obvious at the photosynthetic level, where higher net photosynthesis and photosynthetic efficiencies associated with lower Qp and NPQ have been found under higher temperature DIF []. However, this was not the case in the current study, wherein less efficient and lower photosynthetic levels were recorded under the combination of variable temperature and fixed light. This is in line with results previously summarized by [], who argued that lower photosynthesis under these conditions can be explained as a consequence of the formation of reactive oxygen species. In their presence, the lifetime of the excited state of chlorophyll a is reduced, therefore reducing the potential of the electron transport with final negative consequences for photosynthesis.
Reference [] suggested that an asynchronous application of light and temperature variations has a negative effect on plants, which in our case was especially visible under the fixed light/variable temperature combination. Under this condition, Amax and Fv/Fm in particular decreased, which might indicate a slight photo-stress when moderately high light conditions coincide with lower temperatures. In contrast to these negative effects on the photosynthesis, no reduction was observed for the total biomass production of the plants under fixed light/variable temperature conditions. However, if biomass allocation was considered, the R/S ratio was increased under this specific treatment, which might also be a signal of stress.
5. Conclusions
In a previous study [], we demonstrated how environmental fluctuations can help to reach more natural growth in indoor experiments. In the present study, we empathized the significance of applying environmental fluctuations in indoor plant facilities in synchrony. Our experiment demonstrated that not only processes at the molecular level are affected by asynchronous climate fluctuations (e.g., []), but that this effect also translates to morphological traits at the level of the whole plant. Within a non-growth-limiting range of light and temperature/humidity conditions, as applied in the current study, light fluctuations had a bigger effect on most of the measured plant traits compared with temperature fluctuations. Subsequently, plant stress was observed, especially under fix light conditions in combination with variable temperatures. These results suggest that in plant productions and experiments, one should avoid applying constant levels of light under fluctuating temperature environments (i.e., greenhouses), where in the opposite cases, this could be harmful either to plant production or to research.
Supplementary Materials
The following supplementary information is available online at https://www.mdpi.com/article/10.3390/agronomy11040755/s1: Figure S1: Spectrum examples of the applied light. Table S1: Absolute values of all measured traits for each species and treatment. Table S2: Statistical results considering the different treatments as a fix factor and species as random effect.
Author Contributions
Conceptualization, C.C., D.B. and G.H.; methodology, C.C., D.B. and G.H.; validation, C.C.; formal analysis, C.C.; investigation, C.C.; resources, D.B. and G.H.; data curation, C.C.; writing—original draft preparation, C.C.; writing—review and editing, D.B. and G.H.; visualization, C.C.; supervision, G.H.; project administration, G.H.; funding acquisition, D.B. and G.H. All authors have read and agreed to the published version of the manuscript.
Funding
The presented work was supported by the PlantHUB—European Industrial Doctorate funded by the H2020 PROGRAMME Marie Curie Actions–People, Initial Training Networks (H2020-MSCA-ITN-2016). The program is managed by the Zurich–Basel Plant Science Center.
Institutional Review Board Statement
Not applicable.
Informed Consent Statement
Not applicable.
Acknowledgments
We thank Georges Grun and the gardeners at the botanical garden of the University of Basel for their technical support for the phytotron experiments and climate measurements.
Conflicts of Interest
The authors declare no conflict of interest. The funders had no role in the design of the study; in the collection, analyses, or interpretation of data; in the writing of the manuscript; or in the decision to publish the results.
References
- Junker, A.; Muraya, M.; Weigelt-Fischer, K.; Arana-Ceballos, F.; Klukas, C.; Melchinger, A.; Meyer, R.; Riewe, D.; Altmann, T. Optimizing experimental procedures for quantitative evaluation of crop plant performance in high throughput phenotyping systems. Front. Plant Sci. 2015, 5, 770. [Google Scholar] [CrossRef] [PubMed]
- Hohmann, M.; Stahl, A.; Rudloff, J.; Wittkop, B.; Showdon, R. Not a load of rubbish: Simulated field trials in large-scale containers. Plant Cell Environ. 2016, 39, 2064–2073. [Google Scholar] [CrossRef] [PubMed]
- Poorter, H.; Fiorani, F.; Pieruschka, R.; Wojciechowski, T.; van der Putten, W.; Kleyer, M.; Schurr, U.; Postma, J. Pampered inside, pestered outside? Differences and similarities between plant growing in controlled conditions and in the field. New Phytol. 2016, 213, 383–855. [Google Scholar] [CrossRef] [PubMed]
- Barta, D.; Tibbits, T.; Bula, R.; Morrow, R. Evaluation of light emitting diode characteristics for a space-based plant irradiation source. Adv. Space Res. 1992, 12, 141–149. [Google Scholar] [CrossRef]
- Nelson, J.; Bugbee, B. Economic analysis of greenhouses lighting: Light emitting diodes vs high intensity discharge fixtures. PLoS ONE 2014, 9, e99010. [Google Scholar] [CrossRef] [PubMed]
- Myster, J.; Moe, R. Effect of diurnal temperature alternations on plants morphology in some greenhouse crops—A mini review. Sci. Hortic. 1995, 62, 205–215. [Google Scholar] [CrossRef]
- Annunziata, M.G.; Apelt, F.; Carillo, P.; Krause, U.; Feil, R.; Koehl, K.; Lunn, J.; Slitt, M. Response of Arabidopsis primary metabolism and circadian clock to low night temperature in a natural light environment. J. Exp. Bot. 2018, 69, 4881–4895. [Google Scholar] [CrossRef] [PubMed]
- Kaiser, E.; Walther, D.; Armbruster, U. Growth under fluctuating light reveals large trait variation in a panel of Arabidopsis accessions. Plants 2020, 9, 316. [Google Scholar] [CrossRef] [PubMed]
- Mitchell, C.; Sheibani, F. Chapter 10: LED advancements for plant-factory artificial lighting. In Plant Factory, 2nd ed.; Kozai, T., Niu, G., Takagaki, M., Eds.; Elsevier: Amsterdam, The Netherlands, 2020. [Google Scholar]
- Matsubara, S. Growing plants in fluctuating environments: Why bother? J. Exp. Bot. 2018, 69, 4651–4654. [Google Scholar] [CrossRef]
- Chiang, C.; Bånkestad, D.; Hoch, G. Reaching natural growth: The significance of light and temperature fluctuations in plant performance in indoor growth facilities. Plants 2020, 9, 1312. [Google Scholar] [CrossRef] [PubMed]
- Annunziata, M.; Alpelt, F.; Carillo, P.; Krause, U.; Feil, R.; Mengin, V.; Lauxmann, M.; Nikoloski, Z.; Stitt, M.; Lunn, J. Getting back to nature: A reality check for experiments in controlled environments. J. Exp. Bot. 2017, 68, 4463–4477. [Google Scholar] [CrossRef] [PubMed]
- Vialet-Chabrand, S.; Matthews, J.; Simkin, A.; Raines, C.; Lawson, T. Importance of fluctuations in light on plant photosynthetic acclimation. Plant Physiol. 2017, 173, 2163–2179. [Google Scholar] [CrossRef] [PubMed]
- Hemming, S.; de Zwart, F.; Eilings, A.; Righini, I.; Petropoulou, A. Remote control of greenhouse vegetable production with artificial intelligence—Greenhouse climate, irrigation, and crop production. Sensors 2019, 19, 1807. [Google Scholar] [CrossRef] [PubMed]
- Chiang, C.; Bånkestad, D.; Hoch, G. Reaching natural growth: Light quality effects on plant performance in indoor growth facilities. Plants 2020, 9, 1273. [Google Scholar] [CrossRef] [PubMed]
- Kalaji, H.; Schansker, G.; Ladle, R.; Goltsev, V.; Bosa, K.; Allakhverdiev, S.; Brestic, M.; Bussotti, F.; Calatayud, A.; Dąbrowski, P.; et al. Frequently asked questions about in vivo chlorophyll fluorescence: Practical issues. Photosynth. Res. 2014, 122, 121–158. [Google Scholar] [CrossRef] [PubMed]
- Wellburn, A. The spectral determination of chlorophylls a and b, as well as total carotenoids, using various solvents with spectrophotometers of different resolution. J. Plant Physiol. 1994, 144, 307–313. [Google Scholar] [CrossRef]
- Lobo, F.; Barros, M.; Dalmagro, H.; Dalmolin, A.; Pereira, W.; Souza, E.; Vourlitis, G.; Rodriguez, C. Fitting net photosynthetic light-response curves with Microsoft Excel- a critical look at the models. Photosynthetica 2013, 51, 445–456. [Google Scholar] [CrossRef]
- Eilers, P.; Peeters, J. A model for the relationship between light intensity and the rate of photosynthesis in phytoplankton. Ecol. Model. 1988, 42, 199–215. [Google Scholar] [CrossRef]
- R; Foundation for Statistical Computing: Vienna, Austria, 2020.
- Yuan, X.K. Effect of day/night temperature difference on chlorophyll content, photosynthesis and fluorescence parameter of tomato at fruit stage. Photosynthetica 2016, 54, 475–477. [Google Scholar] [CrossRef]
- Kaiser, E.; Morales, A.; Harbison, J. Fluctuating light takes crops photosynthesis on a rollercoaster ride. Plant Physiol. 2018, 176, 977–989. [Google Scholar] [CrossRef] [PubMed]
Publisher’s Note: MDPI stays neutral with regard to jurisdictional claims in published maps and institutional affiliations. |
© 2021 by the authors. Licensee MDPI, Basel, Switzerland. This article is an open access article distributed under the terms and conditions of the Creative Commons Attribution (CC BY) license (https://creativecommons.org/licenses/by/4.0/).