Article

Agro-Environmental Sustainability of Anaerobic Digestate Fractions in Intensive Cropping Systems: Insights Regarding the Nitrogen Use Efficiency and Crop Performance

1
Department of Agronomy, Food, Natural Resources, Animals and Environment, University of Padova, 35020 Legnaro, Italy
2
ING.AM. S.r.l., 30035 Mirano, Italy
3
Unità Organizzativa Qualità del Suolo, Agenzia Regionale per la Protezione Ambientale del Veneto (ARPAV), 31100 Treviso, Italy
4
Società Estense Servizi Ambientali, 35042 Este, Italy
5
Confagricoltura Veneto, 30174 Venezia, Italy
*
Author to whom correspondence should be addressed.
Agronomy 2021, 11(4), 745; https://doi.org/10.3390/agronomy11040745
Submission received: 2 April 2021 / Revised: 6 April 2021 / Accepted: 7 April 2021 / Published: 12 April 2021
(This article belongs to the Special Issue New Methods for Plant Nutrition Management)

Abstract

:
Digestate is an anaerobic digestion by-product rich in inorganic-nitrogen (N) that can be used as an organic fertilizer. Digestate agronomic efficiency and its impact on the environment have not yet been studied in detail, therefore this study tries to fill this gap. The agro-environmental sustainability of digestate fractions was evaluated in a holistic way by comparing the best management practices available in the Veneto Region agroecosystem. A farm experiment involving mineral fertilizer and both liquid and solid digestate fractions was established involving silage winter wheat and silage maize as main crops. Agro-environmental sustainability was investigated coupling crop performance analysis (e.g., yield, N uptake and N use efficiency (NUE)) with a novel proposed agro-environmental sustainability index (AESI) (i.e., product of the dry yield and NUE). The results showed that the liquid digestate fraction gave agronomic performances comparable to mineral fertilizers and a satisfying AESI while solid digestate showed lower performances. In conclusion, liquid digestate fractions might be an effective substitute for mineral fertilizers in the Veneto region agroecosystem reaching encouraging levels of agro-environmental sustainability. On the contrary, longer-term experiments are requested to evaluate solid digestate fraction sustainability.

1. Introduction

During the last decade, biogas production has steadily increased in the European Union (EU), encouraged by renewable energy policies [1,2]. Indeed, EU biogas reached 18 billion m3 of methane in 2015, produced by 18,202 plants, mainly concentrated in Germany, Italy, and the Czech Republic [3,4]. Currently, the EU is the world leader in biogas and biogas electricity production and accounts for half of the global output [4].
A biogas plant, also called an anaerobic digester, transforms organic materials into two different products—i.e., biogas and anaerobic digestate (AD)—through the anaerobic digestion process. The AD is an anaerobic digestion by-product that exhibits organic fertilizer characteristics, such as relatively stable organic matter and a high level of soluble inorganic nitrogen [5], which makes it suitable for agronomic purposes [6].
The use of AD as fertilizer is often hindered by economic (e.g., high transport and storage costs), practical (e.g., large volumes to managed), and environmental issues (e.g., nitrogen and phosphorus fertilization limits in high nutrient areas) [7]. Therefore, AD is generally subjected to further processes of nutrient concentration and recovery to favor its storage and transport [8]. Among others, solid–liquid separation is one of the most commonly used technologies [9]. The solid fraction is mainly composed of organic compounds and phosphorous, while the liquid fraction contains the larger part of N and K [10].
AD is characterized by a high biochemical variability, which is due to (i) the source materials’ heterogeneity and (ii) the residence time inside the digester [11]. Indeed, a lower residence time may lead to incomplete AD stabilization with consequent odor emissions, toxic organic compound formation (organic acids), pathogens, and the presence of phytotoxic compounds that may inhibit crop growth [12,13]. Thereby, AD agronomic use is strongly regulated by the EU and, before its on-field application, should comply with the end-product requirements of European legislation [14] (e.g., the absence of Salmonella spp and Clostridium perfringens and low heavy metal contents).
In Italy, biogas plants are fed with both agricultural and animal waste and energy crops. More than half of the national production takes place in Lombardy, Veneto, and Emilia Romagna, all regions located in the Po valley—a vast plain naturally suited to intensive agriculture and livestock farming [2,15]. In this area, there is an urgent need for managing a great amount of animal waste and, at the same time, maintaining crop productivity and protecting water bodies [16].
As in the other EU countries, the use of AD as an alternative to mineral fertilizers may play a big role in reducing the fossil fuel dependency that is a key factor in reaching sustainable development goals. Generally, the best AD performances in crop production have been found in cereals (e.g., wheat, maize, barley, and triticale) and root crops (e.g., sugar beet and potatoes), which attained similar yields to mineral fertilizer [2,17,18,19,20]. Additionally, Walsh et al. [21] reported improved yields in forage crops suggesting the replacement of mineral fertilizer with digestate in grass pastures [21]. On the contrary, contrasting results were observed for horticultural crops, like watermelon and cauliflower [22].
The AD application technique is a key factor in reducing the ammonia (NH3) volatilization and, in turn, retaining the total nitrogen (N) amount [23]. The digestate application should be synchronized with the crop demand to increase the N efficiency and prevent possible release into the environment [20]. Despite no common European guidelines being available for AD spreading, the Nitrate Directive (91/676/CEE) may suggest some management practices, including AD liquid fraction injection into the soil or AD solid fraction application promptly followed by soil tillage.
The determination of AD nitrogen use efficiency (NUE) is pivotal in promoting its sustainable use as a surrogate for mineral fertilizers among farmers; however, currently, only a few attempts exist in the literature. Baral et al. [24] showed that raw AD produced from livestock slurry improved the NUE with respect to untreated pig and cattle slurries. Sigurnjak et al. [25] found fertilizer use efficiency comparable to conventional mineral fertilizers for both solid and liquid digestate fractions in a three-year field experiment.
With the general aim of evaluating the agro-environmental sustainability of cropping systems that make use of AD as fertilizer, our study aims to (i) identify and test a practical protocol for solid and liquid AD fractions applications, (ii) determine the optimal AD rate according to a novel agro-environmental sustainability index, and (iii) evaluate the AD fraction NUE results in a field experiment in north-eastern Italy. We tested the hypotheses that (i) AD cropping systems can reach performances comparable to those of mineral fertilizers and might replace traditional mineral fertilizers in intensive cropping systems and (ii) the agro-environmental sustainability index can be used to predict cropping system performances and agro-environmental sustainability and, in turn, determine the optimal nitrogen rate.

2. Materials and Methods

A field experiment was conducted in 2018–2019 at two farms in the Veneto region, north-eastern Italy. Farm 1 (F1) is located in Mira (Venice) (45°24.253′ N; 12°9.982′ E) on a lagoon plain, which formerly originated as transition area between the alluvial plain and the sea. The area developed as marshland that was later reclaimed. The site lies below sea level (−1 m a.s.l.), and agricultural activity is made possible by controlling the depth of the water table by subsurface drainage systems. Difficult drainage conditions, which tend to decrease the organic matter mineralization rate, together with former marshland vegetation, lead to soil organic carbon (SOC) content accumulation in the surface horizon (1.2%–2%). Soils are also highly decarbonated due to the ancient age of the alluvial surface underneath the surface horizon with texture classes ranging between silty clay and silty clay loam [26]. These are classified as Endogleyic Vertic Calcisols (Epiclayic and Endosiltic) or Calcic Gleysols (Calcaric, Hypereutric, and Orthosiltic) [27].
Farm 2 (F2) is located in Salizzole (Verona) (45°14.870′ N; 11°4.523′ E) on an alluvial plain originating from relatively coarse Adige river deposits, which originate soil types with sandy loam to loam surface texture classes. Soils are classified as Cutanic Luvisols (Hypereutric) with a reddish colored argic horizon due to illuvial clay accumulation or Haplic Cambisols (Hypereutric) [27] (Table 1). The organic carbon content is low (0.7%–0.9%) and soils are mostly well drained, due to coarse particle size presence [26]. The climate (2000–2019) is sub-humid, with an annual rainfall of 926 mm in F1 and 832 mm in F2. At both sites, rainfall is highest in the autumn and lowest in the winter, while the temperature rises from January (minimum average −0.5 °C and −0.4 °C, respectively) to July (maximum average: 29.7 °C and 31.1 °C, respectively). Yearly average temperatures are 13.6 °C (F1) and 14.1 °C (F2).

2.1. Experimental Design

We tested mineral (MF), liquid digestate (LD), liquid digestate with a nitrification inhibitor (N-LockTM, Corteva Agriscience, Wilmington, DE, USA) (LD+), and solid digestate (SD) fertilization treatments on continuous silage wheat (Triticum aestivum L.) and silage maize (Zea mays L.) cropping systems. The treatments were allocated in 48 fields according to a randomized complete block design with three replicates (four treatments × two crops × two farms × three replicates). The experimental fields were rectangular (approximately 450 × 30 m) with an average area of 1.3 ha, totaling 48 ha.
Winter wheat was sown in November 2018 and harvested in June 2019, while maize was sown in June 2019 and harvested in September 2019 (Table 2). The agronomic protocol differed between treatments and employed the best available techniques for each fertilizer type—i.e., subsoiling followed by subsurface digestate injection and harrowing in LD and LD+, amendment application and incorporation through 20 cm-ploughing followed by harrowing in SD, and subsoiling followed by harrowing in MF.
Crop fertilization consisted of one single application before tillage for the digestate (LD, LD+, and SD treatments) and two side dressing applications for the MF (Table 2), the latter using nitrate (40% application rate) and urea (60% application rate) in winter wheat and only urea in maize (50% application rate each). Irrigation was performed according to the crop water needs using a lateral movement system at F1 and emergency irrigation with a gun machine at F2.
The digestate used in this experiment was collected from two biogas plants located in the proximity of the experimental fields, both fed with energy crops (e.g., silage maize and silage winter wheat) and animal wastes (e.g., poultry manure and swine slurry in F1, cattle and swine slurry in F2). The biogas plants have a nominal power of 999 KWh; the reactors use thermophilic bacteria and work at a temperature between 52 and 56 °C with a residence time of 60 days. The obtained AD was then treated with a solid–liquid separation process to obtain solid (SD) and liquid (LD) fractions. The digestate main characteristics are reported in Table 3.

2.2. Crop Biomass and Soil Samplings

During 2018–2019, one m2 (wheat) and two m2 (maize) sample areas per replicate were identified to measure vegetation traits and collect soil samples. Measurements were carried out on three sampling dates per season, at tillering (112 days after seeding—DAS), flag leaf (133 days DAS) and, maturity (211 DAS) for wheat and at emergence (27 DAS), flowering (58 DAS), and maturity (100 DAS) for maize. An active GreenSeeker spectrometer (Ntech Industries Inc., Ukiah, CA, USA) was used to measure normalized difference vegetation index (NDVI) within the range of 660–770 nm, while the leaf area index (LAI) was determined through a ceptometer (Decagon Devices Inc., Pullman, WA, USA). The chlorophyll content was measured as the average of ten lateral leaves measurement inside the sampling area through a leaf clip sensor (Force A, Paris, France). The volumetric water content of soil was measured using a FieldScout TDR 350 (Spectrum Technologies Inc., Aurora, IL, USA) considering a 20 cm soil depth. Finally, the plant height was obtained by measuring the distance between the root–stem-transition and the apical bud using a tape measure.
The fresh crop biomass was destructively harvested and oven-dried at 65 °C for 48 h, to determine the total above-ground dry biomass and total N concentration using the Kjeldahl method [28]. Finally, the N uptake was calculated by multiplying the N concentration by the total above-ground dry biomass. Soil samples were taken at a 0–20 cm-profile using an auger, stored at −18 °C and analyzed for the total Kjeldahl nitrogen (TKN) using the Kjeldahl method [28] and for NH4 and NO3 using method XIV of the Italian DM 13 September 1999 [29].

2.3. Modelling and Fertilizers Application Rate

The optimal fertilizer application rate was identified by maximizing a decisional index based on the output of the Denitrification and Decomposition (DNDC) model [30]. DNDC is a biogeochemical model designed for the simulation of crop growth and carbon and nitrogen dynamics in an agroecosystem [31]. DNDC has been successfully used worldwide to predict biogeochemical cycles, including the Veneto low plain [32,33]. Simulations were carried out over a 9-year period (2010–2018) for estimating the effects of four management systems (LD, LD+, MD, and SD) on crop performances and N use efficiency.
The input parameters were daily weather data (e.g., temperature and rainfall), soil properties (e.g., soil density, texture, and initial SOC), land use (e.g., crop type and rotation system), and management practices (e.g., tillage, fertilization, irrigation, and crop residue management). For each fertilizer type—i.e., liquid digestate, solid digestate, and mineral fertilizer—the simulations were repeated at increasing nitrogen input from 50 to 500 kg N ha−1 at 50 kg N ha−1 interval steps. Since digestate was not included in the DNDC model, its peculiar high mineral N content was represented as a combination of animal waste and urea. The proportions between the two components were defined in function of laboratory analysis.
The optimal N application rate was defined as the maximum of the product between the crop dry matter (kg C ha−1 y−1) at harvest and the nitrogen use efficiency (NUE) calculated according to the Nitrogen Expert Panel [34] as the ratio between the crop N uptake and N input obtained through fertilization (Figure 1). The applied index, hereafter called the agro-environmental sustainability index (AESI), should reflect the balance between the agronomic performance (i.e., yield) and environmental sustainability (i.e., NUE). Afterward, N prescription maps were built for each fertilizer using the geographic information system (GIS) platform (ESRI, ArcGIS, Redlands, CA, USA).

2.4. Statistical Analysis

Statistical analysis was performed applying a mixed-effects model based on a restricted maximum likelihood estimation method to all i-th variables for each monitored farm and crop. The treatment (i.e., different fertilization), the crop phenological stage (tillering, flag leaf, and maturity for wheat and emergence, flowering, and maturity for maize) and their interactions were tested as categorical variables, while sand, TKN, NH4, and NO3 were used as continuous variables.
All the previous effects were treated as fixed, blocks were treated as random, and measurements inside the same field as repeated. The post hoc pairwise comparison of least-squares means was performed with the Tukey method to adjust for multiple comparisons at the significance level of p ≤ 0.05. Statistical analysis was performed through SAS (SAS Institute Inc. Cary, NC, USA) version 5.1.

3. Results

3.1. Simulation Results

During the nine-year DNDC simulations, the optimum N rate varied from 90 to 350 kg N ha−1 at F1, from 60 to 350 kg N ha−1 at F2 for wheat, and was in the 180–500 kg N ha−1 (F1) and 120–400 kg N ha−1 (F2) range for maize (Table 4). On average, at both sites and crops, the lowest optimum N rate was predicted for MF, and the highest was for SD. The final crop yield for silage winter wheat was predicted between 9.3 and 10.3 t ha−1 at F1 and between 5.7 and 8.8 t ha−1 at F2. For silage maize, the simulated production varied considerably at F1 (between 12.2 and 27.2 t ha−1) with MF resulting in the highest yield and the LD in the lowest, while F2 was similar among the treatments, at 15 t ha−1 on average.
The simulated NUE decreased with the increase of the N application rate and ranged from the minimum in SD (24.3% at F1 and 23.3% at F2) to the maximum in MF (100.2% at F1 and 88.7% at F2) for winter wheat. The maize NUE follows the same behavior of the winter wheat except at F1 where the lowest efficiency was recovered in LD+ (28.7%) instead of SD (29.4%) (Table 4).
For winter wheat, the AESI was predicted between 2.3 and 10.1 t ha−1 at F1 and between 2 and 5 t ha−1 at F2, while for maize this was between 3.8 and 13.9 t ha−1 at F1 and between 3.5 and 5.5 t ha−1 at F2 (Table 4). In the optimum N rate determination process (Figure 1), no clear peaks were detected in the SD treatment, and, consequently, the N application rate was set at 350 kg N ha−1 in winter wheat for both farms and at 500 (F1) and 400 kg N ha−1 (F2) in maize to comply with the Nitrate Directive regulation [35].

3.2. Meteorological Conditions
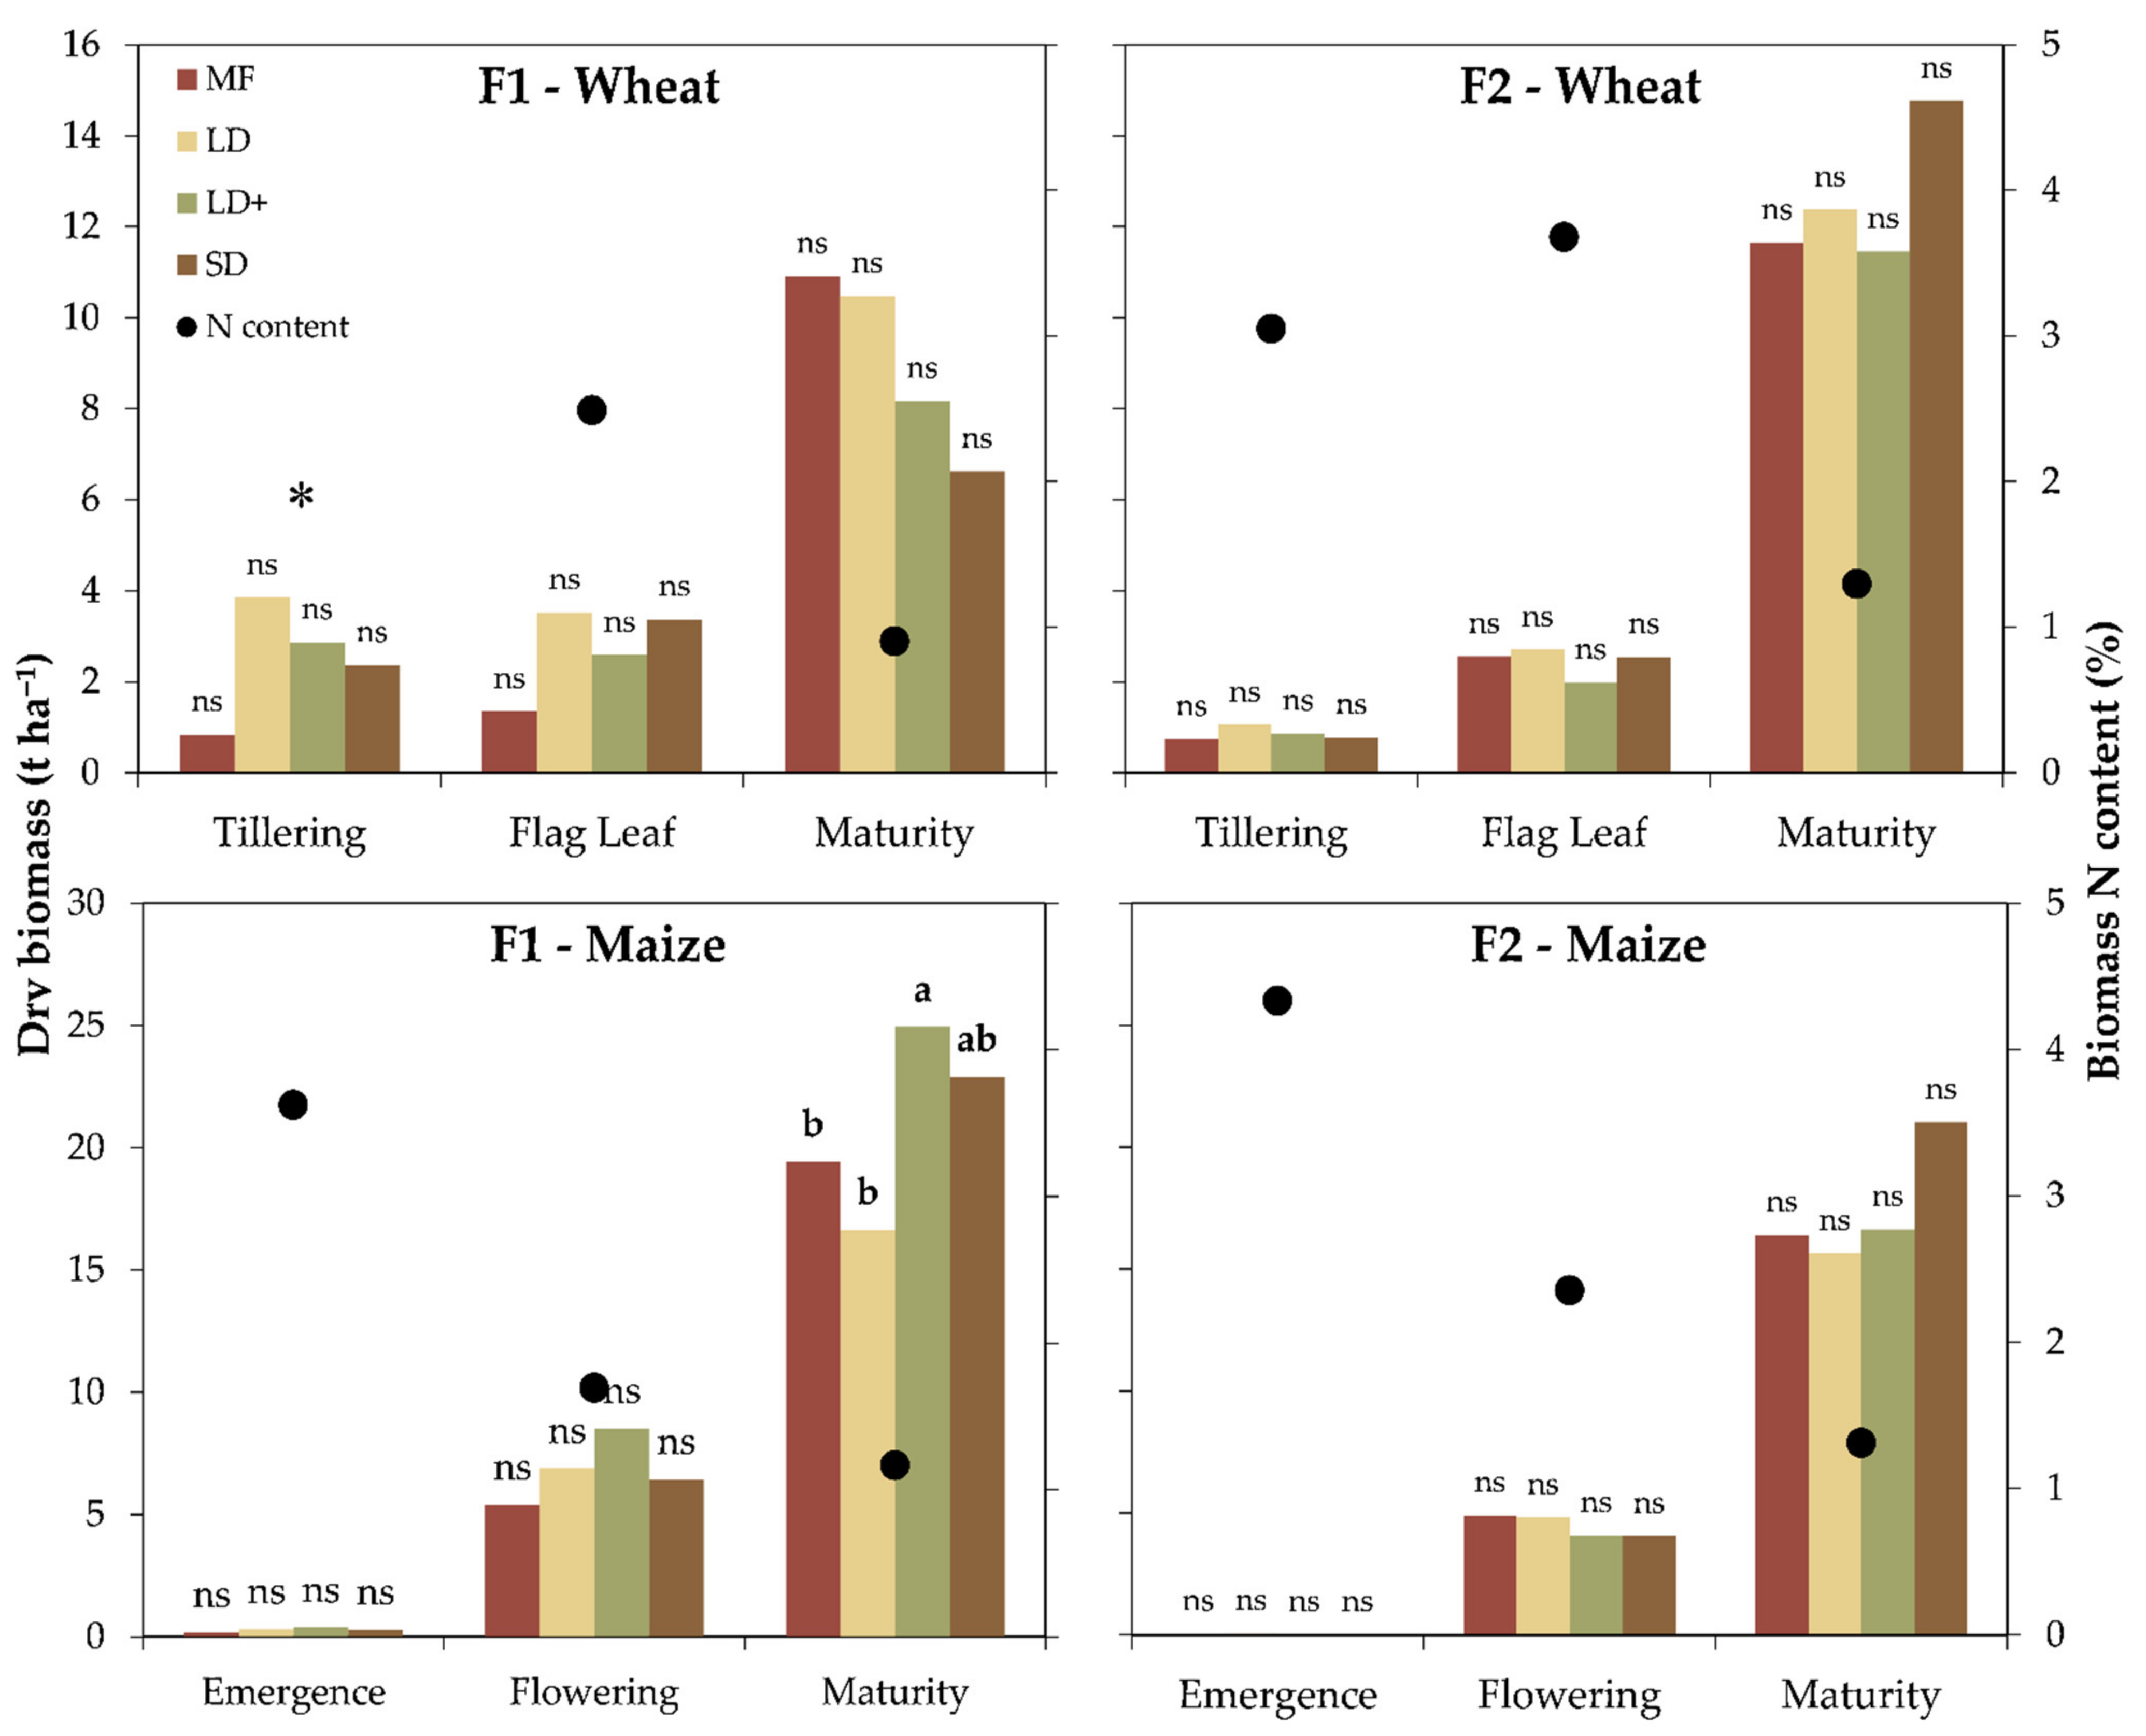
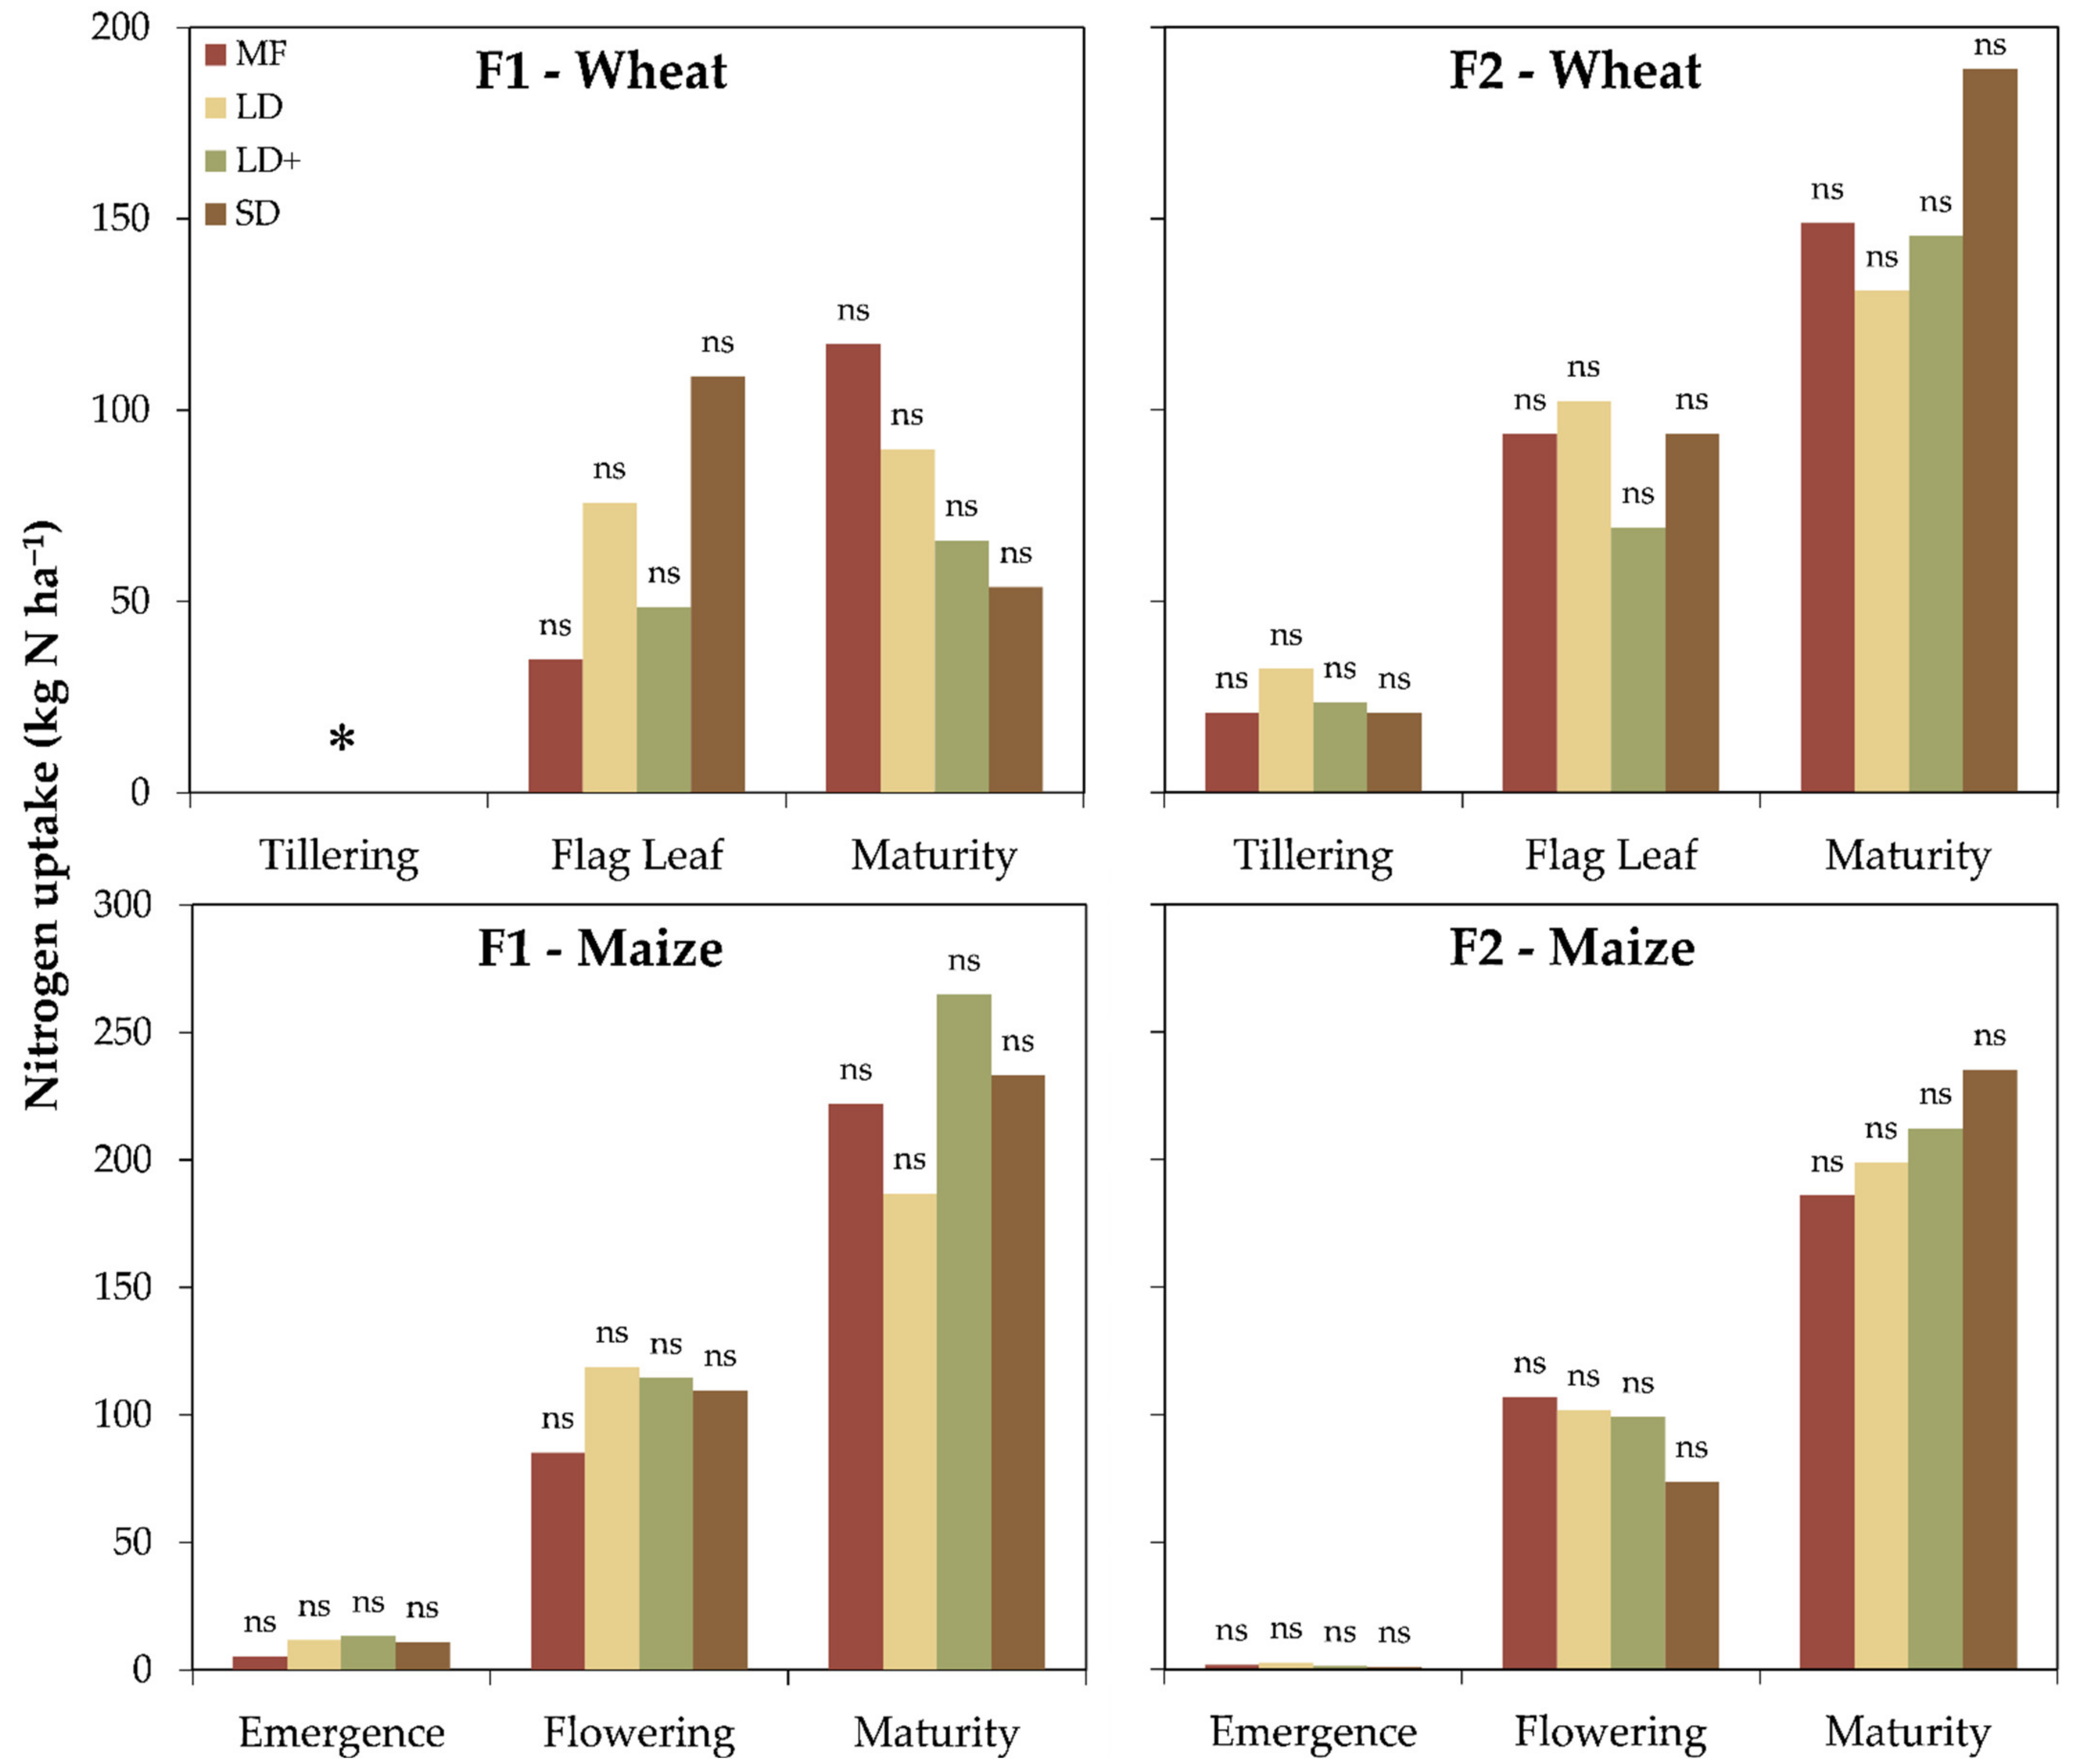
The crop growing season for winter wheat was characterized by precipitation of 467 and 404 mm at F1 and F2, respectively, with a peak of 181 mm at F1 and 216 mm at F2 in May. In maize, the precipitation amounted to 269 mm at F1 and 202 mm at F2, with a peak of 142 mm in July at F1 and 85 mm in September at F2. The air temperature ranged between −1.7 and 26.3 °C at F1 and between −1.6 and 26.3 °C at F2 for winter wheat, while maize temperatures were in the 13.5–29.8 °C range at F1 and in the 14.1–30.7 °C range at F2.

3.3. Crop Traits

The effect of cropping systems on plant height was appreciable only at F1 (treatment × date significant at p = 0.05). In winter wheat, at maturity, the values ranged from 100 cm in LD+ to 134 cm in LD. On the contrary, in maize at flowering, the plant height was higher in LD+ (273 cm) and lower in LD (253 cm), SD (259 cm), and MF (216 cm). No significant differences were observed for the other dates. At F1, crop height was also positively correlated with the TKN (p = 0.0681) in winter wheat and sand in maize, respectively.
The winter wheat LAI ranged from 0.6 and 0.4 at tillering to 3.6 and 4.1 at maturity at F1 and F2, respectively. Similarly, the maize LAI steadily increased from emergence (0.7 and 0.3) to maturity (6.1 and 5.4) at F1 and F2, respectively. Statistical differences occurred for both crops during the intermediate stage only at F1 (Table 5). Indeed, at winter wheat flag leaf, SD exhibited the highest LAI (3.8) and MF the lowest (0.9), while LD and LD+ had intermediate results. Conversely, during the maize flowering stage, LD+ (4.6) and MF (2.9) showed the highest and the lowest LAI, respectively. In winter wheat, the TKN was positively and negatively correlated to the LAI at F1 and F2, respectively.
The NDVI dynamics were similar for both crops and sites showing a growing pattern between the first and second sampling date (e.g., the tillering and flag leaf for winter wheat and the emergence and flowering for maize) followed by a decrease at maturity. The maximum observed NDVI ranged between 0.62 and 0.82 at F1 and between 0.79 and 0.82 at F2 for winter wheat and was slightly higher for maize, being in the 0.79–0.87 range. Statistical differences were found only at the early growing stages at F1, for both maize and winter wheat.
In the latter, both digestate fractions resulted in a significantly higher NDVI (0.68, on average) than MF (0.41) at the tillering stage, while the SD had the highest and the MF the lowest NDVI at flag leaf. Similarly, at F1 maize emergence, the liquid digestate fraction exhibited 58% of the greatest NDVI, while the SD was comparable to the MF (0.36 vs. 0.31). The NDVI was influenced by the soil N, being positively correlated with the TKN and ammonium in winter wheat at F1 and in maize at F2, respectively. The NDVI was also negatively correlated with sand in winter wheat at F2.
In general, the NDVI was always positively correlated with the LAI and N uptake at the early phenological stages (i.e., the tillering and flag leaf in winter wheat and the emergence and flowering in maize) with average coefficients of correlation of 0.56 and 0.64, respectively, with the exception of F2 maize where the relationship was also not significant at flowering.

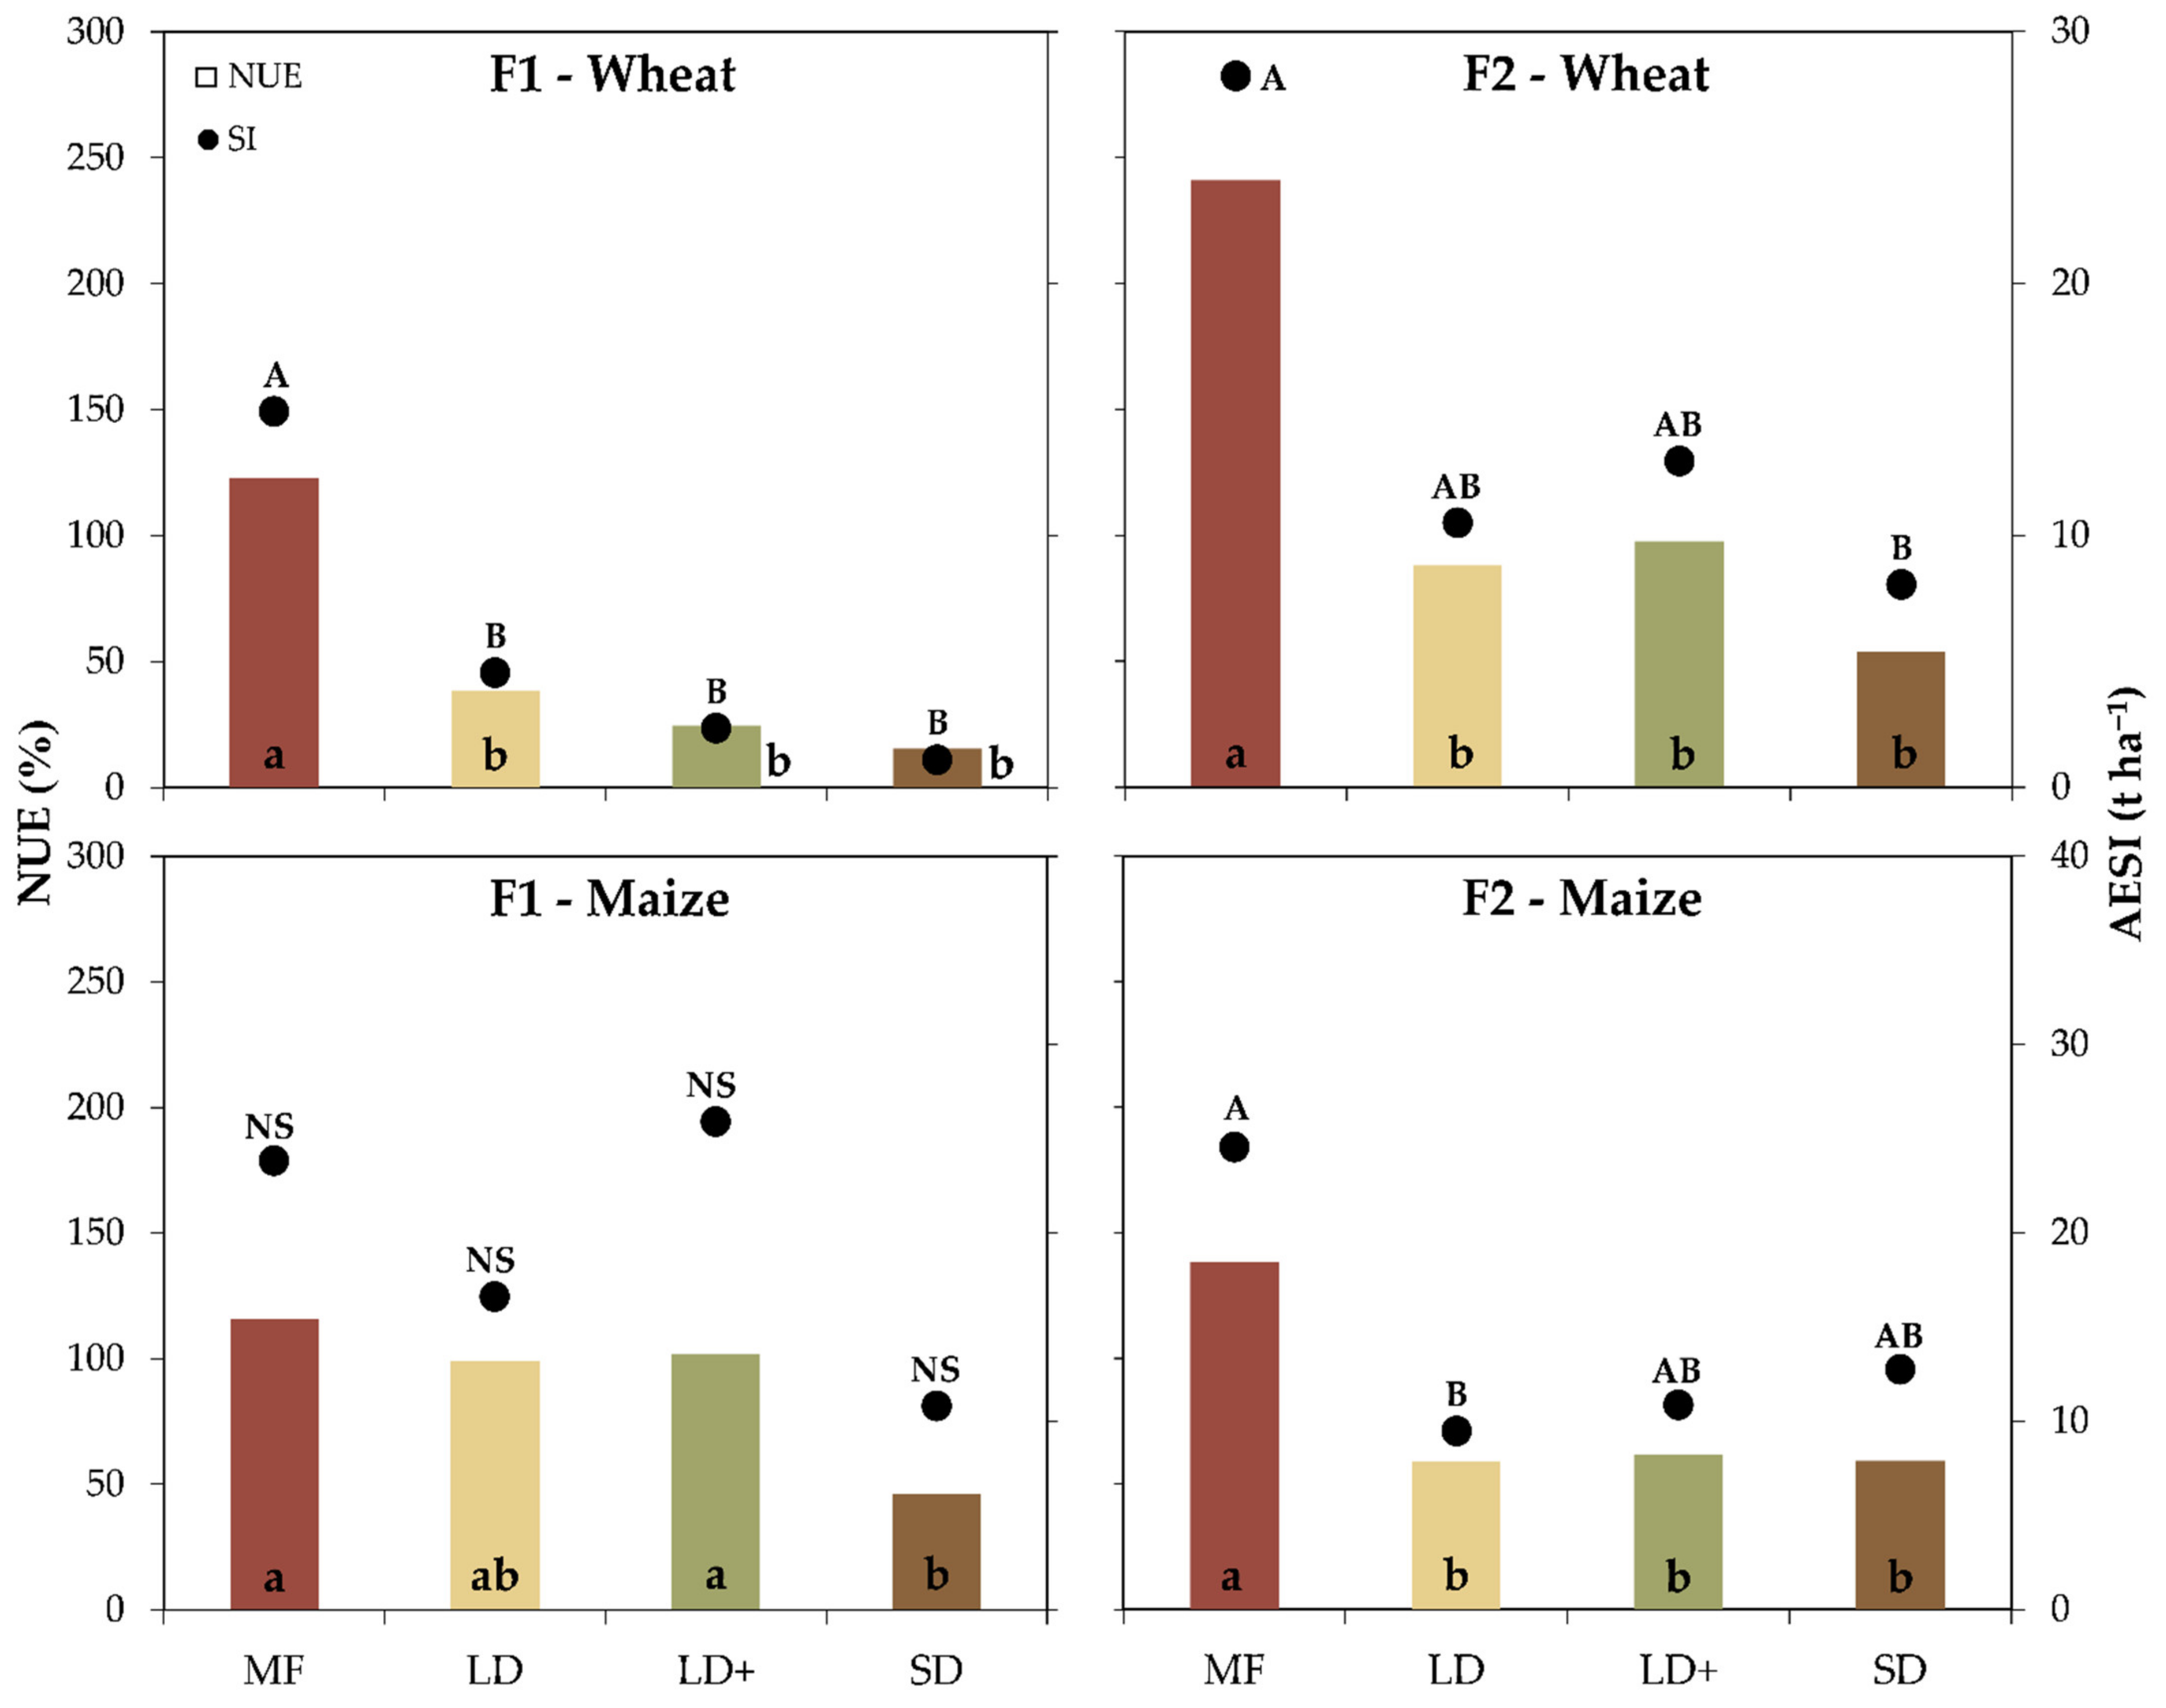
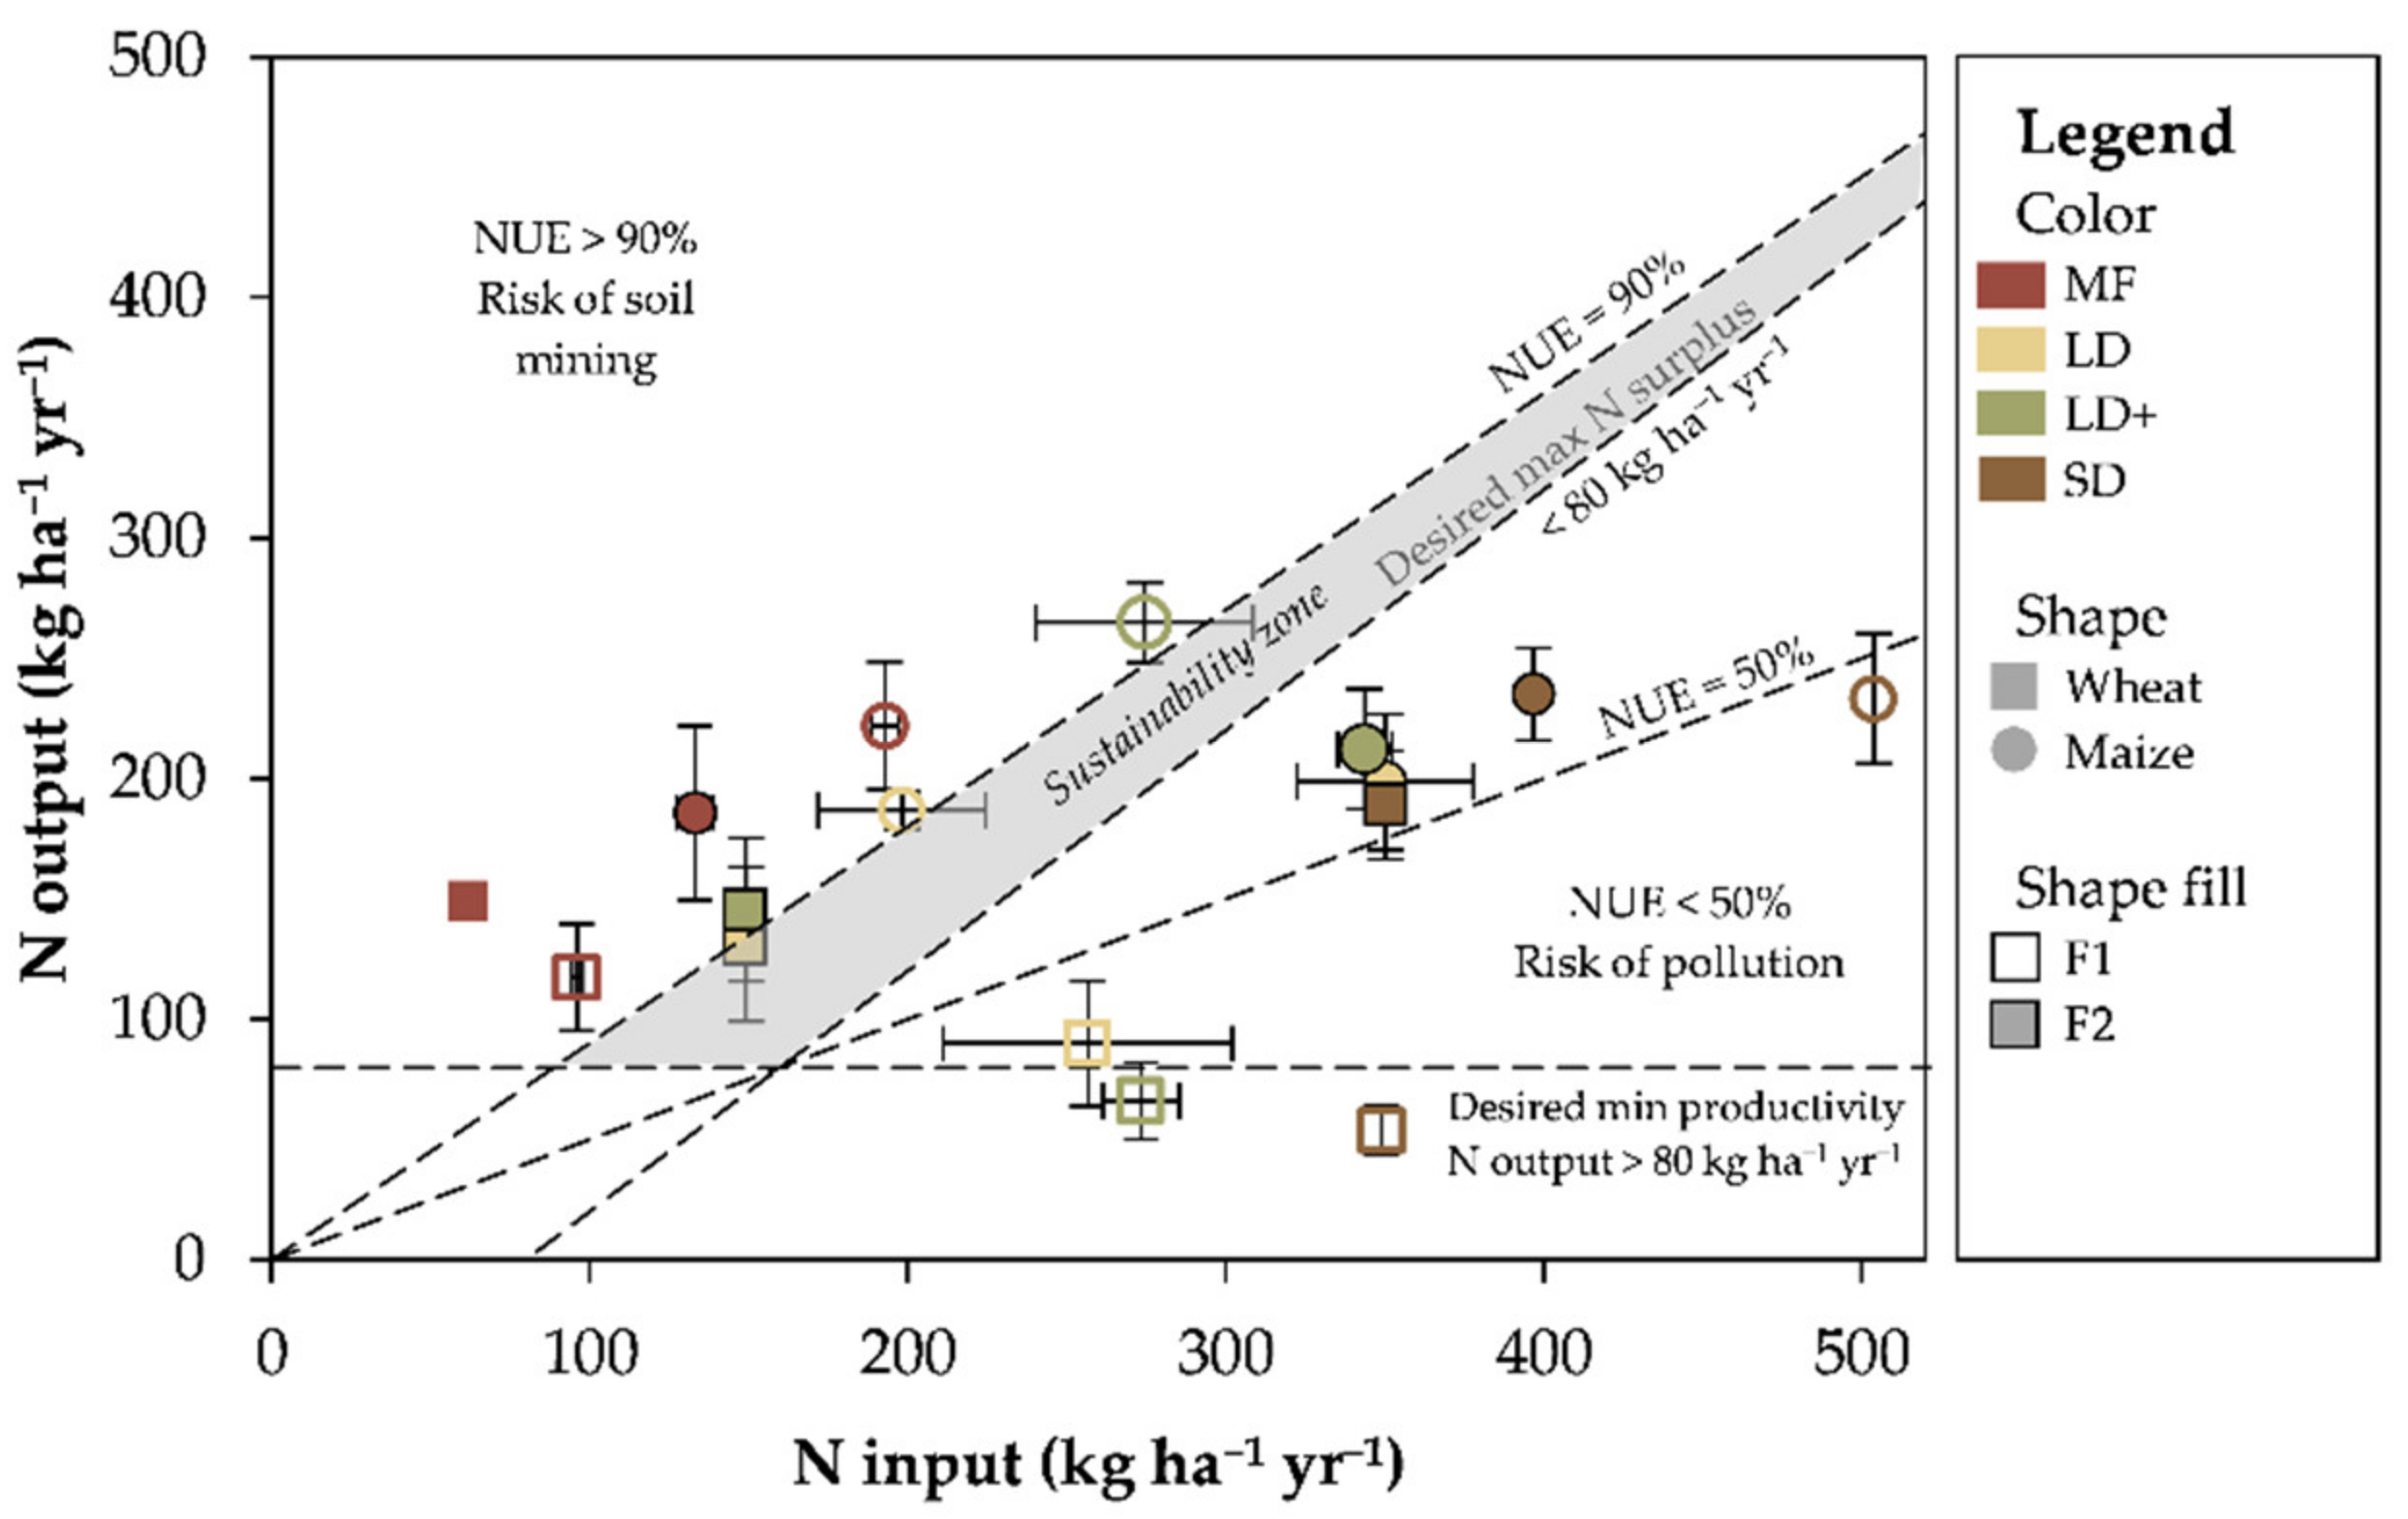
3.4. Crop Performances

Crop biomass production was unaffected by treatments at the early development stages, being 2.5 t ha−1 at F1 and 0.9 t ha−1 at F2 at tillering and 2.7 t ha−1 at F1 and 2.4 t ha−1 at F2 at flag leaf in wheat, and being 0.3 t ha−1 at F1 and 0.04 t ha−1 at F2 at emergence and 6.8 t ha−1 at F1 and 4.5 t ha−1 at F2 at flowering in maize. At maturity, the silage winter wheat production was 9 t ha−1 at F1 and 12.6 t ha−1 at F2 without significant differences between treatments (Figure 2).
The silage maize yield was affected by treatments at F1, where LD+ reported the best performances (+28% with respect to MF) followed by SD while MF and LD had lower productions (Figure 2). The treatments did not impact the crop yield at F2, which resulted in 17.4 t ha−1. The dry yield was influenced by soil N in winter wheat at F1, and was positively correlated with the TKN.
The nitrogen content in the wheat biomass ranged between 2.9% (F1) and 3.1% (F2) at tillering and 1.3% (F1) and 0.9% (F2) at maturity. Similarly, the maize N content varied from 3.6% (F1) and 4.3% (F2) at emergence to 1.2% (F1) and 1.3% (F2) at maturity (Figure 2). The nitrogen uptake results showed comparable performances among the treatments for both crops and sites (Figure 3). Generally, the N uptake showed an increasing pattern with the phenological stage from 35 to 117 kg N ha−1 at F1 and from 21 to 189 kg N ha−1 at F2 for winter wheat and between 5 and 265 kg N ha−1 (F1) and between 1 and 235 kg N ha−1 (F2) for maize. In winter wheat, the N uptake was positively and negatively correlated with the TKN and sand (p = 0.07) at F1 and F2, respectively.
The greatest NUE was recorded on MF treatment for both crops and sites, which was always above 100% and reached the maximum value of 240% in F2 winter wheat (Figure 4). In contrast, SD gave the lowest NUE for both crops and sites, being 15% and 54% in winter wheat and 46% and 59% in maize. The NUE of LD and LD+ was generally lower than MF and comparable to SD in all cases except for F1 maize where the performance was similar to that of MF. Nitrate was positively correlated with the NUE in winter wheat at F1 and negatively in maize at both farms (F1 and F2).
MF treatment gave the greatest AESI, always above 14.9 t ha−1 for both crops and sites except in F1 maize where no statistical differences were found among treatments (Figure 4). Conversely, SD reported the lowest AESI in winter wheat at both sites (F1 and F2) and was always below 12.7 t ha−1. Overall, the lowest AESIs were recorded in F1 winter wheat, reflecting the results of the nitrogen uptake (Figure 4). The AESI was positively correlated with the TKN (p = 0.0592) and nitrate in winter wheat at F1 while maize at F2 reported a negative and a positive correlation with nitrate and sand, respectively.

4. Discussion

Liquid and solid digestate fractions led to crop performances (e.g., dry biomass, plant height, LAI) that were consistently comparable to those of mineral fertilizers. On the one hand, this confirms the good potentialities of by-products as digestate for N delivering and maintaining crop performances [2,20,21,36,37,38]. On the other hand, this may suggest that the adoption of different N rates is more suitable compared with adopting an equal rate when different fertilizers (e.g., organic and mineral) are involved, in order to homogenize crop performances and evaluate the cropping system agro-environmental sustainability in a holistic way.
The addition of a nitrification inhibitor to LD did not consistently increase the crop performances as no differences between the LD and LD+ were detected for all parameters except for maize at F1. The nitrification inhibitor reduced the nitrogen losses via denitrification and leaching; however, their magnitude can considerably vary as a function of soil properties (e.g., pH and cation exchange capacity) [39,40]. Indeed, for example, in alkaline soil (pH ca. 8), ammonia volatilization (NH3) can significantly reduce the nitrogen availability and, in turn, decrease the positive effect of nitrification inhibitor [41]. In the studied farms, the pH averaged 8.6 at F1 and 7.8 at F2, and the comparable performances between LD and LD+ might confirm what was reported by other authors [39,40,41,42] who suggested a reduced effect of nitrification inhibitors in alkaline soil due to the high ammonia volatilization. The effect of a nitrification inhibitor was more visible in maize (spring crop) than in winter wheat (autumn crop). This may suggest that meteorological conditions, with temperature first, played a key role in the microorganism activity and, consequently, may synchronize N release with crop nutrient requirements and, in turn, may rule the N environmental fate.
The maize NUE for mineral fertilizer was always around 100% or higher, likely due to the presence of soil residual nitrogen [37,43]. The NUE was calculated following the EU Nitrogen Expert Panel [34] suggestion as the N output to N input ratio, where NUE < 50% indicates the risk of environmental losses and NUE > 90% the risk of soil mining. The higher (not always significant) NUE in MF compared to LD could be attributed to the nature of fertilizer (presence of readily available N forms) and agricultural practice (e.g., fertilizer fractionation and timing) [20] and it could also be associated with the risk of soil mining. On the contrary, LD showed satisfying maize NUE (e.g., >50%) but did not exceed 90%, falling close to the “sustainability zone” according to the graphical NUE representation of the EU Nitrogen Expert Panel [34] (Figure 5). Contrarily to liquid, the solid digestate fraction reported a lower maize NUE, being <50% in almost all cases, confirming the results of Cavalli et al. [43] who reported a lower apparent nitrogen recovery with a digestate solid fraction compared to both the liquid and mineral fertilizers. Despite this, the N in organic form, likely to be still set in SD, might represent a N source for subsequent crops.
As the opposite to what was reported for maize, for F1 winter wheat both digestate fractions exhibited lower NUE performances (<38%) compared to MF (123%). The solid fraction of digestate contains a high amount of organic nitrogen that is not readily available for plants, a high C:N ratio and cellulosic and hemi-cellulosic compounds [44,45,46,47]. Therefore, the intrinsic nature of SD combined with a low temperature during the winter wheat growing season may have reduced the mineralization rates leading to N immobilization in the soil [48]. Soil N immobilization occurs after organic amendment application [49], which limits the N availability in the short-term [50] but provides a gradual N release in the medium-term [37]. In the present study, the SD nitrogen application was between 350 and 500 kg N ha−1, which was the highest among the studied treatments. Thus, we speculate that not all the N was in a mobile or crop-available form; thus, the SD nitrogen might have contributed to the soil organic matter on the one hand [20] and represents a constant source of available nutrients for the following crops [51] on the other.
According to Nabel et al. [52], fertilization with digestate may improve soil physical properties, such as water retention capacity. For these reasons, the advantages of digestate over mineral fertilizer might increase over time [52]. Finally, as opposed to mineral fertilizer, digestate is an agricultural by-product often treated as waste and subjected to further treatments [9,53,54], which does not require fossil fuels for its production. Therefore, using digestate as an alternative to mineral fertilizer may sustain the circular economy and give insight to sustainable development goals (SDGs) [55,56]. Indeed, the agricultural sector might contribute to SDGs (e.g., clean water and sanitation, responsible consumption and production and climate action) mainly by improving nitrogen [57,58] and irrigation use efficiency [59,60].
To the best of our knowledge, only a few attempts exist in the literature using DNDC or other models to simulate digestate performances. Shen et al. [61] modified the UK-DNDC to implement digestate application and found that the model well fitted the field observations. Räbiger et al. [62] reported that the Plant–Soil–Atmosphere model well depicted the N uptake dynamic with a coefficient of determination ranging between 0.79 and 0.82.
The classical Economic Optimum Rate approach maximizes the farmer’s financial returns but does not consider the environmental pollution risk [63]. As a consequence, many authors have proposed several methods to optimize the N rates taking into account economic and environmental sustainability goals at the same time. Basso et al. [63] suggested a decisional method to determine the optimal N rate based on the plant’s available soil water through simulations with increasing fertilization. Another method, proposed by Cammarano et al. [64], aims to maximize the economic profit and to minimize the environmental impact using the Decision Support System for Agrotechnology Transfer (DSSAT) model but this requires information that is not always available, such as nitrate leaching, a marginal net return probability analysis, reliable weather forecast, and detailed yield maps.
Alternative criteria should be followed for identifying the optimum digestate rate. Indeed, the digestate is a zero-cost by-product whose use as a fertilizer surrogate is restricted by side effects on the environment. The proposed AESI might represent a more synthetic and rapid tool to define the optimal N rates of by-products (e.g., digestate) combining agronomic (yield) and environmental sustainability (NUE) and, thus providing new insight into the circular economy through the better utilization of existent resources as digestate.

5. Conclusions

In this work, a practical protocol for the use of solid and liquid digestate fractions was tested according to agronomic and environmental metrics. Our experiment fully and partially confirmed the first and second starting hypotheses, respectively. Indeed, on the one hand both digestate fractions gave agronomic performances comparable to those of mineral fertilizers suggesting that they can be an effective substitute for mineral fertilizers in intensive cropping systems. On the other, the lower agro-environmental sustainability of the solid fraction in the first year might suggest the need for longer-term study to fully exploit its additional benefits (e.g., improvement of the soil physical properties, residual N release). Therefore, using digestate fractions might be an asset for the circular economy, allowing fulfilment of the 2030 Agenda for sustainable development, adopted by all United Nations member states.

Author Contributions

Conceptualization, F.M. (Francesco Morari) and I.F.; methodology, F.G., I.P., S.O. and F.R.; formal analysis, F.G. and I.P.; investigation, F.G., S.O., F.R. and T.B.; data curation, F.G.; writing—original draft preparation, F.G., I.P. and F.M. (Francesco Morari); writing—review and editing, F.G., I.P., I.F., F.R., S.O., T.B., F.M. (Francesco Meneghetti) and F.M. (Francesco Morari); visualization, F.G. and I.P.; supervision, F.M. (Francesco Morari); project administration, I.F. All authors have read and agreed to the published version of the manuscript.

Funding

This research was funded by Rural development 2014–2020 for Operational Groups (in the sense of Art 56 of Reg.1305/2013), “Dig-control” project.

Institutional Review Board Statement

Not applicable.

Informed Consent Statement

Not applicable.

Data Availability Statement

The data that support the findings of this study are available from the corresponding author upon reasonable request.

Acknowledgments

We are grateful to Federica Aru and Riccardo Polese for their valuable help during the sampling campaign.

Conflicts of Interest

The authors declare no conflict of interest.

References

  1. Communication from the Commission to the European Parliament, the Council, the European Economic and Social Committee and the Committee of the Regions 2008, Brussels. Available online: https://eur-lex.europa.eu/legal-content/EN/TXT/?uri=celex%3A52008DC0400 (accessed on 12 April 2021).
  2. Riva, C.; Orzi, V.; Carozzi, M.; Acutis, M.; Boccasile, G.; Lonati, S.; Tambone, F.; D’Imporzano, G.; Adani, F. Short-term experiments in using digestate products as substitutes for mineral (N) fertilizer: Agronomic performance, odours, and ammonia emission impacts. Sci. Total Environ. 2016, 547, 206–214. [Google Scholar] [CrossRef] [PubMed]
  3. European Biogas Association Annual Report 2019; European Biogas Association (EBA): Brussels, Belgium, 2019; Available online: https://www.europeanbiogas.eu/eba-annual-report-2019/ (accessed on 12 April 2021).
  4. Scarlat, N.; Dallemand, J.F.; Fahl, F. Biogas: Developments and perspectives in Europe. Renew. Energy 2018, 129, 457–472. [Google Scholar] [CrossRef]
  5. Möller, K.; Stinner, W. Effects of different manuring systems with and without biogas digestion on soil mineral nitrogen content and on gaseous nitrogen losses (ammonia, nitrous oxides). Eur. J. Agron. 2009, 30, 1–16. [Google Scholar] [CrossRef]
  6. Baştabak, B.; Koçar, G. A review of the biogas digestate in agricultural framework. J. Mater. Cycles Waste Manag. 2020, 22, 1318–1327. [Google Scholar] [CrossRef]
  7. Vaneeckhaute, C.; Lebuf, V.; Michels, E.; Belia, E.; Vanrolleghem, P.A.; Tack, F.M.G.; Meers, E. Nutrient recovery from digestate: Systematic technology review and product classification. Waste Biomass Valorization 2017, 8, 21–40. [Google Scholar] [CrossRef] [Green Version]
  8. Delzeit, R.; Kellner, U. How Location Decisions Influence Transport Costs of Processed and Unprocessed Bioenergy Digestates: The Impact of Plant Size and Location on Profitability of Biogas Plants in Germany; Kiel Working Papers; Kiel Insitute for the World Economy: Kiel, Germany, 2011. [Google Scholar]
  9. Macura, B.; Johannesdottir, S.L.; Piniewski, M.; Haddaway, N.R.; Kvarnström, E. Effectiveness of ecotechnologies for recovery of nitrogen and phosphorus from anaerobic digestate and effectiveness of the recovery products as fertilisers: A systematic review protocol. Environ. Evid. 2019, 8, 29. [Google Scholar] [CrossRef]
  10. Liedl, B.E.; Bombardiere, J.; Chatfield, J.M. Fertilizer potential of liquid and solid effluent from thermophilic anaerobic digestion of poultry waste. Water Sci. Technol. 2006, 53, 69–79. [Google Scholar] [CrossRef] [Green Version]
  11. Nkoa, R. Agricultural benefits and environmental risks of soil fertilization with anaerobic digestates: A review. Agron. Sustain. Dev. 2014, 34, 473–492. [Google Scholar] [CrossRef] [Green Version]
  12. Salminen, E.; Rintala, J.; Härkönen, J.; Kuitunen, M.; Högmander, H.; Oikari, A. Anaerobically digested poultry slaughterhouse wastes as fertiliser in agriculture. Bioresour. Technol. 2001, 78, 81–88. [Google Scholar] [CrossRef]
  13. Abdullahi, Y.A.; Akunna, J.C.; White, N.A.; Hallett, P.D.; Wheatley, R. Investigating the effects of anaerobic and aerobic post-treatment on quality and stability of organic fraction of municipal solid waste as soil amendment. Bioresour. Technol. 2008, 99, 8631–8636. [Google Scholar] [CrossRef]
  14. Working Document; Biological Treatment of Biowaste, Second Draft; European Commission: Brussels, Belgium, 2001; Available online: http://www.cre.ie/docs/EU_BiowasteDirective_workingdocument_2nddraft.pdf (accessed on 12 April 2021).
  15. Biogas in Italia | ISAAC Project. Available online: http://www.isaac-project.it/biogas-in-italia/ (accessed on 10 April 2021).
  16. Castaldelli, G.; Soana, E.; Racchetti, E.; Pierobon, E.; Mastrocicco, M.; Tesini, E.; Fano, E.A.; Bartoli, M. Nitrogen budget in a lowland coastal area within the Po River Basin (Northern Italy): Multiple evidences of equilibrium between sources and internal sinks. Environ. Manag. 2013, 52, 567–580. [Google Scholar] [CrossRef]
  17. Chantigny, M.H.; Angers, D.A.; Bélanger, G.; Rochette, P.; Eriksen-Hamel, N.; Bittman, S.; Buckley, K.; Massé, D.; Gasser, M.O. Yield and nutrient export of grain corn fertilized with raw and treated liquid swine manure. Agron. J. 2008, 100, 1303–1309. [Google Scholar] [CrossRef]
  18. Barbosa, D.B.P.; Nabel, M.; Jablonowski, N.D. Biogas-digestate as nutrient source for biomass production of Sida hermaphrodita, Zea mays L. and Medicago sativa L. Energy Proc. 2014, 59, 120–126. [Google Scholar] [CrossRef] [Green Version]
  19. Šimon, T.; Kunzová, E.; Friedlová, M. The effect of digestate, cattle slurry and mineral fertilization on the winter wheat yield and soil quality parameters. PlantSoil Environ. 2015, 62, 522–527. [Google Scholar] [CrossRef] [Green Version]
  20. Ehmann, A.; Thumm, U.; Lewandowski, I. Fertilizing Potential of Separated Biogas Digestates in Annual and Perennial Biomass Production Systems. Front. Sustain. Food Syst. 2018, 2, 1–14. [Google Scholar] [CrossRef] [Green Version]
  21. Walsh, J.J.; Jones, D.L.; Edwards-Jones, G.; Williams, A.P. Replacing inorganic fertilizer with anaerobic digestate may maintain agricultural productivity at less environmental cost. J. Plant Nutr. Soil Sci. 2012, 175, 840–845. [Google Scholar] [CrossRef]
  22. Alburquerque, J.A.; de la Fuente, C.; Campoy, M.; Carrasco, L.; Nájera, I.; Baixauli, C.; Caravaca, F.; Roldán, A.; Cegarra, J.; Bernal, M.P. Agricultural use of digestate for horticultural crop production and improvement of soil properties. Eur. J. Agron. 2012, 43, 119–128. [Google Scholar] [CrossRef]
  23. Holm-Nielsen, J.B.; Al Seadi, T.; Oleskowicz-Popiel, P. The future of anaerobic digestion and biogas utilization. Bioresour. Technol. 2009, 100, 5478–5484. [Google Scholar] [CrossRef]
  24. Baral, K.R.; Labouriau, R.; Olesen, J.E.; Petersen, S.O. Nitrous oxide emissions and nitrogen use efficiency of manure and digestates applied to spring barley. Agric. Ecosyst. Environ. 2017, 239, 188–198. [Google Scholar] [CrossRef]
  25. Sigurnjak, I.; Vaneeckhaute, C.; Michels, E.; Ryckaert, B.; Ghekiere, G.; Tack, F.M.G.; Meers, E. Fertilizer performance of liquid fraction of digestate as synthetic nitrogen substitute in silage maize cultivation for three consecutive years. Sci. Total Environ. 2017. [Google Scholar] [CrossRef]
  26. Projects|EIP-AGRI. DIG-CONTROL—Gruppo Operativo per la Sperimentazione di Tecniche di Distribuzione Controllata dei Digestati e di Inibitori della Nitrificazione. Available online: https://ec.europa.eu/eip/agriculture/en/find-connect/projects/dig-control-gruppo-operativo-la-sperimentazione-di (accessed on 10 April 2021).
  27. IUSS Working Group WRB. World Reference Base for Soil Resources 2006, First Update; FAO: Rome, Italy, 2007. [Google Scholar]
  28. Kjeldahl, J. Neue Methode zur Bestimmung des Stickstoffs in organischen Körpern. Fresenius. Z. Anal. Chem. 1883, 22, 366–382. [Google Scholar] [CrossRef] [Green Version]
  29. Approvazione dei “Metodi Ufficiali di Analisi Chimica del Suolo”; Ministero delle Politiche Agricole Alimentari e Forestali: Rome, Italy, 1999.
  30. Li, C.; Frolking, S.; Frolking, T.A. A model of nitrous oxide evolution from soil driven by rainfall events: 2. Model applications. J. Geophys. Res. 1992, 97, 9777–9783. [Google Scholar] [CrossRef]
  31. Cui, F.; Zheng, X.; Liu, C.; Wang, K.; Zhou, Z.; Deng, J. Assessing biogeochemical effects and best management practice for a wheat-maize cropping system using the DNDC model. Biogeosciences 2014, 11, 91–107. [Google Scholar] [CrossRef] [Green Version]
  32. Camarotto, C.; Dal Ferro, N.; Piccoli, I.; Polese, R.; Furlan, L.; Chiarini, F.; Morari, F. Conservation agriculture and cover crop practices to regulate water, carbon and nitrogen cycles in the low-lying Venetian plain. Catena 2018, 167, 236–249. [Google Scholar] [CrossRef]
  33. Mencaroni, M.; Dal Ferro, N.; Furlanetto, J.; Longo, M.; Lazzaro, B.; Sartori, L.; Grant, B.B.; Smith, W.N.; Morari, F. Identifying N fertilizer management strategies to reduce ammonia volatilization: Towards a site-specific approach. J. Environ. Manag. 2021, 277, 111445. [Google Scholar] [CrossRef] [PubMed]
  34. Nitrogen Use Efficiency (NUE)—An Indicator for the Utilization of Nitrogen in Agriculture and Food Systems; EU Nitrogen Expert Panel: Wageningen, The Netherlands, 2015.
  35. European Commission Directive 91/676/EEC; European Commission: Brussels, Belgium, 1991.
  36. Nabel, M.; Temperton, V.M.; Poorter, H.; Lücke, A.; Jablonowski, N.D. Energizing marginal soils—The establishment of the energy crop Sida hermaphrodita as dependent on digestate fertilization, NPK, and legume intercropping. Biomass Bioenergy 2016, 87, 9–16. [Google Scholar] [CrossRef] [Green Version]
  37. Tsachidou, B.; Scheuren, M.; Gennen, J.; Debbaut, V.; Toussaint, B.; Hissler, C.; George, I.; Delfosse, P. Biogas residues in substitution for chemical fertilizers: A comparative study on a grassland in the Walloon Region. Sci. Total Environ. 2019, 666, 212–225. [Google Scholar] [CrossRef]
  38. Morra, L.; Cozzolino, E.; Salluzzo, A.; Modestia, F.; Bilotto, M.; Baiano, S.; del Piano, L. Plant growth, yields and fruit quality of processing tomato (Solanum lycopersicon L.) as affected by the combination of biodegradable mulching and digestate. Agronomy 2021, 11, 100. [Google Scholar] [CrossRef]
  39. Kim, D.G.; Saggar, S.; Roudier, P. The effect of nitrification inhibitors on soil ammonia emissions in nitrogen managed soils: A meta-analysis. Nutr. Cycl. Agroecosyst. 2012, 93, 51–64. [Google Scholar] [CrossRef]
  40. Misselbrook, T.H.; Cardenas, L.M.; Camp, V.; Thorman, R.E.; Williams, J.R.; Rollett, A.J.; Chambers, B.J. An assessment of nitrification inhibitors to reduce nitrous oxide emissions from UK agriculture. Environ. Res. Lett. 2014, 9. [Google Scholar] [CrossRef] [Green Version]
  41. Abalos, D.; Jeffery, S.; Sanz-Cobena, A.; Guardia, G.; Vallejo, A. Meta-analysis of the effect of urease and nitrification inhibitors on crop productivity and nitrogen use efficiency. Agric. Ecosyst. Environ. 2014, 189, 136–144. [Google Scholar] [CrossRef]
  42. Singh, J.; Saggar, S.; Bolan, N.S.; Zaman, M. The role of inhibitors in the bioavailability and mitigation of nitrogen losses in grassland ecosystems. Dev. Soil Sci. 2008, 32, 329–362. [Google Scholar]
  43. Cavalli, D.; Cabassi, G.; Borrelli, L.; Geromel, G.; Bechini, L.; Degano, L.; Gallina, M. Pietro Nitrogen fertilizer replacement value of undigested liquid cattle manure and digestates. Eur. J. Agron. 2016, 73, 34–41. [Google Scholar] [CrossRef]
  44. Chantigny, M.H.; Angers, D.A.; Rochette, P.; Bélanger, G.; Massé, D.; Côté, D. Gaseous Nitrogen Emissions and Forage Nitrogen Uptake on Soils Fertilized with Raw and Treated Swine Manure. J. Environ. Qual. 2007, 36, 1864–1872. [Google Scholar] [CrossRef] [PubMed] [Green Version]
  45. Morvan, T.; Nicolardot, B. Role of organic fractions on C decomposition and N mineralization of animal wastes in soil. Biol. Fertil. Soils 2009, 45, 477–486. [Google Scholar] [CrossRef]
  46. Peters, K.; Jensen, L.S. Biochemical characteristics of solid fractions from animal slurry separation and their effects on C and N mineralisation in soil. Biol. Fertil. Soils 2011, 47, 447–455. [Google Scholar] [CrossRef]
  47. Möller, K.; Müller, T. Effects of anaerobic digestion on digestate nutrient availability and crop growth: A review. Eng. Life Sci. 2012, 12, 242–257. [Google Scholar] [CrossRef]
  48. Larsen, T.; Luxhøi, J.; Magid, J.; Jensen, L.S.; Krogh, P.H. Properties of anaerobically digested and composted municipal solid waste assessed by linking soil mesofauna dynamics and nitrogen modelling. Biol. Fertil. Soils 2007, 44, 59–68. [Google Scholar] [CrossRef]
  49. Gutser, R.; Ebertseder, T.; Weber, A.; Schraml, M.; Schmidhalter, U. Short-term and residual availability of nitrogen after long-term application of organic fertilizers on arable land. J. Plant Nutr. Soil Sci. 2005, 168, 439–446. [Google Scholar] [CrossRef]
  50. Abubaker, J.; Risberg, K.; Jönsson, E.; Dahlin, A.S.; Cederlund, H.; Pell, M. Short-term effects of biogas digestates and pig slurry application on soil microbial activity. Appl. Environ. Soil Sci. 2015, 2015. [Google Scholar] [CrossRef] [Green Version]
  51. De Boer, H.C. Nitrate Leaching from Liquid Cattle Manure Compared to Synthetic Fertilizer Applied to Grassland or Silage Maize in the Netherlands; Wageningen UR Livestock Research: Wageningen, The Netherlands, 2017; pp. 1–32. [Google Scholar]
  52. Nabel, M.; Schrey, S.D.; Poorter, H.; Koller, R.; Jablonowski, N.D. Effects of digestate fertilization on Sida hermaphrodita: Boosting biomass yields on marginal soils by increasing soil fertility. Biomass Bioenergy 2017, 107, 207–213. [Google Scholar] [CrossRef]
  53. Zheng, T.; Qiu, Z.; Dai, Q.; Chen, J. Study of biogas slurry concentrated by reverse osmosis system: Characteristics, optimization, and mechanism. Water Environ. Res. 2019, 91, 1447–1454. [Google Scholar] [CrossRef] [PubMed]
  54. Piccoli, I.; Virga, G.; Maucieri, C.; Borin, M. Digestate liquid fraction treatment with filters filled with recovery materials. Water 2020, 13, 21. [Google Scholar] [CrossRef]
  55. The SDGs and Sustainable Fertilizer Production; IFA: Ashland, OH, USA, 2020.
  56. Ronga, D.; Caradonia, F.; Parisi, M.; Bezzi, G.; Parisi, B.; Allesina, G.; Pedrazzi, S.; Francia, E. Using digestate and biochar as fertilizers to improve processing tomato production sustainability. Agronomy 2020, 10, 138. [Google Scholar] [CrossRef] [Green Version]
  57. Ladha, J.K.; Jat, M.L.; Stirling, C.M.; Chakraborty, D.; Pradhan, P.; Krupnik, T.J.; Sapkota, T.B.; Pathak, H.; Rana, D.S.; Tesfaye, K.; et al. Achieving the sustainable development goals in agriculture: The crucial role of nitrogen in cereal-based systems. Adv. Agron. 2020, 163, 39–116. [Google Scholar]
  58. Maris, S.C.; Capra, F.; Ardenti, F.; Chiodini, M.E.; Boselli, R.; Taskin, E.; Puglisi, E.; Bertora, C.; Poggianella, L.; Amaducci, S.; et al. Reducing N fertilization without yield penalties in maize with a commercially available seed dressing. Agronomy 2021, 11, 407. [Google Scholar] [CrossRef]
  59. Bezdan, A.; Blagojevic, B.; Vranesevic, M.; Benka, P.; Savic, R.; Bezdan, J. Defining spatial priorities for irrigation development using the soil conservation and water use efficiency criteria. Agronomy 2019, 9, 324. [Google Scholar] [CrossRef] [Green Version]
  60. Loiskandl, W.; Nolz, R. Requirements for sustainable irrigated agriculture. Agronomy 2021, 11, 306. [Google Scholar] [CrossRef]
  61. Shen, J.; Treu, R.; Wang, J.; Nicholson, F.; Bhogal, A.; Thorman, R. Modeling nitrous oxide emissions from digestate and slurry applied to three agricultural soils in the United Kingdom: Fluxes and emission factors. Environ. Pollut. 2018, 243, 1952–1965. [Google Scholar] [CrossRef]
  62. Räbiger, T.; Andres, M.; Hegewald, H.; Kesenheimer, K.; Köbke, S.; Quinones, T.S.; Böttcher, U.; Kage, H. Indirect nitrous oxide emissions from oilseed rape cropping systems by NH3 volatilization and nitrate leaching as affected by nitrogen source, N rate and site conditions. Eur. J. Agron. 2020, 116, 126039. [Google Scholar] [CrossRef]
  63. Basso, B.; Ritchie, J.T.; Cammarano, D.; Sartori, L. A strategic and tactical management approach to select optimal N fertilizer rates for wheat in a spatially variable field. Eur. J. Agron. 2011, 35, 215–222. [Google Scholar] [CrossRef]
  64. Cammarano, D.; Basso, B.; Holland, J.; Gianinetti, A.; Baronchelli, M.; Ronga, D. Modeling spatial and temporal optimal N fertilizer rates to reduce nitrate leaching while improving grain yield and quality in malting barley. Comput. Electron. Agric. 2021, 182, 105997. [Google Scholar] [CrossRef]
Figure 1. Optimal N application rate determination process: the red dotted lines define the N application rate when the maximum between dry biomass and N use efficiency (NUE) is reached.
Agronomy 11 00745 g001
Figure 2. Crop dry biomass (bars) and biomass N content (points) by treatment (MF: mineral fertilizer, LD: liquid digestate, LD+: liquid digestate with a nitrification inhibitor and SD: solid digestate) for both farms (F1 and F2) and crops (winter wheat and maize); * missing data. Different letters identified significant differences among treatments according to the Tukey test at p ≤ 0.05. ns = not significant.
Agronomy 11 00745 g002
Figure 3. Crop N uptake by treatment for both farms (F1 and F2) and crops (winter wheat and maize); * missing data. Different letters identified significant differences among treatments according to the Tukey test at p ≤ 0.05. ns = not significant.
Agronomy 11 00745 g003
Figure 4. The nitrogen use efficiency (NUE) (bars) and agro-environmental sustainability index (AESI) (points) by treatment for both farms (F1 and F2) and crops (winter wheat and maize). Different letters identified significant differences among treatments according to the Tukey test at p ≤ 0.05. ns = not significant.
Agronomy 11 00745 g004
Figure 5. Graphical presentation of the Nitrogen Use Efficiency (NUE) as results of the N input vs. N output. The lines corresponding to NUE = 90%, desired maximum surplus = 80 kg ha−1 yr−1, NUE = 50%, and desired minimum productivity = 80 kg ha−1 yr−1 designate the “sustainability” zone (in grey). For further details please see the EU Nitrogen Expert Panel (2015). Error bars represent the standard error.
Agronomy 11 00745 g005
Table 1. Soil profile characteristics at Farm 1 and 2.
CharacteristicUnitF1F2
0–50 cm50–90 cm90–150 cm0–50 cm50–70 cm70–100 cm100–150 cm
ApBkgCkgApEBBtC
Sandg 100 g−11010065637285
Siltg 100 g−146456424251111
Clayg 100 g−15445361112174
Bulk densityg cm−31.511.581.571.41-1.461.45
pH 8.28.98.86.77.888.7
Carbonateg 100 g−12503200028
Organic carbong 100 g−11.530.640.261.020.890.380.26
Total nitrogeng 100 g−11.300.50<0.500.870.71<0.50<0.50
Table 2. Agronomic protocol of management systems for both silage winter wheat and silage maize.
OperationFarm 1Farm 2
Winter wheatLiquid digestate application5 October 20185 October 2018
Solid digestate application5 October 20185 October 2018
Seeding16 November 201813 November 2018
Nitrate fertilization18 February 20191 March 2019
Urea fertilization1 April 20191 April 2019
Harvest20 June 201918 June 2019
MaizeLiquid digestate application25 June 201925 June 2019
Solid digestate application25 June 201925 June 2019
Seeding27 June 201927 June 2019
1° Urea fertilization12 June 201912 June 2019
2° Urea fertilization2 July 20192 August 2019
Harvest14 October 201911 October 2019
Table 3. Digestate characteristics during the experimentation at farm 1 (F1) and farm 2 (F2).
SiteDMVSTNTPTK
g 100 g−1g 100 g−1g 100 g−1g 100 g−1g 100 g−1
Liquid digestateF19.97.3 (± 0.4)0.76 (± 0.06)0.2 (± 0.08)0.52 (± 0.09)
F26.14.1 (± 0.24)0.64 (± 0.04)0.11 (± 0.04)0.36 (± 0.06)
Solid digestateF123.821.2 (± 0.96)0.69 (± 0.07)0.23 (± 0.1)0.61 (± 0.1)
F221.118.1 (± 0.84)0.7 (± 0.08)0.22 (± 0.09)0.4 ± (0.07)
DM: dry matter (105 °C oven-dried), VS: volatile solids, TN: total nitrogen, TP: total phosphorous and TK: total potassium.
Table 4. The optimum N rate, yield, nitrogen use efficiency (NUE), and agro-environmental sustainability index (AESI) results after 9 years (years: 2010-2018) DNDC simulation for both farms (F1 and F2) and crops (winter wheat and maize). MF: mineral fertilizer; LD: liquid digestate fraction; LD+: liquid digestate fraction with nitrification inhibitor; and SD: solid digestate fraction.
Optimum N Rate
(kg N ha−1)
Yield (t ha−1)NUE (%)AESI (t ha−1)
F1F2F1F2F1F2F1F2
WheatMF956010.15.7100.288.710.15
LD2501509.37.136.444.93.43.2
LD+27515010.37.135.644.73.73.2
SD3503509.48.824.323.32.32
MaizeMF19313327.21486.667.713.95.5
LD20035012.215.734.128.54.14.5
LD+27534213.315.628.728.73.84.5
SD50040023.714.829.423.673.5
Table 5. Crop trait results (plants height, leaf area index (LAI), and normalized difference vegetation index (NDVI)) for both farms (F1 and F2) and crops (winter wheat and maize). Different letters identified significant differences among treatments according to the Tukey test at p ≤ 0.05. ns = not significant.
Plants Height (cm)LAINDVI
TreatmentTreatmentTreatment
MFLDLD+SDMFLDLD+SDMFLDLD+SD
Winter wheatF1Tillering9 ns18 ns12 ns14 ns0.5 ns0.7 ns0.6 ns0.5 ns0.41 b0.78 a0.63 a0.63 a
Flag leaf21 ns28 ns27 ns35 ns1.0 b3.0 ab2.1 ab3.8 a0.62 b0.80 ab0.75 ab0.82 a
Maturity102 ab134 a100 b104 ab3.6 ns3.3 ns2.7 ns4.6 ns0.42 ns0.35 ns0.32 ns0.49 ns
F2Tillering9 ns9 ns10 ns8 ns0.4 ns0.4 ns0.4 ns0.4 ns0.45 ns0.46 ns0.46 ns0.43 ns
Flag leaf44 ns49 ns40 ns45 ns3.7 ns3.2 ns3.1 ns3.8 ns0.82 ns0.79 ns0.81 ns0.80 ns
Maturity136 ns124 ns141 ns135 ns5.0 ns3.2 ns3.9 ns4.4 ns0.70 ns0.65 ns0.68 ns0.68 ns
MaizeF1Emergence60 ns68 ns70 ns75 ns0.6 ns0.8 ns0.8 ns0.7 ns0.31 b0.48 a0.50 a0.36 ab
Flowering216 b253 ab279 a259 ab2.9 b3.9 ab4.6 a4.0 ab0.82 ns0.87 ns0.84 ns0.90 ns
Maturity285 ns289 ns306 ns306 ns5.6 ns5.9 ns6.6 ns6.2 ns0.82 ns0.79 ns0.84 ns0.79 ns
F2Emergence18 ns20 ns17 ns16 ns0.2 ns0.4 ns0.3 ns0.2 ns0.23 ns0.19 ns0.18 ns0.15 ns
Flowering196 ns194 ns198 ns214 ns2.8 ns2.7 ns2.3 ns3.9 ns0.87 ns0.86 ns0.83 ns0.79 ns
Maturity303 ns282 ns290 ns351 ns6.0 ns5.5 ns5.4 ns4.9 ns0.80 ns0.76 ns0.82 ns0.77 ns
MF: mineral fertilizer; LD: liquid digestate; LD+: liquid digestate with a nitrification inhibitor; and SD: solid digestate.
Publisher’s Note: MDPI stays neutral with regard to jurisdictional claims in published maps and institutional affiliations.

