Abstract
The increase in irrigated maize plantings in Northern China has increased the demand for irrigation water in the region, resulting in chronic water shortages in drier years. Efficient irrigation and water use are essential for the sustainable development and management of water resources in the area. This research applied DSSAT-maize in the Loess Plateau (Fenhe basin) to determine the suitable irrigation management and optimum sowing dates to ensure the stability of spring maize production. The model was calibrated using the full irrigation treatment of 2017–2019 growing seasons. Crop data, such as plant phenological phases, aboveground biomass, crop yield, and leaf area index, were used for model calibration. The calibration showed great consistency between the measured and simulated data, with nRMSE (normalized root mean square error) ranging from 0.77% to 21.6%. The field values of crop yield, aboveground biomass, LAI, soil water content, and water use efficiency were used to evaluate the calibrated model’s performance, the model evaluation was found to be satisfactory with acceptable nRMSE ranging from 1.9% to 25.3%. Optimum simulated sowing dates for increased productivity and water efficiency were between 15 and 25 May. The optimum irrigation timing and volume of irrigation water application were 85 mm at the tasseling phase and 85 mm at the grouting phase respectively. Therefore, the yield of maize can be increased by applying irrigation and altering the sowing date in case rainfall is insufficient to satisfy the water demand of the crops in the Fenhe basin.
1. Introduction
The Loess Plateau (Shanxi Fenhe basin) of the northern part of China is a semi-arid region. Spring maize is among the region’s most important crops accounting for more than 25% of the total arable land [1]. The spring maize participates in promoting economic growth and ensuring food security in this area [2]. Additionally, for worldwide maize production, China is the second producer following the United States. Therefore, the production of maize in China has a significant impact on the world’s economy. In previous years, maize and other cereals’ improvement in China have been recognized as one of the most outstanding achievement stories in agricultural science and technology policy reform [3,4].
However, water resources in semi-arid areas are limited, and the need for water for domestic use, irrigation, and nature’s services (agroecosystems, forest ecosystems, grassland ecosystems, and aquatic ecosystems) is rising [5]. This suggests that, for the sustainable management of agriculture and related resources, it is essential to increase the amount of beneficial water in agriculture and reduce the amount of non-beneficial water [6,7]. Farmers in China, just like elsewhere in the world, face some technical challenges, such as a lack of information on the exact amount of water required for the crop to grow up, the appropriate time to irrigate a crop, the optimum amount of water a particular crop needs for optimum yield, and how much water can be saved through proper irrigation management [8]. In this region, farmers can carry out additional irrigation at many development phases of crops to avoid the impact of water stress [5]. Relevant literature shows that during water shortage conditions, the use of irrigation schemes depend on additional irrigation can potentially increase grain production [9]. Supplementary irrigation can provide the needed quantity of water at different phases of crops in order to minimize the negative effect of water scarcity on plants [10]. Nowadays, this practice is dependent on agriculture models to ameliorate irrigation management.
In previous years, several crop system models have been developed, like the Decision Support System for agrotechnology Transfer (DSSAT) [11], Food Agriculture Organization (FAO) Aqua crop model [12], the Agricultural Production Systems Simulator (APSIM) [13], etc. Crop system models have been used to simulate agricultural practices and help calibrate and evaluate many aspects of the relationship between the factors affecting plant development and production [11]. Those factors include soil type, cultivar selection, sowing date, seeding rates, fertilizer, irrigation management, and weather patterns [14]. DSSAT is the most commonly used model for simulating biomass and yield production. The DSSAT model is a multipurpose model that has been applied for the evaluation of crop development, such as crop phenology, biomass, and yield production [15]. The CERES-maize model within DSSAT can accurately predict soil moisture at various levels under fully irrigated conditions [16,17]. Using long-term weather information to identify the best sowing dates DSSAT CERES-maize model was used for yield prediction under various irrigation scenarios [12,18] and production forecast response to climate change [19].
In addition to agronomic practices and irrigation systems, the sowing date is critical for maximizing maize production (grain yield and biomass). As a result, farmers must be aware of the yield response of maize to the sowing date. Inaccurate sowing time can lead to critical damage or limit the plants’ growth and development [20]. Furthermore, the optimum sowing time may change from region to region, depending on climate differences. The DSSAT model has been used in several parts of China in recent years, such as Northwest China [21]. Herein, our work found that it is also important to conduct research using the DSSAT model in the Loess Plateau to predict maize production using sowing dates and irrigation strategies under various climatic conditions. Therefore, it is crucial to determine the optimum irrigation management and sowing dates under different weather conditions [5]. For this context, the major objective is to minimize crop water stress and enhance productivity through irrigation in the current study area. Additional objectives include (1) calibrating and evaluating the DSSAT CERES in the Fenhe basin, and (2) using the DSSAT model to determine the best maize sowing day and irrigation quantity to enhance maize production via rainfall and irrigation scenarios.
2. Research Area and Data
2.1. Research Area
Experiments were carried out at the Fenhe River Basin Experiment Station (37°17′ N, 112°12′ E, altitude 750 m) in Wenshui County, Shanxi Province, Northern China, in 2017–2019 Figure 1. The climate in the research area is temperate continental semi-arid with 450 mm of average rainfall, average annual evaporation of 1563.3 mm (20 cm evaporating pan), and average annual minimum and maximum air temperatures of 3.1 °C and 16 °C, respectively. Daily minimum and maximum air temperature (°C) and precipitation (mm) during the growing season (2014–2019) were obtained at the Wenshui meteorological station Figure 2. Soil samples were taken at various intervals down to 1.5 m soil depth and used to determine the fundamental soil properties of the research area Table 1.
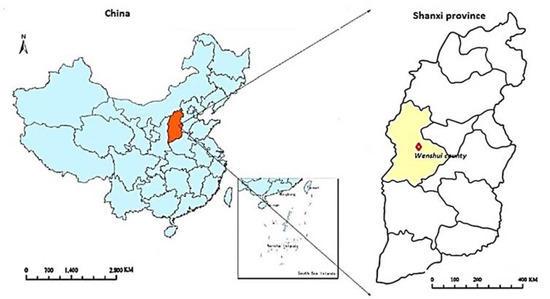
Figure 1.
Study area map.
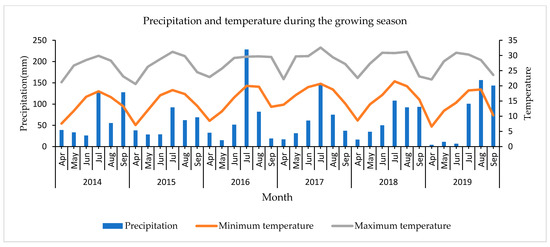
Figure 2.
Average monthly precipitation and temperature during the growing season (2014–2019) at the Wenshui Experiment Station, Shanxi, China.

Table 1.
Soil properties in Wenshui Shanxi province.
2.2. Datasets
2.2.1. Information on Crop Management and Irrigation
The Denghai 679 maize variety which is widely promoted and planted in this study area, was used in the experiment. Maize seeding took place on the 20 April, 30 April, and 8 May in the 2017–2019 growing seasons, respectively. The maize planting density was 6 plants/m2, the row spacing was 65 cm, and the plant spacing was 32 cm. The plot size was 8.9 m long, 7.5 m wide, and 66.75 square meters of area. In this study, the sprinkler irrigation method was used, the irrigation was applied in the case soil water content dropped to 50% of field capacity. The irrigation treatments received 100% (full irrigation), 75%, and 50% of applied irrigation volume. However, water was delivered through hoses, while irrigation water was measured by water meters. By using the partial orthogonal experimental design process, nine deficit irrigation treatments were planned, with triplicate for experiments in 2017–2019. Table 2 describes the design method and amount of irrigation water applied in the Fenhe basin.
Table 2.
Irrigation design method and amount of irrigation applied in 2017, 2018, and 2019.
2.2.2. Sampling and Laboratory Procedures
- Yield and aboveground biomass
Plant size (height and stem thickness) was measured every week, with ten plants randomly selected at each plot. For each plot, crop phenology was measured three times per week. All crop phenology phases (emergence, anthesis, and maturity phases) were recorded in form of the year’s day. All plants were harvested near the ground for aboveground biomass, and fresh weight was weighed. Sub-samples were heated for 0.5 h at 110 °C and dried to a constant weight at 80 °C. The middle two rows of each plot were hand-harvested for grain yield measurement at harvest time. Grain yield from shelled ears was determined and adjusted to 14% moisture content.
- Leaf area index (LAI)
The measurements for leaf area were taken seven times during the planting period at various growth phases, the leaf area index (LAI) was calculated, from the sampled plants, the length and the width of each leaf was measured, and the leaf area was calculated using Equation (1):
Leaf area = length × width × 0.75
The leaf area index (LAI) obtained by using Equation (2):
LAI = leaf area(m2plant−1) × plant density (plant ha−1)/10,000 m2ha−1
- Soil water content
The soil moisture content, was measured during the growing season, before the sowing time, a day before and after every irrigation, and at harvest time. Samples were collected at different intervals down to a 1.5 m soil depth using a 5-cm diameter corer. Soil cores were weighted while they were still wet, then oven-dried to 105 °C until constant weight and then were measured on a dry weight basis Gravimetric water content obtained by the Equation (3):
Water content = (Wet weight − Dry weight)/Dry weight
- Water Use Efficiency
Water use efficiency calculated by Equation (3):
where Y is the grain yield (kg/ha), and ETc is the seasonal crop evapotranspiration (mm). For each irrigation treatment, the seasonal crop evapotranspiration was calculated. Using Equation (5):
where P is the total precipitation(mm), I is the irrigation volume (mm), and D (mm) is the downward drainage out of the root zone, during the growing season, soil water consumption was less than the field water holding capacity of the root zone, thus it was ignored. R(mm) is the runoff, since the rainfall was not intense and the area was flat, and was assumed to be zero. DS is the variation in soil water content, ES is the soil evaporation, and EP is the transpiration.
WUE = Y/ETc
ET= P + I − D − R ± ∆s.
∆s = I + P − ES − EP − D − R
3. Methodology
3.1. Description, Calibration, and Evaluation of the DSSAT Model
In terms of the human-computer interface, the DSSAT model is one of the more intuitive crop models. The first version of DSSAT, Version 2.1, was released in 1989. The most recent version of DSSAT, 4.7, can simulate more than 42 different types of crops [11]. Initial soil conditions daily weather data, detailed crop management, and various crop cultivar coefficients are all necessary inputs for the DSSAT version 4.7 module [22].
In this research, the CERES-maize model within DSSAT 4.7 was used. The CERES-maize model inputs include cultivar coefficients, daily weather data, soil information, crop management practices, planting density, and sowing dates [23]. For calibration of the model and maize cultivar coefficient estimation, the essential crop data (aboveground biomass, crop physiological phases, final grain yield, and leaf area index) during the three growing seasons (2017–2019) were chosen, from the full irrigation treatment (T1). The genetic coefficient for the spring Denghai 679 cultivar was calculated using the DSSAT-GLUE package within the DSSAT model.
The DSSAT model performance was evaluated using the field values, aboveground biomass crop yield, LAI, and soil water content selected from the remaining irrigation scenarios (T2–T9) of the 2017–2019 growing seasons. This study used three common statistical indicators for model evaluation; RMSE (root mean square errors), nRMSE, and d-index value:
Here, n is the number of observations, Si is the i-th measurement of simulated values, Mi is the i-th measurement of measured values, M is the average of observed values, Si’ = Si − M and Mi = Mi − M.
The lower value for nRMSE and the higher value for d-index indicate that the measured and simulated data are well fitted.
In general, when nRMSE < 10% model performance is great, when 20% > nRMSE > 10% it is considered good, when 20% < nRMSE < 30% the model performance is fair, and when 30% < nRMSE it is considered to be poor [24].
3.2. Crop Cultivar Coefficient
To simulate crop growth rates, biomass yield, and other factors, crop cultivar coefficients are required [25]. There are six genetic coefficients in CERES-maize; degree days (base 8 °C) from emergence to the end of the juvenile phase(P1), coefficient of photoperiod sensitivity (P2), from silking to physiological maturity in degree days (base 8 °C) (P5), the number of potential kernels (G2), the rate of potential kernel growth mg/(kernel d)(G3), and PHINT, degree days it takes for a leaf tip to emerge (phyllochron interval)(°C d) [26].
Table 3 describes the calibration of the genetic coefficients of the Denghai 679 obtained from the GLUE program.
Table 3.
Genetic parameters of Denghai 679.
3.3. Simulation Controls
3.3.1. Sowing Date Treatments
The DSSAT model’s seasonal software was used in the simulation of yield for various planting dates. To decide the optimum sowing date based on various irrigation scenarios in the Fenhe basin, the seasonal analysis was conducted, using six years of historical weather information from the Wenshui weather Station. Different crop parameters like crop cultivar, crop management data and others. Sowing dates were chosen, at five-day intervals, between 20 April and 20 June for the study of optimum sowing date. The simulation results are represented in a table and by Box [27].
3.3.2. Irrigation Strategies
The irrigation treatments were adjusted based on the various stages of crop development—emergence, jointing, tassel, grouting, and maturity phases—with various irrigation scenarios. Thirty-two irrigation schedules through different combinations of phenological periods used in simulation: no irrigation, single irrigation, double irrigation, triple irrigation, quadruple irrigation, and quintuple irrigation (85 mm of water per each irrigation) Table 4. Each simulation is carried out with the hypothesis of no nutrition stress.
Table 4.
Irrigation treatments simulated with the CERES-maize model.
4. Results and Discussion
4.1. Model Calibration
During the model’s calibration, the different parameters of treatment one (T1) were simulated during the growing season of 2017–2019. Table 5 shows the differences in emergence, anthesis, aboveground biomass, maturity grain yield, and maximum leaf area index between measured and simulated results. The simulated emergence date differed by 1–2 days from the observed emergence date with nRMSE% range between 0.83 and 1.45, simulated and measured of anthesis date varying between 2–5 days with nRMSE% ranging between 0.99 and 2.42, and a predicted maturity date ranging from two to three days and nRMSE% from 0.81 to 1.16. The results indicate that the simulated aboveground biomass, grain yield, and leaf area values were in excellent accordance with measured values, the nRMSE (%) range between 4.1% and 21.6% [17]. Thus, the CERES-maize model can simulate yield potential in the research area.
Table 5.
The simulated and observed results of the CERES-maize of (T1) during 2017, 2018, and 2019 growing seasons.
4.2. Model Evaluation
4.2.1. Aboveground Biomass and Grain Yield
The DSSAT CERES-maize model evaluated by comparing simulated and measured aboveground biomass and grain yield under various irrigation treatments (T2–T9). Analytical statistics shows that the RMSE of the measured and the predicted grain yields ranged between 129 kg to 1084.7 kg/ha, d-index ranged from 0.59–0.98, and nRMSE of 1.9%, 4.04%, and 13%, during the 2017–2019 growing period, respectively Figure 3. Aboveground biomass showed concordance between measured and predicted data, with the RMSE ranging between 624 and 1927.91 kg/ha, the nRMSE ranging from 4.02% to 12.7%, and the d-index ranging from 0.86 to 0.89. Predicted aboveground biomass and crop yield results are related to the results presented by [28]. The objective of this analysis was to study how well the model predicts the impact of various irrigation methods on aboveground biomass and grain yield. The predicted and the measured outcomes show that the DSSAT model can effectively calibrate and predict the biomass and yield under various irrigation managements.
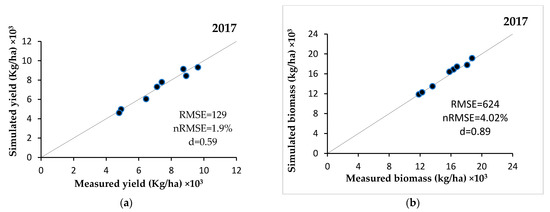
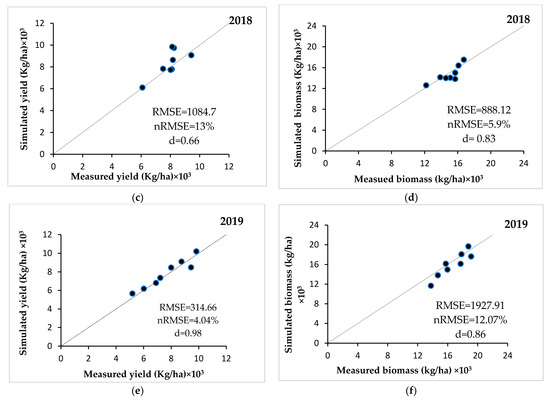
Figure 3.
Comparison between measured and simulated grain yield (a,c,e) and aboveground biomass (b,d,f) under various irrigation treatment for 2017–2019 growing seasons.
4.2.2. Leaf Area Index
To evaluate the model using the Leaf Area Index, we used 2017 growing season irrigation treatments (T2–T9). Measured and predicted leaf area index were in accordance, with nRMSE of 16.9% and d index of 0.79 Figure 4. During the first days of the growing season, the simulation of LAI was almost identical to the observed LAI. After 75 days, the difference between measured and simulated data for every treatment seems to increase slightly, as discussed earlier by [27]. The model outcomes indicate that after 75 days during the growth period, LAI decreases to these outcomes are consistent with past studies that used the DSSAT model [29].
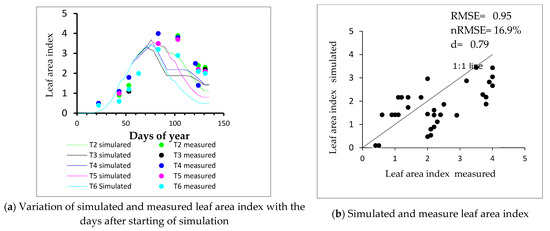
Figure 4.
The 2017 growing season simulated and measured leaf area indices.
4.2.3. Soil Water Content
Since one of our objectives was to analyze the best use of irrigated water when water availability is scarce, it was necessary to check whether the model can also correctly simulate soil water content. To simulate soil moisture at various soil depths (0–15 cm, 15–60 cm, 60–100 cm, and 100–150 cm), the model used the full irrigation treatment of the 2017 growing season. The results in Figure 5 show the nRMSE values ranged between 2.3% and 25.3%, the RMSE of the entire soil profile between the predicted and observed soil moisture content range was from 0.01 to 0.54, and the d-index values for all soil levels ranged between 0.12 and 0.62. The measured and simulated soil water content of soil levels under 60 cm (60–150 cm) showed a good agreement, compared to soil levels above 60 cm, this reported in previous studies [8]. Moreover, many related studies have shown the model can correctly simulate the soil water content of various soil levels.
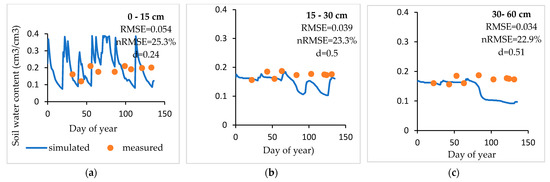
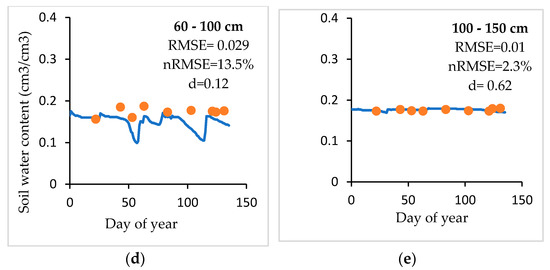
Figure 5.
Measured and simulated soil water content at various soil levels of the 2017 growing season. (a–e) Simulated and measured soil water content at a depth of 0–15 cm, 15–30 cm, 30–60 cm, 60–100 cm, and 100–150 cm, respectively.
4.2.4. Water Use Efficiency
Water usage efficiency was measured and simulated for the 2017 and 2019 growing seasons, and the results showed a good agreement with nRMSE ranging from 2.6% to 9.6% and 3.5% to 8.5%, respectively. The rain-fed measured and simulated water use efficiency during the 2017 growing season was 15.6 and 14.1 kg ha−1 mm−1, respectively. During the 2019 growing season, the measured and simulated rain-fed water use efficiency was 15.2 and 13.9 kg ha−1 mm−1, respectively Table 6. The measured and simulated WUE values for full irrigation in both growing seasons are very close. In comparison to limited irrigation, water use efficiency for full irrigation was accurately simulated. Simulated water use efficiency for T1 in both the 2017 and 2019 growing seasons was comparable to irrigation treatments T4, T7, and T9 WUE, showing that deficit irrigation could improve the water use efficiency.
Table 6.
Measured and simulated water use efficiency for maize during the 2017 and 2019 growing periods.
4.3. Model Application
4.3.1. Optimum Sowing Date
The DSSAT CERES-maize model’s seasonal analysis revealed that different irrigation scenarios and planting dates influenced grain yield at different crop development stages. Table 7 shows the simulated seasonal grain yield results under 32 scenarios of irrigation, the simulated grain yield under rainfed conditions and full irrigation treatment (I32) are box plotted in Figure 6. The simulated results showed that under all irrigation scenarios the maximum yields were obtained from 15 to 25 May (20 May with the highest average maximum yield). Moreover, results show that changing the sowing date from 20 April to 20 May results in a continuous increase in yield from 8264 kg/ha to 10,047 kg/ha under all irrigation strategy scenarios, and that delayed sowing dates to 25 May showed a significant decrease in yields Figure 6. For several years in this area, sowing dates were suggested based on local farmer’s experience rather than local climate conditions. This study revealed that grain yield depends on sowing dates with respect to irrigation and climate conditions.
Table 7.
Simulated yield under different irrigation scenarios using six years (2014–2019) of weather data with various sowing dates.
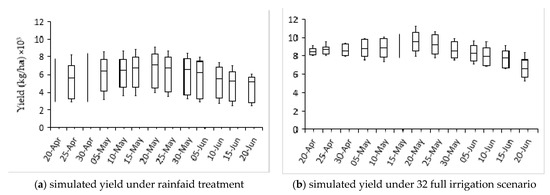
Figure 6.
Simulated yield under rainfed conditions and the full irrigation scenario (I32) using six years (2014–2019) weather data with various sowing dates.
4.3.2. Impact of Irrigation on Maize Yield
After determining the best sowing date 20 May, the next step was to determine the best irrigation phases with the required amount of irrigation to apply during the crop growth period. In the DSSAT model, 32 different irrigation scenarios were set Table 4, simulated using six years of weather data (2014–2019) from the Wenshui meteorology station, received precipitation during a growing period range between 318 mm and 420 mm Figure 2.
Figure 7 shows the variability of the simulated yield of spring maize based on climatic data between 2014 and 2019. The maximum yield, was obtained in 2018 and the low yield was obtained in 2019 and 2016 as a result of heavy rainfall during the spring maize growth period in both years. The maize yield was lower in 2019 because most precipitation was in August and September with less precipitation in June.
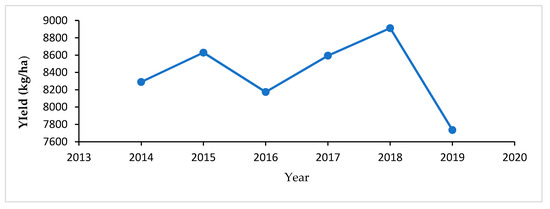
Figure 7.
Simulated maize yields under different seasonal climatic conditions (2014–2019).
The yield of maize grain increases as the volume of supplementary irrigation increases. Single irrigation (85 mm) at the tassel and grouting phases increased maize production from 7250 to 8882 kg/ha, and 6803 to 8820 kg/ha, respectively Figure 8. However, the maize yield did not increase at the emergency, jointing, and maturity phases compared to irrigation applied at the tassel and grouting phases. These two phases are the critical phases determining the final yield of maize. At these phases, maize needs more water, nutrients, temperature, and light [8,30]. In the double irrigation (I14) scenario, 85 mm of water was applied at the tasseling phase, and 85 mm at the grouting phase yield range was between 8605.5 and 10,069 kg/ha. In triple irrigation, higher grain yields were obtained in I17, I20, and I25 irrigation scenarios. In the I17 irrigation scenario 85 mm was applied at the tasseling, grouting, and maturity stage grain yield was between 8693.3 and 9926 kg/ha. In the I20 irrigation scenario 85 mm was applied at jointing, tasseling, and grouting phase grain yield was between 8946.7 and 9927 kg/ha. In the I25 irrigation scenario 85 mm was applied at emergence, tasseling, and grouting phases grain yield was between 8413.7 and 9843 kg/ha. The yield was between 9002.2 and 9981 kg/ha for the quadruple irrigation scenario (I31), where 85 mm of water was applied at the jointing, tasseling, grouting, and maturity phases.
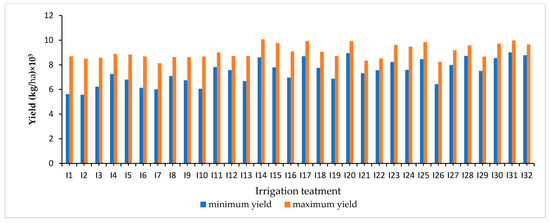
Figure 8.
Simulation results of maize yield under different irrigation combinations based on six years of historical weather data from 2014 to 2019.
Furthermore, the irrigation scenario (I14) yielded results that were slightly similar to those of the three irrigation (255 mm) and four irrigation application scenarios (350 mm). In contrast, to irrigation scenarios with high irrigation volumes (I17, I20, I23, and I31), a double irrigation treatment I14 (170 mm) is more effective for achieving a higher yield Figure 8. These findings indicate that irrigation application has a significant effect, on spring maize production, under the restricted supply of irrigation water in the Fenhe basin. If irrigation water supplies are insufficient, it is critical to consider the irrigation at the tasseling and grouting phases during the crop growth period. When there is no irrigation applied during these two phases, this may cause plant stress and low yield, These results are confirmed by the findings of our study [30].
4.3.3. The CERES-Maize Model Benefits
After model calibration and evaluation, the seasonal analysis tool within the DSSAT model was used to analyze the best use of irrigation water management and optimum sowing date in order to maximize maize crop yield in the Fenhe irrigation district. This study proves that in this location changing, the sowing date from 20 April to 20 May results in increasing the yield from 8264 kg/ha to 10,047 kg/ha, around 20% of the yield productivity, and the study proves that sowing after 25 May will decrease the yield production Figure 6. Furthermore, this study discovered that, in the case of a water shortage, well-organized irrigation timing and irrigation volume application could help save irrigation water. Regarding [26], after reaching the tasseling and grouting phases, the maize plants grow vigorously. At this phase, a shortage of water causes poor crop growth. Therefore, it is important to irrigate maize during the tasseling and grouting phases, to compensate for the lack of precipitation in this area.
According to the local farmers, the current irrigation quantity in the area is 425 mm per single irrigation [31]. Whereas the model simulation shows that the minimum amount of water required to ensure that the irrigation needs are met is 170 mm, with 85 mm during the tasseling process, and 85 mm during the grouting phase. As a result, 225 mm of water would be saved. Therefore, in consideration of the actual irrigation situation in the region, the irrigation of maize at the tasseling and grouting phases, with an irrigation volume of 170 mm, is highly recommended.
The crop model can effectively simulate and predict the optimum irrigation management and best planting time. The DSSAT crop growth model is widely recommended and is extremely effective in assessing the result of the amount of irrigation applied and the date of sowing on crop yields. However, this study only conducted simulation studies in a small region (the Fenhe basin). Further simulation studies should be carried out within a larger regional area. Additionally, we have only used six years of weather data; in future studies a longer range of years should be considered to provide a more accurate simulation.
5. Conclusions
The CERES-maize model was applied to the Fenhe basin, the measured and simulated values of maize yield, aboveground biomass, phenology, leaf area index, and soil moisture are in good agreement. The model proposed that, for the dates from 15 to 25 May, 20 May is optimal for maximum crop yield. Simulation of the model for choosing the optimum irrigation amount and time was performed with various irrigation scenarios at different maize growth phases. As a result, the best irrigation timing is during the tasseling and grouting phase, with an optimum amount of irrigation of 170 mm during the spring maize-growing period. At these two phases, crops must be irrigated because less precipitation or less irrigation causes crop stress. Irrigation application at tasseling and grouting phases could produce a similar grain yield as obtained from irrigation applications with a higher amount of water (255 mm, 350 mm, and 422 mm) of water with no crop stress. In general, the CERES-maize model revealed that the consequences of low rainfall or low availability of water on agricultural output could be adjusted by taking into account the amount of irrigation water and sowing date in a systematic manner.
All these estimates will assist farmers with productive crop production and provide a partial basis for policymakers in preparing irrigation systems when water is scarce.
Author Contributions
J.M. and P.R. conceived and designed the experiments; P.R., J.M., and L.Z. performed the experiments; C.W., J.M., P.R., L.Z., and E.L. corrected and analyzed the data; P.R. and L.Z. wrote the paper. J.M., L.Z., and P.R. revised the paper, J.M. supervised this work. All authors have read and agreed to the published version of the manuscript.
Funding
This research was supported by Key research and development projects of Shanxi Province (201703D211002-7).
Institutional Review Board Statement
Not applicable.
Informed Consent Statement
Not applicate.
Data Availability Statement
Not applicate.
Conflicts of Interest
The authors declare no conflict of interest.
References
- Cooney, D.; Kim, H.; Quinn, L.; Lee, M.-S.; Guo, J.; Chen, S.-L.; Xu, B.-C.; Lee, D.K. Switchgrass as a bioenergy crop in the Loess Plateau, China: Potential lignocellulosic feedstock production and environmental conservation. J. Integr. Agric. 2017, 16, 1211–1226. [Google Scholar] [CrossRef]
- Wang, G.; Huang, J.; Guo, W.; Zuo, J.; Wang, J.; Bi, J.; Shi, Z.H.J. Observation analysis of land-atmosphere interactions. J. Geophys. Res. 2010, 115. [Google Scholar] [CrossRef]
- Zhonghu, H.; Xial, X.; Shaobing, P.; Thomas, A.L. Meeting demands for increased cereal production in China. J. Cereal Sci. 2014, 59, 235–244. [Google Scholar]
- Diao, X. Production and genetic improvement of minor cereals in China. Crop J. 2017, 5, 103–114. [Google Scholar] [CrossRef]
- Saddique, Q.; Cai, H.; Ishaque, W.; Chen, H.; Chau, H.W.; Chattha, M.U.; Hassan, M.U.; Khan, M.I.; He, J. Optimizing the sowing date and irrigation strategy to improve maize yield by using CERES (crop estimation through resource and environment synthesis)—Maize model. Agronomy 2019, 9, 109. [Google Scholar] [CrossRef]
- Deng, X.-P.; Shan, L.; Zhang, H.; Turner, N.C. Improving agricultural water use efficiency in arid and semiarid areas of China. Agric. Water Manag. 2006, 80, 23–40. [Google Scholar] [CrossRef]
- Hsiao, T.C.; Steduto, P.; Fereres, E. A systematic and quantitative approach toimprove water use efficiency in agriculture. Irrig. Sci. 2007, 25, 209–231. [Google Scholar] [CrossRef]
- Yiwen, J.; Zhanga, L.; Baoqing, Z.; Chansheng, J.; Xin, H.; Xiao, B. Modeling irrigation management for water conservation by DSSAT-maize model in arid northwestern China. Agric. Water Manag. 2016, 177, 37–45. [Google Scholar]
- Benjamin, J.; Nielsen, D.; Vigil, M.; Mikha, D.; Calderon, F. Cumulative deficit irrigation effects on corn biomass and grain yield under two tillage systems. Agric. Water Manag. 2015, 159, 107–114. [Google Scholar] [CrossRef]
- Nikolaou, G.; Neocleous, D.; Christou, A.; Kitta, E.; Katsoulas, N. Implementing sustainable irrigation in water-scarce regions under the impact of climate change. Agronomy 2020, 10, 1120. [Google Scholar] [CrossRef]
- Jones, J.W.; Hoogenboom, G.; Porter, C.H.; Boote, K.J.; Batchelor, W.D.; Hunt, L.A.; Wilkens, P.W.; Singh, U.; Gijsman, A.J.; Ritchie, J.T. The DSSAT cropping system model. Eur. J. Agron. 2003, 18, 235–265. [Google Scholar] [CrossRef]
- Wang, M.; Li, Y.; Ye, W.; Bornman, J.F.; Yan, X. Effects of climate change on maize production, and potential adaptation measures: A case study in Jilin Province, China. Clim. Res. 2011, 46, 223–242. [Google Scholar] [CrossRef]
- McCown, R.L.; Hammer, G.L.; Hargreaves, J.N.G.; Holzworth, D.; Huth, N.I. APSIM: Anagricultural production system simulation model for operational research. Math Comput. Simul. 1995, 39, 225–231. [Google Scholar] [CrossRef]
- Yang, Z. Estimating CSM-CERES-maize genetic coefficients and soil parameters and evaluating model response to varying nitrogen management strategies under North Carolina conditions. In Estimating CSM-CERES-Maize Genetic Coefficients; ProQuest: Raleigh, NC, USA, 2008; p. 188. [Google Scholar]
- Abedinpour, M.; Sarangi, A. Evaluation of dssat-ceres model for maize under different water and nitrogen levels. Pertanika J. Sci. Technol. 2018, 26, 1605–1618. [Google Scholar]
- Sinan, G.; Mustafa, O. Evaluation of CERES-maize simulation model results with measured data using waterpillow irrigation under semi-arid climatic conditions. Afr. J. Agric. Res. 2010, 5, 606–613. [Google Scholar]
- Béchir, B.N.; Katerji, N.; Mastrorilli, M. Using the CERES-Maize model in a semi-arid Mediterranean environment. Evaluation of model performance. Eur. J. Agron. 2000, 13, 309–322. [Google Scholar]
- Soler, C.M.T.; Sentelhas, P.C.; Hoogenboom, G. Application of the CSM-CERES-Maize model for planting date evaluation and yield forecasting for maize grown off-season in a subtropical environment. Eur. J. Agron. 2007, 27, 165–177. [Google Scholar] [CrossRef]
- Yun, J.I. Predicting regional rice production in South Korea using spatial data and crop-growth modeling. Agric. Syst. 2003, 77, 23–38. [Google Scholar] [CrossRef]
- Angel, M.; Astrid, B.; Francisca, S.; Jaume, L. Sowing date affects maize development and yield. Agriculture 2019, 9, 67. [Google Scholar]
- Jianmei, J.; Huanjie, C.; Jiangqiang, H.; Wang, H. Performance evaluation of CERES-Wheat model in Guanzhong plain of Northwest China. Agric. Water Manag. 2014, 144, 1–10. [Google Scholar]
- Hoogenboom, G.; Jones, J.W.; Wilkens, P.V.; Porter, C.H.; Boote, K.J.; Hunt, L.A.; Singh, U.; Lizaso, J.L.; White, J.W.; Uryasev, O.; et al. Decision Support System for Agrotechnology Transfer (DSSAT) Version 4.5; University of Hawaii: Honolulu, HI, USA, 2020. [Google Scholar]
- Adnan, A.A.; Diels, J.; Jibrin, J.M.; Kamara, A.Y.; Shaibu, A.S.; Craufurd, P.; Menkir, A. CERES-Maize model for simulating genotype-by-environment interaction of maize and its stability in the dry and wet savannas of Nigeria. Field Crops Res. 2020, 253, 107826. [Google Scholar] [CrossRef]
- Anothai, J.; Soler, C.M.T.; Green, A.; Trout, T.J.; Hoogenboom, G. Evaluation of two evapotranspiration approaches simulated with the CSM–CERES–Maize model under different irrigation strategies and the impact on maize growth, development and soilmoisture content for semi-arid conditions. Agric. For. Meteorol. 2013, 176, 64–76. [Google Scholar] [CrossRef]
- Liu, S.; Yang, J.Y.; Zhang, X.Y.; Drury, C.F.; Reynolds, W.D.; Hoogenboom, G. Modellingcrop yield, soil water content and soil temperature for a soybean–maizerotation under conventional and conservation tillage systems in Northeast China. Agric. Water Manag. 2013, 123, 32–44. [Google Scholar] [CrossRef]
- Guo, R.; Lin, Z.; Mo, X.; Yang, C. Responses of crop yield and water use efficiency to climate change in the North China Plain. Agric. Water Manag. 2010, 97, 1185–1194. [Google Scholar] [CrossRef]
- Zhao, P.; Zhou, Y.; Li, F.; Ling, X.; Deng, N.; Peng, S.; Man, J. The adaptability of APSIM-wheat model in the middle and lower reaches of the Yangtze river plain of China: A case study of winter wheat in Hubei province. Agronomy 2020, 10, 981. [Google Scholar] [CrossRef]
- Basso, B.; Ritchie, J. Simulating crop growth and biogeochemical fluxes in response to land management using the SALUS model. In The Ecology of Agricultural Landscapes: Long Term Research on the Path to Sustainability; Hamilton, S.K., Doll, J.E., Robertson, G.P., Eds.; Oxford University Press: New York, NY, USA, 2015. [Google Scholar]
- DeJonge, K.; Ascough, J.; Andales, A.; Hansen, N.; Garcia, L.; Arabi, M. Improving evapotranspiration simulations in the CERES-Maize model under limited irrigation. Agric. Water Manag. 2012, 115, 92–103. [Google Scholar] [CrossRef]
- Shen, H.; Chen, Y.; Wang, Y.; Xing, X.; Ma, X. Evaluation of the potential effects of drought on summer maize yield in the Western Guanzhong Plain, China. Agronomy 2020, 10, 1095. [Google Scholar] [CrossRef]
- Zhai, B.; Fu, Q.; Li, T.; Liu, D.; Ji, Y.; Li, M.; Cui, S. Rice irrigation schedule optimization based on the aquacrop model: Study of the Longtouqiao irrigation district. Water 2019, 11, 1799. [Google Scholar] [CrossRef]
Publisher’s Note: MDPI stays neutral with regard to jurisdictional claims in published maps and institutional affiliations. |
© 2021 by the authors. Licensee MDPI, Basel, Switzerland. This article is an open access article distributed under the terms and conditions of the Creative Commons Attribution (CC BY) license (https://creativecommons.org/licenses/by/4.0/).