Abstract
“Spicy pepper” is a term used to describe a variety of “pungent” peppers, sometimes referred to as hot, chili, or chile. The USDA reports that the per capita availability of chile peppers has increased more than 100% since the early 1980s. While the availability of spicy peppers has increased, easily accessible data regarding which varieties are consumed, how they are used by households, and who is most likely to consume them is not available. This paper provides insights into U.S. spicy pepper production and consumption as provided by a review of existing trade data and a survey of U.S. consumers.
1. Introduction
The number of people originally from other countries living in the United States, i.e., the “foreign-born” population as defined by the U.S. Census, was nearly 45 million in 2019 [1]. The percentage of the foreign-born population increased from a low of 5% in 1970 to nearly 14% in 2019. Today immigration accounts for 38% of the U.S. population growth rate [2]. Immigrants to the U.S. come from many different countries for numerous reasons including work, family, school, and safety. In 2019, more than 1 million people coming from more than 200 countries received lawful permanent resident status [3] (Figure 1). These individuals live throughout the U.S. [4]. Immigration to the U.S. has resulted in an increasingly diversified population.
Figure 1.
Region of birth for people receiving lawful permanent resident status in 2019. Source: USDHS, 2019 [3].
Immigrants often bring their cultures with them. Culture can be defined as “the distinctive ideas, customs, social behaviors, products, or way of life of a particular nation, society, people, or period” [5]. Cultural habits or customs are often developed during childhood and internalized such that they are difficult to change [6]. Cultures are often associated with a population’s food tastes and preferences and culinary practices. Other factors often linked to food preferences include religion, occupation (income), geographical factors (distance to food stores), age, ethnicity, and health [7].
Peppers, specifically spicy peppers, is a vegetable group common in many cultures. The term “Spicy pepper” is used to describe a variety of “pungent” peppers, sometimes referred to as hot, chili, or chile. The pungency of spicy peppers is most often measured using the Scoville scale created by Wilbur Scoville in 1912. The scale is a measure of how many times a pepper sample is diluted with water until taste-test participants could no longer feel heat. Today the heat of chile pepper cultivars ranges from zero Scoville Heat Units (SHU) to more than 2 million SHU [8].
Pepper production and consumption data reported by the USDA is commonly reported for two groups; (1) “peppers” or “Bell peppers” and (2) “chile peppers”. The chile peppers are represented by a combined group of spicy pepper varieties and/or cultivars. Chile peppers are, or can be grown, in most U.S. states, although the majority of commercial chile pepper production, 100% in 2020, is centered in New Mexico and California. The production from these two states are generally long green chiles referred to as New-Mexico type chile or Anaheim chile.
Per capita consumption of fresh chile peppers has increased from just over three pounds per person in 1980 to more than seven pounds per person in 2020 (Figure 2). While per-capita consumption has increased significantly over the last 40 years (135%), the majority of the increased demand has been satisfied by imports. Figure 3 shows that over the same 1980–2020 period, domestic chile pepper production declined more than 50% (nearly 75% from its peak in 1992) while imports increased by more than 950% [9].
Figure 2.
Per capita chile pepper consumption, 1980–2020. Source: USDA-ERS [9].
Figure 3.
Chile pepper production, exports, and imports, 1980–2020. Source USDA-ERS [9].
The long-term decline in chile pepper production is the result of many factors including domestic labor availability, cost differentials between chile pepper producing countries, and profits for U.S. producers of chile and alternative crops. One way to encourage domestic production is to identify ways the crop could be more profitable, including identifying consumer willingness (and ability) to pay premiums for U.S.-grown chile peppers. Additionally, little is known about chile pepper consumption as data that identifies which varieties are consumed, how they are used by households, and who is most likely to consume them is not widely available. This paper provides insights into U.S. spicy pepper consumption gained via results from a nationwide panel survey.
2. Materials and Methods
2.1. Data
To better understand the current consumption of spicy peppers, specifically New Mexico-style chile peppers, in the U.S., a nationwide panel survey was conducted in July 2021. The survey instrument, created in the online survey program Qualtrics, was administered to panelists managed by the sample exchange platform company Cint. A total of 859 participants completed the survey after reading the human subjects’ consent information. Survey demographics and their U.S. Census counterparts are shown in Table 1.
Table 1.
Survey and U.S. population demographics.
A careful examination of the data in Table 1 shows some discrepancies between survey participant percentages and U.S. population percentages in several demographic categories. For example, the survey under-sampled individuals in the West Census Region, individuals with a high school degree or less, and Hispanics. Additionally, the invitation to participate in the survey was sent to multiple panelists, with the first 859 panelists completing the survey included in the analysis, i.e., the selection of participants was not completely random. Due to these factors, readers are cautioned not to make inferences about the general population. Readers should consider the results as informative but not necessarily representing the U.S. population.
Survey participants were asked to provide additional information, in addition to the general demographic information summarized in Table 1. Specifically, participants were asked a series of questions about their diet, health, and shopping habits, as they related to vegetable purchases.
Participants were instructed “According to recommendations of the UDSA MyPlate Program, the average person should consume 3 cups of vegetables each day. Do you, on a typical day consume less than the suggested amount of vegetables, consume the suggested amount of vegetables, or consumer more than the suggested amount of vegetables?” Slightly more than one-half (53%) of the participants indicated they consumed less than the recommended amount, one-third (34%) indicated they consumed the suggested amount, with the remaining 13% indicating they consumed more than the recommended amount.
Four out of five participants (82.5%) indicated they were the primary shopper in their household. Nine out of 10 participants indicated they “liked” vegetables in general. Participants tended to consume fresh vegetables (54.7%) more than in frozen (23.7%), canned (18.7%), and dried (3.8%) forms. Participants were also asked where they tended to purchase fresh vegetables. A majority (68%) of the participants indicated they purchased fresh vegetables from traditional supermarkets. In total, 13% indicated they purchased fresh vegetables from specialized food stores, 10% indicated they purchased vegetables from convenience stores, and 5% direct from farmers (farmers’ markets or roadside stands).
Participants were instructed, “According to the U.S. Department of Health and Human Services, a healthy eating pattern includes a variety of vegetables from all of the subgroups, fruits (especially whole fruits), grains (at least half which are whole-grain), fat-free or low-fat dairy, a variety of protein foods (that can include animal-based proteins, legumes, nuts, seeds, and soy products), and oils”. Participants were then asked how consistent their diet was with the described healthy eating pattern. Slightly over half (54%) indicated their eating patterns were consistent with the guidelines and about one in five (19%) indicated their diet was inconsistent with the guidelines.
Similar to the question related to healthy diets, participants were instructed “The U.S. Department of Health and Human Services recommends that adults should do at least 150 min (2.5 h) per week of moderate-intensity aerobic physical activity. Alternatively, they recommend that an adult can do 75 min (1.25 h) per week of vigorous-intensity aerobic activity” and then asked if their exercise habits were consistent with the statement. Just under half (47%) indicated that they exercised less than the recommended amount.
2.2. Methods
Participant’s responses related to their spicy pepper consumption were explored descriptively using graphs and simple statistics such as chi-square goodness of fit tests. The importance of factors that influenced the likelihood that a survey participant indicated they frequently purchased (and assumed consumed) spicy peppers was examined using a binary logit regression model, a regression model that assumes errors follow a logistic distribution.
Logistic regression models are used to predict the likelihood or probability of a categorical dependent variable, e.g., a dependent variable that can take on one of two values (binary logit model). In this case, the regression model is used to predict the likelihood or probability that an individual purchases spicy peppers frequently, where frequent is defined as making a purchase at least once per month (the dependent variable) using various independent or explanatory variables associated with the participant, e.g., age, sex, and race or ethnicity. The probability is given as:
where
where the Xs represents explanatory variables associated with an individual participant and the βs represent parameters that describe the influence of the explanatory variables on the probability that an individual purchases spicy peppers frequently. The specific variables used in the model are presented in Table 2. A maximum likelihood procedure is used to estimate the parameters.
P_i = 1/(1 + exp(z_i^’ β))
z_i^’ β = β_0 + β_1 X_1i + β_2 X_2i + ⋯+β_n X_ni
Table 2.
Explanatory variables for the binary logit model.
The logistic model described above was used to estimate the effects that various survey participant attributes have on their purchase of spicy peppers. The dependent variable was created using participant responses to questions about the frequency of spicy pepper purchases. Specifically, if a participant indicated they purchased spicy peppers in any form (fresh, dried, canned, or frozen) they were classified as “frequent” spicy pepper consumers, and the dependent variable was set equal to one. Otherwise they were classified as non-frequent spicy pepper consumers and the dependent variable was set equal to zero. Approximately two-thirds of participants (67.3%) indicated that they purchased spicy peppers at least once per month.
Independent variables, all binary dummy variables, used to explain spicy pepper consumption included self-reported characteristics including participant vegetable consumption, the importance of price, diet, foodie, willingness to explore new foods, age, income, monthly budget for food purchases, education, race, Hispanic ethnicity, having lived in the southwest, and current residence, i.e., the Census region where they live. Table 2 presents a summary of the variables and how they were developed for use in the model. The percentage column indicated the number of participants who fit into the category, e.g., 40.5% of participants indicated that they consider themselves a “foodie”.
3. Results and Discussion
3.1. Descriptive Analysis
Survey participants were provided a list (with pictures) of common spicy pepper varieties/cultivars in three different categories, fresh, dried, and other processed (canned or frozen). Table 3 shows the varieties/cultivars presented to the survey participants and the percent of participants indicating that they had purchased the pepper in the last three months. More than 95% (95.6%) of survey participants indicated that they had consumed some form of spicy pepper in the last three months. The proportion of participants who consumed spicy peppers in the last three months was compared to the demographic categories in Table 2. Using a chi-square goodness of fit test, the null hypothesis that proportions of spicy pepper consumption were independent between each of the demographic categories in Table 2 could not be rejected.
Table 3.
Spicy pepper consumption in the last three months.
Survey participants who indicated they did not eat spicy peppers in any form were asked to identify why they did not. Seven possible reasons were provided to participants in addition to an opportunity to provide additional reasons. Participants were allowed to identify more than one reason if desired. The 38 participants who indicated that they did not consume spicy peppers in the last three months provided 122 reasons. The most common reasons provided (from the seven provided) by participants for not consuming spicy peppers were that they were “too spicy or hot” and they did not like the taste (Figure 4). Several of the “Other” additional reasons offered by participants were associated with digestive issues caused by spicy peppers.
Figure 4.
Factors that influenced participants to choose not to consume spicy peppers.
Survey participants were asked about the importance of nine characteristics of spicy peppers in their decision to purchase (price, production region, packaging, and production system, e.g., organic/traditional) and consume (taste, freshness, color, size, and health characteristics) the products. The percentage of participants indicating that an individual characteristic was important or very important to their decision to purchase or consume peppers ranged from 84% to 42% (Figure 5). As might be expected, taste and freshness were rated high in terms of importance in the participant’s decision-making process. Almost two-thirds of participants (61.2%) rated understanding the health characteristics of spicy peppers third as either important or very important to the decision to consume spicy peppers. Price, a clear economic variable, was rated fourth.
Figure 5.
The importance of spicy pepper characteristics.
Associated with the health characteristics of spicy peppers, survey participants were provided six potential health-related claims that may be made about spicy peppers. The claims included [10,11,12]:
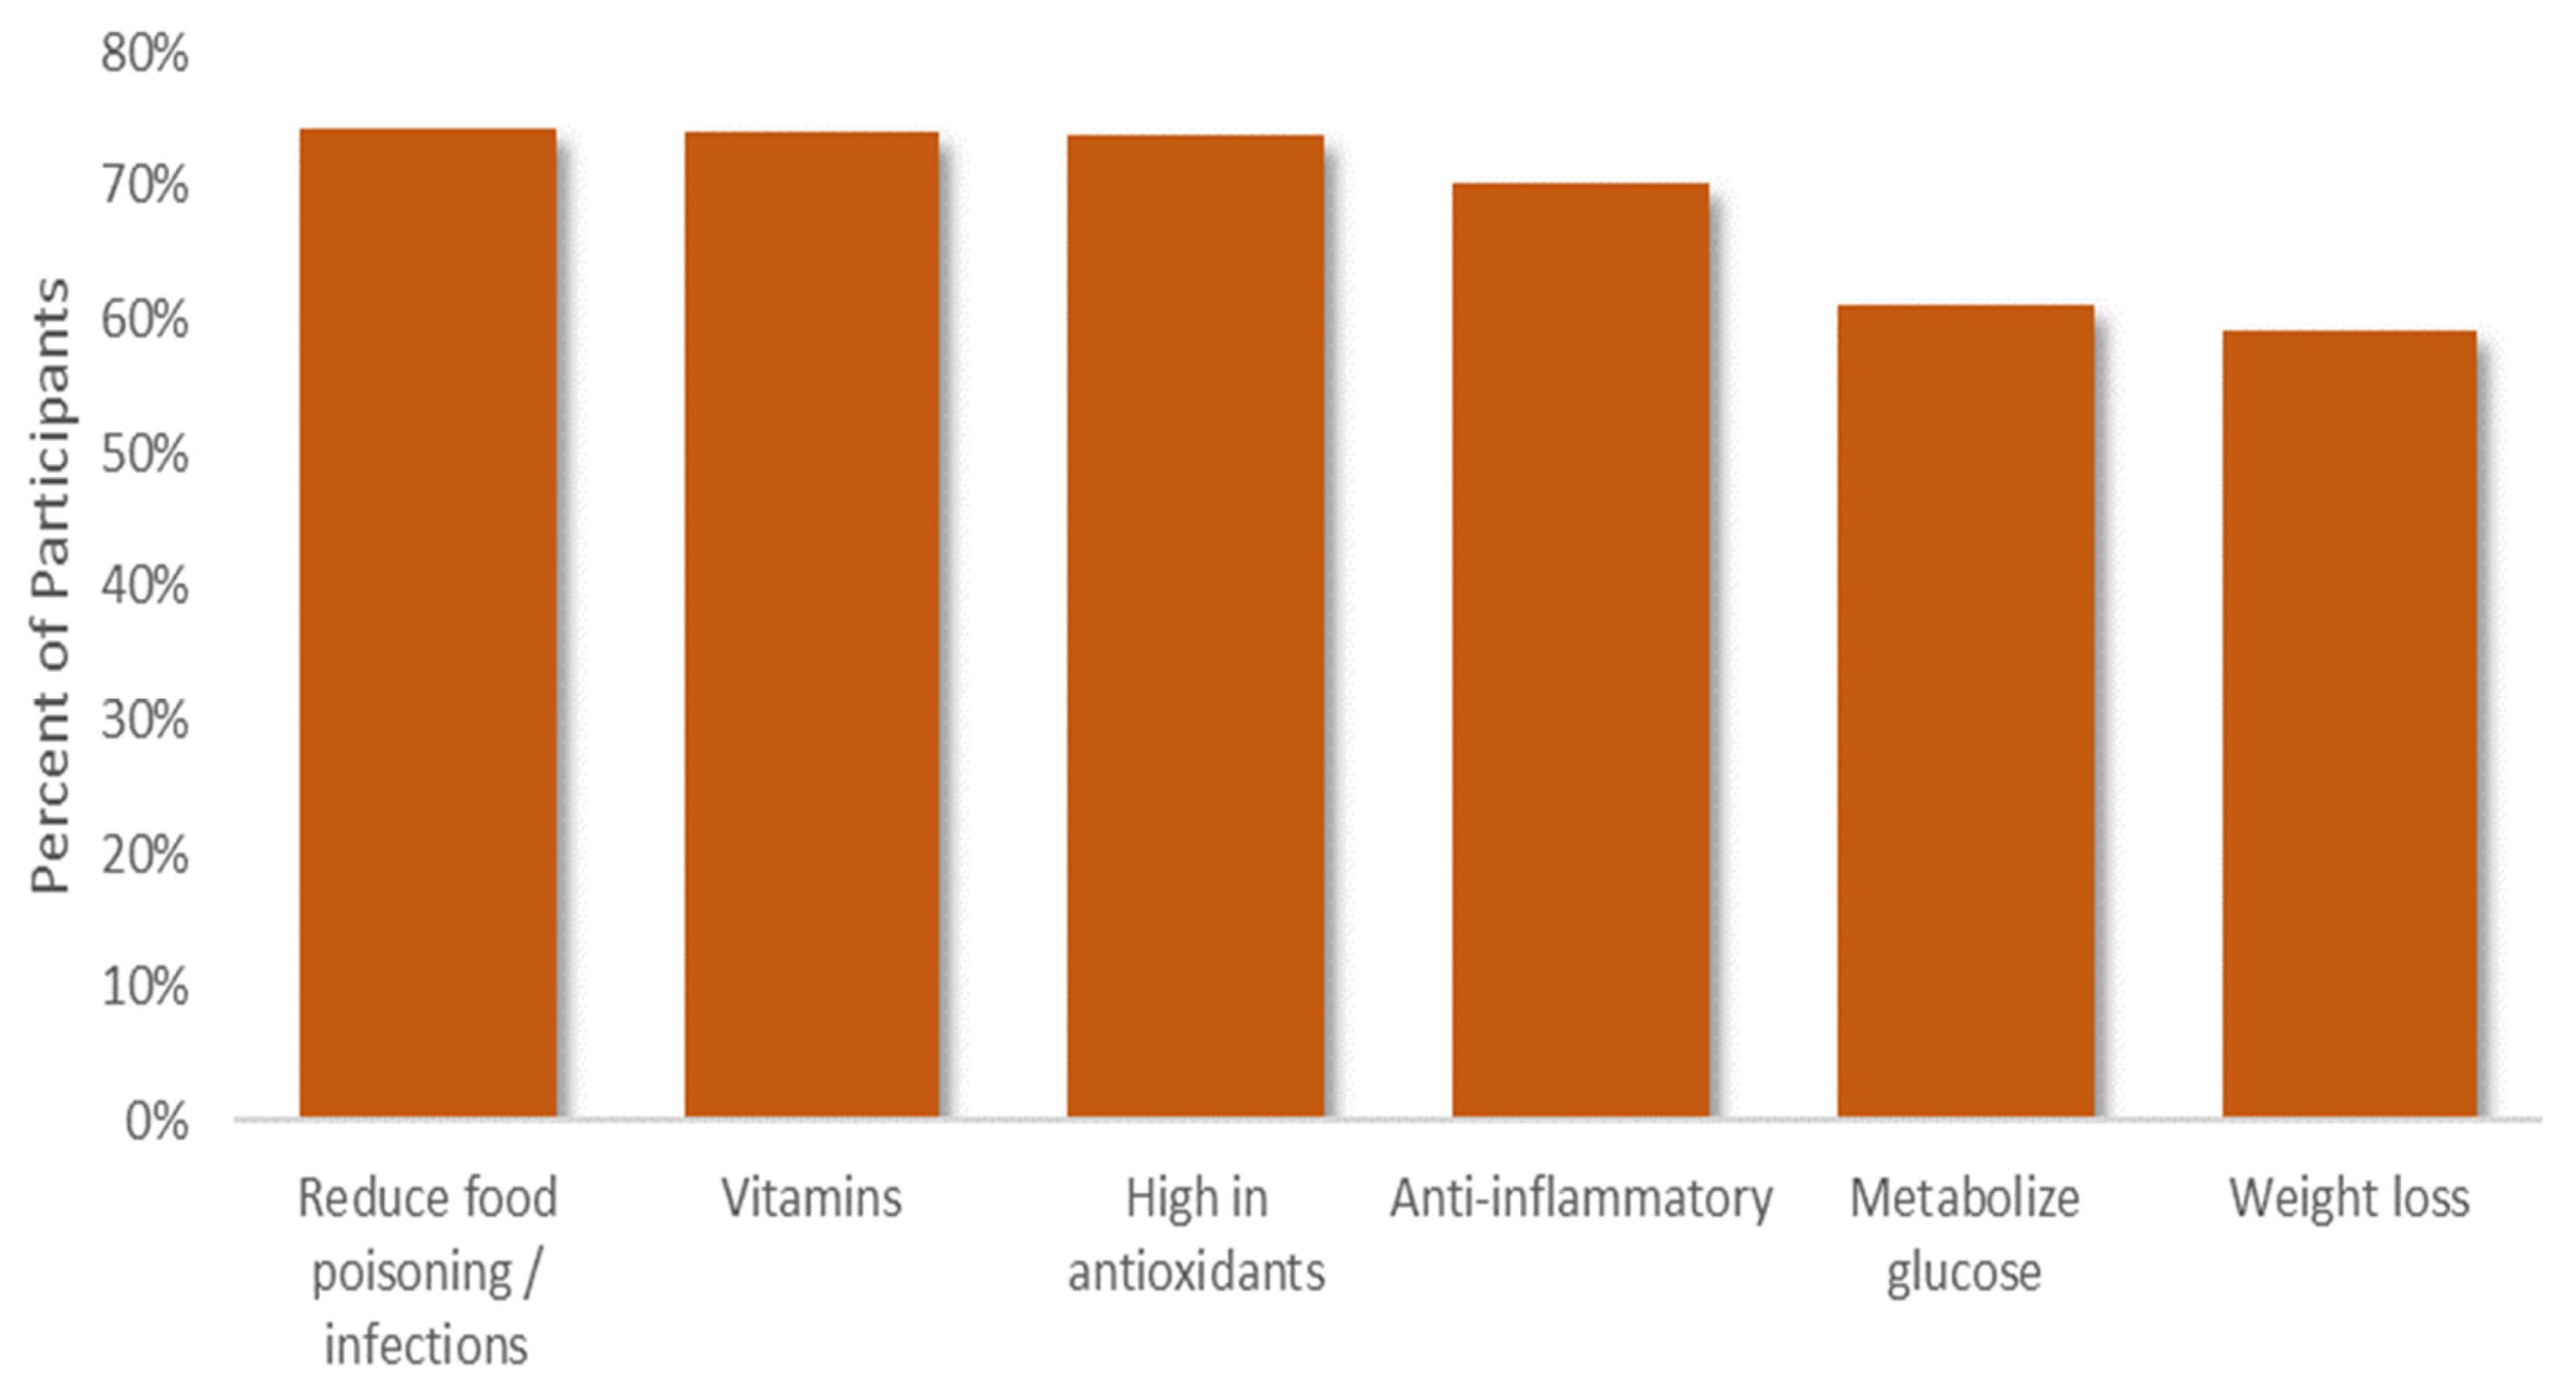
- Metabolize glucose. Research suggests that chile peppers assist in weight loss.
- Improve insulin sensitivity. Research suggests that chile peppers improve blood sugar and insulin reaction.
- Anti-inflammatory. Chile peppers increase blood flow to tissues and reduce vascular plaque buildup.
- Boost your body. Chile peppers are full of vitamins A, B, and E.
- Help fight infections. Chile peppers are powerful at slowing the growth of common food-borne illnesses.
- High in antioxidants. Chile peppers help remove free radicals from the body.
Participants were asked to rate the importance of the claims on considerations to consume spicy peppers. Three out of four participants rated the “fighting infections” (74.4%), “boosting your body” (74.1%), and “high in antioxidants” (73.7%) as important or very important (Figure 6).
Figure 6.
The importance of spicy pepper characteristics.
3.2. Binary Logit
The binary logit regression results are shown in Table 4. The likelihood ratio test is a test to determine if the parameters associated with the explanatory variables are statistically significantly different from zero, i.e., β_1 = β_2 = ⋯ = β_n. The likelihood test statistic (177.97) and accompanying p-value (<0.0001) indicate that the model fits statistically significantly better than a model that includes only an intercept term, i.e., at least one of the parameter estimates associated with the independent variables is statistically different from zero. Other measures of model fit, R-square (R-Square = 0.2098, Max-rescaled R-Square = 0.2905) and the percent concordant/discordant pairs (78.4 concordant, 21.6 discordant) both suggest the model does a relatively good job predicting the participants’ frequency of purchasing spicy peppers.
Table 4.
Logit regression parameter estimates, standard errors, statistics, and p-values.
Results shown in Table 4 show seven of the 17 variables, including the intercept, in the model were significant at the 10% level (six at the 5% level). The probability that participants indicated they were a frequent consumer of spicy peppers increased if they:
- indicated their vegetable consumption was consistent with USDA’s My Plate Program recommendations,
- considered themselves a “foodie” in that they agreed or strongly agreed with the statement “I would consider myself a person who devotes attention and energy to knowing food ingredients and preparation techniques and finds enjoyment in top-notch ingredients and preparation”,
- were a “food explorer” in that they agreed or strongly agreed with the statement “I try to use unique, gourmet, new, or exotic ingredients in my cooking”,
- identified their race as non-white or non-Caucasian (identified as American Indian or Alaska Native, Asian, Black or African American, or Native Hawaiian or Pacific Islander),
- if they were younger than 65 years, i.e., between 18 and 34 years or between 35 and 64 years old, or
- had ties to the Southwest indicating that they live or had previously lived in Arizona, New Mexico, or Texas.
Other factors included in the model, e.g., diet quality/health, income, education, Hispanic, or current geographic residence as defined by Census Regions had no statistically significant impact on the frequency of spicy pepper consumption.
4. Conclusions
As the U.S. becomes more culturally diversified via various influences including immigration and tourism, so too do the food preferences of its population. Spicy or pungent peppers sometimes referred to as hot, chili, or chile, are benefiting from changing food preferences. Per capita fresh chile pepper consumption has more than doubled over the last 40 years and per capita consumption of dry chile peppers has increased by more than 46%. While spicy pepper consumption has increased significantly, the increase has largely been met via imports as domestic production of spicy peppers (as a USDA category “chile peppers”) has declined over the last 25 years. By better understanding spicy pepper consumers and their consumption patterns, it may be possible for U.S. farmers and food manufacturers to identify ways to meet increasing demand.
A nationwide panel survey was implemented in the summer of 2021 to gather information to better understand consumer preferences for spicy peppers. While the survey is not necessarily representative of the U.S. population and results should not be inferred to the population, the results do shed light on spicy pepper consumption.
The probability that participants purchased spicy peppers at least once per month increased with vegetable consumption in general, if a participant identified as a “foodie” or as someone who likes to explore new foods, minorities, had ties to the southwest or who were younger. The findings, if consistent with the larger population, are positive for the industry as younger consumers currently consume spicy peppers more frequently and are likely to continue that trend as they age and the population continues to become more diverse from a racial or ethnicity standpoint.
Domestic farmers seeking market opportunities within the spicy pepper market might benefit by better understanding their final consumer, i.e., the population that consumes spicy peppers. The preliminary results from the survey described in this paper suggest opportunities to target younger, ethnically diverse, and foodie consumers. Further research could explore in greater depth the impact ethnicity has on spicy pepper consumption in the United States, i.e., explore in more detail the ties between different ethnic populations and spicy pepper consumption.
Author Contributions
Conceptualization, J.L. and S.T.; methodology, J.L.; software, J.L. and S.T.; validation, S.T.; formal analysis, J.L. and S.T.; writing—original draft preparation, S.T. and J.L.; writing—review and editing, J.L. and S.T.; visualization, J.L. and S.T.; supervision, J.L.; project administration, J.L. All authors have read and agreed to the published version of the manuscript.
Funding
Funding support provided by the New Mexico State University Agricultural Experiment Station.
Institutional Review Board Statement
Institutional Review Board (IRB) approval was received to obtain data from human subjects for this research project. IRB Project #: 21833.
Informed Consent Statement
Informed consent was obtained from all subjects involved in the study.
Data Availability Statement
Data is not publicly available per IRB application and participant informed consent.
Acknowledgments
The authors wish to thank Don Blayney for his review of the manuscript and excellent editorial suggestions.
Conflicts of Interest
Jay Lillywhite has previously received grants from the New Mexico Chile Association and has spoken at industry association meetings. No personal remuneration has been received.
References
- United States Census Bureau. Place of Birth for the Foreign-Born Population of the United States. American Community Survey. 2019 Estimates. Available online: https://data.census.gov/cedsci/table?tid=ACSDT1Y2016.B05006&q=ACSDT1Y2016.B05006 (accessed on 9 August 2021).
- USA Facts Institute. USA Facts: 2021 Annual Report. April 2021. Available online: https://usafacts.org/annual-publications/annual-report-2021/ (accessed on 9 August 2021).
- U.S. Department of Homeland Security. Table 3. Persons Obtaining Lawful Permanent Resident Status by Region and Country of Birth: Fiscal Years 2017 to 2019. Available online: https://www.dhs.gov/immigration-statistics/yearbook/2019/table3 (accessed on 9 August 2021).
- U.S. Department of Homeland Security. Table 4. Persons Obtaining Lawful Permanent Resident Status by State or Territory of Residence: Fiscal Years 2017 to 2019. Available online: https://www.dhs.gov/immigration-statistics/yearbook/2019/table4 (accessed on 9 August 2021).
- Oxford English Dictionary. “Culture, n.”. Available online: https://www.oed.com/view/Entry/45746?rskey=omQ6qC&result=7#eid7741404 (accessed on 9 August 2021).
- Reddy, S.; Anitha, M. Culture and its Influence on Nutrition and Oral Health. Biomed. Pharmacol. J. 2015, 8, 1–8. [Google Scholar]
- Dindyal, S.; Dindyal, S. How Personal Factors, Including Culture and Ethnicity, Affect the Choices and Selection of Food We Make. Internet J. Third World Med. 2003, 1, 1–4. [Google Scholar]
- Scoville Scale. The Scoville Scale for Chili Peppers. Available online: https://www.scovillescale.org/chili-pepper-scoville-scale/ (accessed on 9 August 2021).
- USDA–Economic Research Service. Vegetables and Pulses Yearbook Tables. 30 July 2021. Available online: https://www.ers.usda.gov/data-products/vegetables-and-pulses-data/vegetables-and-pulses-yearbook-tables/ (accessed on 9 August 2021).
- Sanati, S.; Razavi, B.M.; Hosseinzadeh, H. A review of the effects of Capsicum annuum L. and its constituent, capsaicin, in metabolic syndrome. Iran. J. Basic Med. Sci. 2018, 21, 439–448. [Google Scholar] [CrossRef] [PubMed]
- Healthline. Why People Who Regularly Eat Chile Peppers May Live Longer. Available online: https://www.healthline.com/health-news/why-people-who-regularly-eat-chile-peppers-may-live-longer (accessed on 30 September 2021).
- Healthline. Chile Peppers 101: Nutritional Facts and Health Effects. Available online: https://www.healthline.com/nutrition/foods/chili-peppers (accessed on 30 September 2021).
Publisher’s Note: MDPI stays neutral with regard to jurisdictional claims in published maps and institutional affiliations. |
© 2021 by the authors. Licensee MDPI, Basel, Switzerland. This article is an open access article distributed under the terms and conditions of the Creative Commons Attribution (CC BY) license (https://creativecommons.org/licenses/by/4.0/).