Abstract
Soil salinity is one of the most important environmental factors threatening agriculture on a global level. Plants show differences in resistance to salt stress, both in terms of species and variety. The aim of the study was to determine the effect of salt stress on photosynthetic efficiency and the activity of plants of two barley varietie—KWS Irina and RGT Planet. Plants grown in a pot experiment were subjected to soil treatment with sodium chloride (NaCl) at concentrations of 0, 50, 100, and 150 mmol∙(dm3)−1. Measurements were made four times at intervals of 7, 14, 21, and 28 days after the application of NaCl. The relative chlorophyll content in leaves (CCl) and selected chlorophyll fluorescence parameters (Fv/Fm, Fv/F0, and PI) and gas exchange parameters (PN, E, gs, and Ci) were assessed. In the final stage of the experiment, a visual assessment of the plants’ condition was carried out and the amount of fresh mass (FM) of the above-ground part was determined. The content of sodium and potassium in the vegetative parts of plants was also analysed. Salinity significantly influenced the values of the measured parameters in both of the tested barley genotypes. High salt concentrations in the soil at levels of 100 and 150 mmol NaCl (dm3)−1 negatively affected the growth and development of plants by disturbing the process of photosynthesis and other plant gas exchange parameters. The antagonistic effect of sodium in relation to potassium resulted in a decrease in the K+ content in the plants, along with an increase in the salinity level.
1. Introduction
Due to its wide range of applications, barley is one of the most popular species grown in the world. Its role as a raw material for the brewing industry is particularly important, therefore it is justified to undertake research on the reaction of new malting barley varieties for cultivation in conditions of increased soil salinity in the world. Among the abiotic stresses, salinity is one of the most significant threats to cereal crops, which are a strategic commodity [1,2,3]. It is one of the main processes contributing to soil degradation that threatens the ecosystem. In addition, it is recognised as one of the most important problems at a global level in terms of agricultural production, food security, and sustainable development [1,4,5,6].
Salinity problems occur in all climatic zones and are a consequence of both the mechanisms of nature (primary salinity) and human activities (secondary salinity). The distribution of salinized soils varies geographically and is largely determined by the type of climate, landscape type, agrotechnics used, irrigation methods, and land management policies. Salt stress is a real threat to agriculture all over the world, especially in countries where crop irrigation is used. It is estimated that the increase in soil salinity amounts to 0.3 to 1.5 million hectares of arable land annually, which reduces the production potential by a further 20 to 46 million hectares [1]. Plants growing in soils with a high concentration of salt have a limited ability to take up water, as well as macro- and micro-elements, as a result of which the seed germination capacity is reduced, and the process of photosynthesis is disturbed, which has a negative impact on plant growth and yield [7,8,9,10,11,12,13,14,15,16].
Under salinity conditions, plants activate various biochemical and physiological mechanisms to deal with the resulting stress. These mechanisms include changes in morphology, anatomy, water relations, photosynthesis, hormonal profile, distribution of toxic ions and biochemical adaptation (e.g., antioxidant metabolism response) [7,10,17,18,19,20]. The closing of the stomata is the first response of plants to abiotic stress [8,21]. Unfavourable environmental conditions allow them to increase the rate of respiration, which is a necessary condition for the production of ATP in order to activate substances soluble in osmosis, which reduce the osmotic potential of the cell and thus increase its water uptake [22]. It has been found that salt stress affects photosynthesis both in the short and long term. In the short term, salinity may affect photosynthesis by limiting the stomata, leading to a reduction in carbon assimilation [10]. This effect may cause a rapid and significant halt in plant growth, even after several hours of exposure to salt [23]. In the long term, salt stress may affect the photosynthesis process by accumulating salt in young leaves [11] and reducing the concentration of chlorophyll and carotenoids [24,25,26]. The rate of photosynthesis may decrease due to stomatal closure or other extramedullary restrictions such as disruption of the photosynthetic electron chain or inhibition of the Calvin cycle enzymes such as Rubisco, phosphoenol pyruvate carboxylase, ribulose-5-phosphate kinase, glyceraldehyde, or 3-phosphate dehydrogenase fructose-1,6-bisphosphatase [10,27]. A decrease in stomatal conductivity may prevent excessive water loss as a result of transpiration, while proper regulation of the photosynthesis process may minimize the production of ROS in PS II (1O2) and on the reducing side of PSI (O2− and H2O2) [28].
The reductions in the photochemical and non-photochemical parameters that occur in plants subjected to salt stress depend on the plant species and the severity of the stress. Under salinity conditions, there is a general decrease in the photochemical quenching parameters and electron transport rate, and an increase in the non-photochemical quenching parameters [19,20,29,30,31]. The stress response of NaCl is correlated with a decrease in PSII efficiency and an increase in non-photochemical quenching parameters as a mechanism for the safe dissipation of excess energy.
The negative impact of salinity on plants may also consist of the toxic effect of a specific ion on the plant (Na+, Cl−) or exceeding of the tolerance threshold of a given plant species to the total salt concentration, which contributes to an increase in osmotic pressure and a limitation or even loss of water uptake, resulting in the occurrence of physiological drought [32,33,34,35]. There are many reports in the literature on plant resistance to cultivation under salt stress, but there is no detailed information on the differentiation of resistance within varieties. Therefore, studies were undertaken to assess the physiological response of two malting barley varieties (KWS Irina and RGT Planet) in response to salinity stress at different NaCl concentrations. The research hypothesis assumes that the increased concentration of NaCl in the soil influences the functioning of the photosynthetic apparatus and the osmotic properties of barley (Hordeum vulgare L.) plants.
2. Materials and Methods
2.1. Plant Material and Growth Conditions
The pot experiment was performed under controlled conditions at the University of Rzeszów (Poland). Two varieties of barley, KWS Irina and RGT Planet, were sown in pots (10 cm in diameter) in which 1.5 kg of soil with a clay sand particle size composition and a slightly acidic pH (pH: KCl 6.35; H2O 6.52) was placed. The total content of compounds in the soil was as follows: phosphorus oxide (P2O5) 17.4 mg∙100 g−1, potassium oxide (K2O) 17.0 mg∙100 g−1, magnesium (Mg) 8.87 mg∙100 g−1, and calcium (Ca) 9.46 mg∙100 g−1. The experiments were carried out in four replications in a growth chamber (Model GC-300/1000, JEIO Tech Co., Ltd., Daejeon, Korea) at a temperature of 23 ± 2 °C, moisture 60 ± 3% RH, photoperiod of 16/8 h (L/D), and a maximum light intensity of about 350 µmol m−2∙s−1. The substrate moisture was maintained at a level of 60% of the field water capacity. The positions of the pots in the experiment were randomised weekly. In the two-leaf stage, an aqueous NaCl solution with concentrations of 50, 100, and 150 mmol (dm3)−1 was applied to the soil. Plants untreated with NaCl (0 mmol NaCl (dm3)−1) were used as the controls. Physiological measurements of the barley plants were taken four times on the first or second fully developed leaves at intervals of 7, 14, 21, and 28 days after the application of the NaCl solution to the soil. The plants were harvested 35 days after emergence (on the date of the last measurement).
2.2. Measurement of Gas Exchange
The net photosynthetic rate (PN), transpiration rate (E), stomatal conductance (gs), and intercellular CO2 concentration (Ci) were measured on two fully developed leaves. The photosynthesis measurement system LCpro-SD (ADC Bioscientific Ltd., Herts, UK) was used to measure the photosynthesis of leaves. The LCpro-SD plant leaf photosynthesis chamber has a flow accuracy of ±2% of its range. During the measurement, the light intensity in the measuring chamber was 350 µmol m−2∙s−1, and the temperature was 23 ± 2 °C.
2.3. Measurement of the Relative Chlorophyll Content
Measurement of the relative chlorophyll (CCl) content was taken using a CCM-200plus handheld chlorophyll meter (Opti-Sciences, Hudson, NH, USA). Measurements were made on three fully developed leaves per pot.
2.4. Measurement of Chlorophyll Fluorescence
To measure chlorophyll fluorescence, a continuous excitation Pocket PEA fluorimeter (Pocket PEA, Hansatech Instruments, King’s Lynn, Norfolk, UK) equipped with black shading clips that were applied to the leaf lamina away from the leaf nerve was used. The following parameters were measured: the maximal quantum yield of PSII photochemistry (Fv/Fm), the maximum quantum yield of primary photochemistry (Fv/F0), and the photosynthetic yield index (PI). The fluorescence signal was collected under actinic red light with a light source peak wavelength of 627 nm and transmitted for 1 s at the maximum available intensity of 3500 μmol (photon) for photosynthetically active radiation (PAR) m−2 s−1. Fluorescence measurements were performed in triplicate in each pot on the medial leaf lamina after 30 min of dark adaptation.
2.5. Determination of Fresh Mass and Assessment of Plant Condition
In the final stage of the study, the visual condition of the plants was assessed. The assessment was carried out on a 9° scale (where 9° indicates no leaf damage and 1° indicates complete leaf damage). The evaluation included the number of leaves that differed in morphological appearance (leaf wilt, necrosis, and chlorosis, etc.). It was assumed that 9° = 0–5%, 8° = 6–15%, 7° = 16–25%, 6° = 26–40%, 5° = 41–60%, 4° = 61–75%, 3° = 76–85, 2° = 86–95%, and 1° = 96–100% of the above-ground part of plants with visible changes. The above-ground part of the plants were then weighed and their fresh mass (FM) was determined. The weight of the plants from individual varieties of the experiment was compared with the weight of the plants from the control (100%), in accordance with the following equation:
where:
- FM (%)—calculated weight of fresh plants;
- mss—the mass of the above-ground part of plants subjected to salinity;
- mc—the mass of above-ground part of control plants.
2.6. Analysis of Na and K Content in Leaves and Roots
The total Na+ and K+ contents were analysed by absorption spectrometry (ASA) [36]. A representative leaf sample was dried and ground in a laboratory mill and was mineralised in an open system in concentrated nitric acid in a Foss Tecator 1012 heating block. After mineralisation, the samples were quantitatively transferred to volumetric flasks that were then filled with deionised water. The content of the elements in the solutions was determined using a Hitachi Z-2000 atomic absorption spectrometer.
2.7. Statistical Analysis
Statistical analysis was performed using TIBCO Statistica 13.3.0 (TIBCO Software Inc., Palo Alto, CA, USA). In order to check the normality of the distribution at p = 0.05, the Shapiro−Wilk test was performed. The homogeneity of variance was also checked. A two-way repeated measures ANOVA (with time assessment as a factor) was then performed. In order to determine and verify the relationships, Tukey’s post hoc test was performed with a significance level of p ≤ 0.05.
3. Results
3.1. The Effect of Salinity on the Relative Content of Chlorophyll in Barley Leaves (CCI)
The concentration of NaCl had a significant effect on the content of chlorophyll in the leaves of the barley varieties tested. On the first date of measurement, along with an increase in salt concentration in the medium, the varieties KWS Irina and RGT Planet reacted with a decrease in the chlorophyll content in the leaves. This relationship was observed at higher salt concentrations. A significant decrease in the chlorophyll content in the leaves compared with the control, of 22.5% (KWS Irina) and 20.2% (RGT Planet), respectively, was observed at a salinity of 100 mmol NaCl (dm3)−1. With a salinity of 150 mmol NaCl (dm3)−1, the decrease was 43.2% (KWS Irina) and 47.3% (RGT Planet), respectively. The exception was the concentration of 50 mmol NaCl (dm3)−1, when the chlorophyll content in the leaves did not differ significantly from the control. On the second date of measurement, a significant decrease in the content of chlorophyll was observed in the tested barley varieties, regardless of the salt concentration. Compared with the control, the greatest decrease, of 44.4% in the KWS Irina variety and 49.7% in the RGT Planet variety, was noted at the concentration of 150 mmol NaCl (dm3)−1. Similar relationships were noted on the third and fourth dates of measurement.
Analysing the effect of the exposure time of the plants to NaCl in terms of the chlorophyll content in the leaves, it was observed that only on the first and second dates were the measurement results statistically significant for low salt concentrations, which most likely proves the stimulating effect of NaCl at a concentration of 50 mmol (dm3)−1 (Figure 1). There were no statistically significant differences between the values obtained on the third and fourth measurement dates.
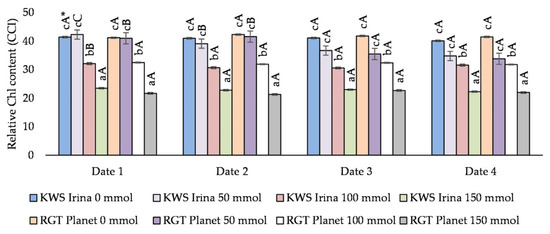
Figure 1.
The effect of the NaCl (mmol NaCl (dm3)−1) concentration and measurement date on the chlorophyll content in the leaves (CCI; date 1, 7 days after NaCl application; date 2, 14 days after NaCl application; date 3, 21 days after NaCl application; and date 4, 28 days after NaCl application) * Capital letters indicate significant differences between the means at the measurement dates for particular NaCl concentrations, and lower case letters indicate significant differences between the means at subsequent measurement dates (p = 0.05).
3.2. The Influence of Salinity on the Parameters of Chlorophyll Fluorescence
In the tested barley varieties, the Fv/Fm changed with increasing the salt concentration. A significant decrease in relation to the control, of 8.5% (KWS Irina) and 13.6% (RGT Planet), was demonstrated at the highest concentration (150 mmol NaCl (dm3)−1). Lower NaCl concentrations did not significantly affect the value of the analysed parameter. The duration of plant exposure to NaCl did not significantly affect the value of the Fv/Fm ratio (Figure 2A).
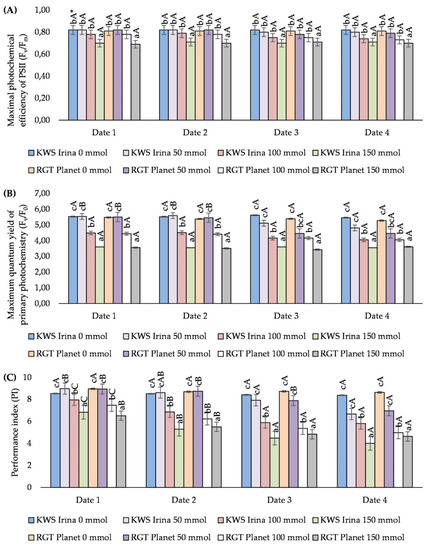
Figure 2.
The effect of NaCl (mmol NaCl (dm3)−1) concentration and measurement date on chlorophyll fluorescence parameters: maximal quantum yield of PSII photochemistry (Fv/Fm) (A), maximum primary photochemistry yield (Fv/F0) (B), and PS II performance index (PI) (C) in the varieties of KWS Irina and RGT Planet (date 1, 7 days after NaCl application; date 2, 14 days after NaCl application; date 3, 21 days after NaCl application; date 4, 28 days after NaCl application) * Capital letters indicate significant differences between the means in the measurement dates for particular NaCl concentrations, and lower case letters indicate significant differences between the means at subsequent measurement dates (p = 0.05).
Fv/F0 was dependant on the salt stress caused by the increased concentration of the aqueous salt solution used in the experiment. The application of NaCl at a concentration of 100 mmol (dm3)−1 caused a decrease in Fv/F0 of an average of 22.2% for the KWS Irina variety and 20.8% for the RGT Planet variety. The lowest values of the parameter were obtained with 150 mmol NaCl (dm3)−1 at each measurement date. In the case of the KWS Irina variety, these values were lower by 35.4% on average compared with the control, and in the case of the RGT Planet variety, the difference was 34.4% on average. There were no statistically significant differences between the control sample and the values obtained for plants treated with a 50 mmol NaCl (dm3)−1 solution. The described relationships regarding the concentrations used were analogous in the subsequent measurement dates. By analysing the exposure time of plants to the effect of different salt concentrations, it was shown that on the first and second measurement dates, only salt at a concentration of 50 mmol NaCl (dm3)−1 had a positive effect on the Fv/F0 value. Higher salt concentrations (100 mmol NaCl (dm3)−1 and 150 mmol NaCl (dm3)−1) caused a significant decrease in the value of the analysed parameter. On the third and fourth measurement dates, a significant decrease in the Fv/F0 value was noted, regardless of the concentration used (Figure 2B).
In the analysed varieties, PI decreased with the increase in NaCl concentration, regardless of the date of the test. On the first date of measurement, a significant decrease in PI was demonstrated after the application of 100 and 150 mmol NaCl (dm3)−1 compared with the control. The decrease was 6.8% and 20.0%, respectively, for KWS Irina and 16.3% and 27.2%, respectively, for RGT Planet. The decrease in PI was still observed on the second measurement date. A significant decrease in the measured parameter, of 38.0% in KWS Irina and 36.6% in RGT Planet, was noted primarily at the highest concentration of NaCl (150 mmol (dm3)−1). At the next measurement dates, salt stress had caused a significant decrease in PI in the barley plants. At a concentration of 100 mmol NaCl (dm3)−1, the decrease in relation to the control was 30.1% (date 3) and 30.7% (date 4) in the KWS Irina variety, respectively, and 38.4% (date 3) and 32.4% (date 4) in RGT Planet, respectively. The highest concentration of NaCl used (150 mmol (dm3)−1) resulted in a decrease in the PI value, of 46.8% (date 3) and 52.1% (date 4) in the KWS Irina variety, and 44.5% (date 3) and 46.3% (date 4) in RGT Planet. At the first and second dates of measurement, the use of 50 mmol NaCl (dm3)−1 had a positive effect on the values obtained compared with the control, but these differences were not statistically significant. On the third and fourth dates, the salt in this concentration caused a decrease in the measured parameter in the same way as in the case of the higher concentrations. Analysing the effect of the exposure time of plants to the increased concentration of NaCl in the soil, the use of NaCl at the level of 50 mmol (dm3)−1 significantly influenced the value of the parameter in the studied barley varieties. On the first and second dates of measurement, the values obtained were higher than the control by an average of 3.2% in KWS Irina and 0.2% in RGT Planet. Along with the salt exposure time, the concentration of 50 mmol (dm3)−1 caused significant decreases in PI (dates 3 and 4; Figure 2C).
3.3. The Influence of Salt Stress on the Course of Gas Exchange
The study showed the significant effect of salinity on the value of the PN. An increase in the NaCl concentration in the soil resulted in a decrease of this parameter in the studied varieties. The greatest differences were noted at concentrations of 100 and 150 mmol (dm3)−1, and they were on average 25.7% and 59.1% (KWS Irina) and 36.3% and 54.5% (RGT Planet), respectively, in relation to the control. In plants treated with 50 mmol (dm3)−1 salt, no significant reductions in PN were observed. The effect of plant exposure time on NaCl was visible only in the KWS Irina variety. On the fourth date of measurement, KWS Irina showed a significant decrease in PN at a concentration of 100 mmol (dm3)−1 (Figure 3A).
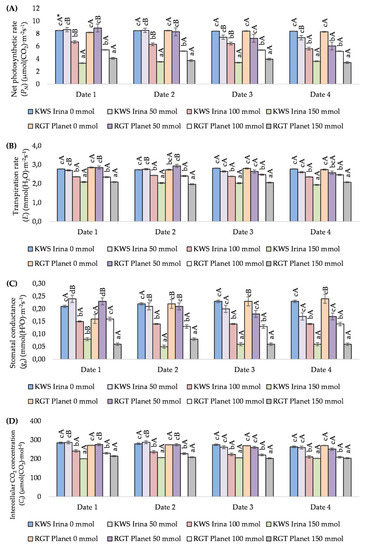
Figure 3.
The effect of NaCl (mmol NaCl (dm3)−1) concentration and measurement date on gas exchange parameters: net photosynthetic rate (PN) (A), transpiration rate (E) (B), stomatal conductance (gs) (C), and intercellular CO2 concentration (Ci) (D) in the KWS Irina and RGT Planet varieties (date 1, 7 days after NaCl application; date 2, 14 days after NaCl application; date 3, 21 days after NaCl application,; date 4, 28 days after NaCl application) * Capital letters indicate significant differences between the means in the measurement dates for particular NaCl concentrations, and lower case letters indicate significant differences between the means at subsequent measurement dates (p = 0.05).
Salt stress influenced plant transpiration. Both varieties reacted with a significant decrease in E at the highest NaCl concentrations. At a concentration of 100 mmol NaCl (dm3)−1, this decrease was on average 14.0% in KWS Irina and 13.5% in RGT Planet. At a concentration of 150 mmol NaCl (dm3)−1, a decrease in E values was also observed, of 27.4% (KWS Irina) and 26.5% (RGT Planet). A negative effect of NaCl at the level of 50 mmol (dm3)−1 was found on the third and fourth dates (Figure 3B).
The application of the NaCl solution to the soil in various concentrations significantly influenced gs. On the first date of measurement, both varieties reacted with an increase in gs at a concentration of 50 mmol NaCl (dm3)−1. The increase in relation to the control was 14.2% for KWS Irina and 43.7% for RGT Planet. In both varieties, on the first measurement date, significant falls in gs compared with the control were noted at the concentration of 150 mmol NaCl (dm3)−1. These amounted to 61.9% (KWS Irina) and 62.5% (RGT Planet). On the subsequent measurement dates (dates 2, 3, and 4), along with an increase in salt concentration, decreases in the measured parameter were noted at a concentration of 50 mmol NaCl (dm3)−1, but they were not significant. A significant relationship was demonstrated for the higher salt concentrations—100 and 150 mmol NaCl (dm3)−1. The average decrease in gs value during the entire period of salt stress at a concentration of 100 mmol NaCl (dm3)−1 was 36.0% in KWS Irina and 31.1% in RGT Planet, while at 150 mmol NaCl (dm3)−1, it was 71.9% in KWS Irina and 69.5% in RGT Planet (Figure 3C).
The conducted research has shown the influence of salt on Ci. Higher salt concentrations (100 and 150 mmol NaCl (dm3)−1) caused a significant decrease in Ci for each measurement date. In the KWS Irina variety on the first measurement date, the decrease was 15.1% and 29.5%, and in the RGT Planet variety 15.5% and 21.5%, with a salinity of 100 and 150 mmol NaCl (dm3)−1, respectively. Significant decreases in the value of Ci were also observed in relation to the control at subsequent measurement dates (longer duration of salt stress). On the last date of measurement (date 4), the decrease in the value of Ci was the highest in relation to the control, and amounted to 20.2% and 20.5% in KWS Irina and 22.9% and 24.8% in RGT Planet with a salinity of 100 and 150 mmol NaCl (dm3)−1, respectively. The average decrease in Ci during stress over the entire study cycle was 17.4% and 26.1% in the KWS Irina variety, and 25.3% and 30.1% in RGT Planet, respectively, which was statistically proven (Figure 3D).
3.4. The Effect of Salt Stress on the Fresh Mass of Barley Plants and Plant Condition
The use of salt in various concentrations resulted in a reduction in the FM of the above-ground part of the plant and in deterioration of the plant condition in both barley varieties. A stronger response of the plants to salinity was observed at higher salt concentrations of 100 and 150 mmol NaCl (dm3)−1. The application of salt with a concentration of 150 mmol NaCl (dm3)−1 resulted in a reduction of FM of 13.8% in the KWS Irina variety and 16.9% in the RGT Planet variety compared with the control, and the condition of the plants was assessed at 6.5° and 6° in the studied varieties, respectively (Figure 4).
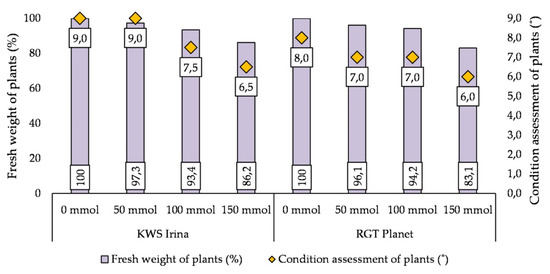
Figure 4.
The effect of salt stress on the condition of the plants and the content of the fresh mass of barley plants in the KWS Irina and RGT Planet cultivars.
3.5. Ion Content in Roots and Leaves (Na+ and K+)
The concentration of NaCl in the soil influenced the content of sodium and potassium in the leaves and roots of both of the tested barley varieties. With an increase in the salinity level, the potassium content in the tested parts of the plants decreased, while the percentage of sodium increased. The greatest differences in the content of K+ and Na+ in relation to the control sample were noted at the NaCl concentration of 150 mmol (dm3)−1. Compared with the control, the potassium content decreased with 150 mmol NaCl (dm3)−1 in the leaves by 2.8% dry mass (DM) in the KWS Irina variety and 3.8% DM in RGT Planet, and in the roots by 0.28% and 0.31% DM, respectively. At the highest concentration of NaCl, compared with the control, the increase in sodium content in KWS Irina was 1.67% DM in the leaves and 0.59% DM in the roots, while in RGT Planet it was 2.13% DM (leaves) and 0.33% DM (roots) (Figure 5A,B).
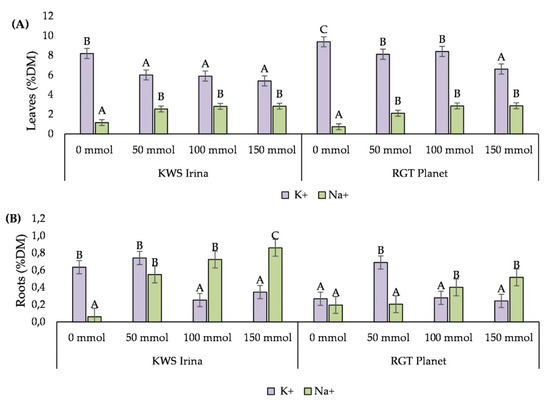
Figure 5.
Potassium (K+) and sodium (Na+) content in the leaves (A) and roots (B) of barley plants depending on the NaCl (mmol NaCl (dm3)−1) concentration used. Capital letters indicate significant differences between the means in the for particular NaCl concentrations (p = 0.05).
4. Discussion
Barley is one of the most tolerant crops under conditions of salinity stress, but with a higher NaCl level, its growth and yield decrease. There are many reports in the literature about the negative influence of salinity on the course of physiological processes in plants as well as a lot of information about the substances used to alleviate the effects of salt stress in plants, for example by reducing the accumulation of reactive oxygen species (ROS) by activating antioxidant enzymes [16,37,38,39,40,41,42,43].
Chlorophyll is one of the most important features reflecting the health condition of plants, and it is related to the availability of water and the level of plant nutrition [44]. The concentration of NaCl at the level of 50 mmol (dm3)−1 in the initial phase of the experiment had a positive effect on the content of chlorophyll in the leaves and the values of the parameters Fv/F0, PI, PN, E, gs, and Ci, regardless of the cultivar. The results of other researchers have shown that moderate amounts of Na+ can improve plant growth [45,46]. High concentrations of NaCl (100 and 150 mmol NaCl (dm3)−1) in the conducted experiment caused significant decreases in the content of chlorophyll in the leaves, parameters of chlorophyll fluorescence, and gas exchange in both of the tested varieties at each measurement date. A decrease in the level of chlorophyll at a salinity level of 100 mmol NaCl (dm3)−1 was also noted in studies carried out on various barley varieties by El-Esawi et al. [47]. The reduction of photosynthetic pigments in most stressed plants may be due to the disintegration of the thylakoid membrane, with a greater degradation of chlorophyll than synthesis through the formation of proteolytic enzymes responsible for the degradation of chlorophyll, as well as through damage to the photosynthetic apparatus [48].
Chlorophyll fluorescence is an effective tool for analysing the photosynthetic capacity of plants and their health under normal or stressful conditions, including salinity stress [49]. The measurement of chlorophyll fluorescence is considered to be a precise method that enables the detection of changes in the general bioenergetic conditions of photosynthetic organisms [50,51,52,53]. Salinity at the level of 100 and 150 mmol NaCl (dm3)−1 caused in the tested varieties significantly decreases in chlorophyll fluorescence for parameters such as Fv/Fm, Fv/F0, and PI. The Fv/Fm ratio reflects the photochemical yield of PSII. Usually, a decrease in photosynthesis efficiency is the first symptom of the negative impact of stresses on a plant, which can affect the maximum PSII quantum yield and is proportional to the Fv/Fm ratio, reflecting the efficiency of light in primary photosynthetic reactions. NaCl stress may disrupt the biochemistry of photosynthesis, limiting the efficiency of two photosystems due to disruption of the integrity of chloroplasts. Under the influence of salt stress, photochemical efficiency and electron transport in PSI and PSII decrease as a result of changes in the structure of thylakoids, limiting the biosynthesis of chlorophyll [48,54,55]. Similar decreases in studies conducted on barley were noted by Kalaji et al. [56]. In our own study, along with the time of exposure of plants to high NaCl concentrations in the soil, the decreases in the parameters tested were higher than in the control for the analysed cultivars. A negative effect of the duration of salt stress was also noted in studies by Bayuelo-Jiménez et al. [57].
At the highest salt concentrations, there was a significant decrease in gas exchange parameters of PN, E, gs, and Ci. Usually, plants close their stomata when stressful conditions arise in order to conserve water, consequently reducing the conductivity of the stomata and photosynthesis [27,58]. In the long term, salinity causes ionic toxicity due to an imbalance of nutrients in the cytosol. In addition, salt stress also manifests itself as oxidative stress at a subcellular level, which is mediated by reactive oxygen species (ROS) [59]. All these responses to salinity contribute to the detrimental effect of salinity on plants [8]. Scientific reports indicate the existence of differences in the level of resistance to salinity between varieties [40,47,60,61,62,63]; however, in our own research no significant differences were found between the analysed cultivars. The results of the conducted research indicate that the KWS Irina and RGT Planet varieties react to salinity in a way characteristic of barley genotypes, with a lower tolerance compared with the genotypes considered tolerant to salt stress, losing more than 40% of their total chlorophyll content at the highest salt concentrations [60,64].
To understand the mechanisms of salinity tolerance, it is important to determine the concentrations of Na+ and K+ in plants. In the experiment carried out in plants, along with an increase in soil salinity, decreases in the K+ content and an increase in Na+ in the leaves and roots was observed. The negative effect of salinity is a consequence of Na+ interference in the assimilation of K+ [65,66,67]. Glycophytes typically react to salt stress by trying to limit the build-up of toxic ions in the leaves, reducing their absorption through the roots or blocking their transport to the above-ground part of the plant. These mechanisms are effective only at a low or moderate salinity, and after exceeding a certain threshold—depending on the tolerance of each specific genotype—there is an increase in Na+ concentration in the leaves [68]. Salinity stress is responsible for an excessive accumulation of Na+ while reducing the uptake of essential nutrients, such as K+, from the roots to the above-ground part responsible for photosynthesis [69]. Salinity largely affects the roots due to their direct contact with the soil. Therefore, the underground parts of plants are primarily responsible for protection against the adverse effects of salinity [54]. Increased Na+ concentration in the root zones has an antagonistic effect on K+ uptake. As a consequence, a deficiency of K+ causes growth inhibition, and thus also a reduction in plant weight [40]. The conducted studies confirm the results of many researchers who noted the harmful effects of high levels of sodium chloride on plants [62,70,71,72].
Authors should discuss the results and how they can be interpreted from the perspective of previous studies and from the working hypotheses. The findings and their implications should be discussed in the broadest context possible. Future research directions may also be highlighted.
5. Conclusions
The aim of the experiment was to evaluate the effect of salt stress on the efficiency and activity of the photosynthetic apparatus of plants of two barley varieties at different NaCl concentrations. The relative chlorophyll content in leaves and selected parameters of chlorophyll fluorescence and gas exchange were assessed. At a salt concentration of 50 mmol NaCl·(dm3)−1, the analyzed varieties were characterized by similar values of the relative content of CCI chlorophyll, fluorescence parameters (FV/Fm, Fv/F0, and PI) and gas exchange parameters (PN, E, gs, and Ci) compared with the controls. Moreover, the concentration of 50 mmol NaCl·(dm3)−1 in the initial phase of the experiment had a positive effect on the value of some of the parameters tested and did not worsen the condition of the plants. Likewise, plant health and dry matter content were most favourable at this salt concentration. Higher concentrations (100 and 150 mmol NaCl·(dm3)−1) had a negative effect on the physiological apparatus of plants already at the first time of measurement, and for the duration of the experiment, the differences in the values of the parameters tested between them increased. The research showed a significant influence of salinity on the PN value. The increase in NaCl concentration in the soil resulted in a decrease of this parameter in the studied varieties. Salt stress also influenced plant transpiration. Both varieties responded with a significant decrease in E at the highest NaCl concentrations. Similarly, in the case of gs, decreases in the measured parameter were noted with increasing the salt concentration. Moreover, higher salt concentrations caused a significant decrease in Ci on each measurement day. A similar dependence was observed in the case of the chlorophyll fluorescence parameters, which changed with the increasing salt concentration and the duration of the experiment. The tested brewing varieties, analysed in terms of physiological parameters, are not suitable for cultivation in areas with a high degree of salinity. However, research should be carried out on the possibility of introducing other varieties of this species to cultivation in areas with a higher salt content in the soil.
Author Contributions
Conceptualization, R.T.-S.; methodology, R.T.-S. and B.S.; investigation, B.S. and D.M.; writing—original draft preparation, B.S. and D.M.; formal analysis, R.T.-S. All authors have read and agreed to the published version of the manuscript.
Funding
This research was financed by the program of the Minister of Science and Higher Education, titled “Regional Initiative of Excellence” in 2019–2022, project number 026/RID/2018/19, with an amount of financing of PLN 9,542,500.00, and from financial resources of the Ministry of Science and Higher Education for scientific activities of the Institute of Agricultural Sciences, Land Management and Environmental Protection, University of Rzeszow.
Institutional Review Board Statement
Not applicable.
Informed Consent Statement
Not applicable.
Data Availability Statement
The data presented in this study are available upon request from the corresponding author upon reasonable request.
Conflicts of Interest
The authors declare no conflict of interest.
References
- Food and Agriculture Organization of the United Nations, Intergovernmental Technical Panel on Soils. Global status of soil salinization and sodification. In Status of the World’s Soil Resources: Main Report; FAO, ITPS: Rome, Italy, 2015; pp. 124–127. [Google Scholar]
- Guerrieri, N.; Cavaletto, M. 8-Cereals proteins. In Proteins in Food Processing, 2nd ed.; Yada, R.Y., Ed.; Woodhead Publishing Ltd.: Oxford, UK, 2018; pp. 223–244. [Google Scholar] [CrossRef]
- Shahbaz, M.; Ashraf, M. Improving salinity tolerance in cereals. Crit. Rev. Plant Sci. 2013, 32, 237–249. [Google Scholar] [CrossRef]
- Isayenkov, S.V.; Maathuis, F.J. Plant salinity stress: Many unanswered questions remain. Front. Plant Sci. 2019, 10, 80. [Google Scholar] [CrossRef] [PubMed]
- Awaad, H.A.; Mansour, E.; Akrami, M.; Fath, H.E.; Javadi, A.A.; Negm, A. Availability and feasibility of water desalination as a non-conventional resource for agricultural irrigation in the mena region: A review. Sustainability 2020, 12, 7592. [Google Scholar] [CrossRef]
- Artiola, J.F.; Walworth, J.L.; Musil, S.A.; Crimmins, M.A. Soil and Land Pollution. In Environmental and Pollution Science, 3rd ed.; Brusseau, M.L., Pepper, I.L., Gerba, C.P., Eds.; Academic Press: London, UK, 2019; pp. 219–235. [Google Scholar] [CrossRef]
- Arif, Y.; Singh, P.; Siddiqui, H.; Bajguz, A.; Hayat, S. Salinity induced physiological and biochemical changes in plants: An omic approach towards salt stress tolerance. Plant Physiol. Biochem. 2020, 156, 64–77. [Google Scholar] [CrossRef]
- Acosta-Motos, J.R.; Ortuño, M.F.; Bernal-Vicente, A.; Diaz-Vivancos, P.; Sanchez-Blanco, M.J.; Hernandez, J.A. Plant responses to salt stress: Adaptive mechanisms. Agronomy 2017, 7, 18. [Google Scholar] [CrossRef]
- Sudhir, P.; Murthy, S.D.S. Effects of salt stress on basic processes of photosynthesis. Photosynthetica 2004, 42, 481–486. [Google Scholar] [CrossRef]
- Parida, A.K.; Das, A.B. Salt tolerance and salinity effects on plants: A review. Ecotoxicol. Environ. Saf. 2005, 60, 324–349. [Google Scholar] [CrossRef]
- Munns, R.; James, R.A.; Läuchli, A. Approaches to increasing the salt tolerance of wheat and other cereals. J. Exp. Bot. 2006, 57, 1025–1043. [Google Scholar] [CrossRef]
- Bagheri, A.; Sadeghipour, O. Effects of salt stress on yield components, carbohydrates content in four hull-less barley (Hordeum vulgare L.) cultivars. J. Biol. Sci. 2009, 9, 909–912. [Google Scholar] [CrossRef][Green Version]
- Adjel, F.; Kadi, Z.; Bouzerzour, H.; Benmahammed, A. Salt stress effects on seed germination and seedling growth of barley (Hordeum vulgare L.) genotypes. J. Agric. Sustain. 2013, 3, 223–237. [Google Scholar]
- Farooq, M.; Gogoi, N.; Barthakur, S.; Baroowa, B.; Bharadwaj, N.; Alghamdi, S.S.; Siddique, K.H.M. Drought stress in grain legumes during reproduction and grain filling. J. Agron. Crop Sci. 2017, 203, 81–102. [Google Scholar] [CrossRef]
- Van-Zelm, E.; Zhang, Y.; Testerink, C. Salt tolerance mechanisms of plants. Annu. Rev. Plant Biol. 2020, 71, 403–433. [Google Scholar] [CrossRef] [PubMed]
- Zhang, Y.; Fan, Y.; Rui, C.; Zhang, H.; Xu, N.; Dai, M.; Chen, X.; Lu, X.; Wang, D.; Wang, J.; et al. Melatonin Improves Cotton Salt Tolerance by Regulating ROS Scavenging System and Ca2+ Signal Transduction. Front. Plant Sci. 2021, 12, 1239. [Google Scholar] [CrossRef]
- Hernández, J.A.; Ferrer, M.A.; Jiménez, A.; Ros-Barceló, A.; Sevilla, F. Antioxidant systems and O2/H2O2 production in the apoplast of Pisum sativum L. leaves: Its relation with NaCl-induced necrotic lesions in minor veins. Plant Physiol. 2001, 127, 817–831. [Google Scholar] [CrossRef]
- Ashraf, M.; Harris, P.J.C. Photosynthesis under stressful environments: An overview. Photosynthetica 2013, 51, 163–190. [Google Scholar] [CrossRef]
- Acosta-Motos, J.R.; Díaz-Vivancos, P.; Álvarez, S.; Fernández-García, N.; Sánchez-Blanco, M.J.; Hernández, J.A. NaCl-induced physiological and biochemical adaptative mechanism in the ornamental Myrtus cummunis L. plants. J. Plant Physiol. 2015, 183, 41–51. [Google Scholar] [CrossRef]
- Acosta-Motos, J.R.; Díaz-Vivancos, P.; Álvarez, S.; Fernández-García, N.; Sánchez-Blanco, M.J.; Hernández, J.A. Physiological and biochemical mechanisms of the ornamental Eugenia myrtifolia L. plants for coping with NaCl stress and recovery. Planta 2015, 242, 829–846. [Google Scholar] [CrossRef]
- Ainsworth, E.A. Understanding and improving global crop response to ozone pollution. Plant J. 2016, 90, 886–897. [Google Scholar] [CrossRef]
- Khalil, S.E.; Hussein, M.M.; Da Silva, J.T. Roles of antitranspirants in improving growth and water relations of Jatropha curcas L. grown under water stress conditions. Plant Stress 2012, 6, 49–54. [Google Scholar]
- Hernández, J.A.; Almansa, M.S. Short-term effects of salt stress on antioxidant systems and leaf water relations of pea plants. Physiol. Plant. 2002, 115, 251–257. [Google Scholar] [CrossRef] [PubMed]
- Stepien, P.; Johnson, G.N. Contrasting responses of photosynthesis to salt stress in the glycophyte Arabidopsis and the halophyte Thellungiella: Role of the plastid terminal oxidase as an alternative electron sink. Plant Physiol. 2009, 149, 1154–1165. [Google Scholar] [CrossRef] [PubMed]
- Parida, A.; Das, A.B.; Das, P. NaCl stress causes changes in photosynthetic pigments, proteins, and other metabolic components in the leaves of a true mangrove, Bruguiera parviflora, in hydroponic cultures. J. Plant Biol. 2002, 45, 28–36. [Google Scholar] [CrossRef]
- Duarte, B.; Santos, D.; Marques, J.C.; Caçador, I. Ecophysiological adaptations of two halophytes to salt stress: Photosynthesis, PS II photochemistry and antioxidant feedback—Implications for resilience in climate change. Plant Physiol. Biochem. 2013, 67, 178–188. [Google Scholar] [CrossRef]
- Chaves, M.M.; Flexas, J.; Pinheiro, C. Photosynthesis under drought and salt stress: Regulation mechanisms from whole plant to cell. Ann. Bot. 2009, 103, 551–560. [Google Scholar] [CrossRef]
- Asada, K. The water–water cycle in chloroplasts: Scavenging of active oxygen and dissipation of excess photons. Ann. Rev. Plant Physiol. Plant Mol. Biol. 1999, 50, 601–639. [Google Scholar] [CrossRef]
- Moradi, F.; Ismail, A.M. Responses of photosynthesis, chlorophyll fluorescence and ROS-scavenging systems to salt stress during seedling and reproductive stages in rice. Ann. Bot. 2007, 99, 1161–1179. [Google Scholar] [CrossRef]
- Lee, M.H.; Cho, E.J.; Wi, S.G.; Bae, H.; Kim, J.E.; Cho, J.Y.; Lee, S.; Kim, J.H.; Chung, B.Y. Divergences in morphological changes and antioxidant responses in salt-tolerant and salt-sensitive rice seedlings after salt stress. Plant Physiol. Biochem. 2013, 70, 325–335. [Google Scholar] [CrossRef]
- Ikbal, F.; Hernández, J.A.; Barba-Espín, G.; Koussa, T.; Aziz, A.; Faize, M.; Diaz-Vivancos, P. Enhanced salt-induced antioxidative responses involve a contribution of polyamine biosynthesis in grapevine plants. J. Plant Physiol. 2014, 171, 779–788. [Google Scholar] [CrossRef]
- Sairam, R.K.; Tyagi, A. Physiology and molecular biology of salinity stress tolerance in plants. Curr. Sci. 2004, 86, 407–421. [Google Scholar] [CrossRef]
- Bhaskar, G.; Huang, B. Mechanism of salinity tolerance in plants: Physiological, biochemical, and molecular characterization. Int. J. Gen. 2014, 1–18. [Google Scholar] [CrossRef]
- Munns, R.; Tester, M. Mechanisms of salinity tolerance. Annu. Rev. Plant Biol. 2008, 59, 651–681. [Google Scholar] [CrossRef]
- Negrão, S.; Schmöckel, S.M.; Tester, M. Evaluating physiological responses of plants to salinity stress. Ann. Bot. 2017, 119, 1–11. [Google Scholar] [CrossRef]
- Ostrowska, A.; Gawliński, S.; Szczubiałka, Z. Methods of Analysis and Assessment of Soil and Plant Properties; Institute of Environmental Protection: Warsaw, Poland, 1991. [Google Scholar]
- Tavakkoli, E.; Fatehi, F.; Coventry, S.; Rengasamy, P.; McDonald, G.K. Additive effects of Na+ and Cl− ions on barley growth under salinity stress. J. Exp. Bot. 2011, 62, 2189–2203. [Google Scholar] [CrossRef]
- Jamshidi, A.; Javanmard, H.R. Evaluation of barley (Hordeum vulgare L.) genotypes for salinity tolerance under field conditions using the stress indices. Ain Shams Eng. J. 2018, 9, 2093–2099. [Google Scholar] [CrossRef]
- Ketehouli, T.; Idrice Carther, K.F.; Noman, M.; Wang, F.-W.; Li, X.-W.; Li, H.-Y. Adaptation of plants to salt stress: Characterization of Na+ and K+ transporters and role of CBL gene family in regulating salt stress response. Agronomy 2019, 9, 687. [Google Scholar] [CrossRef]
- Zeeshan, M.; Lu, M.; Sehar, S.; Holford, P.; Wu, F. Comparison of biochemical, anatomical, morphological, and physiological responses to salinity stress in wheat and barley genotypes deferring in salinity tolerance. Agronomy 2020, 10, 127. [Google Scholar] [CrossRef]
- Alharbi, B.M.; Elhakem, A.H.; Alnusairi, G.S.H.; Mona, H.; Soliman, M.H.; Hakeem, K.R.; Hasan, M.D.M.; Abdelhamid, M.T. Exogenous application of melatonin alleviates salt stress-induced decline in growth and photosynthesis in Glycine max L. seedlings by improving mineral uptake, antioxidant and glyoxalase system. Plant Soil Environ. 2021, 67, 208–220. [Google Scholar] [CrossRef]
- Hasan, M.M.; Ali, A.M.; Soliman, M.H.; Alqarawi, A.A.; Abd_Allah, E.F.; Fang, X. Insights into 28-homobrassinolide (HBR)-mediated redox homeostasis, AsA–GSH cycle, and methylglyoxal detoxification in soybean under drought-induced oxidative stress. J. Plant Interact. 2020, 15, 371–385. [Google Scholar] [CrossRef]
- Chen, Y.E.; Mao, J.J.; Sun, L.Q.; Huang, B.; Ding, C.B.; Gu, Y. Exogenous melatonin enhances salt stress tolerance in maize seedlings by improving antioxidant and photosynthetic capacity. Physiol. Plant. 2018, 164, 349–363. [Google Scholar] [CrossRef] [PubMed]
- Dawood, M.G.; Taie, H.A.A.; Nassar, R.M.A.; Abdelhamid, M.T.; Schmidhalter, U. The changes induced in the physiological, biochemical and anatomical characteristics of Vicia faba by the exogenous application of proline under seawater stress. S. Afr. J. Bot. 2014, 93, 54–63. [Google Scholar] [CrossRef]
- Maathuis, F.J.M. Sodium in plants: Perception, signalling, and regulation of sodium fluxes. J. Exp. Bot. 2014, 65, 849–858. [Google Scholar] [CrossRef]
- Wu, H. Plant salt tolerance and Na+ sensing and transport. Crop J. 2018, 6, 215–225. [Google Scholar] [CrossRef]
- El-Esawi, M.A.; Alaraidh, I.A.; Alsahli, A.A.; Ali, H.M.; Alayafi, A.A.; Witczak, J.; Ahmad, M. Genetic variation and alleviation of salinity stress in barley (Hordeum vulgare L.). Molecules 2018, 23, 2488. [Google Scholar] [CrossRef]
- Parida, A.K.; Das, A.B.; Mittra, B. Effects of NaCl stress on the structure, pigment complex composition, and photosynthetic activity of mangrove Bruguiera parviflora chloroplasts. Photosynthetica 2003, 41, 191. [Google Scholar] [CrossRef]
- Akhter, M.S.; Noreen, S.; Mahmood, S.; Athar, H.U.; Ashraf, M.; Alsahli, A.A.; Ahmad, P. Influence of salinity stress on PSII in barley (Hordeum vulgare L.) genotypes, probed by chlorophyll-a fluorescence. J. King Saud Univ. Sci. 2021, 33, 101239. [Google Scholar] [CrossRef]
- Goltsev, V.; Zaharieva, I.; Chernev, P.; Kouzmanova, M.; Kalaji, H.M.; Yordanov, I.; Krasteva, V.; Alexandrov, V.; Stefanov, D.; Allakhverdiev, S.I.; et al. Drought-induced modifications of photosynthetic electron transport in intact leaves: Analysis and use of neural networks as a tool for a rapid non-invasive estimation. Biochim. Biophys. Acta BBA Bioenerg. 2012, 1817, 1490–1498. [Google Scholar] [CrossRef]
- Brestic, M.; Zivcak, M. PSII Fluorescence Techniques for Measurement of Drought and High Temperature Stress Signal in Crop Plants: Protocols and Applications. In Molecular Stress Physiology of Plants; Rout, G.R., Das, A.B., Eds.; Springer: New Delhi, India, 2013; pp. 87–131. [Google Scholar] [CrossRef]
- Kalaji, H.M.; Schansker, G.; Ladle, R.J.; Goltsev, V.; Bosa, K.; Allakhverdiev, S.I.; Berstic, M.; Bussotti, F.; Calatayud, A.; Dąbrowski, P.; et al. Frequently asked questions about in vivo chlorophyll fluorescence: Practical issues. Photosynth. Res. 2014, 122, 121–158. [Google Scholar] [CrossRef] [PubMed]
- Dąbrowski, P.; Baczewska, A.H.; Pawluśkiewicz, B.; Paunov, M.; Alexantrov, V.; Goltsev, V.; Kalaji, M.H. Prompt chlorophyll a fluorescence as a rapid tool for diagnostic changes in PSII structure inhibited by salt stress in Perennial ryegrass. J. Photoch. Photobio. B 2016, 157, 22–31. [Google Scholar] [CrossRef]
- Ibrahim, W.; Ahmed, I.M.; Chen, X.; Cao, F.; Zhu, S.; Wu, F. Genotypic differences in photosynthetic performance, antioxidant capacity, ultrastructure and nutrients in response to combined stress of salinity and Cd in cotton. BioMetals 2015, 28, 1063–1078. [Google Scholar] [CrossRef] [PubMed]
- Kalaji, H.M.; Jajoo, A.; Oukarroum, A.; Brestic, M.; Zivcak, M.; Samborska, I.A.; Cetner, M.D.; Łukasik, I.; Goltsev, V.; Ladle, R.J. Chlorophyll a fuorescence as a tool to monitor physiological status of plants under abiotic stress conditions. Acta Physiol. Plant. 2016, 38, 102. [Google Scholar] [CrossRef]
- Kalaji, H.M.; Bosa, K.; Kościelniak, J.; Żuk-Gołaszewska, K. Effects of salt stress on photosystem II efficiency and CO2 assimilation of two Syrian barley landraces. Environ. Exp. Bot. 2011, 73, 64–72. [Google Scholar] [CrossRef]
- Bayuelo-Jiménez, J.S.; Jasso-Plata, N.; Ochoa, I. Growth and physiological responses of Phaseolus species to salinity stress. Int. J. Agron. 2012, 2012, 1–13. [Google Scholar] [CrossRef]
- Kiani-Pouya, A.; Rasouli, F.; Rabbi, B.; Falakboland, Z.; Yong, M.; Chen, Z.H.; Zhou, M.; Shabala, S. Stomatal traits as a determinant of superior salinity tolerance in wild barley. J. Plant Physiol. 2020, 245, 153108. [Google Scholar] [CrossRef]
- Miller, G.; Suzuki, N.; Ciftci-Yilmaz, S.; Mittler, R. Reactive oxygen species homeostasis and signalling during drought and salinity stresses. Plant Cell Environ. 2010, 33, 53–467. [Google Scholar] [CrossRef]
- Allel, D.; Ben-Amar, A.; Abdelly, C. Leaf photosynthesis, chlorophyll fluorescence and ion content of barley (Hordeum vulgare L.) in response to salinity. J. Plant Nutr. 2018, 41, 497–508. [Google Scholar] [CrossRef]
- Knipfer, T.; Danjou, M.; Vionne, C.; Fricke, W. Salt stress reduces root water uptake in barley (Hordeum vulgare L.) through modification of the transcellular transport path. Plant Cell Environ. 2021, 44, 458–475. [Google Scholar] [CrossRef]
- Moustafa, E.S.A.; Ali, M.A.A.; Kamara, M.M.; Awad, M.F.; Hassanin, A.A.; Mansour, E. Field screening of wheat advanced lines for salinity tolerance. Agronomy 2021, 11, 281. [Google Scholar] [CrossRef]
- Zahra, J.; Nazim, H.; Cai, S.; Han, Y.; Wu, D.; Zhang, B.; Haider, S.I.; Zhang, G. The influence of salinity on cell ultrastructures and photosynthetic apparatus of barley genotypes differing in salt stress tolerance. Acta Physiol. Plant 2014, 36, 1261–1269. [Google Scholar] [CrossRef]
- Majeed, A.; Muhammad, Z. Salinity: A Major Agricultural Problem—Causes, Impacts on Crop Productivity and Management Strategies. In Plant Abiotic Stress Tolerance; Hasanuzzaman, M., Hakeem, K.R., Nahar, K., Alharby, H.F., Eds.; Springer: Cham, Switzerland, 2019; pp. 83–99. [Google Scholar] [CrossRef]
- Liu, L.; Ueda, A.; Saneoka, H. Physiological responses of white Swiss chard (Beta vulgaris L. subsp. cicla) to saline and alkaline stresses. Aust. J. Crop Sci. 2013, 7, 1046–1052. [Google Scholar]
- Foster, K.J.; Miklavcic, S.J. Toward a biophysical understanding of the salt stress response of individual plant cell. J. Theor. Biol. 2015, 385, 130–142. [Google Scholar] [CrossRef]
- Sun, Y.; Lindberg, S.; Shabala, L.; Morgan, S.H.; Shabala, S.; Jacobsen, S.E. A comparative analysis of cytosolic Na+ changes under salinity between halophyte quinoa (Chenopodium quinoa) and glycophyte pea (Pisum sativum). Environ. Exp. Bot. 2017, 141, 154–160. [Google Scholar] [CrossRef]
- Volkov, V. Salinity tolerance in plants. Quantitative approach to ion transport starting from halophytes and stepping to genetic and protein engineering for manipulating ion fluxes. Front. Plant Sci. 2015, 6, 873. [Google Scholar] [CrossRef]
- Zhao, C.; Zhang, H.; Song, C.; Zhu, J.K.; Shabala, S. Mechanisms of plant responses and adaptation to soil salinity. Innovation 2020, 1, 100017. [Google Scholar] [CrossRef]
- Abd El-Samad, H.M.; Shaddad, M.A.K.; Barakat, N. Improvement of plants salt tolerance by exogenous application of amino acids. J. Med. Plant Res. 2011, 5, 5692–5699. [Google Scholar] [CrossRef]
- El-Lethy, S.R.; Abdelhamid, M.T.; Reda, F. Effect of potassium application on wheat (Triticum aestivum L.) cultivars grown under salinity stress. World Appl. Sci. J. 2013, 26, 840–850. [Google Scholar] [CrossRef]
- Osman, M.S.; Badawy, A.A.; Osman, A.I.; Abdel Latef, A.A. Ameliorative impact of an extract of the halophyte Arthrocnemum macrostachyum on growth and biochemical parameters of soybean under salinity stress. J. Plant Growth Regul. 2020, 40, 1–12. [Google Scholar] [CrossRef]
Publisher’s Note: MDPI stays neutral with regard to jurisdictional claims in published maps and institutional affiliations. |
© 2021 by the authors. Licensee MDPI, Basel, Switzerland. This article is an open access article distributed under the terms and conditions of the Creative Commons Attribution (CC BY) license (https://creativecommons.org/licenses/by/4.0/).