Abstract
The objective of this study is to identify cowpea genotypes that are tolerant to both phosphorous and drought stresses on highly weathered soil. It is hypothesized that (1) genotypes that have the highest grain yield under optimum conditions do not perform best under P or water stress and (2) genotypes that have the highest grain yield under P stress conditions also perform well under water or combined water and P stress. An experiment was conducted in the humid forest zone of Ghana during two dry seasons (2017 and 2018). Ten cowpea genotypes were evaluated in response to four combinations of P fertilizer and drought treatments. The treatments included 0 kg P ha−1 + water stress (0P + WS; control treatment); 60 kg P ha−1 + water stress (60P + WS); 0 kg P ha−1 + no water stress (0P + NWS); 60 kg P ha−1 + no water stress (60P + NWS; optimum condition) in both field experiments. The experiment was laid out in a split plot arrangement with three replications. The grain yield of the cowpea genotypes during 2017 growing cycle ranged between 1094 and 3600 kg ha−1, and in 2018 between 928 and 3125 kg ha−1. In both growing cycles, genotypes Asontem and GH5344 had the highest grain yield under optimum conditions (60 kg P ha−1 + water). Under combined P and water stress, Hans adua, GH6060 and Asontem were the best three genotypes with grain yield ranging between 1678 and 1478 kg ha−1 and this observation was made during both growing cycles. In conclusion, the genotypes showed a variable response to the different treatments in this study. Hypothesis 1 (genotypes that have the highest grain yield under optimum conditions do not perform best under water or P stress conditions) was not confirmed as the genotypes GH2309 and GH6060 (ranking 3rd and 4th under optimum conditions) were among the three best cultivars both under water or P stress conditions. Hypothesis 2.1 (genotypes that have the highest grain yield under P stress conditions perform well under water stress conditions) was confirmed for all genotypes studied except for the genotype Asontem. Hypothesis 2.2 (genotypes that have the highest grain yield under P stress conditions perform also well under combined water and P stress) was true since the best four genotypes under P stress where the best four genotypes under combined water and P stress (0P + WS). GH6060, Hans adua and Asontem are most adapted to combined water and P stress and need to be further explored to ascertain their potential as drought and phosphorus deficiency-tolerant genotypes.
1. Introduction
Cowpea (Vigna unguiculata L. Walp.) is an important food legume throughout West and Central Africa. It occupies a smaller proportion of the crop area compared to cereals and contributes significantly to household food security in West and Central Africa [1]. Globally, the total estimated area of cowpea production is about 14 million ha. Out of this, West Africa accounts for almost 9.3 million ha, deriving an annual production of 2.9 million Mg. Cowpea makes a valuable contribution towards human food and livestock fodder and its dual-purpose character makes it a very attractive crop where land is becoming scarce [2]. It has a unique ability to fix atmospheric nitrogen through its nodules and grows well even in poor soils with more than 85% sand and less than 0.2% organic matter and low levels of phosphorus [3]. Additionally, it is shade tolerant and, therefore, compatible as an inter-crop with maize, millet, sorghum, sugarcane and cotton, as well as with several plantation crops [4]. Coupled with these characteristics, its quick growth and rapid ground cover make it a suitable plant to prevent soil erosion. As relatively inexpensive sources of high-quality protein [5], cowpeas are important in the nutrition of the poor. The economic and nutritional importance of cowpea in West Africa makes it a key subject for research.
Cowpea is a drought-tolerant and tropical crop, which is well adapted to the semi-arid regions of the tropics where other food legumes do not perform well [2]. Despite its ability to thrive under various drought conditions which would otherwise render other field crops unproductive [6], there have been various reports demonstrating significant drought tolerance existing among cowpea genotypes [7,8]. Tolerance to drought in cowpea has been attributed to increased photosynthetic response to drought stress and is highly complex. It involves the interplay of processes taking place at different sites of the cell or leaf and at different time scales concerning plant development [9]. The reduction in photosynthetic activity is due to several coordinated events, such as stomatal closure and the reduced activity of photosynthetic enzyme depth [10], while greater nutrient acquisition has been associated with topsoil foraging, especially in the case of immobile resources such as phosphorus [11]. Mid- and late-season drought stresses have received considerable attention, given their negative effects on yield [12,13,14]. Low levels of soil available N and P and large crop responses to N and P fertilizer applications are common for both cereals and legumes in the moist savanna of West Africa [15]. The P fertilizer use efficiency (grain yield per unit of nutrient supplied) [16] has been established to a certain extent in cowpea [17]. Root symbiosis with Arbuscular Mycorrhizal fungi (AMF) has also been shown to enhance P absorption by increasing the effective root area [18].
Water and phosphorus can represent extremely contrasting resource availability in time and space, where soil water is ephemeral, mobile and in dry periods only in the subsoil, whereas soil phosphorus is stable, immobile and usually concentrated in the topsoil. Studies have indicated that moisture content in soil has a strong effect on P uptake by plants [19]. While the single effects of irrigation or P application on the grain yield, grain yield components and P-related parameters of cowpea have been reported in numerous studies, not much has been published about the interactive effects of these factors, especially on highly weathered, acidic and low-P soils in Africa. The objective of this study is to identify cowpea genotypes that are tolerant to both P and drought stress on a highly weathered tropical soil with strong P fixation capacity. We hypothesize that (1) genotypes that have the highest grain yield under optimum conditions do not perform best under water or P stress conditions and (2) genotypes that have the highest grain yield under P stress conditions (2.1) perform well under water stress conditions and (2.2) also perform well under combined water and P stress.
2. Materials and Methods
Two field experiments were conducted at the Crops Research Institute (CRI), Fumesua, in the Ashanti Region of Ghana in the dry season of 2017 and 2018, respectively. The mean daily temperature during the experimental period in the two years of this study was 30.4 °C and 32.0 °C with a relative humidity of 79.9% and 83.3%, respectively. Total rainfall during the growing cycle was 143 and 119 mm in 2017 and 2018, respectively. Physical and chemical soil analyses were conducted on soil samples from four different soil depths before the beginning of the field experiments. The soil texture of both experimental sites was sandy loam in the topsoil and clay in the subsoil (>60 cm; Table 1). Water-holding capacity of the soil layers is expressed as water content at field capacity (0.33 bar). Ammonium acetate, aluminum (titration method) and Bray 1 methods were used to extract exchangeable bases, exchangeable acids and available P, respectively (Table 2). The results of the physical analyses of the soils for experiments 1 and 2 are presented in Table 1 and Table 2. Ten (10) cowpea lines were selected based on screening trials in pots in the greenhouse, including the best five genotypes (Asontem, GH-2200, GH-2309, F2T2K66 and GH-6060), that were tolerant to P and water stress and the worst five (Asomdwee, GH-5344, Hans adua, Nketewade and F2T2A36) genotypes that were susceptible to P and water stress. The selection criterion was aboveground biomass productivity.

Table 1.
Average physical characteristics of soil (0–90 cm depth) at Fumesua.
Table 2.
Average chemical characteristics of top and subsoil (0–90 cm depth) at Fumesua.
Both field experiments were conducted in a split plot design with 3 factors (P fertilizer application levels, water regimes and cowpea genotypes) with three replicates. The main plot comprised the 10 selected cowpea genotypes. The subplot was P fertilizer application (triple superphosphate) with two levels (0 kg Pha−1 and 60 kg Pha−1) with water treatment as a sub-subplot level (with water stress and without water stress). A total of four combinations of P fertilizer and water treatment were established in the field experiment (sub- and sub-subplots): 0 kg Pha−1 + water stress (0P + WS, control treatment); 0 kg Pha−1 + no water stress (0P + NWS); 60 kg Pha−1 + water stress (60P + WS); 60 kg Pha−1 + no water stress (60P + NWS, optimum condition) for the field experiments in both years.
All cowpea seeds were surface sterilized with moncerene at 5 mL of chemical to 15 liters of water. The seeds were dipped in the chemical solution for 30 s and allowed to dry for 15−20 min. Seeds for the first and second experiments were sown on 23rd December 2017 and 29th December 2018, respectively. Four seeds of each variety were sown per hill and thinned to one plant per hill 10 days after emergence. Both experiments were conducted within a land area of 1354.4 m2 with a 0.60 m distance between rows and 0.40 m between hills. The area occupied by each plant was 0.24 m2. Blocks and plots in both experiments were separated by a spacing of 1 m. In both experiments, there were 7 rows in each plot and each row was 1.8 m.
In all treatments, plants were sufficiently irrigated twice daily (morning and evening) to avoid any occurrence of water stress until 21 days after planting to ensure uniform germination and good seedling establishment. Then, in the water stress treatment (WS), irrigation was interrupted at vegetative and flowering stages of growth, i.e., no water was applied for 2 weeks. At the vegetative stage, stress was imposed at 21 days after planting for 2 weeks and at the flowering stage after the emergence of flower buds for 2 weeks (Table 3). A line source irrigation system with impact sprinklers was used to irrigate the amount of water stated in Table 3. All field observations and plant samples were obtained from the central five rows of each plot. At maturity, the five rows were harvested for grain yield. Outer rows were not included during the sampling processes in order to avoid border effects on the measurements.
Table 3.
Irrigation schedule showing amount of water applied (mm) and days of application in the water stress (WS) and no water stress (NWS) treatments in 2017 and 2018 planting seasons.
A mixture of Karate® 2.5 E.C. (a.i. 25 g lambda-cyhalothrin (Hangzhou Tianlong Biotechnology Co., Ltd., Hangzhou, China) per liter; 4 mL L−1 Vertimec (Syngenta Agro Maintal, Am Technologiepark 1-5 ·63477- Maintal, Germany), 1.8%w v−1 Abamectin (King Tech Corporation, Shenzhen, chiana) (18 g L−1; 1.5 mL in 1 L of water) [3] was sprayed twice (third and fifth weeks) to control insects in the vegetative phase. Then Sunpyrifos® (5.3 mL in 1 L of water) was sprayed twice (before and after flowering) to control insect pests and diseases, especially white flies (Trialeurodes vaporariorum) and bacterial blight disease (Pseudomonas savastanoi), which were very prominent during the experimental period. The bacterial blight disease infestation in 2018 was more severe than in 2017, as well as white flies. Roundup (Monsanto Agrar Deutschland GmbH, Düsseldorf, Germany) and Gramoquat were used to control weeds.
Harvesting was carried out manually in both experiments. Harvesting of plant samples was carried out 60 days after planting onwards depending on the physiological maturity of the different genotypes. Plants were sampled in the five central rows in an area of 1.2 m2 to determine the final biomass and grain yield. After each treatment (water stress application) during the vegetative stage, 3 plants were harvested from each plot and oven-dried at 65 °C for 72 h. The samples were weighed to determine dry shoot biomass. The greenness of leaves was a proxy for chlorophyll content and was measured using a Soil Plant Analysis Development (SPAD ) 502 Plus Chlorophyll Meter (Spectrum Technologies, 3600 Thayer Ct, IL, USA). Three plants in each plot of each replicate from genotypes Hans adua, GH6060, GH5344 and Nketewade roots were excavated to a soil depth of 90 cm together with the soil at the stage of pod initiation around 40 days after planting and gently washed to determine root length density using WINRHIZO PRO 2012 Software (Regent Instruments Inc, Ville de Québec, QC, Canada) to understand how these genotypes responded to the four treatments (0 kg Pha−1 + NWS; 0 kg Pha−1 + WS; 60 kg Pha−1 + NWS; 60 kg Pha−1 + WS). Yield data and root length density obtained from both experiments were analyzed using GenStat (17th edition, VSN INTERNATIONAL LIMITED, 5 The Waterhouse Street, Hemel Hempstead, United Kingdom). A linear model procedure using the restricted maximum likelihood method was performed for ANOVA. Treatment means were separated by the least significant differences (LSD) test at p < 0.05.
3. Results
3.1. Water Effects on Leaf Greenness and Shoot Biomass
Water stress reduced SPAD values and biomass of all the cowpea genotypes evaluated during vegetative stages in this study. Haevily affected were Asomtwee, F2T2A36 and Nketewade compared to Asontem, GH2309 and GH6060, which were less affected during both growing cycles (Table 4). Water stress reduced biomass, especially during the 2017 growing cycle at the vegetative stage, and especially in genotypes Asomtwee, GH2200 and F2T2A36. However, Asontem, GH6060, GH2309 and GH5344 were less affected by water stress in both 2017 and 2018 growing cycles (Table 5).
Table 4.
Measurements of leaf greenness of cowpea genotypes using SPAD meter after imposition of first stress at the vegetative stage for 2017 and 2018 growing periods. Values showing the same letters indicate no significant differences between genotypes within individual water and phosphorus treatments at p ≤ 0.05.
Table 5.
Biomass (kg DM ha−1) of cowpea genotypes after imposition of water stress during vegetative stage for 2017 and 2018 growing cycles. Values showing the same letters indicate no significant differences between genotypes within individual water treatments at p ≤ 0.05.
3.2. Grain Yield of Some Cowpea Genotypes under Optimum Conditions (No P or Water Stress)
Under the application of 60 kg ha−1 phosphorus and optimum water supply, grain yield of the cowpea genotypes ranged in 2017 between 3600 and 1094, and in 2018 between 3125 and 928 kg ha−1. Genotypes Asontem and GH5344 had significantly higher yields in both growing cycles (Figure 1a) and these were confirmed by improved growth, number of pods per plant, number of seeds per pod and seed weight (Figure 2). Genotypes GH6060, GH2309 and Hans adua in 2017 produced grain yields of 2427, 1744 and 1578 kg ha−1, respectively. They were significantly ranked from the third to sixth position in terms of high to low. F2T2K66, F2T2A36 and GH2200 were the three genotypes with the lowest yield during the 2017 growing cycle, producing grain yields of 1150, 1106 and 1094 kg ha−1, respectively (Figure 1a). During the 2018 growth cycle, genotypes Asomdwee, GH2309 and GH6060 occupied the third to fifth positions, while Hans adua, GH2200 and F2T2K66 occupied the last three positions (Figure 1a) in terms of the grain yield recorded.
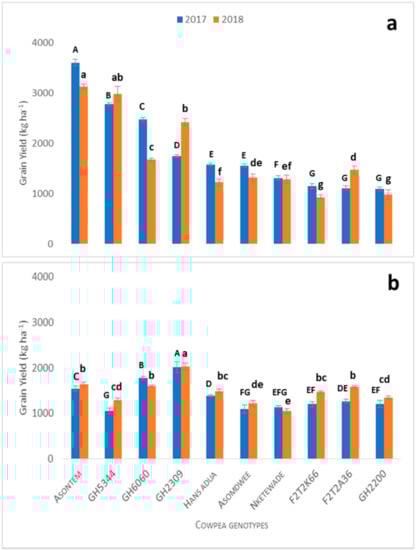
Figure 1.
Grain yield of cowpea genotypes under no water stress with phosphorus treatment (60P + NWS) at maturity in 2017 and 2018 planting season (a) and under P stress conditions (0P + NWS) at maturity in 2017 and 2018 (b). Vertical bars represent ± S.E. of the mean (n = 3). Different letters above the columns indicate statistical significance at the p < 0.05 level within the same measurement stage (capital letters compare significance levels within 2017 and small letters compare significance levels within 2018). Bars showing the same letters indicate no significant differences between genotypes at p < 0.05.
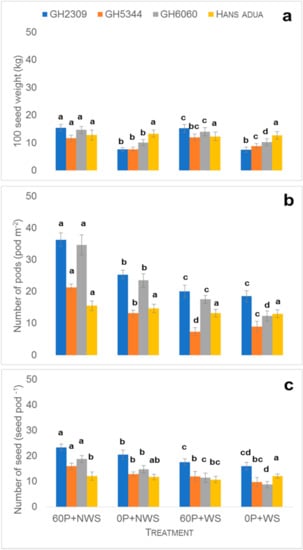
Figure 2.
The 100 seed weight (a) number of pods (b), number of seeds (c) of four cowpea genotypes at day 0 (60 P = 60 kg P ha−1, WS = water stress over two weeks after 21 DAS ( Days after sowing)and flowering, NWS = no water stress i.e., optimum irrigation). Vertical bars represent ± S.E. of the mean (n = 3). Bars showing the same letters indicate no significant differences between genotypes at p < 0.05.
3.3. Grain Yield Response under Phosphorus Stress
The treatment “P stress under optimum water supply (0P + NWS)” was used to evaluate the genotypic variability of the cowpea cultivars with respect to P deficiency based on the grain yields during the 2017 and 2018 growing cycles (Figure 1b). Maximum grain yield decreased under phosphorus stress conditions (2028 kg ha−1) compared to the optimum conditions (3600 kg ha−1) (fully irrigated and 60 kg ha−1 P application, Section 3.1). Genotype GH2309 was the only genotype that significantly and consistently showed a higher yield in both growing cycles compared to the rest of the genotypes (Figure 1b). In the 2017 growing cycle, genotype GH6060 was the second-highest yielding genotype, significantly higher compared to Asontem and Hans adua. However, during the 2018 growing cycle, Asontem ranked second in grain yield while Hans adua dropped to the fifth position. Among the genotypes that performed better in 2018 compared to 2017 was F2T2A36, which had a grain yield of 1583 and 1267 kg ha−1, respectively, suggesting that grain yields obtained in the 2018 growing cycle were relatively higher compared to the 2017 growing cycle under phosphorus stress. Grain yields of genotypes F2T2K66, Nketewade, Asomdwee and GH5344 ranged between 1203 and 1056 kg ha−1 and these genotypes performed poorly in grain yield during both growing cycles in 2017 and 2018. Grain yields of genotypes GH2200, GH5344, Asomdwee and Nketewade were poor and ranged between 1347 and 1050 kg ha−1 (1b).
3.3.1. Grain Yield of Cowpea Genotypes under Water Stress Conditions
Water stress reduced grain yields of all the cowpea genotypes (average maximum yield 2300 kg ha−1) relative to the optimum conditions (average maximum yield 3300 kg ha−1) in both the 2017 and 2018 growing cycles (Figure 3a). There were varied responses of cowpea genotypes to grain yields under water stress with phosphorus application. Grain yields increased with water stress compared to the control conditions. In the 2017 growing cycle, grain yields were higher compared to the 2018 growing cycle (Figure 3a). In 2017, the grain yield of genotype GH2309 (2317 kg ha−1) was the highest and significant, compared to the second, third and fourth genotypes, which were GH6060 (1667 kg ha−1), GH5344 (1661 kg ha−1) and Hans adua (1622 kg ha−1), respectively. The last three genotypes were Asomdwee (978 kg ha−1), GH2200 (894 kg ha−1) and F2T2A36 (839 kg ha−1). These genotypes did not show significant treatment effects during the 2017 growing cycle (Figure 2a). In the 2018 growing cycle, genotype GH2309 significantly produced more grain yield compared to all the genotypes evaluated in this study. The genotypes that performed poorly included F2T2A36 and Asomdwee, with grain yields of 654 and 434 kg ha−1, respectively, during the 2018 growing cycle. Considering the significant performance levels based on the grain yields, the genotypes can be grouped into four groups (Figure 3a).
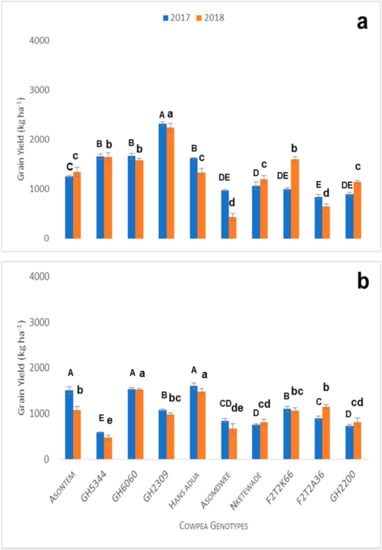
Figure 3.
Grain yield of cowpea genotypes under water stress with phosphorus treatment (60P + WS) at maturity in 2017 and 2018 planting season (a) and grain yield under combined P and water stress conditions (0P + WS) at maturity in 2017 and 2018 (b). Vertical bars represent ± S.E. of the mean (n = 3). Different letters above the columns indicate statistical significance at the p < 0.05 level within the same measurement stage (capital letters compare significance levels within 2017 and small letters compare significance levels within 2018). Bars showing the same letters indicate no significant differences between genotypes at p < 0.05.
3.3.2. Grain Yield of Some Cowpea Genotypes under Combined P and Water Stress
Combined P and water stress reduced maximum grain yields of all cowpea genotypes to about 50% relative to the control conditions in both the 2017 and 2018 growing cycles (Figure 3b). Grain yields of Hans adua, GH6060 and Asontem ranged between 1678 and 1478 kg ha−1. They were the best three genotypes during the 2017 and 2018 growing cycles. Additionally, these genotypes produced grain yields which were significantly higher compared to the rest of the genotypes. Nketewade, GH2200 and GH5344 performed poorly in grain yield during 2017 and in the 2018 growing cycle, and Nketewade, Asomdwee and GH5344 genotypes performed poorly (Figure 3b). However, Hans adua, which performed poorly during the pot experiment, increased grain yield when exposed to phosphorous and water stress in field trials during the 2017 and 2018 growing cycles (Figure 3b and Table 6 and Table 7). When comparing the best four genotypes’ root length density, Hans adua recorded a higher root length in response to phosphorous and water stress (Figure 4).
Table 6.
Summary of genotypes with highest grain yield subjected to different treatments during two seasons (60P (60 kg P ha−1), WS, water stress over two weeks after 21 DAS and flowering; NWS, no water stress, i.e., optimum irrigation.
Table 7.
Average grain yield (kg ha−1) of all the genotypes at maturity for the years 2017 and 2018. Values represent ± S.E. of the mean (n = 3). Values showing the same letters indicate no significant differences between genotypes within individual water and phosphorus treatments at p ≤ 0.05.
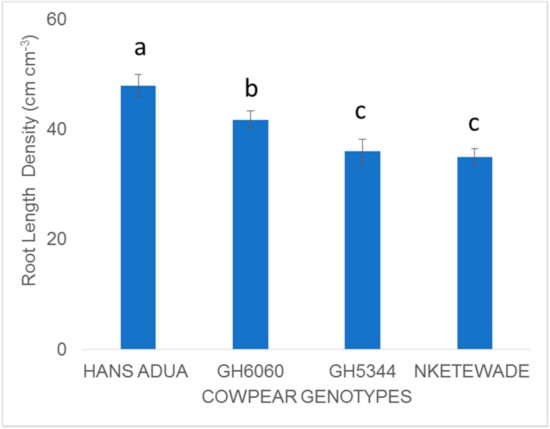
Figure 4.
Comparing root length density of four genotypes subjected to P and water stress during field studies. Values are means of three replicates (n = 3) and standard error bars. Different letters above the column indicate statistical significance at the p < 0.05 level within the same measurement stage. Bars showing the same letters indicate no significant differences between genotype treatments at p < 0.05.
4. Discussion
4.1. Water Stress Reduced Chlorophyll Centent and Shoot Biomass of Some Cowpea Genotypes
In order to determine how water stress affects the yield of cowpea, we measured chlorophyll content and determined shoot biomass. Water stress significantly decreased chlorophyll content and biomass (Table 4 and Table 5). These reductions of chlorophyll content and shoot biomass could be due to a reduced uptake rate of water and nutrients, culminating in the reduction of photosynthesis and stomatal conductance as a result of water stress [9]. Water stress and other environmental factors determine the rate of CO2 assimilation, which negatively affects the build-up of biomass that contributes to grain yield under stress conditions [20]. It has been reported that cowpea has a drought avoidance mechanism of reducing its chlorophyll content and changing the leaflet position under water stress [21]. Less influence on the chlorophyll content and shoot biomass of genotypes Asontem, GH2309, GH5344 and GH6060 is an indication that the genotypes have an inherent trait to tolerate and be productive during water stress (Table 4 and Table 5).
4.2. Grain Yield of Some Cowpea Genotypes under Optimum Conditions (No P or Water Stress)
Cowpea genotypes evaluated in this study showed a strong variability in grain yield. Under optimum conditions, grain yields recorded during the 2017 growing cycle were mostly higher compared to the 2018 growing cycle (Figure 1a). This might have been due to more unfavorable conditions, such as a higher incidence of bacterial spot as well as white fly infestation during the 2018 growing cycle, which might have caused poorer growth and development of grains during maturity. In 2017, genotypes Hans adua, F2T2K66, GH2200, GH5344 and Asomdwee recorded higher grain yields by rates of 23, 19, 10, 7 and 83%, respectively, compared to the 2018 growing cycle (Figure 1a). Significant differences in soybean performance were seen in two growing cycles and this was due to differences in the moisture conditions and plant nutrition deficiencies or variations in the soil, as reported by [22]. The former two reasons can be excluded in our experiment, as we had an optimum supply of water and phosphorus in the two years under the optimum treatment. The availability of phosphorus and water in the soil plays an important role in biological nitrogen fixation, which enhances the growth and development of cowpea. Genotypes Asontem and GH5344 under optimum conditions had a higher grain yield in both growing cycles relative to other genotypes (Figure 1a). The higher yield performance of Asontem and GH5344 is an indication that the genotypes have the ability to enhance root growth, improving ion uptake from the soil for better growth and development, and express a higher N fixation capacity under optimum conditions. In the case of GH5344, the higher N fixation rate under optimum conditions probably improved growth, with a higher number of pods per plant, number of seeds per pod and seed weight of the aforementioned genotypes (Figure 2), leading to higher yields [23].
4.3. Grain Yield Response under Phosphorus Stress
Phosphorus stress reduced grain yield of all genotypes in 2017 compared to optimum conditions. The genotypes GH2309 (−37.9%), GH6060 (−37.5%) and Asontem (−58.2%) were strongly affected relative to the optimum conditions (Figure 2a). The genotype with the smallest reduction in grain yields during the 2017 growing period was Hans adua (2.1%; Figure 1b). The better performance of this genotype, which was also reflected in the 100 seed weight under phosphorus stress (Figure 2a), may be due to the capacity of the genotype to explore a larger volume of the soil by a more extensive root network (Figure 4) and by releasing substances into the rhizosphere that have the ability to dissolve strongly bound P species. Generally, it is accepted that genotypes with improved tolerance to water stress have the ability to enhance root development, absorb nutrients and maintain water more efficiently [24]. A similar reduction of grain yield to that observed during the 2017 growing cycle was recorded in the 2018 growing cycle in three genotypes (GH2309, GH6060 and Asontem) compared to optimum conditions (Figure 1b). However, two genotypes (GH2309 and GH6060) had higher grain yields under phosphorus stress conditions, culminating in high 100 seed weight compared to the other genotypes in both years. Genotypes identified as good performers under minimal external phosphorus application in drought conditions have the ability to utilize phosphorus available in the soil more efficiently. Phosphorus deficiency affects the grain yield of cowpea cultivated in the field. It is therefore important to breed genotypes with the ability to grow and develop in soils with low availability of phosphorus [25].
However, GH5344 performed poorly in grain yield when phosphorus stress was applied during both growing cycles at rates of −61.9 and −56.7% during the 2017 and 2018 growing cycles, respectively, compared to optimum conditions (Figure 1b). This is an indication that the genotype may be more sensitive to phosphorus deficiency. The poor performance of GH5344 under phosphorus stress may be due to the fact that the genotype has a poor root network compared to, e.g., Hans adua (Figure 4), or is lacking the ability to dissolve strongly absorbed phosphates. The poor grain yield performance of genotype GH5344 may also be a result of poor mycorrhiza association, which has been reported to improve the tolerance of water stress [26].
4.3.1. Grain Yield of Cowpea Genotypes under Water Stress Conditions
The genotypes GH2309, GH5344 and GH6060 recorded the highest grain yields during both growing cycles in response to water stress. The grain yields of genotype GH6060 and other genotypes evaluated in this study were significantly lower relative to non-water stress conditions. However, on average over two cycles, yield reductions were lower in GH2309 (−32.9%), and Hans adua (−14.2%; Figure 3a). The relatively high yield of the two genotypes in both growing cycles indicates an inherent trait ability. Under optimum conditions, Hans adua recorded a low number of pods per m2 and number of seeds per pod but it was able to maintain these yield components compared to the optimum conditions. Compared to other genotypes, it recorded a high 100 seed weight (Figure 2). The two genotypes might have used water applied before and after water stresses more efficiently, resulting in higher irrigation water use efficiency compared to other genotypes. Most of the genotypes recorded lower grain yield under water stress conditions than grown under non-water stress and this might have been due to either a reduction in the number of pods per plant, the number of seeds per pod or seed weight (Figure 2; [23]), depending on the genotype. Most genotypes have the strongest reduction in the number of pods per m2 or number of seeds (Figure 2). This is mainly due to the timing of water stress during flowering (2 weeks starting from bud appearance). This finding agreed with a report by [8] on the intervallic response of cowpea genotypes to erratic rainfall under field conditions. Intermittent water stress reduces plant performance, caused by exposure to water levels below the threshold for optimal physiological activity and morphological development [14].
GH2309 and GH6060 are the only genotypes that demonstrated tolerance to both water and phosphorous stress in grain yield. This is an indication that the crops have a similar genetic response to stress, which needs to be further investigated. The higher grain yield of the genotypes in both growing cycles compared to other genotypes under water stress conditions may be due to their capacity to grow, develop and tolerate water stress. The growth and development of water stress-tolerant plants are mostly associated with the major changes in carbon–nitrogen metabolism [27]. In response to stress, these genotypes might have allocated more nitrogen to the growth of the roots and rhizome development instead of being used for shoot growth [28]. A deeper root system has been reported to make room for exploring subsoil layers with higher water content, resulting in massive uptake of water and other plant nutrients during stress [23].
4.3.2. Grain Yield of Some Cowpea Genotypes under Combined P and Water Stress
Combining phosphorus and water stress, we observed better performance of the genotypes Asontem, GH6060 and Hans adua in both growing cycles. Comparing the grain yields of these genotypes to yields under optimum conditions, we notice that the yield of Hans adua was similar during optimum and stress conditions in both the 2017 and 2018 growing cycles (Figure 3b). Similar results were observed in the seed weight and 100 seed weight of Hans adua compared to the optimum (Figure 3a,b). Genotypes Asontem and GH6060 recorded grain yields which were lower relative to the optimum condition at rates of −58.2 and −37.5% during 2017 and −46.3 and −9.3% during 2018, respectively (Figure 3b). The similar performance of Hans adua, when exposed to optimum and stress conditions, might be due to strong growth during seedling and early vegetative stages, as well as the growth and development of the roots (Figure 4) when the combined stress of P and water occurs under field conditions [29]. This might also indicate that the legume was able to convert inherent soil phosphorus to grain yield regardless of the conditions it was exposed to (Figure 3b). Most genotypes adapt to phosphorus deficiency under water stress by expanding their root system to explore a relatively greater volume of soil [30]. These enhanced traits can be used to improve other cowpea varieties for enhanced phosphorus uptake and water stress tolerance [31]. The performance of genotypes Hans adua and GH6060, which was the best performer for both P stress as well as combined P and water stress, is an indication that these legumes were able to convert inherent soil phosphorus to grain yield regardless of the stress conditions tested (Figure 3b).
5. Conclusions
In conclusion, the genotypes showed a variable response to the different treatments in this study. Genotypes Asontem and GH5344 had the highest grain yield under optimum conditions (non-water and non-phosphorus stress). Hypothesis 1 (genotypes that have the highest grain yield under optimum conditions do not perform best under water or P stress conditions) was not confirmed, as the genotypes GH2309 and GH6060 (ranking 3rd and 4th under optimum conditions) where among the three best cultivars both under water or P stress conditions. Hypothesis 2.1 (genotypes that have the highest grain yield under P stress conditions perform well under water stress conditions) was confirmed for all genotypes studied except for Asontem. Hypothesis 2.2 (genotypes that have the highest grain yield under P stress conditions perform also well under combined water and P stress) was true since the best four genotypes under P stress where the best four genotypes under combined water and P stress (0P + WS). The genotype GH2309 seem to be most robust across very contrasting conditions (always among the best four genotypes). GH6060, Hans adua and Asontem are best adapted to combined water and P stress and need to be further explored to ascertain their potential as drought and phosphorus deficiency-tolerant genotypes.
Author Contributions
G.A. Methodology, Investigation, Data curation, Writing—original draft, Visualization. M.K.A.: Data curation, Writing—reviewing and editing, Visualization. A.K.S.: Writing—reviewing and editing. J.Y.A.: Methodology, Investigation, Supervision. T.G.: Writing—reviewing and editing, Supervision. All authors have read and agreed to the published version of the manuscript.
Funding
We also acknowledge the West African Science Service Centre on Climate Change and Adapted.
Acknowledgments
The authors acknowledge the valuable contributions of Kyere Wilson for his skillful assistance with the field work, and Agyenim Boateng Bright, James Kobiah and Victoria Larweh for help with the measurements.
Conflicts of Interest
The authors declare that they have no known competing financial interests that could have appeared to influence the work reported in this paper.
References
- Alexandre, G.; Piebiep, G.; Ana, B.; Raúl, D.P.; Henrique, T.; Eduardo, A.S.R.; Luis, F.; Miguel, R. Cowpea (Vigna unguiculata L. Walp), a renewed multipurpose crop for a more sustainable agri-food system: Nutritional advantages and constraints. J. Sci. Food Agric. 2016, 96, 2941–2951. [Google Scholar]
- Singh, B.; Ajeigbe, H.; Tarawali, S.; Fernandez-Rivera, S.; Abubakar, M. Improving the production and utilization of cowpea as food and fodder. Field Crop. Res. 2003, 84, 169–177. [Google Scholar] [CrossRef]
- Kolawale, G.O.; Tian, G.; Singh, B.B. Differential response of cowpea varieties to aluminum and phosphorus application. J. Plant Nutr. 2000, 23, 731–740. [Google Scholar] [CrossRef]
- Singh, B.B.; Emechebe, A.M. Increasing productivity of millet-cowpea intercropping systems. In Pearl Millet in Nigeria Agriculture: Production, Utilization and Research Priorities, Proceedings of the Pre-Season Planning Meeting for the Nationally Coordinated Research Programme for Pearl Millet, Maiduguri, Nigeria, 21–24 April 1997; Emechebe, A.M., Ikwelle, M.C., Ajayi, O., Aminu Kano, M., Anaso, A.B., Eds.; Lake Chad Research Institute: Maiduguri, Nigeria, 1998; pp. 75–88. [Google Scholar]
- Dovlo, F.E.; Williams, C.E.; Zoaka, L. Cowpeas: Home preparation and use in West Africa. Int. Dev. Res. Cent. 1976, 22, 96. [Google Scholar]
- Ewansiha, S.U.; Singh, B.B. Relative drought tolerance of important herbaceous legumes and cereals in the moist and semi-arid regions of West Africa. J. Food Agric. Environ. 2006, 4, 188–190. [Google Scholar]
- Mai-Kodomi, Y.; Singh, B.B.; Myers, O.; Yopp, J.H.; Gibson, P.J.; Terao, T. Two mechanisms of drought tolerance in cowpea. Indian J. Genet. 1999, 59, 309–316. [Google Scholar]
- Watanabe, S.; Hakoyama, S.; Terao, T.; Singh, B.B. Evaluation methods for drought tolerance of cowpea. In Advances in Cowpea Research; Singh, B.B., Ed.; IITA: Ibadan, Nigeria, 1997; pp. 87–97. [Google Scholar]
- Chaves, M.; Flexas, J.; Pinheiro, C. Photosynthesis under drought and salt stress: Regulation mechanisms from whole plant to cell. Ann. Bot. 2008, 103, 551–560. [Google Scholar] [CrossRef]
- Markhart, A.H.; Lin, T. New Hand-Operated Press for the Extraction of Tissue Sap for the Measurement of Osmotic Potential 1. Agron. J. 1985, 77, 182–185. [Google Scholar] [CrossRef]
- Lynch, J.P.; Brown, K.M. Topsoil foraging—An architectural adaptation of plants to low phosphorus availability. Plant Soil 2001, 237, 225–237. [Google Scholar] [CrossRef]
- Hall, A.E. Breeding for adaptation to drought and heat in cowpea. Eur. J. Agron. 2004, 21, 447–454. [Google Scholar] [CrossRef]
- Padi, F.K. Relationship between stress tolerance and grain yield stability in cowpea. J. Agric. Sci. 2004, 142, 431–443. [Google Scholar] [CrossRef]
- Dadson, R.B.; Hashem, F.M.; Javaid, I.; Joshi, J.M.; Allen, A.L.; Devine, T.E. Effect of Water Stress on the Yield of Cowpea (Vigna unguiculata L. Walp.) Genotypes in the Delmarva Region of the United States. J. Agron. Crop. Sci. 2005, 191, 210–217. [Google Scholar] [CrossRef]
- Bationo, A.; Mughogho, S.K.; Mokwunye, U. Agronomic evaluation of phosphate fertilizers in tropical Africa. In Management of Nitrogen and Phosphorus Fertilizers in Sub-Saharan Africa; Mokwunye, A.U., Vlek, P.L.G., Eds.; Martinus Nijhoff: Dordrecht, The Netherlands, 1986; pp. 283–318. [Google Scholar]
- Moll, R.H.; Kamprath, E.J.; Jackson, W.A. Analysis and Interpretation of Factors Which Contribute to Efficiency of Nitrogen Utilization. Agron. J. 2010, 74, 562–564. [Google Scholar] [CrossRef]
- Sanginga, N.; Lyasse, O.; Singh, B. Phosphorus use efficiency and nitrogen balance of cowpea breeding lines in a low P soil of the derived savanna zone in West Africa. Plant Soil 2000, 220, 119–128. [Google Scholar] [CrossRef]
- Hayman, D.S.; Mosse, B. Plant growth response to vesicular-arbuscular mycorrhiza I. Growth of endogen inoculated plants in phosphate deficient soils. New Phytol. 1971, 70, 19–27. [Google Scholar] [CrossRef]
- Farooq, M.; Hussain, M.; Wahid, A.; Siddique, K.H.M. Drought stress in plants: An overview. In Plant Responses to Drought Stress; Aroca, R., Ed.; Springer: Berlin/Heidelberg, Germany, 2012; pp. 1–33. [Google Scholar]
- Sharkey, T.D.; Bernacchi, C.J.; Farquhar, G.D.; Singsaas, E.L. Fitting photosynthetic carbon dioxide response curves for C3 leaves. Plant Cell Environ. 2000, 30, 1035–1040. [Google Scholar] [CrossRef]
- Agbicodo, E.M.; Fatokun, C.A.; Muranaka, S.; Visser, R.G.F.; Van Der, C.G.L. Breeding drought tolerant cowpea: Constraints, accomplishments, and future prospects. Euphytica 2009, 167, 353–370. [Google Scholar] [CrossRef]
- Koivisto, J.M.; Devine, T.E.; Lane, G.P.; Sawyer, C.A.; Brown, H.J. Forage soybeans (Glycine max (L.) Merr.) in the United Kingdom: Test of new cultivars. Agronomie 2003, 23, 287–291. [Google Scholar] [CrossRef][Green Version]
- Bourion, V.; Laguerre, G.; Depret, G.; Voisin, A.-S.; Salon, C.; Duc, G. Genetic Variability in Nodulation and Root Growth Affects Nitrogen Fixation and Accumulation in Pea. Ann. Bot. 2007, 100, 589–598. [Google Scholar] [CrossRef]
- Cramer, G.R.; Urano, K.; Velrot, S.; Pezzotti, M.; Shinozaki, K. Effects of abiotic stress on plants: A systems biology perspective. BMC Plant Biol. 2011, 11, 163. [Google Scholar] [CrossRef]
- Ansah, S.G.; Adu-Dapaah, H.; Kumaga, F.; Gracen, V.; Nartey, F. Evaluation of cowpea (Vigna unguiculata L. Walp.) genotypes for phosphorus use efficiency. Acta Hortic. 2016, 373–380. [Google Scholar] [CrossRef]
- Olawuyi, O.J.; Odebode, A.C.; Babalola, E.T.; Afolayan, E.T.; Onu, C.P. Potentials of arbuscular mycorrhiza fungus in tolerating drought of maize. Am. J. Plant Sci. 2014, 5, 779–786. [Google Scholar] [CrossRef]
- Aidoo, M.K.; Quansah, L.; Galkin, E.; Batushansky, A.; Wallach, R.; Moshelion, M.; Bonfil, D.J.; Fait, A. A combination of stomata deregulation and a distinctive modulation of amino acid metabolism are associated with enhanced tolerance of wheat varieties to transient drought. Metabolomics 2017, 13, 138. [Google Scholar] [CrossRef]
- Aidoo, M.K.; Sherman, T.; Lazarovitch, N.; Fait, A.; Rachmilevitch, S. A bell pepper cultivar tolerant to chilling enhanced nitrogen allocation and stress-related metabolite accumulation in the roots in response to low root-zone temperature. Physiol. Plant. 2017, 161, 196–210. [Google Scholar] [CrossRef]
- Muchero, W.; Ehlers, J.D.; Roberts, P.A. Seedling Stage Drought-Induced Phenotypes and Drought-Responsive Genes in Diverse Cowpea Genotypes. Crop. Sci. 2008, 48, 541–552. [Google Scholar] [CrossRef]
- Krasilnikoff, G.; Gahoonia, T.; Nielsen, N.E. Variation in phosphorus uptake efficiency by genotypes of cowpea (Vigna unguiculata L. Walp) due to differences in root and root hair length and induced rhizosphere processes. Plant Soil 2003, 251, 83–91. [Google Scholar] [CrossRef]
- Ishiyaku, M.; Aliyu, H. Field evaluation of cowpea genotypes for drought tolerance and striga resistance in the dry savanna of the North-West Nigeria. Int. J. Plant Breed Genet. 2013, 7, 47–56. [Google Scholar] [CrossRef]


Publisher’s Note: MDPI stays neutral with regard to jurisdictional claims in published maps and institutional affiliations. |
© 2020 by the authors. Licensee MDPI, Basel, Switzerland. This article is an open access article distributed under the terms and conditions of the Creative Commons Attribution (CC BY) license (http://creativecommons.org/licenses/by/4.0/).