Abstract
This paper aims to determine farmers’ willingness to pay for irrigation water, using the residual value method, for the most representative crops at six Irrigation Communities from the Alentejo region, southern Portugal. The main objective of this assessment was to determine the value that farmers would be able to pay for the water to irrigate different crops at different locations, and to show that this approach can be used to provide information about farming economic sustainability and provide support on if crop prices need to be revised or if a national policy should be conceived to cover for farming costs. The results show that vegetables and fruit trees have the highest Residual Value of Water (RVW), while Wheat, Sunflower, Fodder crops, Semi-intensive Olive Orchards and Rice tend to have an RVW lower than the current variable irrigation water price. The results also show that, while, for Melon, Tomato, Onion, Super-high-density Olive Orchards, Peach and Almonds, both yields and price may decrease significantly, allowing one to save for faming inputs, Sunflower and Rice would require an increase in yields or prices to cover for the irrigation water price.
1. Introduction
Irrigation is fundamental for southern European agriculture due to its arid and semi-arid climate. Improving irrigation management is of relevant importance to ensure a sustainable use of resources in water-scarce areas. Among the actors involved in water management, Irrigation Communities (ICs) are key players [1]. The Directive 2000/60/EC ‘Water Framework Directive’ (WFD) declares the norm for managing water resources in Europe. The WFD is essentially an environmental law, which supports the use of economics as a key discipline. Among its instruments, the goal of full cost recovery for water services stands out as one of the key aspects to compensate for environmental and resource costs. According to [2], rational decisions supporting water resource development, allocation, and use require measuring the value of water in alternative uses. Those authors also state that the economic value of water would measure the contribution of that water to accomplishing the user decision’s aim and should be defined as the amount that a rational user of a publicly or privately supplied water resource is willing to pay for it. Based on the fact that this value should, on the one hand, cover for environmental and resource costs, and, on the other hand, establish a value that measures the benefit of using this resource (allowing one to control superfluous consumptions), ICs charge farmers with a water price that aims to cover for all these costs/benefits.
Ward and Michelsen [2] also state that the economic benefit of additional water used in irrigation may be measured as the change in value of agricultural products less changes in associated production costs. Based on this assumption, the valuation of irrigation water, for supporting sustainable water management, has been assessed by different authors using different approaches. Young and Loomis [3] provided a list of different types of economic water valuation methods, their characteristics and uses. From those methods, the contingent valuation method (CVM), the linear programming (LP) and the residual value method (RVM) stand out as being mostly used to determine the farmers’ willingness to pay for irrigation water.
The CVM is a flexible, non-market valuation method and has been widely used by many authors to estimate irrigation water prices [4,5,6,7,8,9]. However, and since the direct approach used in CVM has been to directly ask survey respondents to state the maximum price that they are willing to pay for water for a particular use or non-use value of the water. Thus, and since it is based on survey results, a CVM study should be properly and extremely carefully conducted, or the assessment may lead to misleading conclusions [10].
LP has also been used for the last four decades to determine the value of water. Previous studies [11,12,13,14,15,16,17] attempted to valuate this resource based on mathematical models. However, LP is normally based on the single criterion of maximizing the economic return, lacking to be capable to maximize the valuation based on farmer’s preferences and choices.
Contrarily, the RVM is a deductive approach, as an estimation of rents to water is derived from models of farm firm behavior, which forecasts revenue and then subtracts expected costs of purchased inputs and the estimated opportunity costs of owned inputs other than water [3]. However, few studies have been conducted based on this method. Berbel et al. [18] use the RVM to economically analyze irrigation water at the basin level for the Guadalquivir River, southern Spain. Kiprop et al. [19] determined the disaggregated economic value of irrigation water used across crops at the basin level in Kenya. In a similar study, Muchara et al. [20] aimed to estimate water values among smallholder farmers, focusing on the potato crop, in South Africa. However, Kiprop et al. [19] and Muchara et al. [20] estimated the consumptive water amounts using simulation models. Qureshi et al. [21] applied the RVM as a complement to other methods for determining the value of the water used over a wide range of irrigated crops in different seasons and regions in Australia; however, not as a standalone approach.
This study aims to determine the farmers’ willingness to pay for water based on the Residual Value Method. The area selected as a case study is the Alentejo region, southern Portugal. Due to its climate, farmers resort to irrigation; many studies tried to understand the impacts of irrigation on the cropping systems, but no relative study has taken place to determine farmers’ willingness to pay for such a fundamental resource.
2. Materials and Methods
2.1. Case study Description
This study was conducted in the Alentejo region, southern Portugal. The region has a surface area of 31,604 km², representing 33% of inland Portugal, and a population of more than 780,000 inhabitants (less than 8% of the total Portuguese population). The region is responsible for 46% of the total national agricultural production. The region, according to the Köppen–Geiger classification, has a Csa climate and is characterized by a semi-arid Mediterranean climate of hot and dry season in the summer and mild temperature associated to annual rainfall in winter. Due to these characteristics, farmers resort to irrigation in order to achieve farming sustainability and profitability. Water demand for agriculture is around 79%, totaling an average of 491 hm3 per year.
The Irrigation Communities (ICs) selected for this case study are among the most economically important ones in the Alentejo region—Campilhas e Alto Sado, Lucefecit, Odivelas, Roxo, Vale do Sado and Vigia. The total irrigated area and the area cropped by the main crops of each IC are presented in Table 1. Figure 1 shows the location of the six ICs. Campilhas e Alto Sado and Odivelas differ from the other ICs since they manage more than one Irrigation District (ID). Each ID consists of an individual irrigation network, managed independently of the others.

Table 1.
Main crop areas of each Irrigation Community (IC).
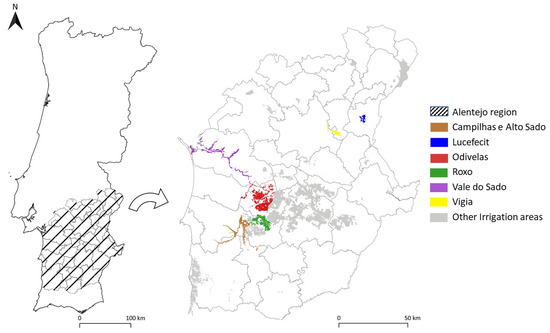
Figure 1.
Study area.
Figure 2 shows the proportion of the cropped area per crop over the total cropped area and the water usage per crop over the total water consumption across all ICs. From all crops, the ones that stand out the most are Almond Orchards and Vegetables that use 3% of the area and 3% of the water usage, being the most balanced crops, Olive Orchards and Vineyards that occupy 41% of the area and use 27% of total water consumption, and rice that consumes 43% of the water usage while cropping 25% of the total. These data show that the cropped area/water usage relation is quite heterogeneous across the ICs.
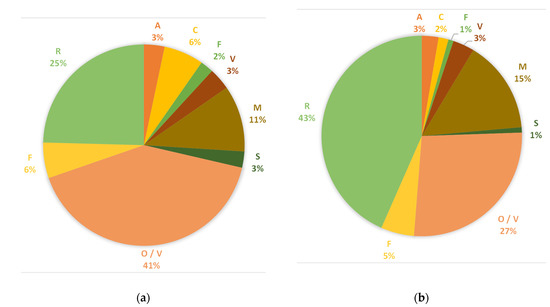
Figure 2.
Proportion of the (a) cropped area per crop over the total cropped area and (b) the water usage per crop over the total water consumption across all ICs. A—Almond Orchards; C—Cereals (except maize); Fr—Fruit Orchards; V—Vegetables; M—Maize; S—sunflower; O/V—Olive Orchards and Vineyards; F—Fodder crops; R—Rice
Crop areas and water allocation within each IC is done according to farmers’ demand and registration of land use in the beginning of each irrigation season.
In terms of water prices, all IC charges farmers with two different components: a fixed and a variable amount. A fixed water price (EUR/ha) is charged to farmers according to the ID and water pressure regime and/or irrigated crop. The variable water price (EUR/m3) component aims to cover the energy and environmental cost of each cubic meter used for irrigation. For Vale do Sado IC, in the fields where rice is grown, the soils have limitations for the production of other crops due to saline intrusion. In order to avoid abandoning those agricultural fields, the IC chooses to apply a lower variable water price to try to make rice production economically viable. For farmers outside the ID, i.e., farms to which water is allocated despite of being outside the network infrastructure, only a variable water price is charged, higher than the one for farmers inside the ID in order to cover for real costs but also to reflect an opportunity cost for water availability. The values for both the fixed and variable water prices for each IC and ID, reported to 2019, are presented in Table 2.
Table 2.
Fixed and variable water price for each IC.
2.2. The Residual Value Method
The residual value method (RVM) was used in this study to evaluate the willingness to pay for irrigation water by farmers across the six ICs. The RVM assumes that: (a) producers maximize their yields/profits; and (b) the total value of the product is assigned to each input according to its marginal productivity. If appropriate prices can be assigned to all inputs but one, the remainder of the total value of product is attributed to the remaining or residual input, which in this specific case is water [22].
Young and Loomis [3] established that a single production process (Y) where it is desired to impute a value for the unpriced input, water (W), might be defined as a function:
where M is the purchased materials and equipment, H is the human input such as labour (from hired workers, supervisors, and managers), K is the equity capital, L is other natural resources, such as land, and W is water.
Y = f(XM, XH, XK, XL, XW)
If all the inputs are paid according to their value marginal product (VMP), the total value of product (TVP) may be expressed by:
where Y × PY represents total value of product Y; VMPi represents the VMP of resource i; and Xi is the quantity of the ith resource. Equation (2) follows the fundamental product exhaustion theorem with the amount of inputs weighted by their VMP sum to TVP. Assuming that agricultural input markets are competitive, the prices for these inputs may be treated as known constants, and, for each input i, the producer chooses the level of input such that VMPi = Pi, Equation (2), may be rearranged as:
TVP = (Y × PY) = (VMPM × XM) + (VMPH × XH) + (VMPK × XK) + (VMPL × XL) + (VMPW × XW)
(PW × XW) = (Y × PY) − [(PM × XM) + (PH × XH) +(PK × XK) + (PL × XL)]
If all prices and quantities are on the right side of the equation, the contribution of (PW × XW) on TVP may be derived.
As the quantity of water consumed, XW, per crop may be known for each location and the crop may be known, the expression can be solved to find PW. If PW is not yet assigned, the residual value of water, denoted RVW (EUR/m3), is used as a substitute for the water price, resulting:
Therefore, RVW should be considered the maximum value to be paid for water, in the break-even point.
Based on the fact that the TVP and the VMPs, except for water, are known, the model application is straightforward. The RVW will be used not only to assess the willingness of farmers to pay for water but also to compare this value with the actual variable water price in order to better understand if the current Y or PY are enough to cover for all production costs (including water).
2.3. Economic Characterization of Each Crop in the ICs
For the application of the residual water value method, data were made available by IC managers for all case studies under assessment, which results from a consultation with farmers in each community. Standard crop budgets have been created for each crop, which result from these surveys. For each crop, the average input costs (labour, purchased materials, equipment, crop installation, energy for irrigation, land cost (EUR/ha), and other general expenses) and yield returns (yield and prices) were defined, assuming that each farm adopted standard production techniques. Both input costs and crop prices are mean values for the entire region and for the last decade [23]. In addition, for each crop, a mean amount of water applied was considered, based on the average amounts accounted at each IC. Table 3 presents the data used for the application of the RVM, including farming costs and yields, and water applied for each crop.
Table 3.
Production cost for each crop in the Alentejo region (not including water costs).
3. Results
3.1. Results of Residual Value of Water in the Alentejo Region
Using Equation (4), the RVW was computed for each crop/IC combination, obtaining a range of results that is shown in Table 4. For each ID, the production cost for each crop (Table 3) and the fixed water price for each IC/ID (Table 2) were adopted. Table 4 also presents the differences of residual value versus the variable water prices (WPs) applied at each IC/ID. The red cells show the crop/ID combination where the RVW is lower than the WP; the green cells highlight the cases where the RVW is high enough to cover for the WP.
Table 4.
Residual value of water (RVW) for all crops and Irrigation Districts (ID)s.
Table 4 shows that Melon, Tomato, Onion, Super-high-density Olive Orchards, Peach and Almonds present RVW values higher than the actual water price for all ICs. From those crops, Melon and Almond are the ones that present the higher values; this can be explained due to the high yields and crop price for the former, and due to the exceptional high crop price for the latter. The results show that most vegetables and fruits have great potential to be cropped in the Alentejo region.
Contrarily, Wheat, Sunflower, Fodder crops, Semi-intensive Olive Orchards and Rice led to an RVW lower than the actual WP. For Wheat and Sunflower, the RVW is negative for all ID, meaning that cropping those crops, for the current crop prices, leads to negative farming income. As for Maize, one of the most representative crops in the region, for farmers outside the irrigation district (FO) at Odivelas (O, O4 and OLP), Roxo, and Vale do Sado and Vigia, the RVW is lower than the WP. This can be explained due to the fact that the WP for FO tries to cover for the additional water allocation expenses for areas outside the network infrastructure. The results also show that Vineyards are not suitable for low-pressurized IC/IDs for the actual crop yields and prices.
Due to current crop prices, the production costs (including the charged fixed water price) for some crops tend to be higher than the total revenue; one should argue: what should be the crop yields and prices thresholds for each crop/IC combination that lead to RVW = WP? The answer to this question will allow to better understanding how yields and prices should be managed and trying to determine how fewer valuable crops may be valued.
3.2. Crop Yields and Prices Thresholds
Based on the assumption that some crops in some ICs may not be suitable since the RVW is lower than the WP, there the need to define crop yields and prices thresholds that would compensate for the actual water price, where RVW = WP. These thresholds were determined by: (a) how much can the crop yields may increase or decrease if the current crop price does not change; (b) how much can the crop prices may increase or decrease if the current crop yields remain the same.
Table 5 and Table 6 present, respectively, the crop yields and prices that lead to a residual water value equal to the actual water price. A color scale is used to ease the reading of the results: the greener the cell, the lower the yield/price can be; the redder, the higher the yield/price will have to be.
Table 5.
Threshold crop yields, for each crop and IDs, to RVW = WP.
Table 6.
Threshold crop prices, for each crop and IC, to RVW = WP.
Results show for the most suitable crops to be adopted (Melon, Tomato, Onion, Super-high-density Olive Orchards, Peach and Almonds) both yields and price may decrease significantly. For the vegetable crops, this decrease averages 40.4%, 18.1% and 36.3%, for Melon, Tomato and Onion, respectively; the decrease can be as high as 41.1% for Melon cropped by farmers outside Lucefecit ID and by farmers inside Vigia ID. For Super-high-density Olive Orchards, Peach and Almonds the decrease is also considerable. While for Super-high-density Olive Orchards, Peach the yield/price decrease averages 8.4% and 13.9%, respectively, for Almonds the decrease can be higher that 45.4%. it can be concluded that all of these crops are suitable to be cropped in all ICs since they show resistance, both to lower prices and to significant yield losses.
For farmers outside the irrigation district at Odivelas (O, O4 and OLP), Roxo, Vale do Sado and Vigia that crop Maize, yields/prices would require an average increase of 2.2%. Vineyards, for the low-pressurized IC/IDs, would need an average yield/price increase of 1.2%.
On the contrary, Wheat, Sunflower, Fodder crops, Semi-intensive Olive Orchards and Rice, in order to be suitable, would need to improve their yields or their prices. While Semi-intensive Olive Orchards are more prone to become economically suitable, since an average increase of 3.4% in yields/prices would be required to reach the threshold, the remaining crops behave differently. Fodder crops would require an average increase of 17.3%, and Wheat an increase averaging 20.5%. Sunflower would require an even higher increase (averaging 33.1%), while Rice yields or prices would need to be 41.4% higher than the current values. However, these required levels of productivity are not easily achievable. The current farming practices aim to improve yields while optimizing the use of farming inputs. To reach these levels of productivity would require some farming practices to become, eventually, unsustainable. A different approach could go through the assurance of higher crop prices; however, since most of these crops are traded as commodities, a national policy would be required to help farmers improving their farming economic returns.
The residual value is the remaining value after all farming inputs are paid, representing a long-term mean value that farmers are willing to pay for an unpriced input. In the short-term, farmers may opt to not fully pay for some factors, such as their own labor or the owned capital in order to maintain a positive gross margin. However, in the long-term, all production costs need be paid for and, if the residual value of water is negative, there are three alternatives:
- (1)
- Farmers opt for non-irrigated crops, leading to less irrigated area and, consequently, higher water prices to cover for the resource allocation;
- (2)
- Farmers choose to crop higher value crops (such as Melon, Tomato, Onion, Super-high-density Olive Orchards, Peach and Almonds) in order to improve their farming economic returns;
- (3)
- A national policy would be required to cover for the farming inputs.
As shown in Table 4, the highest residual value of water is for Almond and for Melon. Both these crops are highly remunerated due to market demand. However, since those crops are highly dependent on the global production, future RVW may differ from the current study. Contrarily, both Sunflower and Rice, due to current prices, are not advisable unless a national policy is created.
The creation and implementation of a national policy to support certain crops can also be seen as defensible, or desirable, according to two objectives: that of maintaining the most diversified systems and, therefore, those that are more resilient and sustainable; that of limiting the excessive expansion of permanent crops, whose demand for water is practically fixed, enabling annual crops, whose demand for water is variable. In fact, in the context of climate change in which we already live, the annual crops can function as a kind of fuse, which allows one to balance availability with the demand for the water resource.
4. Conclusions
This study aimed to apply the Residual Value Method (RVM) approach for irrigation water to be applied at different crops in six Irrigation Communities (ICs) in the Alentejo region, southern Portugal, to evaluate the willingness to pay for irrigation water by farmers across the ICs. The main objective of this assessment was to answer a question: what is the value that farmers would be able to pay for the water to irrigate different crops at different locations? The aim of this study was to show that this approach can be used to provide information about farming economic sustainability and to provide support on if crop prices need to be revised or if a national policy should be conceived to cover for farming costs.
The results show that vegetables and fruit trees have the highest Residual Value of Water (RVW), while Wheat, Sunflower, Fodder crops, Semi-intensive Olive Orchards and Rice tend to have an RVW lower than the current variable irrigation water price. The results also show that, while, for Melon, Tomato, Onion, Super-high-density Olive Orchards, Peach and Almonds, both yields and price may decrease significantly, allowing one to save for farming inputs, Sunflower and Rice would require an increase in yields or prices to cover for the irrigation water price.
The results of this research may serve as a tool for IC managers and decision-makers on how irrigation water should be priced in order for some crops to be suitable. Also, it provides standard values for the most representative crops in the region, thereby offering support for new farmers on which crop should be cropped on those ICs.
Author Contributions
Conceptualization, G.C.R., F.G.d.S. and J.C.C.; methodology, G.C.R.; Data analysis, G.C.R.; writing–original draft preparation, G.C.R.; writing–review and editing, G.C.R., F.G.d.S. and J.C.C. All authors have read and agreed to the published version of the manuscript.
Funding
This research received no external funding.
Institutional Review Board Statement
Not applicable.
Informed Consent Statement
Not applicable.
Data Availability Statement
Field data was obtained from the Irrigation Communities under study and may be made with their permission.
Acknowledgments
Authors thank the Irrigation Communities of Campilhas e Alto Sado, Lucefecit, Odivelas, Roxo, Vale do Sado and Vigia for the data provided for this study.
Conflicts of Interest
The authors declare no conflict of interest.
References
- Alcon, F.; García-Bastida, P.A.; Soto-García, M.; Martínez-Alvarez, V.; Martin-Gorriz, B.; Baille, A. Explaining the performance of irrigation communities in a water-scarce region. Irrig. Sci. 2017, 35, 193–203. [Google Scholar] [CrossRef]
- Ward, F.A.; Michelsen, A. The economic value of water in agriculture: Concepts and policy applications. Water Policy 2002, 4, 423–446. [Google Scholar] [CrossRef]
- Young, R.A.; Loomis, J.B. Determining the Economic Value of Water: Concepts and Methods; Routledge: Oxfordshire, UK, 2014. [Google Scholar]
- Lazaridou, D.; Michailidis, A.; Mattas, K. Evaluating the willingness to pay for using recycled water for irrigation. Sustainability 2019, 11, 5220. [Google Scholar] [CrossRef]
- Aydogdu, M.H. Evaluation of willingness to pay for irrigation water: Harran plain sampling in GAP region-Turkey. Appl. Ecol. Environ. Res. 2016, 14, 349–365. [Google Scholar] [CrossRef]
- Knapp, T.; Kovacs, K.; Huang, Q.; Henry, C.; Nayga, R.; Popp, J.; Dixon, B. Willingness to pay for irrigation water when groundwater is scarce. Agric. Water Manag. 2018, 195, 133–141. [Google Scholar] [CrossRef]
- Chandrasekaran, K.; Devarajulu, S.; Kuppannan, P. Farmers’ willingness to pay for irrigation water: A case of tank irrigation systems in South India. Water 2009, 1, 5–18. [Google Scholar] [CrossRef]
- Tang, Z.; Nan, Z.; Liu, J. The willingness to pay for irrigation water: A case study in Northwest China. Glob. Nest J. 2013, 15, 76–84. [Google Scholar]
- Bakopoulou, S.; Polyzos, S.; Kungolos, A. Investigation of farmers’ willingness to pay for using recycled water for irrigation in Thessaly region, Greece. Desalination 2010, 250, 329–334. [Google Scholar] [CrossRef]
- Venkatachalam, L. The contingent valuation method: A review. Environ. Impact Assess. Rev. 2004, 24, 89–124. [Google Scholar] [CrossRef]
- Andrews, R.A.; Weyrick, R.R. Linear programming use for evaluating water resources and cost and benefit allocation. J. Am. Water Resour. Assoc. 1973, 9, 258–272. [Google Scholar] [CrossRef]
- Chaudhry, M.A.; Young, R.A. Valuing irrigation water in punjab province, pakistan: A linear programming approach. J. Am. Water Resour. Assoc. 1989, 25, 1055–1061. [Google Scholar] [CrossRef]
- Kulshreshtha, S.N.; Tewari, D.D. Value of water in irrigated crop production using derived demand functions: A case study of south Saskatchewan river irrigation district. J. Am. Water Resour. Assoc. 1991, 27, 227–236. [Google Scholar] [CrossRef]
- Berbel, J.; Gómez-Limón, J.A. The impact of water-pricing policy in Spain: An analysis of three irrigated areas. Agric. Water Manag. 2000, 43, 219–238. [Google Scholar] [CrossRef]
- Medellín-Azuara, J.; Harou, J.J.; Howitt, R.E. Estimating economic value of agricultural water under changing conditions and the effects of spatial aggregation. Sci. Total Environ. 2010, 408, 5639–5648. [Google Scholar] [CrossRef] [PubMed]
- Mesa-Jurado, M.A.; Martin-Ortega, J.; Ruto, E.; Berbel, J. The economic value of guaranteed water supply for irrigation under scarcity conditions. Agric. Water Manag. 2012, 113, 10–18. [Google Scholar] [CrossRef]
- Booker, J.F.; Howitt, R.E.; Michelsen, A.M.; Young, R.A. Economics and the modeling of water resources and policies. Nat. Resour. Model. 2012, 25, 168–218. [Google Scholar] [CrossRef]
- Berbel, J.; Mesa-Jurado, M.A.; Pistón, J.M. Value of irrigation water in Guadalquivir Basin (Spain) by residual value method. Water Resour. Manag. 2011, 25, 1565–1579. [Google Scholar] [CrossRef]
- Kiprop, J.K.; Lagat, J.K.; Mshenga, P.; Macharia, A.M. Determining the economic value of irrigation water in Kerio Valley Basin (Kenya) by residual value method. J. Econ. Sustain. Dev. 2015, 6, 102–108. [Google Scholar]
- Muchara, B.; Ortmann, G.; Mudhara, M.; Wale, E. Irrigation water value for potato farmers in the Mooi River Irrigation Scheme of KwaZulu-Natal, South Africa: A residual value approach. Agric. Water Manag. 2016, 164, 243–252. [Google Scholar] [CrossRef]
- Qureshi, M.E.; Ahmad, M.D.; Whitten, S.M.; Reeson, A.; Kirby, M. Impact of climate variability including drought on the residual value of irrigation water across the Murray–Darling Basin, Australia. Water Econ. Policy 2018, 4, 1550020. [Google Scholar] [CrossRef]
- Young, R.A. Determining the Economic Value of Water: Concepts and Methods; Resources for the Future: Washington, DC, USA, 2005. [Google Scholar]
- Irrigation Communities Managers. Personal Communication, 2019.
Publisher’s Note: MDPI stays neutral with regard to jurisdictional claims in published maps and institutional affiliations. |
© 2021 by the authors. Licensee MDPI, Basel, Switzerland. This article is an open access article distributed under the terms and conditions of the Creative Commons Attribution (CC BY) license (http://creativecommons.org/licenses/by/4.0/).