Abstract
The Cynodon spp. collection maintained by United States Department of Agriculture National Plant Germplasm System (USDA-NPGS) has limited information on nutritive value (NV) traits. In this study, crude protein (CP), phosphorous concentration (P), in vitro digestible organic matter (IVDOM), and neutral detergent fiber (NDF) were determined to (i) estimate genetic parameters for NV, (ii) obtain genetic values for the whole population across two harvests, (iii) estimate genotype by harvest interaction (GHI) for NV traits, and (iv) select accessions exhibiting improved NV traits compared to ‘Tifton 85′. The experiment was setup as a row-column design with two replicates and augmented representation of controls: Tifton 85, ‘Jiggs’, and ‘Coastal’. The whole-population was harvested twice, and data were analyzed using linear mixed models with repeated measures. In addition, a selected population of 15 genotypes were evaluated across 11 harvests to determine the extent of GHI. Genetic parameters revealed the presence of significant genetic variability, indicating potential improvements for NV through breeding. Specifically, P and IVDOM presented large variation, while NDF had lower diversity but some accessions exhibited lower NDF than Tifton 85. Low GHI, except for IVDOM, indicated genotypic stability and potential for selecting improved accessions under fewer harvests. Breeding line 240, PI-316510, and PI-3166536 presented superior NV than Tifton 85.
1. Introduction
The investigation of natural genetic diversity present in germplasm banks is a key step to improve traits with narrow genetic variability. The use of germplasm banks is even more important for perennial forages, as several important releases worldwide originated from selections of plant introductions made in large collections [1]. Bermudagrass (Cynodon spp.) is the most widely used warm-season perennial forage for hay and pasture in the southeastern United States, covering more than 12 million hectares [2]. Its popularity among livestock and hay producers lays on high biomass production, nutritive value, animal performance, fast-curing for hay production, and drought tolerance [3,4,5,6,7]. The genus Cynodon is composed of genetically diverse species of variable ploidy level [8,9]. The most agronomically valuable species are Cynodon dactylon Pers. and Cynodon nlemfuensis Vanderyst. Both of these are cross-compatible, and several improved interspecific hybrids have been developed, selected, and released commercially: Coastcross I, Tifton 85, Florakirk [10,11,12,13,14].
The collection of United States Department of Agriculture National Plant Germplasm Systems (USDA-NPGS) for Cynodon is maintained by the Agricultural Research Service Coastal Plain Experimental Station in Tifton, GA, USA. A core collection of 160 accessions was developed based on 22 phenotypic traits collected among 600 accessions [15], and its genetic diversity was assessed through amplified fragment length polymorphism markers [16]. Besides, the core collection was studied to estimate biochemical conversion to ethanol [17]. Recently, part of the bermudagrass core collection [15] was included in an experiment studying nitrogen use efficiency (NUE) in bermudagrass [18]. Authors found that several traits related to NUE had large genetic variability. Nevertheless, the genetic diversity for other nutritive value (NV) traits, as well as the determination of genetic parameters, remain unknown for bermudagrass [15,16,17,18].
Nutritive value traits, especially digestibility and crude protein (CP), are main targets in forage breeding [11]. Improving NV can increase animal performance, reduce need for supplemental feed and thus cost of production, and can help mitigate some of the current environmental challenges, such as greenhouse gas emissions and eutrophication of surface waters [19,20,21]. Greater digestibility, for example, can lead to increase in dry matter intake and animal performance, therefore reducing methane emission per kg of animal output [22,23]. Because of high nutrient absorption capacity, bermudagrass pastures are widely used for nitrogen and phosphorus loss mitigation in waste management lands, e.g., for application of liquid and solid cattle manure, broiler litter, and other industrial water [24,25,26,27].
Phenotypic improvement requires genetic variability and stability of traits. Estimated genetic variance for dry matter digestibility in bermudagrass has been reported high (coefficient of genetic variation: 4.1–8.5%; broad sense heritability: 0.27 to 0.78), showing the potential for selection and improvement [10]. Although gains are slow, the final impact of improving NV traits can be significant. “Grazer” bermudagrass showed between 3.7 and 4.8% improvement in digestibility, which represented between 6 to 11% increase in live weight gain [28]. Increasing NV without reducing forage yield is a constant challenge for forage breeders, especially when targeting improvement for multiple traits. In 60 bermudagrass accessions from different geographic regions in China, [29] reported a phenotypic correlation of −0.37 between CP and forage yield. Tifton 85, for example, has higher digestibility and higher dry matter yield compared to Coastal, Tifton 44, ‘Tifton 78′, ‘Jiggs’, and ‘Vaquero’ [4,5,30,31,32,33]. However, it has lower CP compared to Jiggs [33] and greater neutral detergent fiber (NDF) concentration, which can result in low voluntary dry matter intake [34,35]. In complement, the target to increase CP, results in a decrease in NDF, whereas CP and dry matter digestibility shows a positive correlation [23].
The USDA-NPGS Cynodon germplasm collection has phenotypic data that have never been used for estimating variance components and genetic parameters. The estimation of genetic parameters, such as broad sense heritability (H2), genotype by harvest interaction (GHI), and type-A genetic correlations, are fundamental to define breeding strategies [36]. The potential genetic diversity present in bermudagrass germplasm for traits with moderate-high H2 and low GHI might expand the use of this germplasm by forage breeders. Hence, the objectives of this study were: (i) estimate genetic parameters for NV in the USDA-NPGS Cynodon collection, (ii) predict genetic values for four NV traits for the whole population across two harvests, (iii) estimate GHI for four NV traits across 11 harvests in a selected population, and (iv) select accessions exhibiting improved NV traits compared to Tifton 85.
2. Materials and Methods
2.1. Germplasm
A set of 286 bermudagrass accessions were screened, including 146 Cynodon clonal accessions from the USDA-NPGS forage core collection maintained in Tifton, GA; and 137 from the USDA-NPGS Cynodon collection maintained in Griffin, GA, and 3 commercial cultivars: Tifton 85, Coastal, and Jiggs. Planting material obtained from Griffin and Tifton were grown in a greenhouse in Gainesville, FL, USA, and the plugs were allowed to established in 5 × 5 cm containers prior to planting.
2.2. Location Description
The experiment was conducted at the Plant Science Research and Education Unit located in Citra, Florida (29°24′16″ N and 82°10′17″ W), at 60 m elevation, from 2015 to 2016. Historical weather data was extracted online from the Florida Automated Weather Network (https://fawn.ifas.ufl.edu) and is summarized in Figure 1.
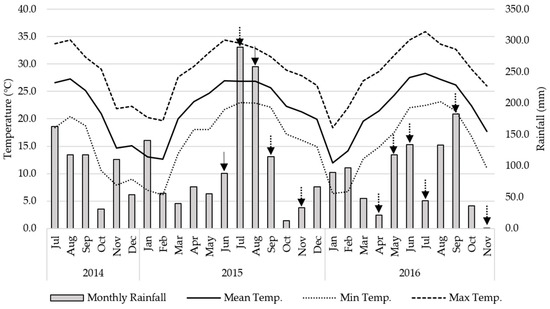
Figure 1.
Maximum (Max Temp.), Minimum (Min Temp.), and Mean (Mean Temp.) monthly temperature (°C) and rainfall (mm) during the experimental period (April 2015 to November 2016). The arrows show the nutritive values sampling dates. The integer line refers to the whole population assessment, whereas the dashed line shows sampling date for the selected population.
The soil was a Chipley sand (thermic, coated Aquic Quartzipsamments) with a pH of 6.9 and characterized by high P2O5 content (164 kg ha−1), and low K2O (38.2 kg ha−1), S (5.6 kg ha−1), and Mg (44.8 kg ha−1) content. The experimental plot size was 1.8 m × 3.0 m. Planting was done on 2 July 2014 using a single plug 5 × 5 cm planted in the center of the plot, and it was allowed to grow up to cover the plot. The long period between planting and the beginning of evaluations was necessary to guarantee a suitable plot establishment. The plants were fertilized with 40 g plant−1 with a mix of nitrogen (N), phosphorous (P2O5) and potassium (K2O) 15-0-15 and micronutrients. An additional 75 kg ha−1 of nitrogen (N) and 45 kg ha−1 of K2O were applied two months after planting. In early spring 2015, 90 kg ha−1 of N and K2O were applied to promote spring regrowth. The field was re-fertilized with 90 kg ha−1 of N and 45 kg ha−1 of K2O after each harvest, except for the last harvests of the growing seasons.
2.3. Experimental Design and Data Collection
The trial was established as a row-column design with two replicates and augmented representation of three controls, and the cultivars Tifton 85 and Jiggs were replicated thirteen times, and Coastal twelve times, in total. The plots were mowed to a stubble height of 10 cm in the beginning of each year (24 March 2015, and 3 March 2016). Plots were harvested every five weeks from April to November in both years. Biomass was collected to a 5-cm stubble height from a 1.2 × 3.0 m area in each plot. The remaining areas non-harvested were mowed to the same stubble after data collection. The fresh samples were weighed, and sub-samples (approximately 450 g) were taken, dried in a forced-air oven at 55 °C for 72 h, and reweighed to estimate forage harvested (FH). The samples were cleaned using sieves to avoid sand contamination and ground to 1 mm using a Wiley Mill (Model 4, Thomas Scientific, Swedesboro, NJ, USA) for NV analysis.
The analyses were performed using two subsets: (i) Whole-population: all accessions were harvested twice, first on June 1st and then in 11 August 2015; and (ii) Selected-population: a selected group of 15 accessions was sampled nine extra times between 1 June 2015 to 1 November 2016. The selected group resulted from a multi-location evaluation for biomass yield and other agronomic traits. The FH predictor values only were used to elucidate genetic correlations with NV traits. The NV traits included concentration of crude protein (CP), phosphorous (P), in vitro digestible organic matter (IVDOM) and neutral detergent fiber (NDF). These traits were determined by wet chemistry at the Forage Evaluation Support Laboratory, University of Florida (FESL). Crude protein was calculated as nitrogen multiplied by 6.25. Nitrogen and P samples were digested using a modification of the aluminum block digestion procedure [37]. Sample weight was 0.25 g, catalyst used was 1.5 g of 9:1 K2SO4:CuSO4, and digestion was conducted for at least 4 h at 375 °C using 6 mL of H2SO4 and 2 mL H2O2. Nitrogen in the digestate was determined by semiautomated colorimetry [38]. In vitro digestible organic matter was performed by a modification of the two-stage technique [39]. Neutral detergent fiber was determined using the filter bag technique according to ANKOM200 (ANKOM Technology, Macedon, NY, USA) procedure [40].
2.4. Statistical Analyses
A dataset for the whole-population recorded traits of the two harvests were analyzed using linear mixed models with repeated measures implemented in ASReml-R (VSNI, Hemel Hempstead, Hertfordshire, UK) [41] using the R software [42]. The following model was fitted for single-trait and multi-harvest data:
where is the overall population mean; 1 is a vector of ones; , , , , , and are design matrices; is the fixed harvest effect; is the fixed effect of blocks; is the random effects of entries, with ~ multivariate normal distribution (MVN) (0,); is the random interaction effect between entry and harvest, with ~ MVN (0,); and are the random effects of row and column nested into block, with ~ MVN (0,) and ~ MVN (0,); and is the random errors, with ~ MVN (0,).
For each trait, the genotypic values for the entries were predicted and the variance components estimated: genotypic variance (); variance of the genotype-harvest interaction (). The statistical significance of variance components were tested using the likelihood ratio test (LRT) with a Chi-square test with 1 degree of freedom [43]. Then, variance components estimates were used to calculate broad sense heritability () for each trait as
and genotype by harvest correlation () was calculated for each trait as
where is the estimated genotypic variance, is the total phenotypic variance, and is the variance for the genotype-harvest interaction. The random error variance for the multiharvest model was an average for both harvests (i.e., = ( + )/2).
The genetic coefficient of variation (CVg) was assessed for each trait using the following equation:
where is the estimated genotypic variance, and is the mean value of the trait [10].
Accuracy refers to the correlation between the parametric genetic value and predicted genetic value, and it considers the residual variation, the settled experimental design and the proportion between the genetic and residual variations associated with the trait under evaluation [44]. Accuracy (Acc) was estimated as an average based on the standard error of predicted genotypic value (PVse) of each genotype [44]. PVse is related to accuracy through the equation:
where is the genotypic variance. Reliability (Rel) was obtained as average of genotypes Acc elevated to square. Overall mean, maximum, and minimum of predicted genotypic value were also computed. Additionally, predicted genetic values obtained with single-trait models were used to rank populations for each trait, which are given in Supplementary Table S1. A Principal Component Analyses (PCA) was performed with the prcomp function in R using a correlation matrix of the genotypic values obtained with the multiharvest model and predicted values of FH. These values were also used to obtain genetic correlations by Pearson method using cor function in R.
For the subset of selected population composed by 15 genotypes evaluated across 11 harvests, a linear model was fit for analysis of variance (ANOVA) using the package agricolae [45], with genotype, harvest, genotype-harvest interaction, and replicate factors considered fixed effects. A Tukey-Honest Significant Test was used to separate treatment means at p = 0.05 using the package agricolae [45], and graphs were created with the package ggplot2 [46] in R. The coefficient of variation was calculated as standard deviation divided by mean multiplied by 100 and expressed as percentage. Additionally, a performance index was calculated by counting the number of times each genotype placed in the top of the ranking for each trait, and their mean response was statistically superior compared to any other genotype.
3. Results
3.1. Whole-Population
The whole Cynodon population showed significant genetic variability for all NV traits. Genetic variances for each trait were higher than zero (p < 0.001) based on LRT (Table 1), while GHI was only significant for IVDOM (p < 0.001). Genotype by harvest correlations were high for all traits (Table 1), and the H2 ranged from low (CP and IVDOM) to moderate (P and NDF). The genetic coefficient of variation was low and exhibited a range from 2.6 to 9.6% (Table 1). Accuracy were moderate for CP, and high for other traits, whereas reliability was low for CP and moderate for the other traits.

Table 1.
Genetic parameters for the United States Department of Agriculture National Plant Germplasm System (USDA-NPGS) bermudagrass germplasm collection evaluated in Citra, FL. Genetic coefficient of variation (CVg), broad sense heritability (H2 ± SE), and genotype by harvest correlation () for crude protein (CP), phosphorous (P), In Vitro Organic Matter Digestibility (IVDOM), and Nutrient Detergent Fiber (NDF) expressed at grams per kilogram. Likelihood Ratio Test of Genotype and Genotype by Harvest, Reliability Mean, and Accuracy Mean for nutritive value (NV) traits.
Some traits exhibited large genotypic variability (Figure 2). For instance, CP ranged from 116 g kg−1 to 157 g kg−1 (Figure 2A), where PI 2922601, PI 292508, PI 547109, and breeding line 319 exhibited CP higher than 150 g kg-1. The highest predicted value for p was almost double its lowest concentration. However, only four accessions, including PI 316507, Breeding line 240, ‘Florakirk’, and PI 364485 showed p higher than 3.5 g kg−1, while Tifton 85 and Jiggs presented 2.9 and 3.4 g kg−1, respectively, and all above the population mean (Figure 2B). Similarly, accessions exhibited wide IVDOM values from 363 to 563 g kg−1 (Figure 2C). ‘Tifton 84’ presented the highest IVDOM followed by Florakirk (555 g kg−1), PI 316507 (549 g kg−1), PI 255450 (548 g kg−1), PI 204438 (546 g kg−1), and Tifton 85 (546 g kg−1). The NDF ranged from 651 g kg−1 to 767 g kg−1 (Figure 2D), where only PI 297827, PI 287156, 319, and Florakirk showed values below 660 g kg−1. Despite the fact that NDF presented the lowest genotypic range and lowest genetic coefficient of variation (low genetic variability), NDF had medium broad sense heritability and high genotype by harvest correlation. Comparing the population mean with Tifton 85, CP, P, and NDF values were similar, but Tifton 85 exhibited a much higher IVDOM compared to the population mean and most other accessions (Figure 2).
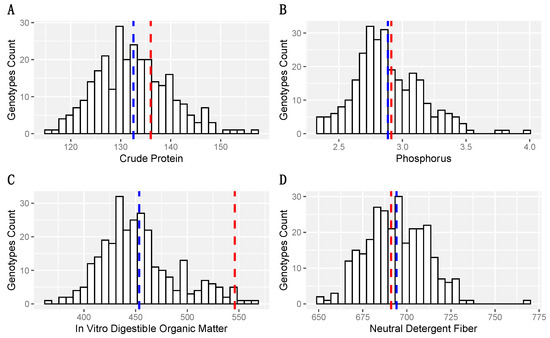
Figure 2.
Histogram for four nutritive values traits using predictive values estimated for the USDA-NPGS bermudagrass germplasm collection and three checks: Tifton 85, Jiggs and Florida 44, evaluated in Citra, FL. (A) Crude Protein concentration, (B) Phosphorus concentration, (C) In Vitro Organic Matter Digestibility, and (D) Neutral Detergent Fiber, all expressed in g kg−1. The dashed blue line shows the means, while the dashed red line shows the values for Tifton 85 of each NV trait.
The Pearson genetic correlations among the NV traits were all significant (p < 0.05), although FH was only correlated with IVDOM (Table 2). The NDF presented moderate negative correlations with CP, P, and IVDOM (Table 2). In contrast, positive correlations were observed among CP, P, and IVDOM, as well as between IVDOM and FH, in a moderate to low magnitudes.
Table 2.
Pearson genetic correlations among forage harvested (FH) and nutritive value traits: CP—Crude Protein concentration, P—Phosphorus concentration, IVDOM—In Vitro Digestible Organic Matter, and NDF—Neutral Detergent Fiber; estimated for the USDA-NPGS bermudagrass germplasm collection and checks: Tifton 85, Jiggs and Florida 44, evaluated in Citra, FL. Color code: red and blue indicate negative/positive significant (p < 0.05) correlations, while white shows non-significative correlations.
The PCA using predictive values for all accessions explained a large part of the variation found for NV traits and FH in this collection (Figure 3A). The first two PCAs accounted for 77.8% of the existing variation in the bermudagrass germplasm collection. The first principal component (PC) (eigenvalue of 2.57) explained 51.4% of variance, where the NV traits contributed more than the FH, and exhibited similar magnitudes (Figure 3A). The second PC exhibited an eigenvalue of 1.31, explained 26.41% of the variation, and the main contribution was FH (0.77), whereas other traits were less determinant, such as IVDOM (0.46), CP (−0.37), NDF (0.21), and P (−0.04). Other remaining PCs accounted for 22.2% of variation and had eigenvalues lower than 0.40.
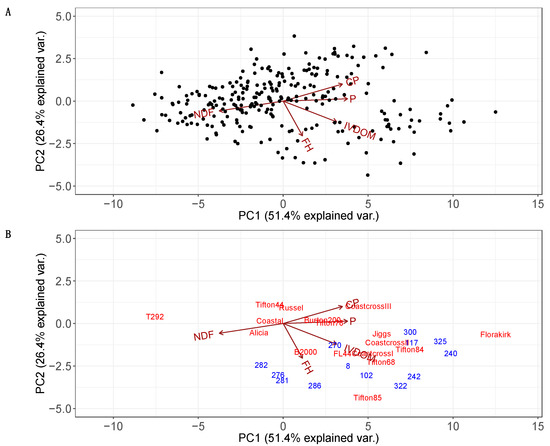
Figure 3.
Principal Components Analysis (PCA) estimated for the USDA-NPGS bermudagrass germplasm collection and commercial cultivars. Black loadings represent predicted values for five traits estimated for the whole collection (A), and loadings colored only for 17 cultivars (red) and 15 selected accessions (blue) (B). The plants were grown at Citra, FL, and five traits were determined using wet chemistry: crude protein concentration—CP, phosphorus concentration—P, in vitro digestible organic matter—IVDOM, neutral detergent fiber—NDF, and forage harvested—FH. The selected accessions were identified by field ID instead of plant introduction numbers to improve visibility in the graph.
Commercial cultivars (red) and the selected accessions (blue) also exhibited broad variation (Figure 3B). Two cultivars, T292 and Florakirk, exhibited contrasting performance for NV and FH (Figure 3B). Besides, most commercial cultivars showed lower NDF and higher values for CP, P and IVDOM in general. Tifton 85 exhibited the highest yield and IVDOM across cultivars in those two harvests. Comparing accessions and cultivars, some selected accessions exhibited higher combining of FH, IVDOM, CP, and P than commercial varieties, except by Tifton 85 and Florakirk. Tifton 85 presented high FH, while Florakirk presented high P and IVDOM. The accessions PI 316510 (322) and PI 255450 (242) grouped near Tifton 85, exhibited similar FH but higher IVDOM. In addition, some accessions exhibited high CP and P, such as PI 316507 (323), Breeding line 240 (240), PI 316536 (325), and PI 364484 (117).
3.2. Selected-Population
Significant genotype and harvest main effects (p < 0.001) were observed for all traits, but two-way interactions were non-significant for all traits (Table 3). For CP and IVDOM, the mean square values for harvest were considerably larger than for genotype, suggesting a higher environmental influence for these traits without influencing the genotypic response. However, the mean square value of harvest for P was lower than for genotype, which means a greater influence of genotype on P. The CV was higher for CP and P than for IVDOM and NDF but lower than 30%, which is the maximum threshold for field experiments [47]. Additionally, NDF exhibited CV lower than 5%, which was similar to the CVg observed in the whole population.
Table 3.
Analysis of variance showing sources of variation, degrees of freedom (df), and mean square values for each nutritive value trait.
Tifton 85 and Florida 44 were not different for CP between themselves or from other accessions (Table 4). However, PI 308193 had higher CP compared to PI 255456, PI 255450, PI 290813, PI 290664, and PI 295114 (Table 4). PI 316510 had similar CP than PI 308193, and it was higher than PI 290813, PI 290664, and PI 295114. For phosphorus content, Tifton 85 and Florida 44 performed similarly, and Tifton 85 was not statistically different from the PIs with lowest P. Additionally, Breeding line 240 and PI 255450 presented the highest P.
Table 4.
Average nutritive value for selected bermudagrass plant introductions (PI), breeding lines, and cultivars across eleven harvests evaluated in Citra, FL.
The accessions PI 316510, Breeding line 240, Breeding line 8, Tifton 85, and PI 316536 had similar IVDOM. Finally, breeding line 240 and PI 364484 exhibited the lowest NDF but were not significantly different from PI 316510, PI 316536, PI 255456, and Florida 44. All these PIs presented lower NDF than Tifton 85. Based on a performance index (Table 4), breeding line 240 was placed at the top of the ranking for the four NV traits, while PI 316510, PI 316536, and Breeding line 8 performed well for CP, IVDOM, and NDF. Breeding line 240 presented higher P than PI 316510, PI 316536, and Breeding line 8, as well as lower NDF than Breeding line 8. These accessions had lower NDF and higher P than Tifton 85. The PI 255450 showed high P concentration and exhibited high IVDOM similar to PI 316510. Finally, NDF presented the largest difference between the selected accessions and Tifton 85 (Table 4).
The NV traits varied greatly across harvests (Table 5). The NV fluctuated within the year, with higher CP and lower NDF in the April and September harvests. Higher IVDOM values were measured in the spring and beginning of summer for both years, coinciding with high volumes of rainfall and mild temperature (Figure 1). Lower values for CP, IVDOM, NDF, and P were observed in November, with scarce rainfall and low temperature inducing dormancy. The NV measured on the same month on both years were similar, and for some traits, there were no significant differences (Table 5). Although the fluctuations in temperature observed during both years were similar, the rainfall regime was different (Figure 1). In 2015, July and August had 250 mm per month, which was above average, whereas the rainfall the same period in 2016 was less than 133 mm per month. The rainfall in June was 290 mm in 2015, whereas it was 43 mm in 2016.
Table 5.
Average nutritive value by harvest (11) for the selected population (15 entries).
4. Discussion
The genetic parameters indicated that genetic gains can be expected in all NV traits in this bermudagrass germplasm, as most traits presented moderate H2. Broad sense heritability explains the magnitude of phenotypic variance due to the genetic variance [36]. Indeed, a higher genetic variance than GHI was observed for all traits, and the GHI was only significant for IVDOM. GHI effect was considerably lower than the main genotypic effect, similar to previous reports in maize (Zea mays L.) and timothy grass (Phleum pratense L.) [48,49], if we treat harvest as an environment. Thus, high stability of genotypes for these traits across harvests would be expected as supported by the high estimates of rGH. The use of rGH, although it does not elucidate the significance of variance sources, indicates the stability of genotypes among harvests in a given location, meaning that traits with high stability can be subjected to selection with fewer harvests. Given the high rGH for all traits, using estimates from fewer harvests can be a reliable NV measure to screen large nurseries in forage breeding programs. However, considering a selection for multiple locations, other environmental variables, such as soil type, crop management, and climate variability, might diverge and cause genotype by environment interaction (GEI). Therefore, we encourage other studies to elucidate GEI for NV traits. Despite that, using only two harvests for the whole population, it was possible to achieve prediction accuracies higher than 0.70 for IVDOM, NDF, and P, considered appropriate for forage breeding experiments [50]. In general, an increase in the number of harvests leads to an increase in precision; however, it adds costs and labor when dealing with large populations [51].
Genetic parameters, such as H2, rGH, and CVg, are variable among species, germplasm, traits, and experiments [52]. Medium to high broad-sense heritability for IVDOM have been reported for other forage grasses, 0.56 to 0.93 [53,54,55]. Previous efforts with bermudagrass showed broad-sense heritability ranging between 0.27 and 0.78 across years and experiments [11], denoting that H2 is inherent to the experimental conditions, as well as in where moderate to high estimates can be achieved for those species. In our study, H2 estimates were within the range of previous reports. The magnitude of H2 for P in the bermudagrass collection was similar to the broad-sense heritability of 0.46 reported for reed canarygrass (Phalaris arundinacea L.) [56] but lower than the 0.72 estimate reported in tall fescue (Schedonorus arundinacus (Schreb.) Dumort.) [57].
In turn, NDF had lower H2 compared to previous studies, and lower variation (CVg) in the population. Broad-sense heritability in NDF for populations of tall fescue [54] and koronivia grass (Urhochloa humidicola (Rendle), Morrone and Zuloaga [58]) were much greater (0.85 and 0.58, respectively) compared to the bermudagrass germplasm. Other reports also showed high narrow-sense heritability for NDF in tall fescue (0.6; Reference [59]) and signal grass (Urochloa decumbens (Stapf) R. Webster) (0.74; Reference [51]). Moreover, rGH across multiple harvests was also lower for the referred studies (0.36 in koronivia grass [58]; 0.82 in signal grass [51]). Thus, the efforts to genetically improve NDF from this germplasm would be similar to the above-mentioned species but fewer evaluations are needed since it has higher stability.
Crude protein exhibited lower H2 than the estimates for the other NV traits, but similar H2 estimates were found in other species. Low broad-sense heritability was reported for CP in meadow fescue (0.21) [53], as well as low narrow-sense heritability (0.07) in koronivia grass [58], 0.14 in congo grass [60], and 0.18 in tall fescue [59]. The estimates of H2, also, can be influenced by environment. In tall fescue, narrow heritability ranged from 0.18 to 0.54, with the winter harvest exhibiting a higher estimate than that for the fall harvest [59]. Thus, the choice of the harvest to characterize CP is important because managing data collection can minimize undesirable effects attributed to the large environmental variance compared to measured genetic variance in this study. Although CP had low H2 that will potentially result in lower genetic gains for this trait, any gain in protein content in grasses can result in significant reductions of the use of external protein sources. The high stability of this trait over the two annual harvests (high rGH), and non-significant GHI indicated that most of the variation in CP in this population was indeed due to genetics.
The genetic coefficient of variation complements the broad sense heritability estimates, and it allows the comparison of genetic variability among populations and traits [10]. The CVg for IVDOM was 8.1%, which is higher than values reported for meadow fescue (4%) [53], congo grass (2.2%) [61] and Urochloa spp. (5.8%) [55]. Digestibility has been a major target in previous bermudagrass breeding efforts (e.g., Coastcross I; Reference [11]. In an effort to improve digestibility in bermudagrass, approximately 500 accessions showed great variability for in vitro dry matter digestibility (IVDMD) and CVg ranged from 6.1 to 28.9%, and the two-year average for IVDMD ranged from 400 to 690 g kg−1 [10]. This large genetic variation can be exploited in breeding programs. In our study, the PI 255450 (242), which is a parental line for Kenya 61 [11], exhibited the highest IVDOM. Although it could be used in crosses aiming to combine higher digestibility with other traits, the ploidy level of this accession can be a limitation because the progeny from Coastal and Kenya 61 were all male sterile and not able to produce seeds [11]. Other Pis, such as Tifton 84, Florakirk, and PI 316507, also showed high IVDOM.
Phosphorous had the largest CVg among the NV traits in this population. Breeding line 240 and PI 316510 (322) had an average 30% more P concentration than Tifton 85, as well as desired levels of CP, IVDOM, and NDF. This genetic variability can be explored to generate information about P uptake and its relationship with forage yield, as previous research reported for N [18]. Accessions with high uptake P and N that combine reasonable agronomic performance can be used as phytoremediation agents for dairy farms [27,62]. On the other hand, genetic variability for NDF was the lowest among evaluated traits, concurrent with other reports from the literature, like 1.4 and 2.9% in tall fescue [59], 3.8 to 4.2% in leaves of Brachiaria spp. [55] 4.32, and 4.43% in leaves and stems of Arachis spp. [59]. These aspects confirm that difficulty in improving NDF by conventional breeding in forage species.
Entries with high NV traits were already included in the bermudagrass core collection except for four accessions (PI 292508, PI 547109, PI 297827, and PI 287156-01), as selection was based on FH across several environments [15]. Breeding line 240, PI 316510 (322) and PI 3166536 (325) presented lower NDF and greater P concentration than Tifton 85, and similar IVDOM and CP. Breeding for improved CP has received little attention in the past as nitrogen fertilizer has been an affordable and effective way to increase increasing CP concentration, IVDOM, and productivity in grasses [17,18,23]. Few studies looked at nitrogen use efficiency in bermudagrass [18], which found high variability for the trait, and a negative correlation to CP concentration especially at low N fertilization rates.
In general for bermudagrass, CP has negative correlation with biomass and NDF (−0.32 and −0.36, Reference [29]), but positive correlation with dry matter digestibility (0.34; [11]). Similar results were observed on a review of over one hundred forage species, where digestibility had a positive correlation with CP (0.62) and negative with NDF (−0.68) [63]. Our results showed similar trends, although FH was only significantly correlated to IVDOM. The moderate to low genetic correlations found in the current germplasm suggest genes related to the expression of these traits have higher independence or belong in different metabolic routes. This can be due to the genetic diversity present in this germplasm, particularly related to having different species and ploidy levels in the core collection [15,16]. Thus, breeding multiple nutritive value traits in Cynodon ssp. should be achievable, and there is still potential for NV to be improved with forage yield.
Selection on a single trait provides higher genetic progress but can be detrimental if some unwanted correlation exists with the trait under improvement. On the other hand, genetic correlations can be used to identify potential indirect selections for simultaneous breeding [36]. Although there was no clear cluster of genotypes in the PCA, it was possible to identify genotypes that presented superior NV traits and FH. For instance, except for Tifton 85 and Florakirk, other accessions in the selected population presented higher P, IVDOM, and FH than most commercial cultivars. In general, commercial varieties and the selected population showed variability and different patterns of NV performance. Accessions such the breeding line 240, PI 255450, and PI 316510 exhibited high FH and NV. Thus, they can be selected as parental lines in future crosses and public cultivar releases.
5. Conclusions
The results presented in this study complement previous findings and provide useful information for the entire forage bermudagrass collection, aiming at developing cultivars with improved NV. The high significance of the genotypic factor evaluated during eleven harvests showed differences among the accessions in the selected-population for all NV traits. These accessions have a good combination of NV and biomass production, and some of them had improved NV compared to Tifton 85. The lack of significant two-way interactions between genotype and harvest for NV traits confirmed the high stability of genotypes across harvests. Thus, selection for NV can be assessed with fewer harvests, resulting in savings for time, labor, and resources. Genetic parameters revealed that P has higher potential to be explored as breeding target, along with CP, while narrow variance for NDF, and the availability of varieties with high IVDOM, would require more effort than conventional breeding for improving those traits in bermudagrass. Breeding line 240, PI 316510 (322), and PI 3166536 (325) presented superior nutritive value than Tifton 85 and will be considered for public cultivar releases in the United States.
Supplementary Materials
The following are available online at https://www.mdpi.com/2073-4395/10/11/1729/s1, Table S1: Predicted genetic values estimated of nutritive value traits: crude protein (CP), phosphorous (P), in vitro digestible organic matter (IVDOM) and nutrient detergent fiber (NDF) in g.kg−1, for the USDA-NPGS bermudagrass germplasm collection evaluated in Citra, FL.
Author Contributions
Conceptualization, P.M., W.A., and E.R.; Data curation, P.M., Y.L., and E.R.; Formal analysis, C.d.S. and E.R.; Funding acquisition, P.M.; Investigation, P.M., Y.L., and E.R.; Methodology P.M., Y.L., and E.R.; Project administration, P.M., Y.L., W.A., and E.R.; Resources, P.M., Y.L., W.A., and E.R.; Software, C.d.S. and E.R.; Supervision, P.M., Y.L., and E.R.; Visualization, C.d.S., M.W. and E.R.; Writing—original draft, C.d.S., M.W., M.D., and E.R.; Writing—review & editing, C.d.S., Y.L., P.M., W.A., M.D., M.W., and E.R. All authors have read and agreed to the published version of the manuscript.
Funding
This work was supported by the USDA National Institute of Food and Agriculture, Hatch project 1018058.
Acknowledgments
The authors greatly thank all the Forage Breeding and Genetics Lab members and staff at the University of Florida Plant Science Research and Education Unit, Citra, FL, USA, for providing help during the field trial and data collection.
Conflicts of Interest
The authors declare no conflict of interest.
References
- Jank, L.; Valle, C.; Resende, R. Breeding Tropical Forages. Crop Breed. Appl. Biotechnol. 2011, 11, 27–34. [Google Scholar] [CrossRef]
- Taliaferro, C.M.; Rouquette, F.M.; Mislevy, P. Bermudagrass and Stargrass. In Agronomy Monographs; Wiley: Hoboken, NJ, USA, 2016; pp. 417–475. [Google Scholar]
- Ball, D.M.; Hoveland, C.S.; Lacefield, G.D. Southern Forages: Modern Concepts for Forage Crop Management; IPNI: Saskatoon, SK, Canada, 2007. [Google Scholar]
- Hill, G.M.; Gates, R.N.; Burton, G.W. Forage Quality and Grazing Steer Performance from Tifton 85 and Tifton 78 Bermudagrass Pastures2. J. Anim. Sci. 1993, 71, 3219–3225. [Google Scholar] [CrossRef] [PubMed]
- Mandebvu, P.; West, J.; Hill, G.M.; Gates, R.N.; Hatfield, R.D.; Mullinix, B.G.; Parks, A.H.; Caudle, A.B. Comparison of Tifton 85 and Coastal Bermudagrasses for Yield, Nutrient Traits, Intake, and Digestion by Growing Beef Steers. J. Anim. Sci. 1999, 77, 1572–1586. [Google Scholar] [CrossRef] [PubMed]
- Pequeno, D.N.L.; Pedreira, C.G.S.; Sollenberger, L.E.; De Faria, A.F.G.; Silva, L.S. Forage Accumulation and Nutritive Value of Brachiariagrasses and Tifton 85 Bermudagrass as Affected by Harvest Frequency and Irrigation. Agron. J. 2015, 107, 1741–1749. [Google Scholar] [CrossRef]
- Marcum, K.; Pessarakli, M. Salinity Tolerance and Salt Gland Excretion Efficiency of Bermudagrass Turf Cultivars. Crop. Sci. 2006, 46, 2571–2574. [Google Scholar] [CrossRef]
- Harlan, J.M.J.; De Wet, J.R.; Richardson, W.L. Hybridization Studies with Species of Cynodon from East Africa and Malagasy. J. Bot. 1969, 56, 944–950. [Google Scholar] [CrossRef]
- Ohmoto, T.; Ikuse, M.; Natori, S. Triterpenoids of the Gramineae. Phytochemistry 1970, 9, 2137–2148. [Google Scholar] [CrossRef]
- Burton, G.W.; Monson, W.G. Inheritance of Dry Matter Digestibility in Bermudagrass, Cynodon dactylon (L.) Pers. 1. Crop Sci. 1972, 12, 375–378. [Google Scholar] [CrossRef]
- Burton, G.W.; Hart, R.H.; Lowrey, R.S. Improving Forage Quality in Bermudagrass by Breeding 1. Crop Sci. 1967, 7, 329–332. [Google Scholar] [CrossRef]
- Burton, G.W.; Monson, W.G. Registration of Tifton 68 Bermudagrass. Crop Sci. 1984, 24, 1211. [Google Scholar] [CrossRef]
- Burton, G.W.; Gates, R.N.; Hill, G.M. Registration of ‘Tifton 85’ Bermudagrass. Crop Sci. 1993, 33, 644–645. [Google Scholar] [CrossRef]
- Mislevy, P.; Brown, W.F.; Dunavin, L.S. Florakirk. Bermudagrass. Circ S-395. 1995. Available online: https://edis.ifas.ufl.edu/aa221 (accessed on 30 May 2020).
- Anderson, W.F. Development of a Forage Bermudagrass (Cynodon sp.) Core Collection. Grassl. Sci. 2005, 51, 305–308. [Google Scholar] [CrossRef]
- Anderson, W.F.; Maaß, A.; Ozias-Akins, P. Genetic Variability of a Forage Bermudagrass Core Collection. Crop Sci. 2009, 49, 1347–1358. [Google Scholar] [CrossRef]
- Anderson, W.F.; Dien, B.S.; Jung, H.-J.G.; Vogel, K.P.; Weimer, P.J. Effects of Forage Quality and Cell Wall Constituents of Bermuda Grass on Biochemical Conversion to Ethanol. Bioenergy Res. 2009, 3, 225–237. [Google Scholar] [CrossRef]
- Schneider-Canny, R.; Chekhovskiy, K.; Muñoz, P.; Kwon, S.; Saha, M.C. Characterization of Bermudagrass (Cynodon dactylon L.) Germplasm for Nitrogen Use Efficiency. Euphytica 2019, 215, 40. [Google Scholar] [CrossRef]
- Gerber, P.J.; Hristov, A.N.; Henderson, B.; Makkar, H.; Oh, J.; Lee, C.; Meinen, R.; Montes, F.; Ott, T.; Firkins, J.; et al. Technical Options for the Mitigation of Direct Methane and Nitrous Oxide Emissions from Livestock: A Review. Animal 2013, 7, 220–234. [Google Scholar] [CrossRef]
- Teague, W.; Delaune, P.B.; Dowhower, S.L. Impacts of over-Seeding Bermudagrass Pasture with Multispecies Cover Crops on Soil Water Availability, Microbiology, and Nutrient Status in North Texas. Agric. Ecosyst. Environ. 2019, 273, 117–129. [Google Scholar] [CrossRef]
- Glendining, M.J.; Dailey, A.; Williams, A.G.; Van Evert, F.K.; Goulding, K.; Whitmore, A. Is It Possible to Increase the Sustainability of Arable and Ruminant Agriculture by Reducing Inputs? Agric. Syst. 2009, 99, 117–125. [Google Scholar] [CrossRef]
- Knapp, J.; Laur, G.; Vadas, P.; Weiss, W.; Tricarico, J. Invited Review: Enteric Methane in Dairy Cattle Production: Quantifying the Opportunities and Impact of Reducing Emissions. J. Dairy Sci. 2014, 97, 3231–3261. [Google Scholar] [CrossRef]
- Casler, M.D.; Vogel, K.P. Accomplishments and Impact from Breeding for Increased Forage Nutritional Value. Crop Sci. 1999, 39, 12–20. [Google Scholar] [CrossRef]
- Sanderson, M.A.; Jones, R.M. Forage Yields, Nutrient Uptake, Soil Chemical Changes, and Nitrogen Volatilization from Bermudagrass Treated with Dairy Manure. J. Prod. Agric. 1997, 10, 266–271. [Google Scholar] [CrossRef]
- Brink, G.E.; Rowe, D.E.; Sistani, K.R. Broiler Litter Application Effects on Yield and Nutrient Uptake of ‘Alicia’ Bermudagrass. Agron. J. 2002, 94, 911. [Google Scholar] [CrossRef]
- Macoon, B.; Woodard, K.R.; Sollenberger, L.E.; French, E.C.; Portier, K.M.; Graetz, D.A.; Prine, G.M.; Van Horn, H.H. Dairy Effluent Effects on Herbage Yield and Nutritive Value of Forage Cropping Systems. Agron. J. 2002, 94, 1043. [Google Scholar] [CrossRef]
- Read, J.J.; Lang, D.J.; Adeli, A.; Jenkins, J.N. Harvest Management Effects on ‘Tifton 44’ Bermudagrass Phosphorus Removal and Nutritive Value. Agron. J. 2018, 110, 879–889. [Google Scholar] [CrossRef]
- Eichhorn, M.M.; Oliver, W.M.; Hallmark, W.B.; Young, W.A.; Davis, A.V.; Nelson, B.D. Registration of ‘Grazer’ Bermudagrass. Crop Sci. 1986, 26, 835. [Google Scholar] [CrossRef]
- Gitau, M.M.; Fan, J.; Xie, Y.; Fu, J. Genetic Diversity and Association Mapping of Forage Quality in Diverse Bermudagrass Accessions. Euphytica 2017, 213, 234. [Google Scholar] [CrossRef]
- Vendramini, J.M.B. Forage Evaluation and Quality in Florida. In Proceedings of the 21st Annual Florida Ruminant Nutrition Symposium, Gainesville, FL, USA, 2–3 February 2010; Department of Animal Sciences University of Florida, Institute of Food and Agricultural Sciences: Gainesville, FL, USA, 2010; pp. 92–106. [Google Scholar]
- Burns, J.C.; Fisher, D.S. Dry Matter Intake and Digestibility of “Coastal”, “Tifton 44”, and “Tifton 85” Bermudagrass Hays Grown in the U.S. Upper South. Crop Sci. 2007, 47, 795–810. [Google Scholar] [CrossRef]
- Pedreira, C.G.S.; Silva, V.J.; Newman, Y.C.; Sollenberger, L.E. Yearling Cattle Performance on Continuously Stocked ‘Tifton 85’ and ‘Florakirk’ Bermudagrass Pastures. Crop Sci. 2016, 56, 3354–3360. [Google Scholar] [CrossRef]
- Kohmann, M.M.; Sollenberger, L.E.; Vendramini, J.M.B.; Silveira, M.L.; Moreno, L.S.B. Harvest Atubble Height and K Fertilization Affect Performance of “Jiggs” and “Tifton 85” bermudagrasses. Crop Sci. 2017, 57, 3352–3359. [Google Scholar] [CrossRef]
- van Soest, P.J. Symposium on Factors Influencing the Voluntary Intake of Herbage by Ruminants: Voluntary Intake in Relation to Chemical Composition and Digestibility. J. Anim. Sci. 1965, 24, 834–843. [Google Scholar] [CrossRef]
- Mertens, D.R. Predicting Intake and Digestibility Using Mathematical Models of Ruminal Function. J. Anim. Sci. 1987, 64, 1548–1558. [Google Scholar] [CrossRef] [PubMed]
- Frankham, R. Introduction to Quantitative Genetics (4th edn). Trends Genet. 1996, 12, 280. [Google Scholar] [CrossRef]
- Gallaher, R.N.; Weldon, C.O.; Futral, J.G. An Aluminum Block Digester for Plant and Soil Analysis. Soil Sci. Soc. Am. J. 1975, 39, 803–806. [Google Scholar] [CrossRef]
- Hambleton, L.G. Semiautomated Method for Simultaneous Determination of Phosphorus, Calcium, and Crude Protein in Animal Feeds. J. Assoc. Off. Anal. Chem. 1977, 60, 845–852. [Google Scholar] [CrossRef]
- Moore, J.; Mott, G. Recovery of Residual Organic Matter from in Vitro Digestion of Forages. J. Dairy Sci. 1974, 57, 1258–1259. [Google Scholar] [CrossRef]
- Ankom Technology. Neutral Detergent Fiber in Feeds—Filter Bag Technique (for A2000 and A2000I). Method 6 2011; 10–11. Available online: http://www.ssco.com.tw/Ankom/PDF_file/NDF%20Method%20A200.pdf (accessed on 30 May 2020).
- Butler, D.G.; Cullis, B.R.; Gilmour, A.R. ASReml-R Reference Manual Version 4. 2017. 176. Available online: https://asreml.kb.vsni.co.uk/wp-content/uploads/sites/3/2018/02/ASReml-R-Reference-Manual-4.pdf (accessed on 30 May 2020).
- R Development Core Team. R: A Language and Environment for Statistical Computing. R Foundation for Statistical Computing. 2018; 1: 409. Available online: https://www.r-project.org/ (accessed on 30 May 2020).
- Satorra, A.; Saris, W.E. Power of the Likelihood Ratio Test in Covariance Structure Analysis. Psychometrika 1985, 50, 83–90. [Google Scholar] [CrossRef]
- de Resende, M.D.V. Genética Biométrica e Estatística no Melhoramento de Plantas Perenes; Embrapa Informação Tecnológica: Brasília, Brazil, 2002. (In Portuguese) [Google Scholar]
- de Mendiburu, F. Agricolae: Statistical Procedures for Agricultural Research. R Packag Version. Available online: https://cran.r-project.org/web/packages/agricolae/index.html (accessed on 30 May 2020).
- Wickham, H. ggplot2: Elegant Graphics for Data Analysis; Springer: New York, NY, USA, 2016. [Google Scholar]
- Brown, C.E. Applied Multivariate Statistics in Geohydrology and Related Sciences. In Applied Multivariate Statistics in Geohydrology and Related Sciences; Springer Science and Business Media LLC: Berlin/Heidelberg, Germany, 1998; pp. 155–157. [Google Scholar] [CrossRef]
- Argillier, O.; Barrière, Y.; Traineau, R.; Émile, J.C.; Hebert, Y. Genotype X Environment Interactions for Digestibility Traits in Silage Maize Estimated from in Vivo Measurements with Standard Sheep. Plant Breed. 1997, 116, 423–427. [Google Scholar] [CrossRef]
- McElroy, A.R.; Christie, B.R. Genotype × Environment Interactions for in Vitro Digestibility of Timothy (Phleum pratense L.) Genotypes. Can. J. Plant Sci. 1986, 66, 315–321. [Google Scholar] [CrossRef]
- Resende, M.D.V.; De Duarte, J.B. Precisão E Controle de Qualidade em Experimentos de avaliação de Cultivares. Agric. Res. Trop. 2007, 37, 182–194. [Google Scholar]
- Matias, F.I.; Barrios, S.C.L.; Valle, C.B.D.; Mateus, R.G.; Martins, L.B.; Moro, G.V. Estimate of Genetic Parameters in Brachiaria decumbens Hybrids. Crop Breed. Appl. Biotechnol. 2016, 16, 115–122. [Google Scholar] [CrossRef]
- Cruz, C.D.; Regazzi, A.J.; Carneiro, P.C.S. Modelos Biométricos Aplicados ao Melhoramento Genético, 3rd ed.; UFV: Viçosa, Brazil, 2004. [Google Scholar]
- Kanapeckas, J.; Tarakanovas, P.; Lemeþienë, N. Variability, Heritability and Correlations of Genetic Resources in Meadow Fescue. Biologija 2005, 3, 10–14. [Google Scholar]
- De Santis, G.; Chiaravalle, A.E. Heritabilities of Nutritive Quality Factors and Interrelationships with Yield in Selected Progenies of Tall Fescue. Plant Breed. 2001, 120, 337–343. [Google Scholar] [CrossRef]
- Thaikua, S.; Ebina, M.; Kouki, K.; Inafuku, M.; Akamine, H.; Shimoda, K.; Suenaga, K.; Kawamoto, Y. Preliminary Evaluation on Digestibility and the Relation to Morphology and Water Content of Brachiaria spp. And Their Heritability. Grassl. Sci. 2015, 61, 92–100. [Google Scholar] [CrossRef]
- Casler, M.D.; Undersander, D.J.; Jokela, W.E. Divergent Selection for Phosphorus Concentration in Reed Canarygrass. Crop Sci. 2008, 48, 119–126. [Google Scholar] [CrossRef]
- Nguyen, H.T.; Sleper, D.A. Genetic Variability of Mineral Concentrations in Festuca arundinacea Schreb. Theor. Appl. Genet. 1981, 59, 57–63. [Google Scholar] [CrossRef] [PubMed]
- De Assis, G.M.L.; Valle, C.B.D.; De Andrade, C.M.S.; Valentim, J.F. Selecting New Brachiaria Humidicola Hybrids for Western Brazilian Amazon. Trop. Grassl. Forrajes Trop. 2013, 1, 42. [Google Scholar] [CrossRef]
- Annicchiarico, P.; Romani, M. Genetic Variation, Heritability and Genetic Correlations for Forage Quality and Yield Traits of Mediterranean Tall Fescue Germplasm. Plant Breed. 2005, 124, 99–101. [Google Scholar] [CrossRef]
- Simeão, R.M.; Silva, A.; Valle, C.; Resende, M.D.; Medeiros, S. Genetic Evaluation and Selection Index in Tetraploid Brachiaria ruziziensis. Plant Breed. 2016, 135, 246–253. [Google Scholar] [CrossRef]
- Simeão, R.M.; Assis, G.M.L.; Montagner, D.B.; Ferreira, R.C.U. Forage Peanut (Arachis spp.) Genetic Evaluation and Selection. Grass Forage Sci. 2016, 72, 322–332. [Google Scholar] [CrossRef]
- Corriher, V.; Redmon, L.; Baxter, L.L. Genetic Resources and Genetic Transformation in bermudagrass—A Review. Crop Sci. 2009, 47, 1–9. [Google Scholar]
- Lee, M.A. A Global Comparison of the Nutritive Values of Forage Plants Grown in Contrasting Environments. J. Plant. Res. 2018, 131, 641–654. [Google Scholar] [CrossRef]
Publisher’s Note: MDPI stays neutral with regard to jurisdictional claims in published maps and institutional affiliations. |
© 2020 by the authors. Licensee MDPI, Basel, Switzerland. This article is an open access article distributed under the terms and conditions of the Creative Commons Attribution (CC BY) license (http://creativecommons.org/licenses/by/4.0/).