Article

Investigation of Heat-Induced Changes in the Grain Yield and Grains Metabolites, with Molecular Insights on the Candidate Genes in Barley

1
Department of Botany and Microbiology, Faculty of Science, Assiut University, Assiut 71516, Egypt
2
Department of Botany, Faculty of Science, University of Fayoum, Fayoum 63514, Egypt
3
Department of Agronomy and Horticulture, University of Nebraska-Lincoln, Lincoln, NE 68588, USA
4
Department of Genetics, Faculty of Agriculture, Assiut University, Assiut 71526, Egypt
*
Authors to whom correspondence should be addressed.
These authors contributed equally to this work.
Agronomy 2020, 10(11), 1730; https://doi.org/10.3390/agronomy10111730
Submission received: 30 September 2020 / Revised: 30 October 2020 / Accepted: 2 November 2020 / Published: 6 November 2020
(This article belongs to the Special Issue Molecular Genetics, Genomics and Breeding of Cereal Crops)

Abstract

:
Heat stress is one of the abiotic stresses that cause a significant reduction in barley yield. Climate change will increase the number of heatwaves, which will result in more deterioration in the agricultural sector. Therefore, understanding the physiological changes that occur in the plant to tolerate heat stress is very important. A collection of 60 Egyptian spring barley genotypes has been tested for heat stress under field conditions. To quantify the changes in yield-related traits and the grain-reserve parameters as indicators for heat tolerance, several traits were scored. The causative genes that regulate the variation of all traits of interest were identified via single-marker analysis using 16,966 single nucleotide polymorphisms (SNP). Heat stress reduced yield-related traits, while some physiological traits (chlorophyll index, soluble carbohydrates, amino acids, and proline contents) increased. The genotypes were classified into four classes, A, B, C, and D, based on a reduction in grain yield per spike (GYPS) of 10%, 20%, 30%, and 40%, respectively. The physiological aspects were extensively studied in each group. The tolerant genotypes (class A) retained high yield-related traits as well as high reserved metabolites relative to the sensitive class D. The single-marker analysis and gene annotations revealed that the most effective markers and genes resided on chromosomes 1H and 4H. One of these markers, S4_250499621, was found to be associated with increased proline content, increased chlorophyll content, and decreased reduction in grain yield per spike and thousand kernel weight. This study is a part of our extended evaluation of this collection under various abiotic stresses at different developmental stages to develop climate-resilient crops.

1. Introduction

Food security is one of the most pressing global issues, particularly with recent global climate change, which adversely affects plant development and yield. Owing to global warming, mainly heat waves, the expected rise in average day temperature or shift to warmer seasonal temperatures will substantially reduce crop productivity and quality. Like other cereals, barley is very vulnerable to high temperatures, leading to poor plant growth, plant development, and lower productivity. Furthermore, winter-season climate changes globally often have short-term cool periods and longer warm periods. Plants grown in these conditions could be subjected to heat stress, particularly during the reproductive and grain-filling stages [1]. Lobell et al. [2] suggested that increasing the average daily temperature by a few degrees would cause considerable reductions in grain yield. For instance, temperature rises of 3–4 °C resulted in reduced crop yields of 15–35% in Africa and Asia, and by 25–35% in the Middle East [3]. Weichert et al. [4] reported that barley had a 15% reduction in yield parameters due to heat stress. Heatwaves caused significantly lower grain yields, with major implications for future global food security [5]. Fang et al. [6] suggested that high temperatures during the day, followed by high night temperature, might increase the damaging impact, giving rise to high losses of yield.
The impact of heat stress depends on the intensity and duration of the heat stress as well as the growth stage of the cereal crops [7]. Wahid et al. [8] identified that elevated temperature is most harmful at gametogenesis (8–9 days before anthesis), anthesis, and embryo fertilization. This may be ascribed to high temperatures that induce multiple physiological, reproductive, and biochemical alterations in plants that influence plant development and eventually lower economic yield [9]. The co-occurrence of high temperatures and low humidity leads to water-stressed conditions due to higher evaporation and transpiration. The elevated air temperature increases soil temperature, thereby reducing soil water content [10]. High-temperature stress reduced the yield-related parameters such as the number of spikes and the number of florets per plant in rice (Oryza sativa L.) and seed-set in sorghum (Sorghum bicolor L.) was also reduced under similar conditions [7]. Among all physiological traits, photosynthesis is the most sensitive biological process influenced by high temperature. The higher the temperature above the optimal temperature, the slower the photosynthetic rate [11,12]. Severe cellular injury or death may occur at moderately high temperatures after long-term exposure or within minutes at very high temperatures [8]. The main injuries caused by high temperatures include protein denaturation or degradation, increased fluidity of membrane lipids, loss of membrane integrity, and enzyme inactivation [13]. The grain yield in cereals and oilseed crops are adversely affected by heat stress and it reduced the grain oil, starch, and protein content [14,15]. Soluble carbohydrates, starch, and proline are other metabolites that have been influenced by heat stress and may also play a pivotal role in the plant’s response to heat stress [16,17].
A successful approach to develop heat-tolerant cultivars has been the evaluation of the targeted plant material under specificconditions to select the best genotypes [18]. This procedure can be followed by marker–trait association analysis to identify the candidate genes that are involved in the variation of the morphological and physiological traits. Relative to other abiotic stresses such as drought, the contribution of physiological parameters such as reserved metabolites, as well as the genetic control of heat stress in barley, is poorly understood. Few studies have dealt with the mapping of quantitative trait loci (QTL)/genes that regulate heat tolerance during flowering and seed setting in barley. An exception is the six QTLs for heat stress mapped in barley on chromosomes 3H, 4H, 5H, and 6H. The QTL on chromosome 5H was mapped very close to an earlier reported QTL for root length and the root–shoot ratio [19]. Two studies dealt with the transcriptomic changes of genes under heat stress in barley. Using the Affymetrix 22K Barley1 GeneChip microarray, Mangelsen et al. [20] found that heat stress induced the expression of 958 genes, whilst 1122 genes were downregulated in the developing barley grains. The downregulation of genes tailors the storage compounds’ biosynthesis as well as cell growth, indicating that heat stress rapidly impaired the grain development. Templer et al. [21] mapped 25 metabolic QTL under heat stress and/or drought stress in barley, among which three QTLs coincided with key player genes in these metabolites’ biosynthesis pathways. Weichert et al. [4] investigated the effect of barley sucrose transport gene (HvSUT) on seed quality and seed yield in wheat under heat stress. By exposing plants to heatwaves, they found that the expression of this gene in a winter wheat cultivar (cv. Certo) increased the grain yield, grain size, and above-ground biomass. In the wild-type, the heatwave decreased the grain yield, the aboveground biomass, grain size, starch, and water content, but increased grain sucrose content.
Thus, the objectives of the present study are (1) to estimate the variation of yield-related traits as well as physiological traits under heat stress during anthesis and seed setting, (2) to detect the genes that regulate the variation of these traits under heat stress, and (3) to identify the best selection indicators to develop a new strategy to select for heat tolerance in barley.

2. Materials and Methods

2.1. Experiment Layout and Planting Conditions

A collection of 60 Egyptian spring barley accessions and varieties was used in the current study (Supplementary Table S1). The pedigree and genetic diversity of this collection have been outlined by Elakhdar et al. [22]. The genotypes were tested in two growing seasons (2015 and 2016). In each season, there were two sowing dates. The first sowing date was in November at the optimum sowing time (at anthesis, temperatureswas optimum for grain yield). The second sowing date was one month later in December (at anthesis, temperatures exceeded 35 °C, i.e., higher than the optimal temperature for grain yield). A randomized complete block design was used where the seeds were cultivated in one-row plots (20 seeds/row). Irrigation in both treatments and season was applied every 15–20 days throughout the season. The detailed experimental design and sowing dates were described by Sallam et al. [23].

2.2. Meteorological Data

The maximum and minimum daily temperatures which coincided with post-anthesis stages of barley development are illustrated in Figure S1. These data represent heat stress based on decreasing the cool period and increasing warm period in plant development, thus heat-stressed plants were exposed to high-temperature conditions at anthesis and thereafter, whilst the normal growing plants were at near-optimal and normal temperatures during the grain filling stage.

2.3. Yield Attributes and Physiological Traits

2.3.1. The Yield-Related Traits

In control and heat-stressed plants, the following traits were measured for each genotype in the two growing seasons; days to flowering as the days from sowing until 50% flowered spikes per plot (DTF, day), grain yield per spike as the grain’s weight in a gram of the main spike (GYPS, g), yield per plot (YPP, g/plot), grain’s weight in gram per plot, and thousand kernel weight (TKW, g) (Table 1).

2.3.2. The Physiological Traits

Chlorophyll Content (CCF)

Total chlorophyll content was measured at anthesis in the two growing seasons (2015 and 2016). The CCF was measured in the middle of the flag leaf using a chlorophyll meter (SPAD-Meter, Konica, Minolta 502, Tokyo, Japan).

Leaf Water Content (WC)

Fresh (FW) and dry weight (DW) of plant flag leaves at anthesis were weighed for estimating water content by the following equation:
Leaf water content = [(FW − DW)/FW] × 100
The WC was measured in both growing seasons. The flag leaves (5 leaves per line) were dried in an aerated oven at 70 °C for 72 h.

Grain Reserved Metabolites

Under each condition, the barley grains from the two growing seasons were bulked over three replications for each genotype and ground into flour. From each genotype, 0.1 g grain flour was boiled in glass tubes containing 10 mL distilled water for 2 h. After centrifugation, the supernatants were used for soluble carbohydrates, soluble protein content (PC), and amino acid (AA) quantification, whereas the pellets were kept for starch analysis. The pellet was resuspended in 5 mL of dilute perchloric acid solution (9.2 mM) and kept at 100 °C for 30 min. After centrifugation, the supernatant was used for starch detection. The grains soluble protein was estimated based on the method of Lowry et al. [24] using bovine serum albumin as the standard. Total free amino acid contents were estimated by the ninhydrin method, using glycine as standard following the protocol of Moore and Stein [25]. The anthrone-sulfuric acid method, described by Fales [26] and Schlegel [27], was used for the detection of soluble carbohydrates (Carb) and starch (Str.). Proline content (Pro) of the grains was extracted in 5-sulfosalicylic acid, where the produced supernatant was used for the determination of proline according to the method of Bates et al. [28]. A full description of the trait’s full names, abbreviations and method of measurement is illustrated in Table 1.

Physiological Changes Due to Heat Stress

To better understand the physiological traits that the plant uses to alleviate the effects of heat stress, we first estimated the reduction in grain yield per spike due to heat stress, and then we classified all genotypes into four categories; class A, class B, class C, and class D for genotypes that had a 10%, 20%, 30% and >40% reduction in GYPS due to heat stress. Secondly, we studied in each class the average changes in CCF, WC, AA, Pro, PC, Str, and Carb due to heat stress. Genotypes in class A were considered the most heat tolerant genotypes, while those in class D were considered very heat-susceptible genotypes. Genotypes in classes B and C were considered as having intermediate tolerance to heat stress.
Based on the average of each trait, the reduction or increment due to heat stresses was estimated for all physiological, and yield data as a percentage relative to control.
%   Change   of   a   trait   =   (   T H T C   ×   100 ) 100
where TH and TC is the mean of a trait for each genotype under heat stress and control conditions, respectively.

2.4. Principal Component Analysis (PCA)

Principal component analysis was conducted among all traits according to Julkowska et al. [29].

2.5. Statistical Analysis

The analysis of variation and phenotypic correlation analyses was performed using PLABSTAT [30]. The analysis of variance for yield traits was described in [23]. Chlorophyll content and leaf water content were scored in the two growing seasons. The replications of each year were averaged for each genotype. Therefore, the statistical model was used as follows:
Yijk = μ + yi+ gj + ygij
where Yijk is the observation of a genotype i in a year and μ is the general average; gj, and yi refer to the effects of genotypes and years, respectively. ygij is genotype × year interaction (error).
As seeds from two seasons were bulked under each condition (heat and control), the statistical model for other physiological traits was as follows:
Yij = μ + gi+ rj + grij
where Yij is an observation of genotype i in replication j under each condition, and μ is the general mean; gi and rj are the main effects of genotypes and replications, respectively; grij is the genotype × replication interaction of genotype i with replication j.
All graphical presentations were made by EXCEL 2016 and R software 3.5.1 [31].

2.6. DNA Extraction and Genotyping-By-Sequencing (GBS)

Four to five leaves from each genotype (twenty-five-day-old plants) were collected to extract DNA. The extraction protocol was done by DNAzol Reagent (Molecular Research Center, Inc. Technical Bulletin 6, Cincinnati, OH, United States). The concentration of DNA for each genotype was measured using spectrophotometry (Gen5TM microplate reader and image software with Take3TM micro-volume plates (BioTek, Winooski, VT, USA) and prepared for GBS. The DNA of each genotype was genotyped using GBS by digesting the DNA with two different restriction enzymes, PstI, and MspI as described in Poland and Rife [32]. Pooled libraries were sequenced using Illumina, Inc. NGS platforms. The reads of the sequence were used for single nucleotide polymorphism (SNP) calling using TASSEL 5.0 v2 GBS pipeline [33]. A Barley cv. Morex, version MorexV2 was used for identifying SNP markers, their physical position, and localization. The GBS results in 25,700 single nucleotide polymorphism (SNPs). The SNP markers identified were filtered for minor allele frequency (MAF > 0.05), maximum missing sites per SNP < 20%, and maximum missing sites per genotype < 20%. Heterozygous loci were then marked as missing to obtain better estimates of marker effects (Peter Bradbury, personal communication). The filtration process revealed 16,966 SNPs, which were used for further genetic analysis.
Single-marker analysis (SMA) was used to test the associations between the 16,966 SNP markers and all phenotypic data scored on all genotypes. The analysis was done using R software following this model:
Y = μ + f(marker) + error
where Y is equal to the value of the respective trait value, μ refers to the mean of the population, and f (marker) is a function of the significant markers [34].

2.7. Candidate Gene Identification

The physical positions of the significant SNPs (those with a pleiotropic effect on 1H and 4H) were used to find the candidate genes, which colocalize or are very close to them (around 0.5 Mbp). We used the recent barley genome dataset and geneset (BARLEX; http://apex.ipk-gatersleben.de) to annotate the genes as candidates. The physical positions in base pairs and their corresponding genetic position in centiMorgan (cM) of the significant SNPs were detected using the most recent versions of the physical maps of barley [35,36]. Gene annotation for the candidate SNP markers was identified using Ensembl Genomes [37].

3. Results

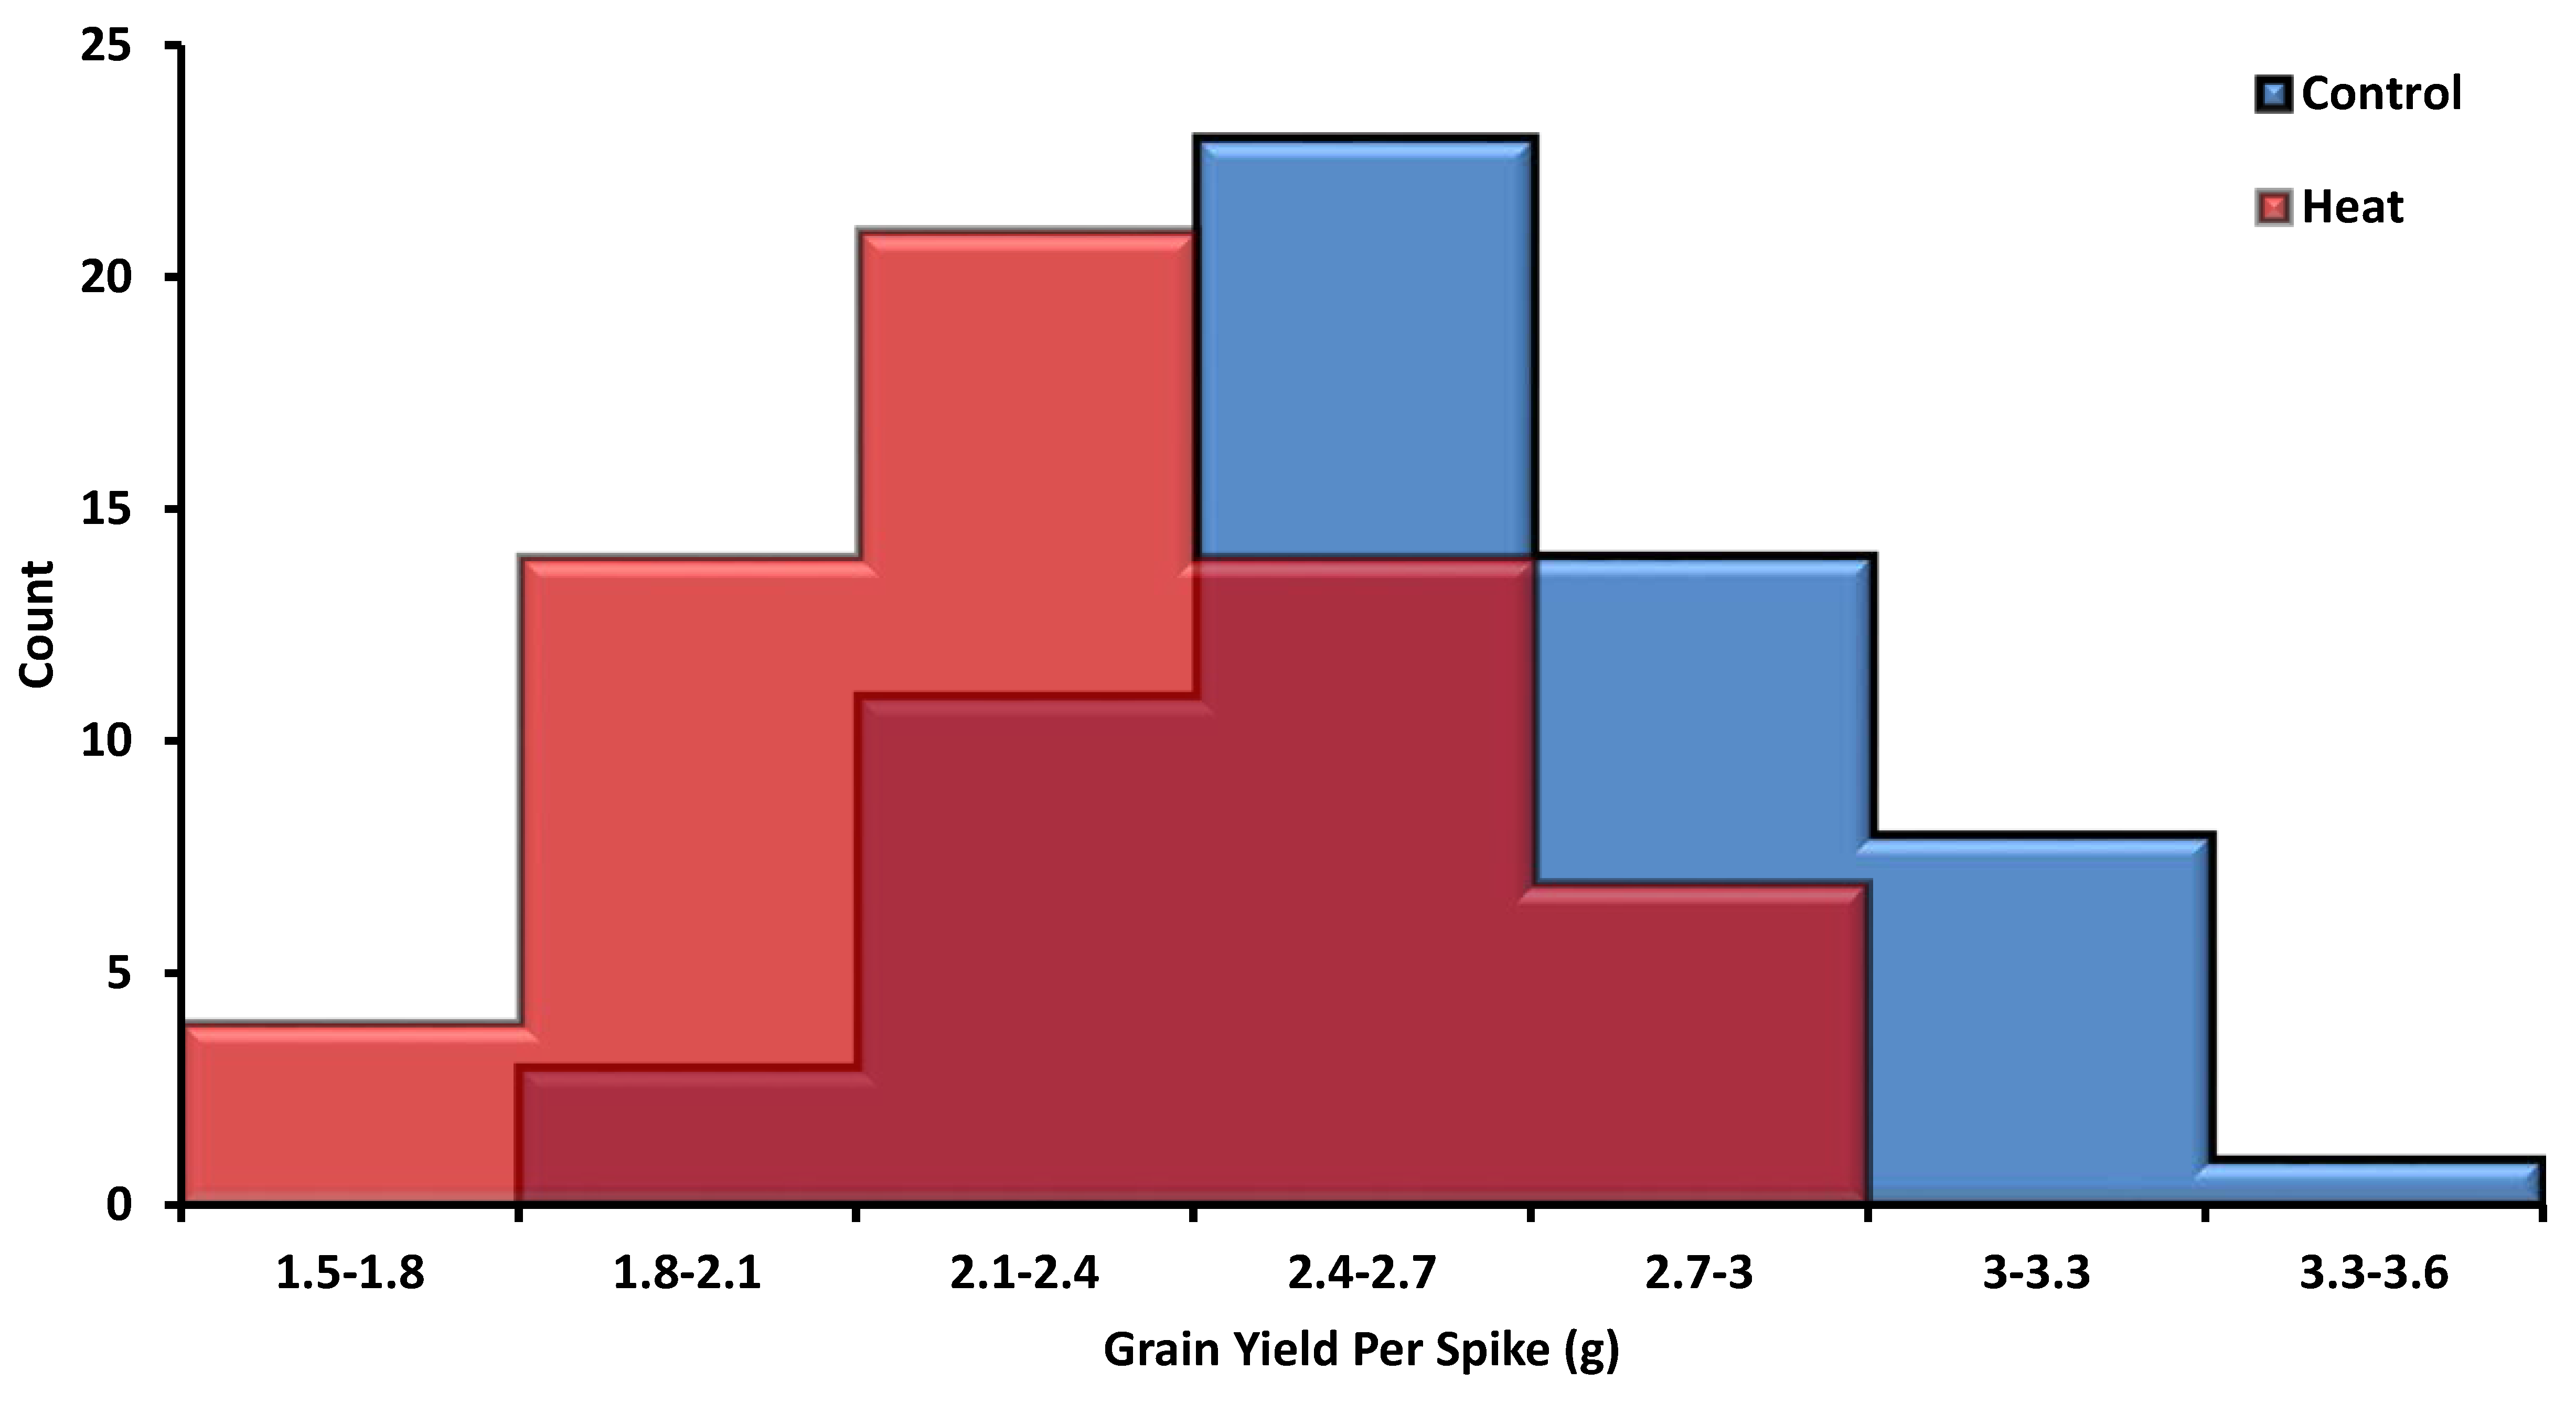
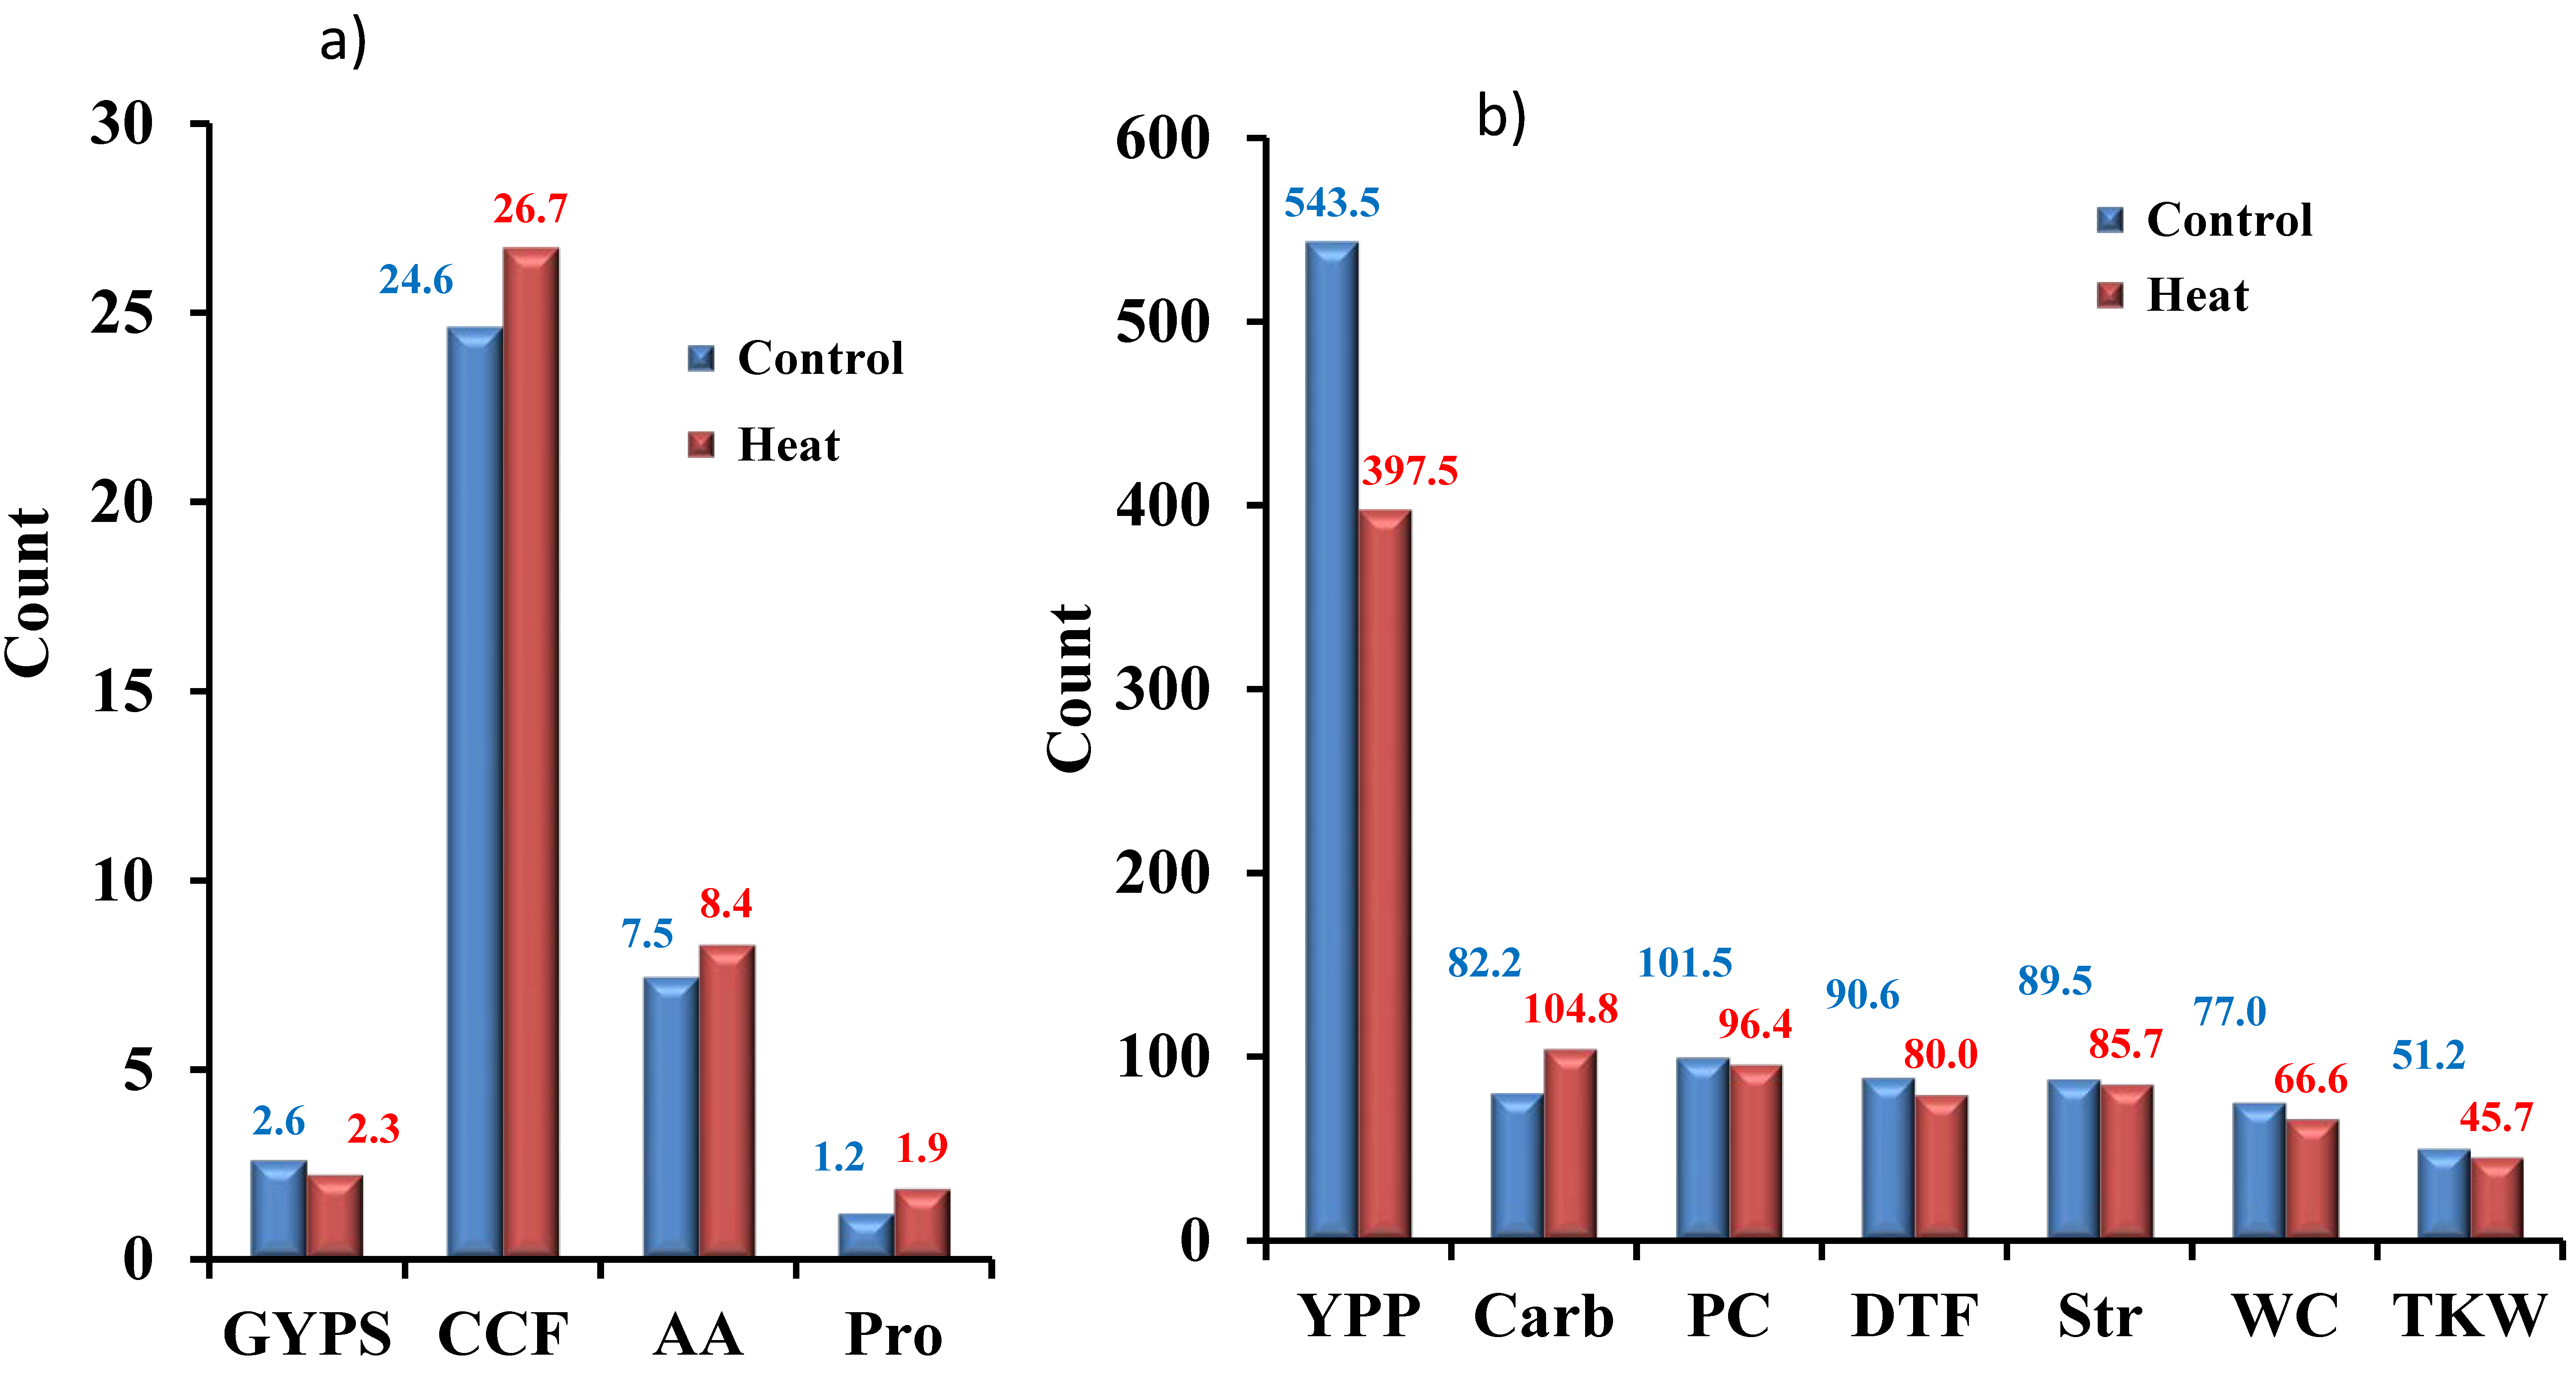
3.1. Yield-Related Traits

Four yield-related traits, namely GYPS, YPP, TKW, and DTF, were estimated under control conditions, as well as under heat stress conditions. The histogram analysis for GYPS as the main yield trait under control and heat stress conditions is presented in Figure 1. For GYPS, the genotypes were normally distributed under both conditions. Nearly all the other traits showed a normal distribution under both conditions; control and heat stress (Figure S2). Under control, the mean values were 2.6, 543.4, 51.2, and 90.6 for GYPS, YPP, TKW, and DTF, respectively (Figure 2a,b). Under heat stress, the mean values were 2.3, 397.5, 45.7, and 80 for GYPS, YPP, TKW, and DTF, respectively (Figure 2). The analysis of variation for yield traits was fully described previously [23]. All genotypes had high statistically significant genotypic differences under both conditions for all yield traits.

3.2. Physiological Traits

The analysis of variance (ANOVA) showed a high genetic variation among genotypes for all physiological traits under control and heat stress conditions. Notably, F values among genotypes were higher under heat stress than under control conditions for all physiological traits except CCF and WC (Table 2). No significant differences were found among the three replications.
The physiological traits CCF, WC, Str, Carb, PC, AA, and Pro varied diversely under heat stress. CCF, Carb, AA, and Pro increased on average for all genotypes under heat stress, whilst the remaining physiological traits decreased under heat stress, e.g., water content. For the traits that increased, the mean values were 24.6, 82.2, 7.5, and 1.2 under control and 26.7, 104.8, 8.4, and 1.9 for CCF, Carb, AA, and Pro, respectively, under heat stress (Figure 2a,b). For the decreasing traits—WC, PC, and Str—the mean values were 77, 101.5, 89.5 under control and 66.6, 96.4, and 85.7 under heat stress, respectively.

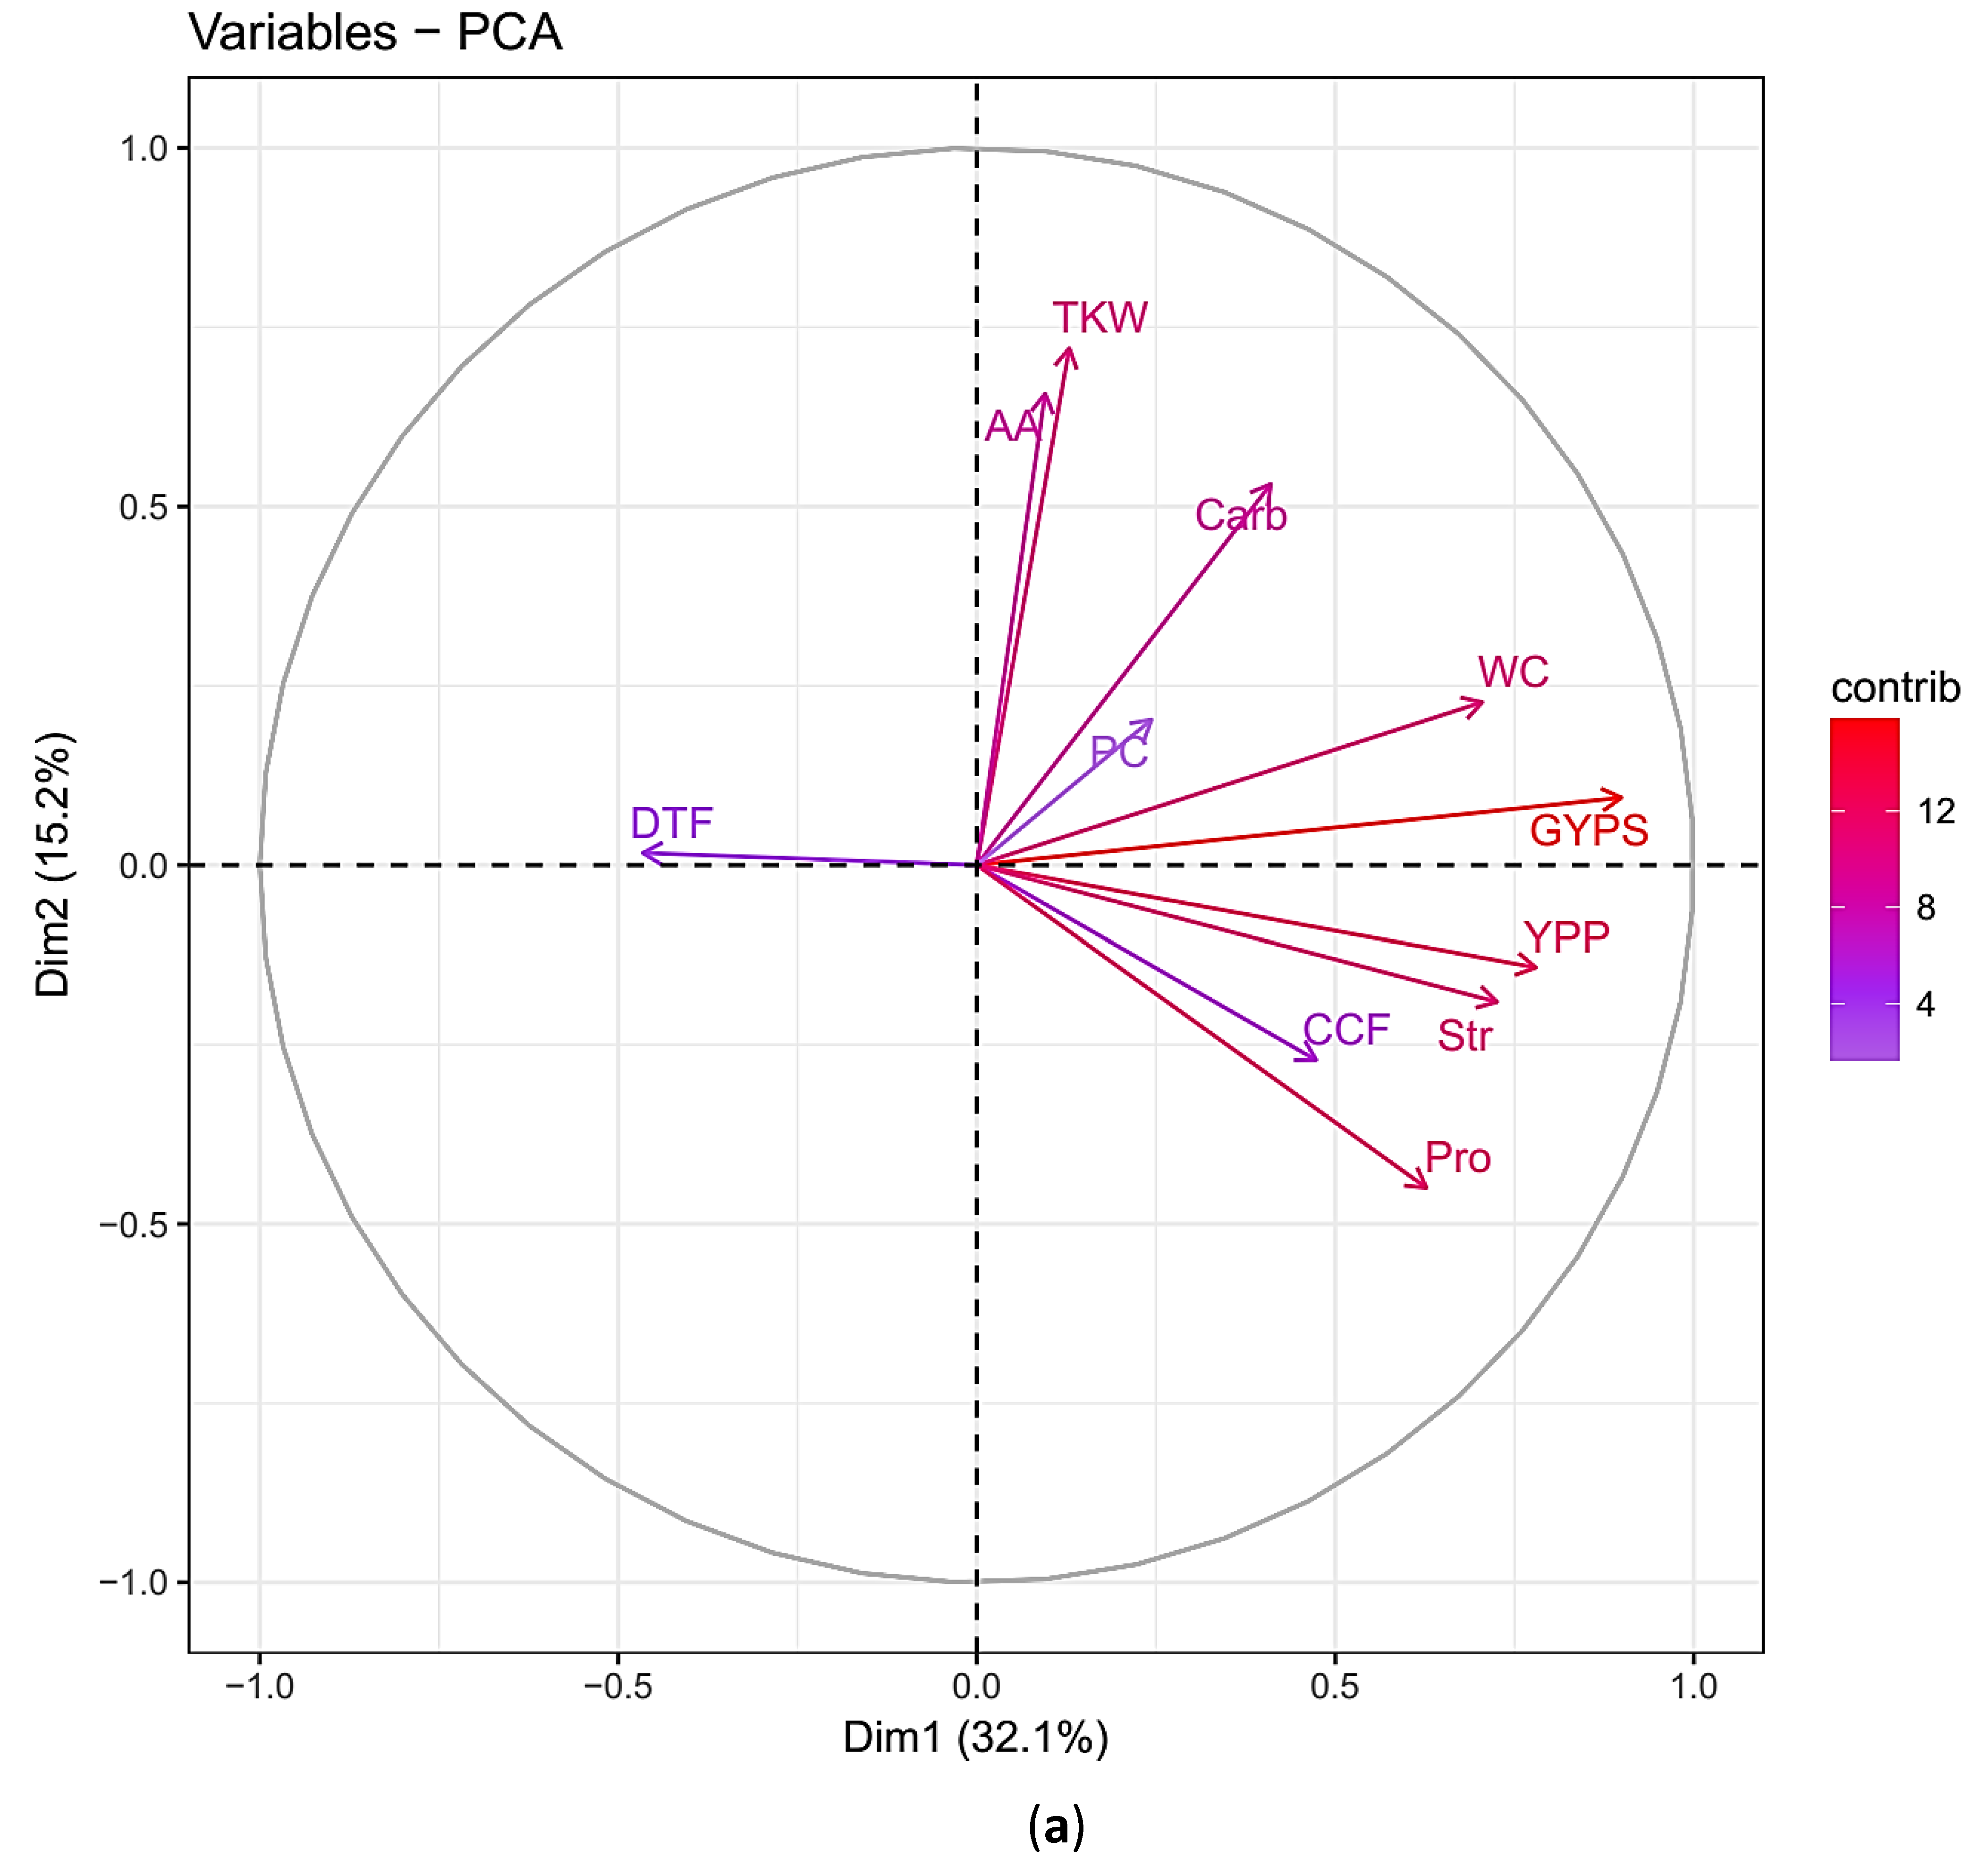
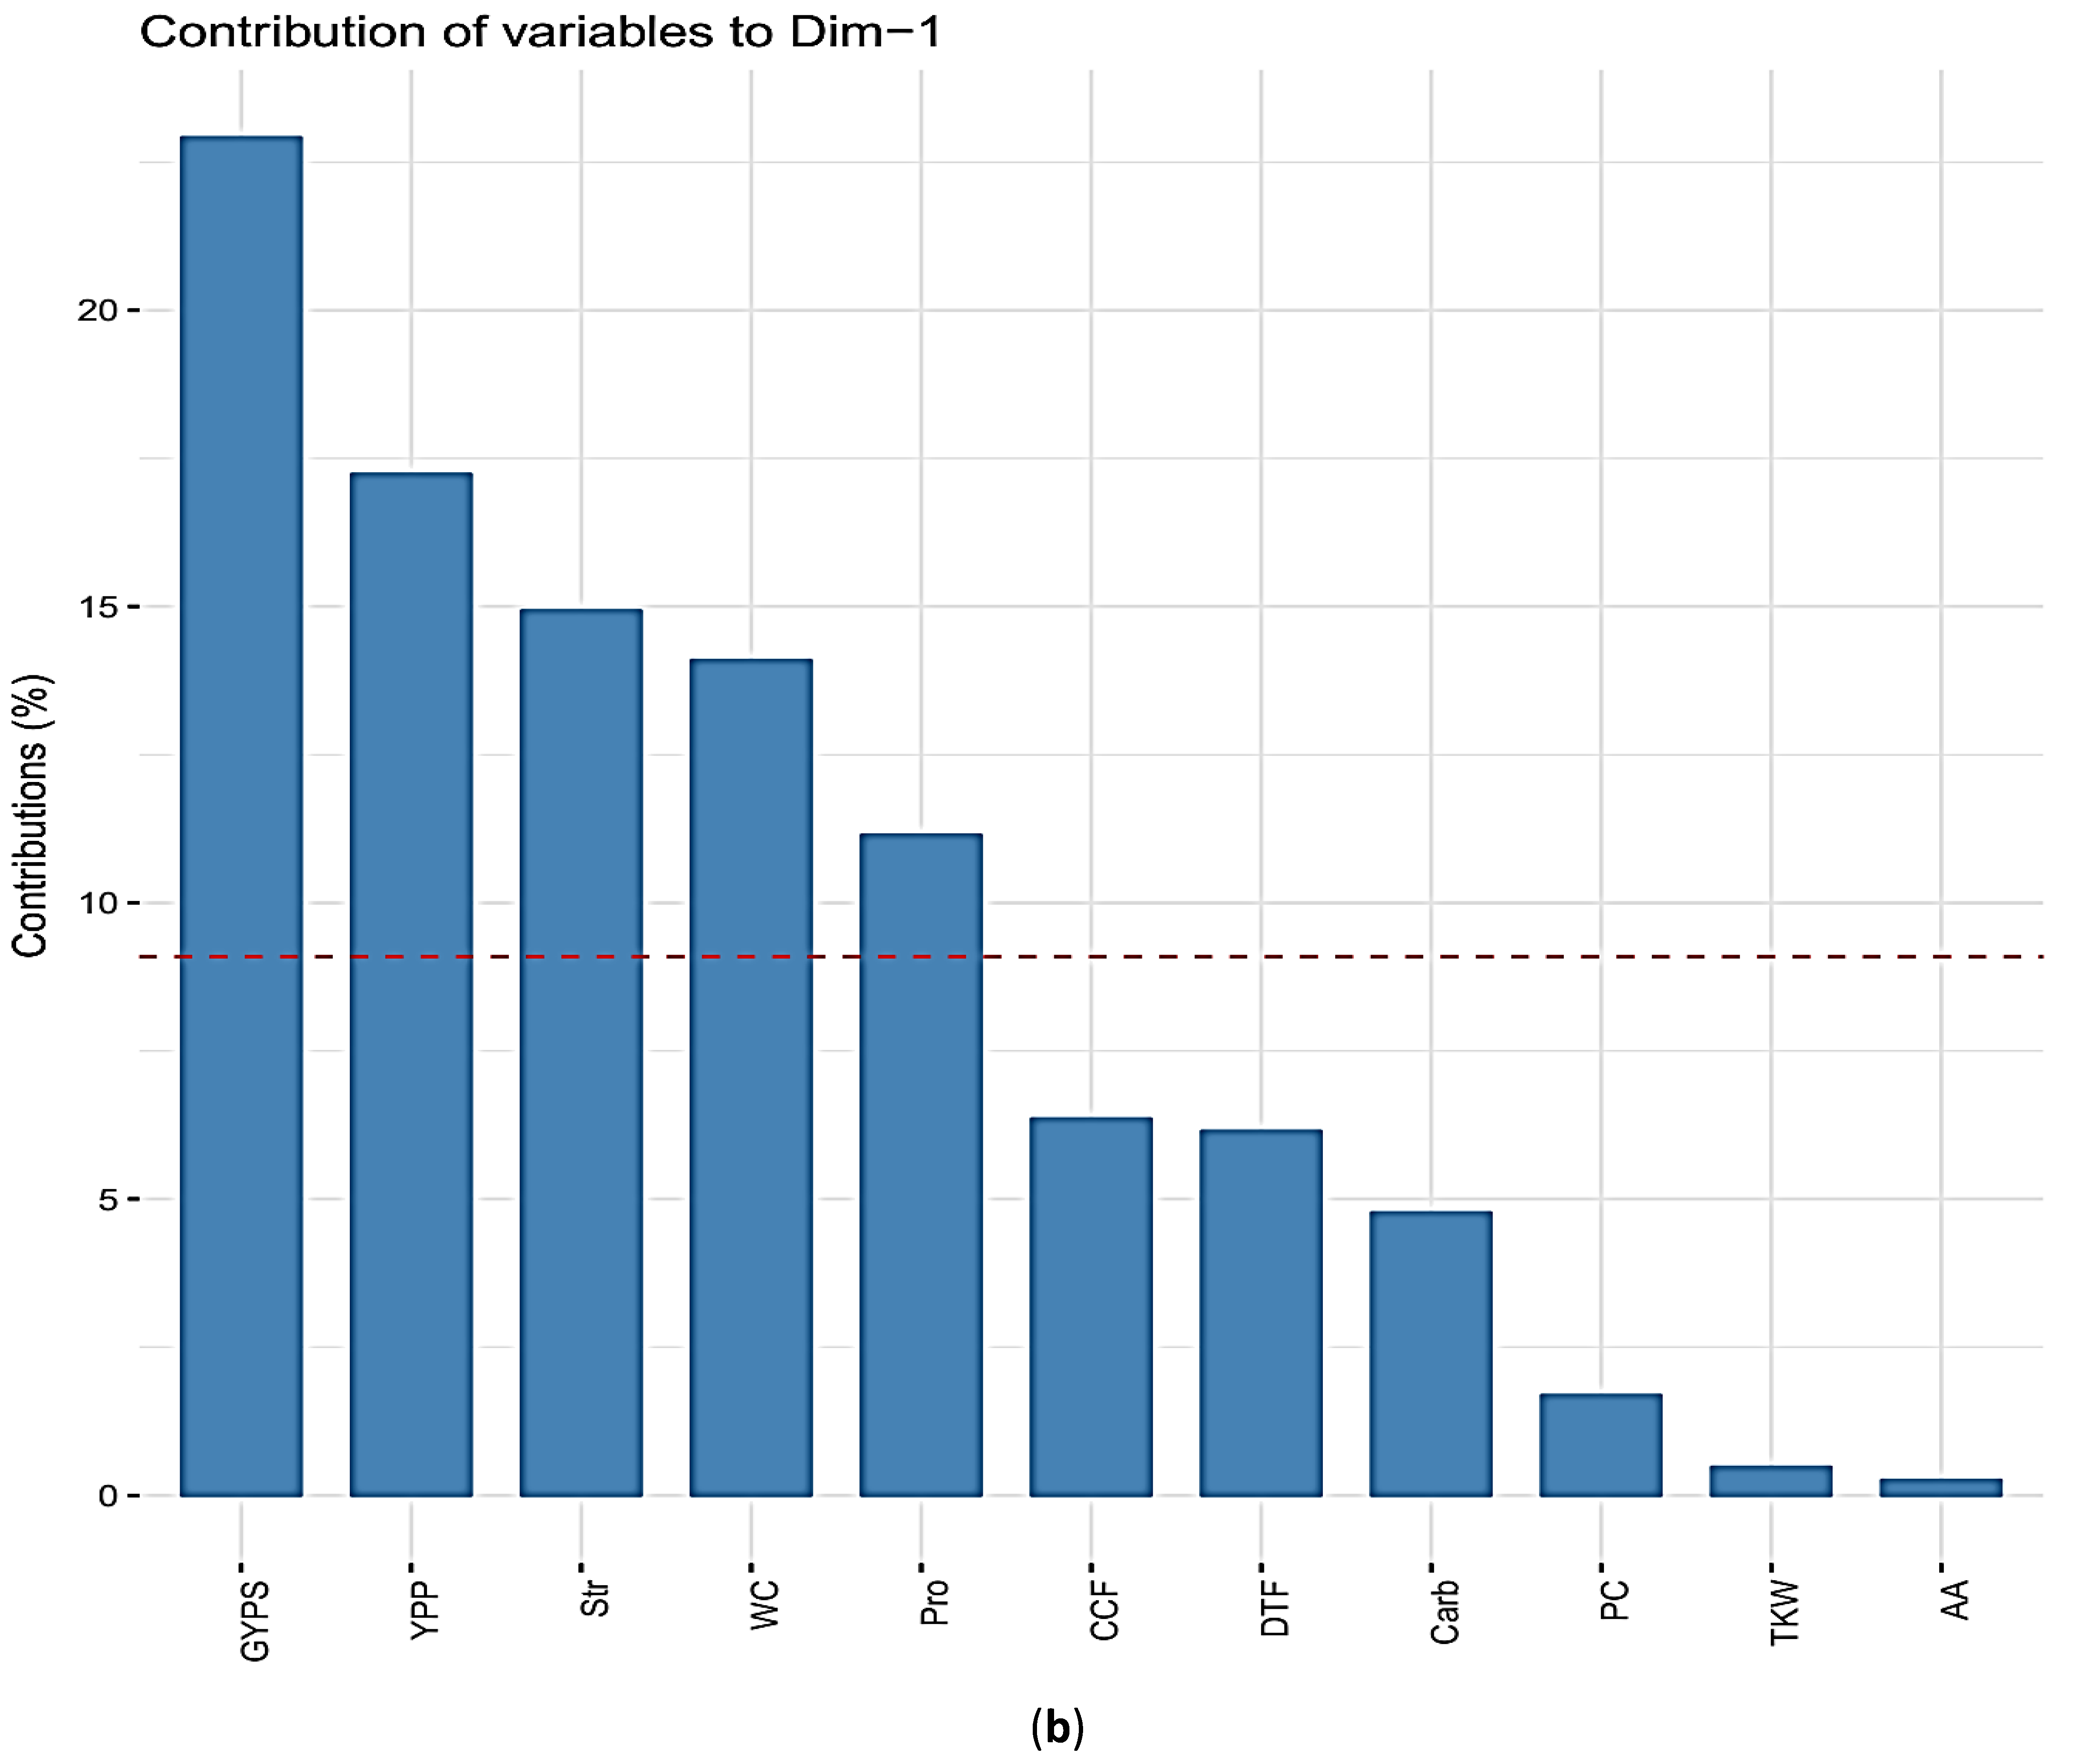
3.3. The Principal Component Analysis (PCA)

The principal component analysis (PCA) revealed that the positively correlated traits grouped together at dimension 1 (GYPS, YPP, TKW, Str, Pro, WC), whilst the negatively correlated trait (DTF) located at the opposite position. Both dimensions of PCA explained 47.3% of the variation presented in this collection (Figure 3a). The percentage contributions of the significant traits in the variation in the biplot dimension 1 were 22.9%, 17.2%, 14.9%, 14.0%, and 11.1% for GYPS, YPP, WC, Str, and Pro, respectively (Figure 3b). Accordingly, the GYPS was considered as a classification parameter. Based on the percentage reduction in GYPS, the genotypes were classified into four classes, namely A, B, C, and D (described below).

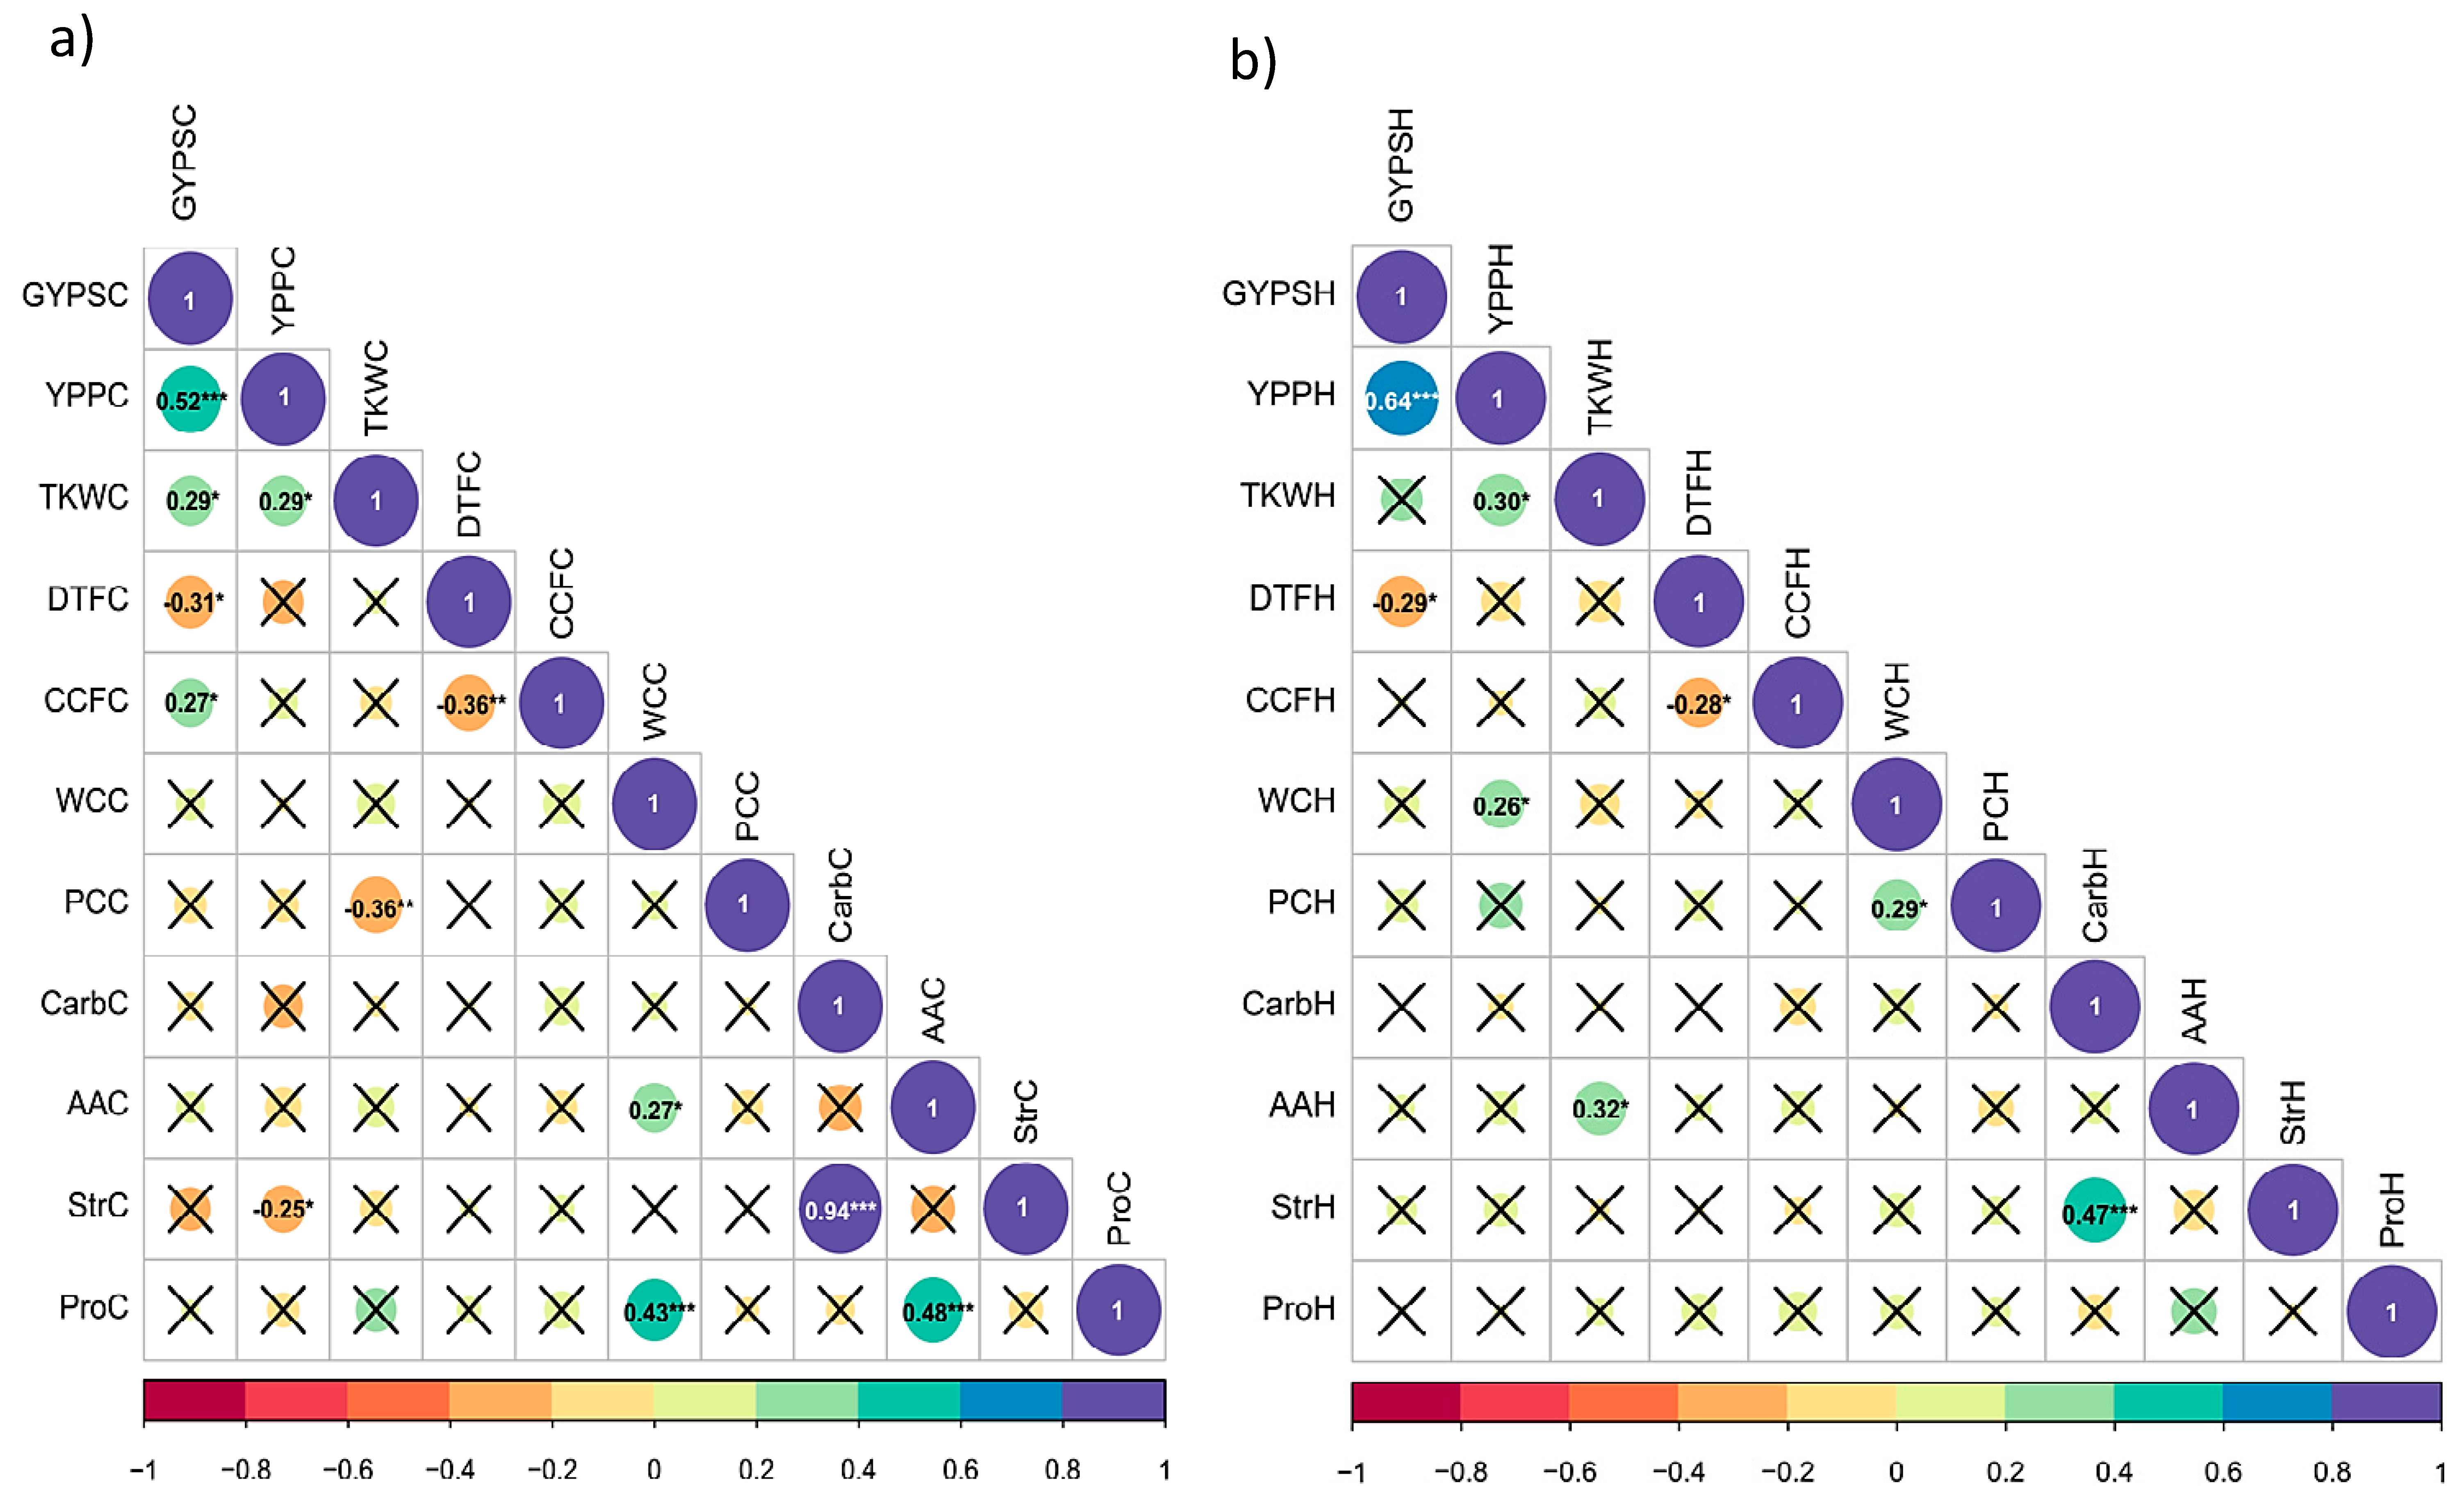
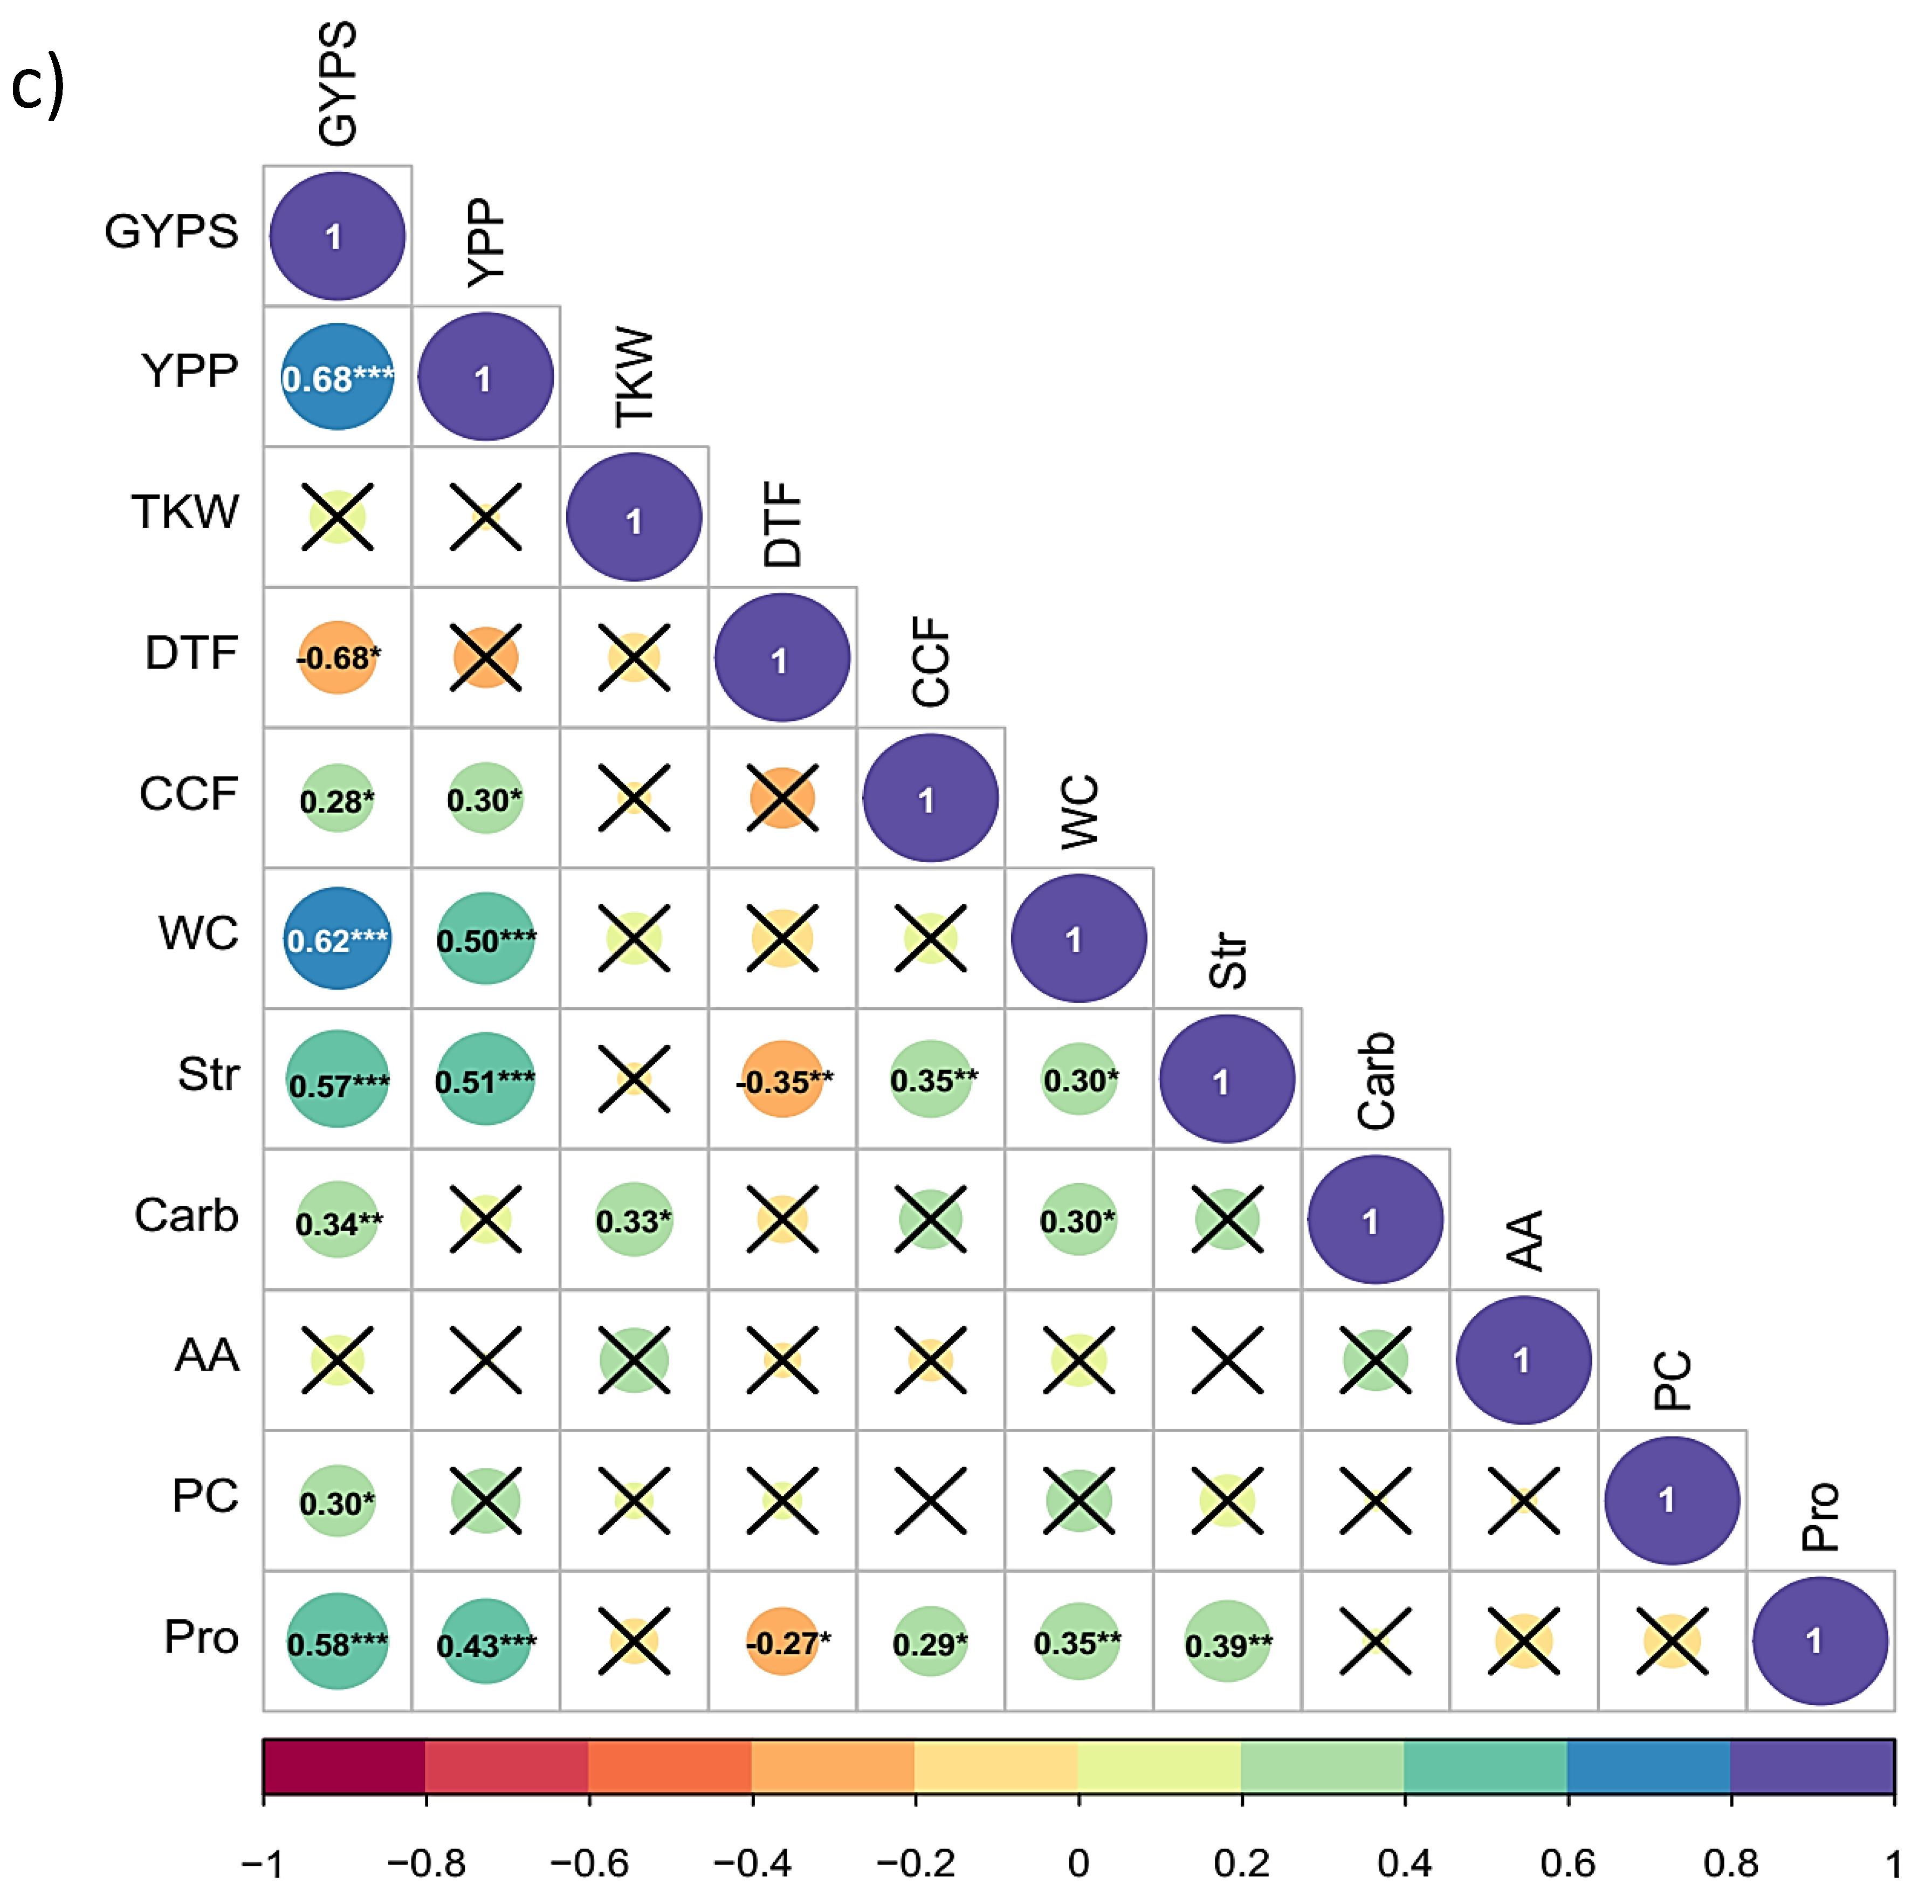
3.4. Correlation Analysis

Three correlation analyses were performedamong traits under control conditions (Figure 4a), under heat stress conditions (Figure 4b), and among changes in traits due to heat stress (Figure 4c).
Under control conditions for the yield-related traits, the correlations were positive and significant between GYPS and YPP with r = 0.52**, GYPS and TKW with r = 0.29*, and negative and significant between GYPS and DTF with r = −0.31*. For the physiological traits, all the significant correlations were positive, and the highest was observed between Str and Carb with r = 0.94*** (Figure 4a). Among the yield-related traits and the physiological traits, CCF was significantly correlated with GYPS (r = 0.27*), and DTF (r = −0.36**). Unexpectedly, Str negatively and significantly correlated with YPP with r = −0.25*.
Under heat stress, on the other hand, the magnitude of correlations decreased or became non-significant. There was a positive and significant correlation between GYPSH and YPPH (r = 0.64***). For physiological traits, significant correlations were found between StrH and CarbH (r = 0.47***), WCH and YPPH (r = 0.26*), and WCH and PCH with r = 0.29* (Figure 4b).
The correlations among the changes in the respective traits had very interesting results. All the changes in physiological traits exhibited significant correlations with the reduction in GYPS, except AA and TKW. The highest positive and significant correlations with the reduction in YPP were observed for the changes in WC (r = 0.68**). Similar correlation sizes were found between the reduction in GYPS and both changes in Str and Pro with r = 0.57*** and 0.58***, respectively. Notably, earliness in DTF had negative significant correlations with the reduction in yield-related traits (GYPS, r = −0.68*), as well as with the physiological traits as Str (r = −0.35**), and Pro (r = −0.27*). These results indicate that the percentage changes in the traits are more correlated with each other than the traits under each treatment independently, suggesting a common genetic control and/or cross-talked pathways.
In agreement with the PCA outcomes, the traits that were grouped in biplot dimension 1 had significant positive correlations under control and heat conditions, as well as between the percentage changes corresponding to those traits (Figure 3a,b and Figure 4a–c).

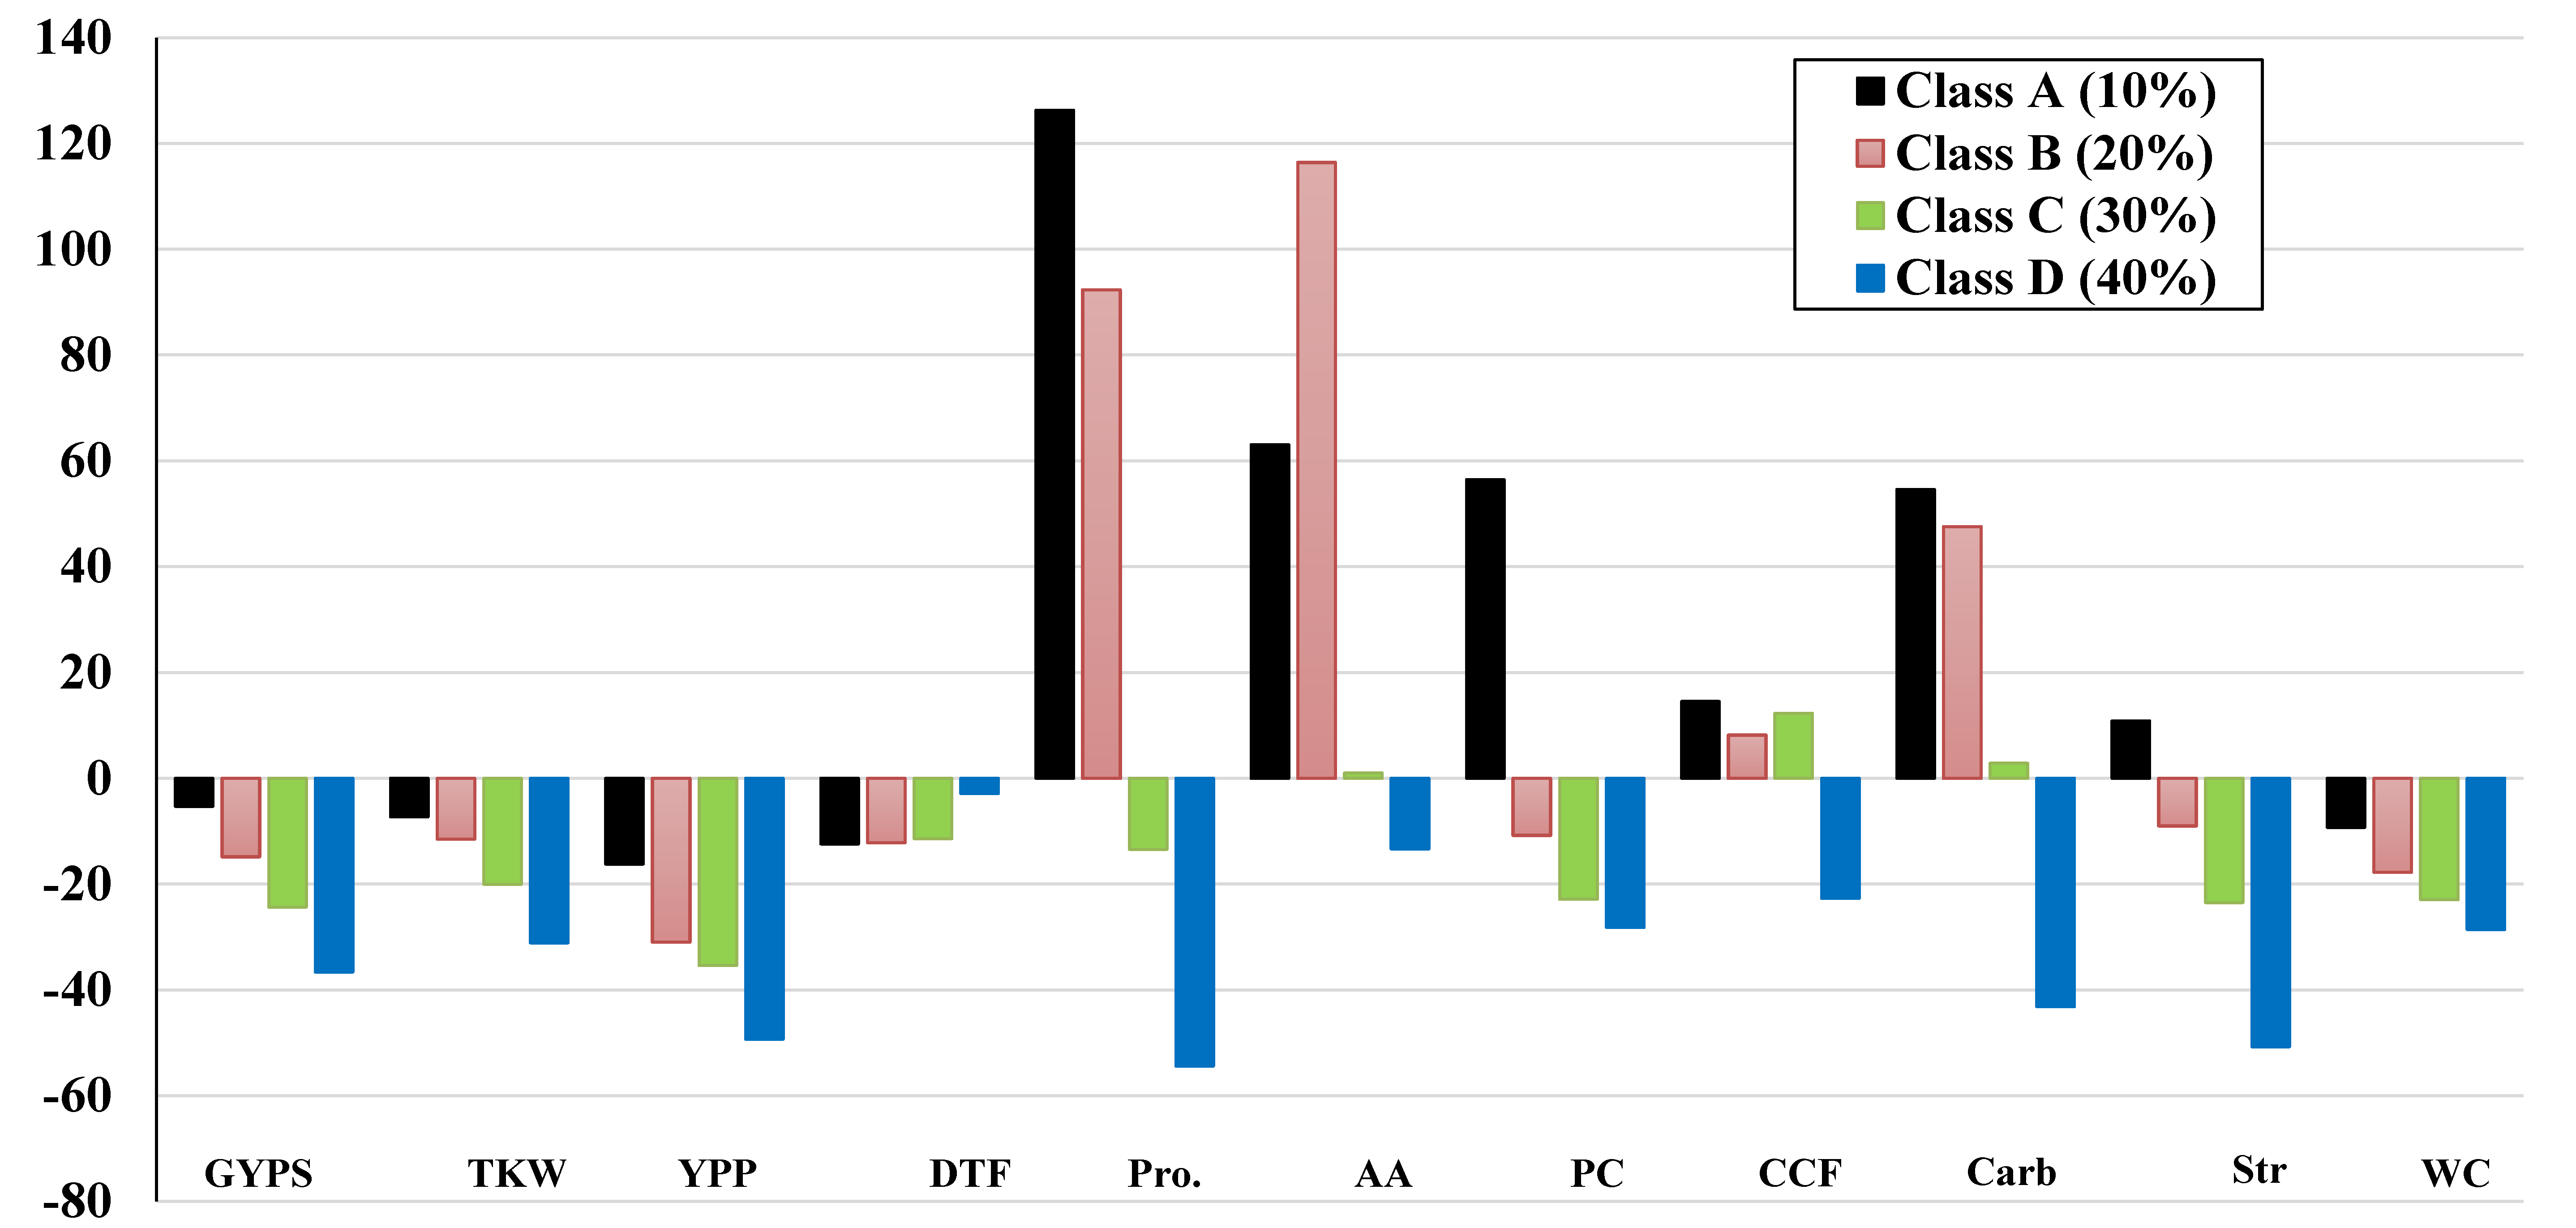
3.5. Percentage Changes and Classification of the Genotypes into Four Classes

The reduction in GYPS under heat stress relative to control was found to be genotype-dependent. Therefore, based on the percentage reduction in the GYPS, the 60 genotypes were classified into four classes, namely A, B, C, and D (Table 3).
The next section shows a comparative presentation of the percentage changes in each trait among the four classes. The reduction in GYPS of heat-stressed plants relative to control plants was ≤10%, ≤20%, ≤30%, and ≤40% for classes A, B, C, and D, respectively (Table 3). The 60 genotypes were distributed into the four classes, with 30, 13, 14, and 3 genotypes in classes A, B, C, and D, respectively. The average reduction in GYPS of the four classes was −5.97%, −13.88%, −24.07, and −36.63% for A, B, C, and D, respectively (Table 3). Accordingly, genotypes in class A included the most tolerant genotypes; B and C were intermediate, while D is the most sensitive class.
In the four classes, yield-related traits substantially decreased under heat stress (Figure 2a,b). Noteworthily, class A had the lowest reduction in all parameters except for DTF. Class A had the highest reduction in DTF, which is a positive sign for avoiding heat stress by maturing earlier than the other classes (Table 3). Contrarily, the physiological traits such as CCF, WC, Str, Carb, AA, PC, and Pro did not show a regular pattern in the four classes. For example, in class A, there was a clear increase in all physiological traits under heat stress except for leaf water content. In contrast, all of them remarkably decreased in class D (Table 3). However, for the remaining classes, the physiological traits changed inconsistently in each class, as some parameters increased, and the others decreased (Table 3).
A dramatic increase in Pro, AA, PC, CCF, SC, and Str percentage in class A of heat-stressed plants compared to control was observed compared to the other classes (Figure 5). The data represented in Figure 5 also showed that protein content and starch content were strictly elevated in class A. However, some parameters increased in the other classes—the proline, amino acid, and soluble carbohydrate contents of stressed plants were increased for classe B, and surprisingly, amino acids were higher in class B than in class A.

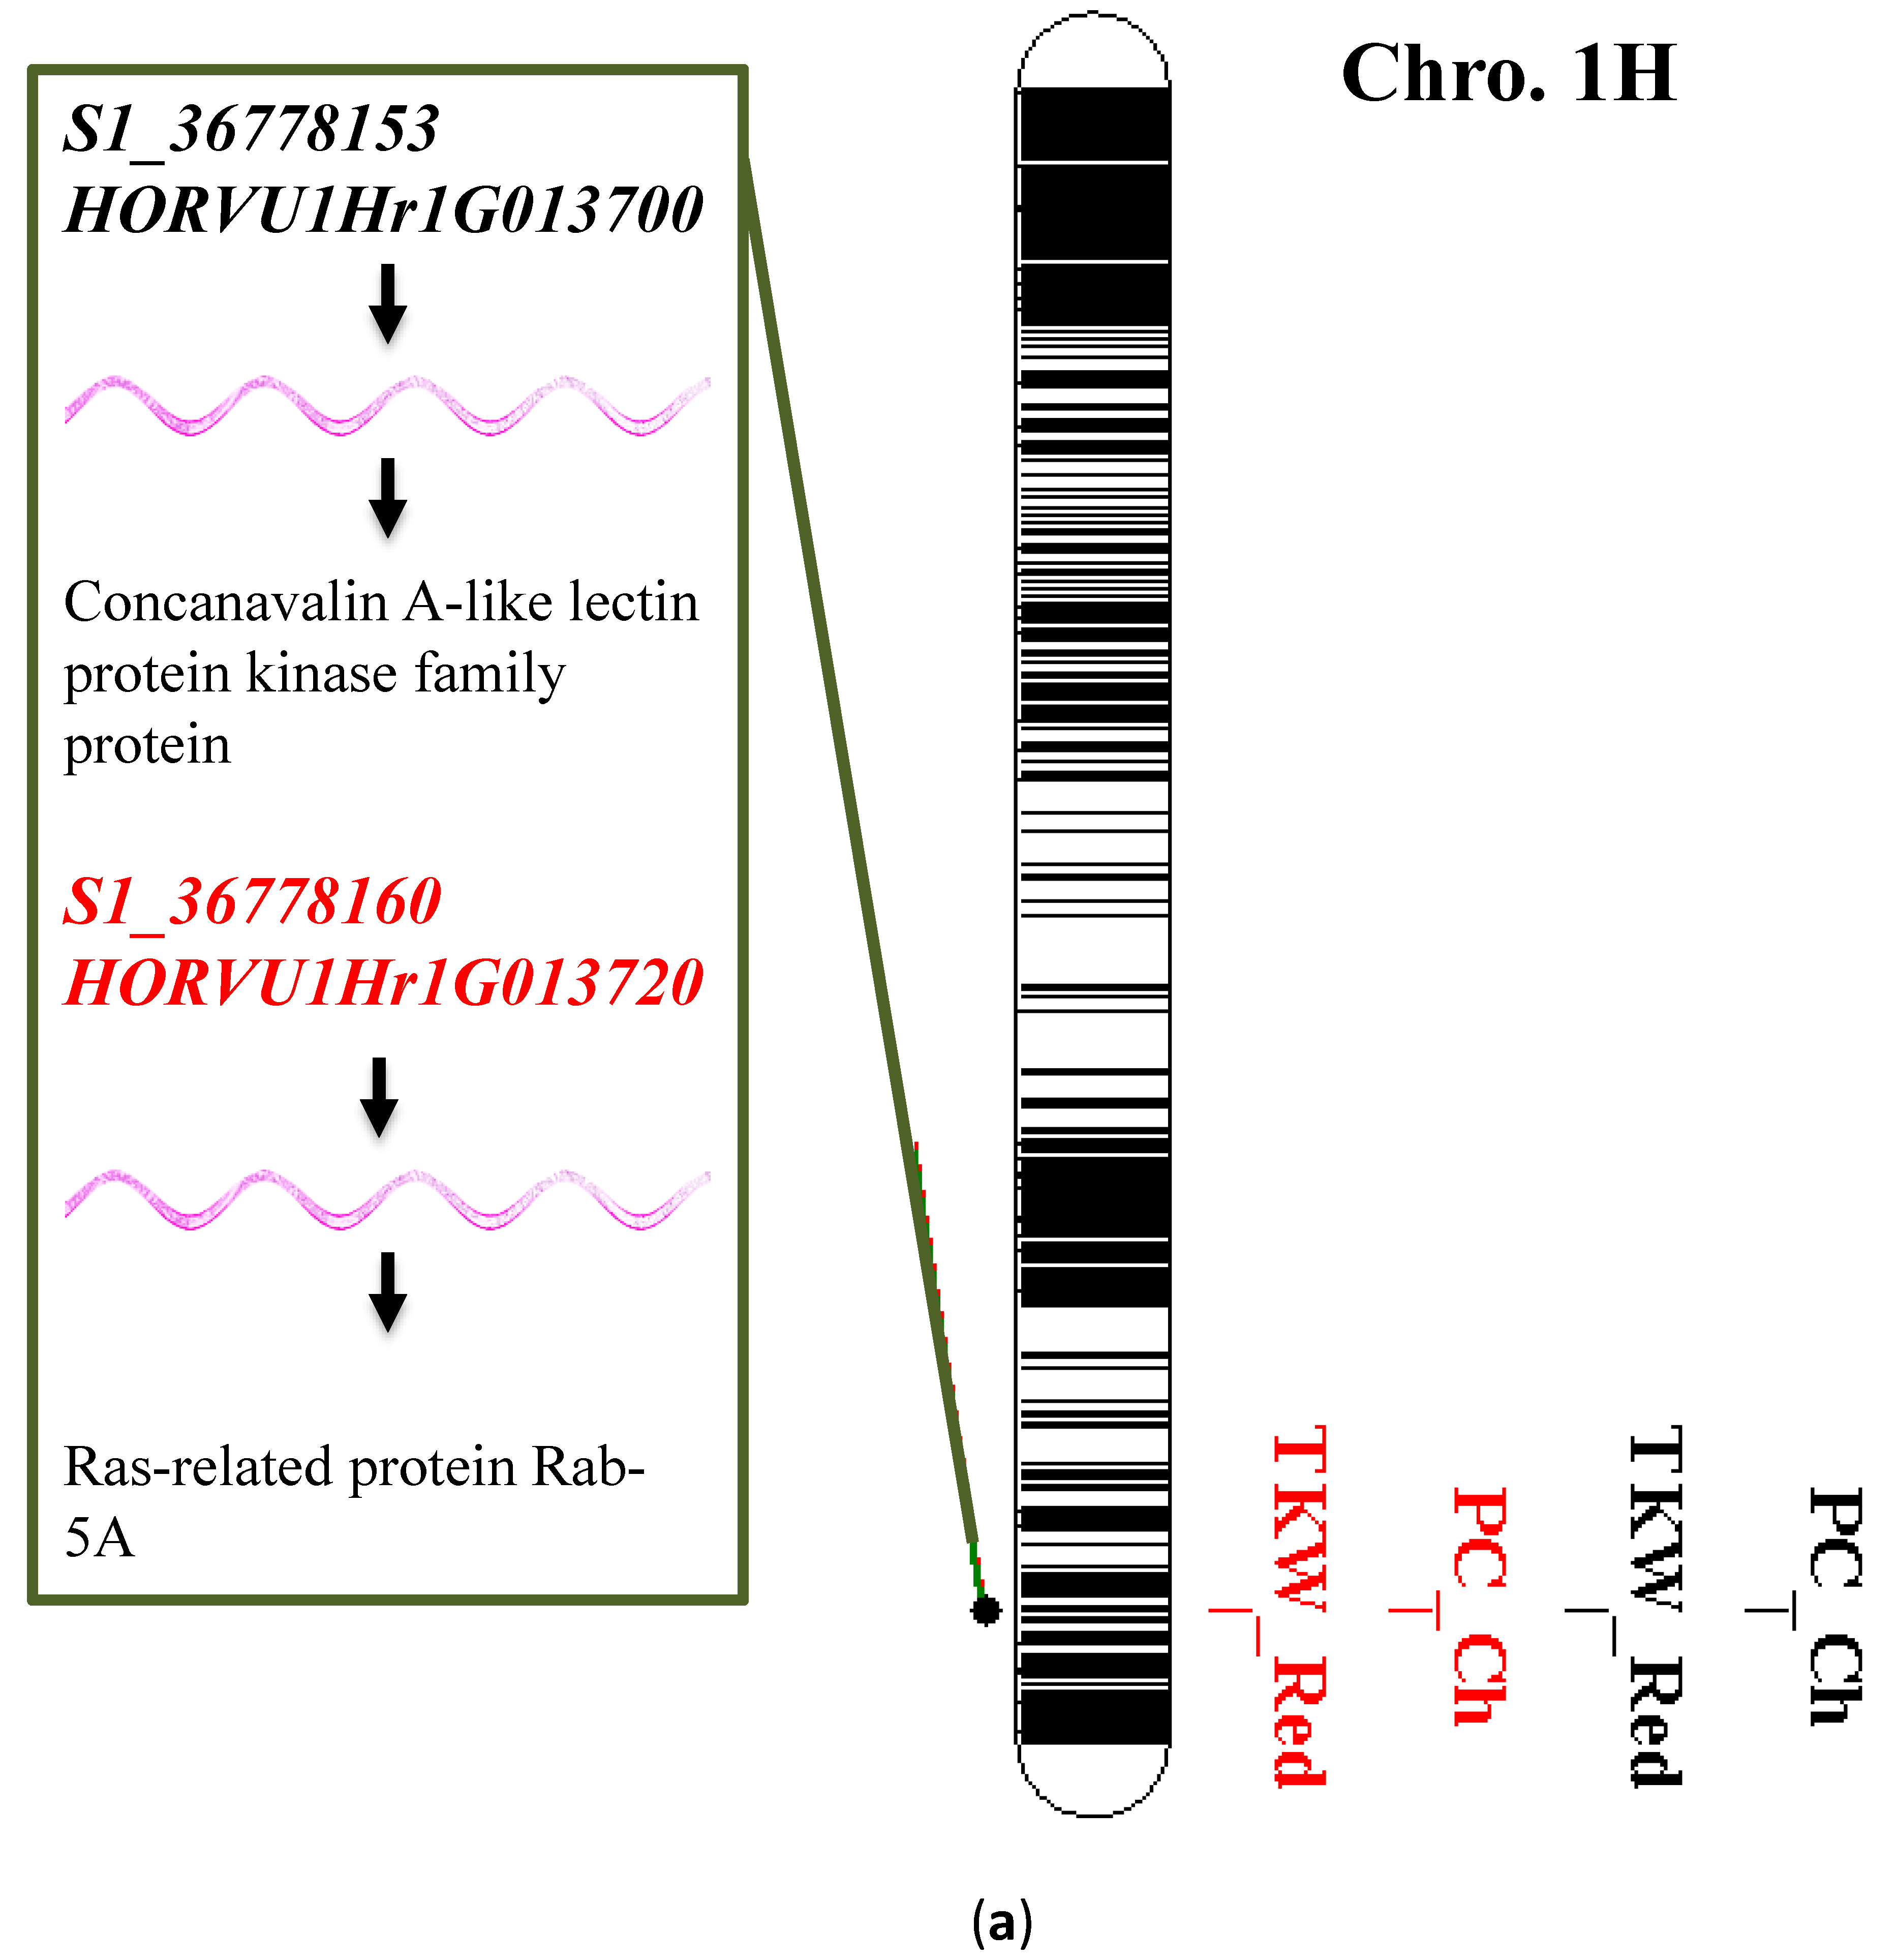
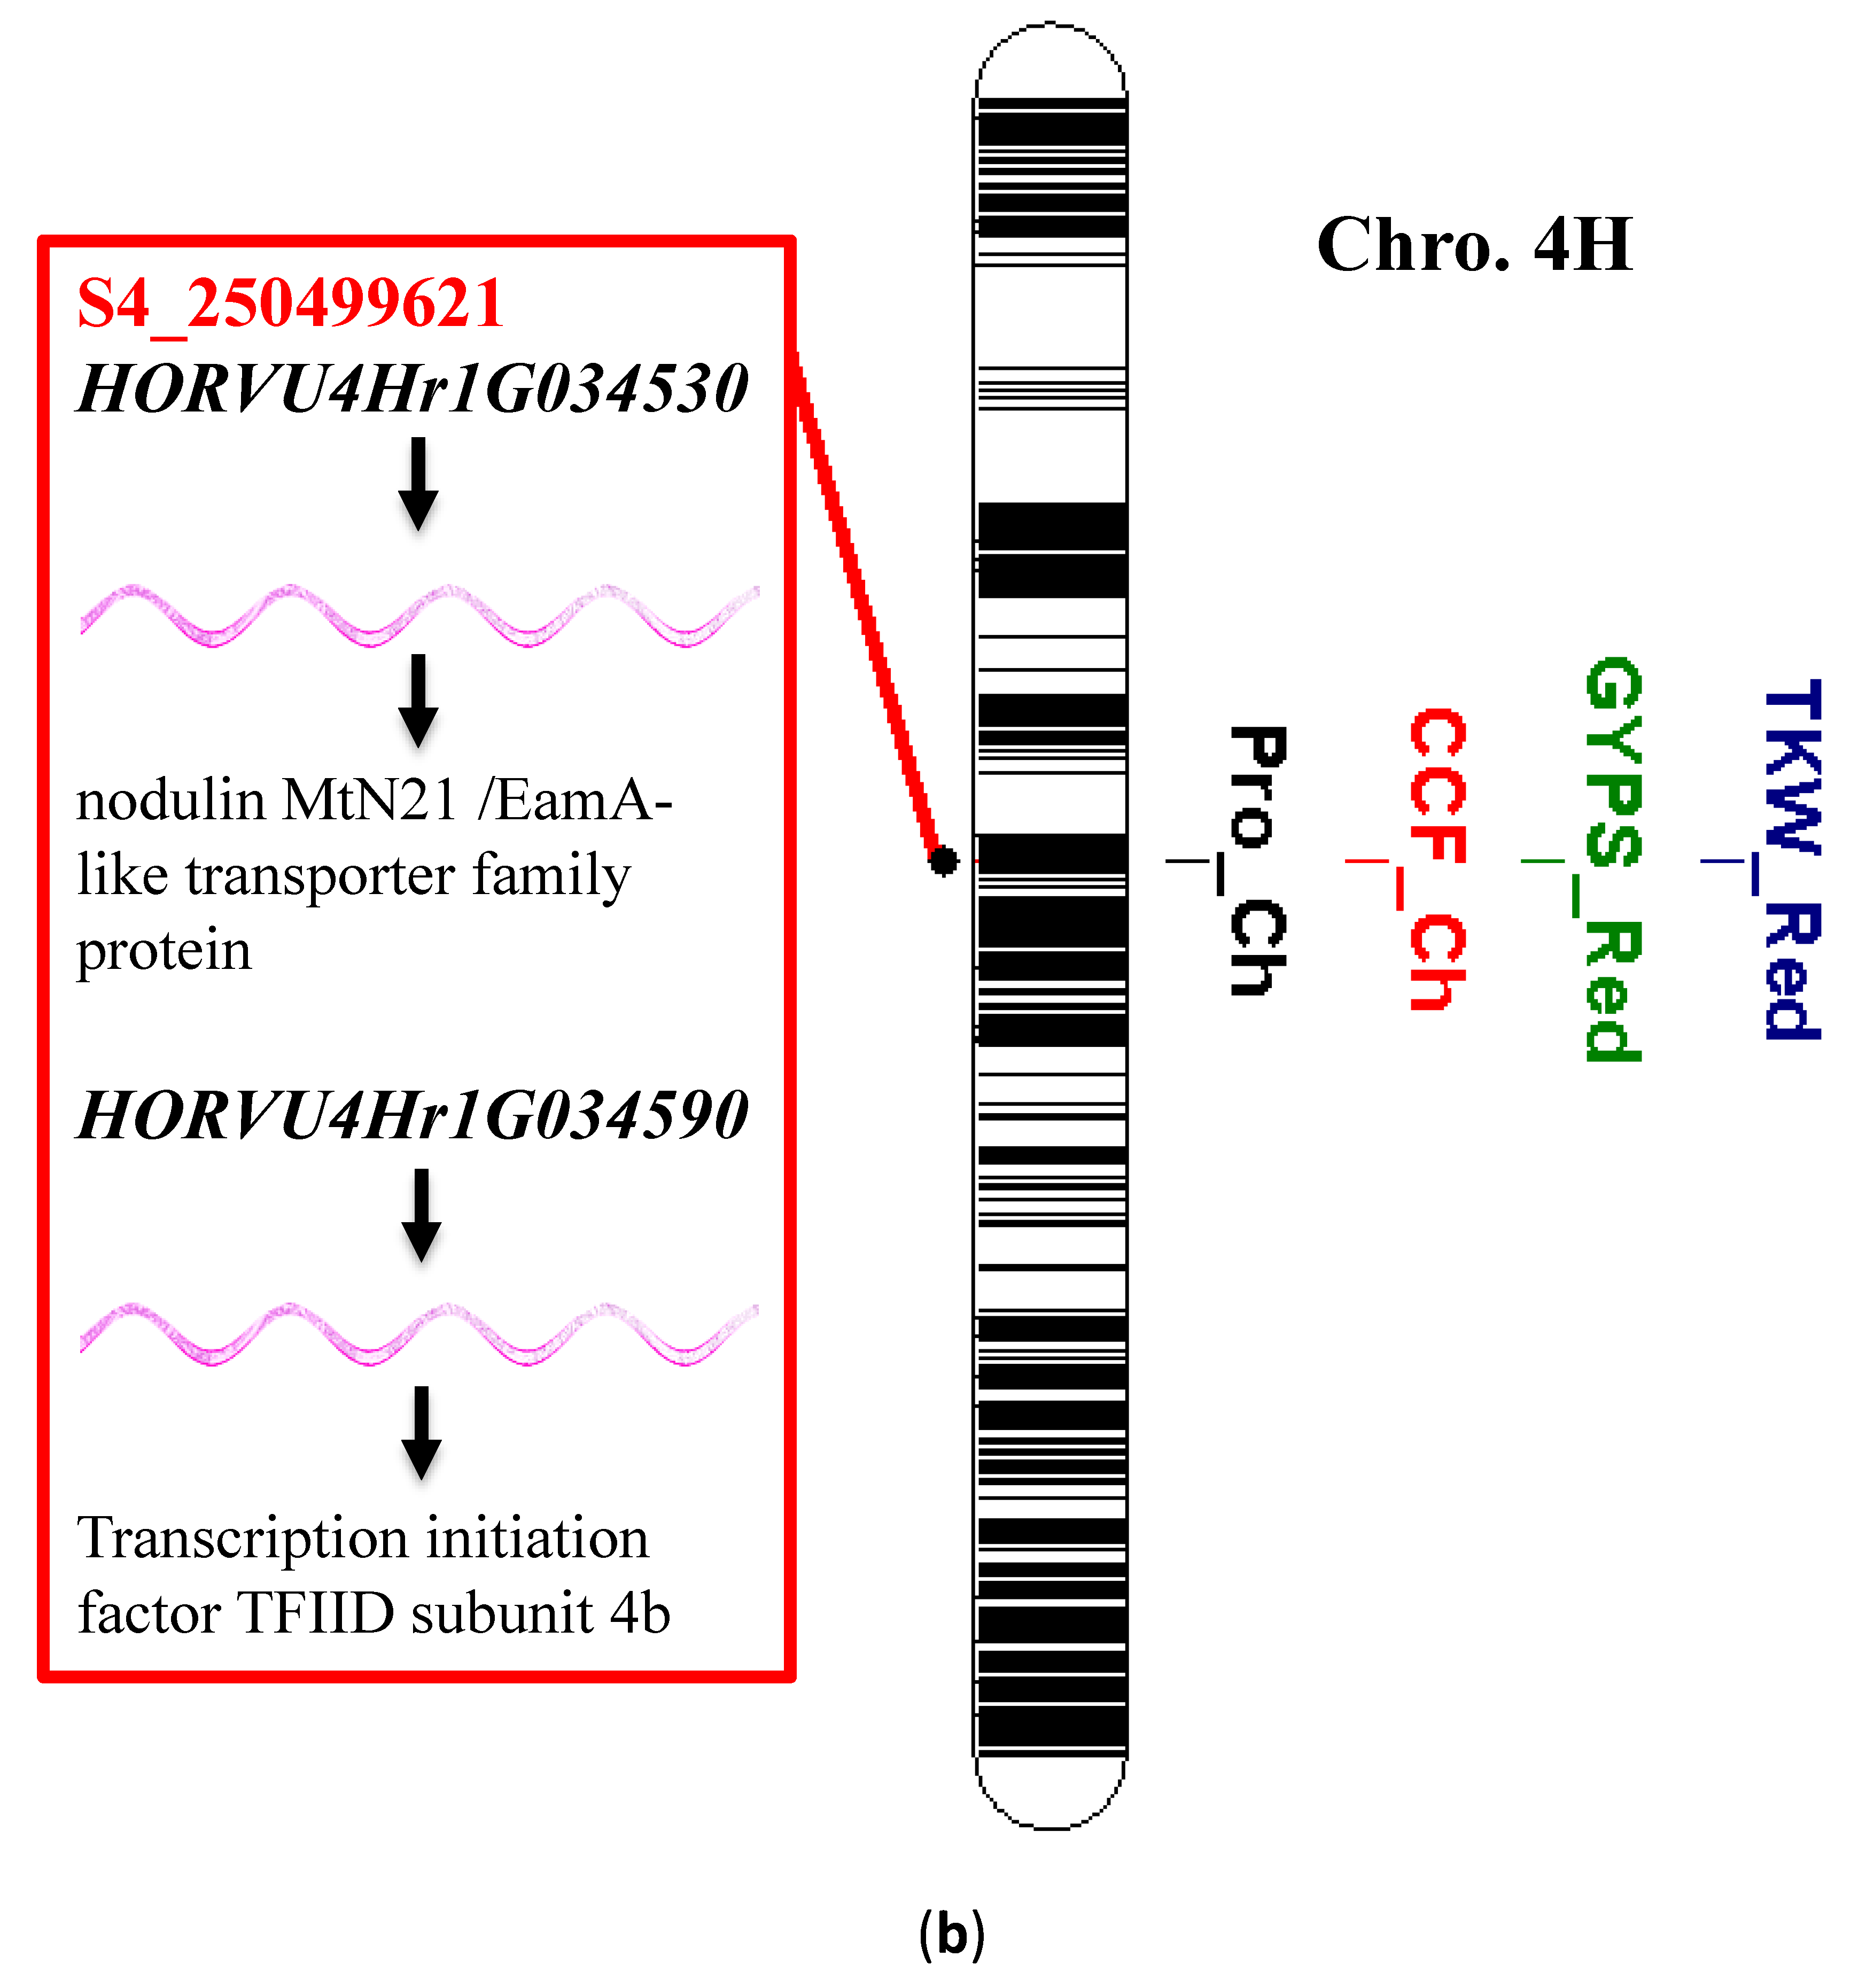
3.6. Single Marker Analysis and Gene Annotation

The single-marker analysis (SMA) resulted in 88 significant associations between the genetic markers (SNPs, i.e., single marker polymorphisms) and the traits of interest (Table S2). The significant SNPs are distributed across the seven chromosomes of barley: 1H (10), 2H (16), 3H (11), 4H (17), 5H (13), 6H (16), and 7H (5). The highest number of significant SNPs for a trait was for changes in PC, with 32 SNP markers, and the lowest number was one SNP marker each for a reduction in TKW, reduction in GYPS, and changes in AA. Among the 88 detected significant SNPs, three markers were associated with the variation in more than one trait in a pleiotropic manner. Interestingly, on 1H, two SNP markers, S1_36778153 and S1_36778160, controlled the variation of the changes in PC and reduction in TKW under heat stress (Table 4 and Figure 6a). Additionally, the marker S4_250499621 that was mapped on 4H at 250499621pb controlled the changes in Pro, GYPS, CCF, and TKW (Figure 6b).
Gene annotation was done only for the aforementioned three markers that showed a pleiotropic effect and resided on chromosomes 1H and 4H. The two S1_36778153 and S1_36778160 located on chromosome 1H were found to be annotated to two genes; HORVU1Hr1G013700 which encodes to concanavalin A-like lectin protein kinase family protein and HORVU1Hr1G013720 which encodes Ras-related protein Rab-5A. The marker S4_250499621 was positioned with genomic regions that have two candidate genes, HORVU4Hr1G034530, which encodes to nodulin MtN21/EamA-like transporter family protein, and HORVU4Hr1G034590, which encodes to transcription initiation factor TFIID subunit 4b. Generally, several genes belonging to different functional protein groups were identified in the regions flanking the respective markers. The highest number of genes was mapped close to the two markers located on 1H. The genes on 1H had been annotated with proteins with various molecular and biological functions that are directly related to plant thermo-tolerance, such as ion binding proteins, lyases, ion and sugar transferases, hydrolases, protein kinases, chaperones, and oxidoreductases (Table 4). Of these, the gene HORVU1Hr1G013360 encodes for a hexosyltransferase that transfers the hexose monosaccharides such as glucose and fructose. Additionally, the gene HORVU1Hr1G013450 that encodes Alpha, alpha-trehalose-phosphate synthase, was mapped in the same region. This gene is involved in the biosynthesis of the trehalose, which is a non-reducing disaccharide. It acts as an energy source, osmolyte, or protein/membrane protectant. In addition, the gene HORVU1Hr1G013470 was annotated for Delta-aminolevulinic acid dehydratase that catalyzes the chlorophyll biosynthesis. Moreover, the gene HORVU1Hr1G013480, annotated for sugar transporter 1, is involved in sugar transport. Another important two genes on 1H are HORVU1Hr1G013210 and HORVU1Hr1G013580, which encode IQ-domain 2 and importin subunit beta-1, respectively (Table 4).
Likewise, on 4H, the genes encode different protein types that have several functions, such as developmental proteins, transmembrane binding proteins, lipases, and ligases. Of these, the gene HORVU4Hr1G034360 encodes the nuclear transcription factor Y subunit C-3 (NF-YC), which regulates the transcription of flowering genes. Another gene on 4H is HORVU4Hr1G034650, which encodes the protein ABERRANT POLLEN TRANSMISSION 1, which is involved in pollen tube development. The third gene on 4H is HORVU4Hr1G034750, which encodes U4/U6 small nuclear ribonucleoprotein PRP4-like protein, which is involved in embryo development (Table 4). A full description of all annotated genes on 1H and 4H was showed in Table S3.

4. Discussion

4.1. Yield-Related and Physiological Traits Variations

In this study, over the whole population, the heat stress at pre-anthesis decreased all yield-related traits, whilst for physiological traits, there was no clear trend, as some traits increased and others decreased (Figure 2a,b). The genotypic variations for most of the physiological traits were larger under heat stress than under control. This finding suggests that this collection possesses sufficient genetic plasticity to cope with the fluctuations of heat stress that plants are exposed to and highlighted the adaptability of these genotypes.
The PCA revealed that GYPS contributes the major portion of the variation in the traits that have been grouped in the biplot dimension 1. This result is not surprising as grain yield is the main target of breeding programs. Thus, in the current study, GYPS was used to classify the genotypes into four classes based on the percentage reduction in GYPS due to heat stress. The four classes ranged from class A, which was the most heat-tolerant, to class D, which is the most heat-sensitive (Table 3). The spikes in class D had higher levels of floret sterility, which may explain their high sensitivity to heat stress. Sterility could be caused by heat sensitivity in anthers and pollen rather than in ovules. In barley, heat stress decreased grain yield by 69.5% [38]. The authors stated that this reduction was attributed to the increases in floret sterility by 20.5% [38]. Similarly, under high temperature (≥30 °C), lentil (Lens culinaris Medik) plants produced defective pollen [39]. In cereals such as maize and rice, heat stress caused several deleterious effects, including pollen desiccation, poor pollen germination, poor anther dehiscence, and shorter pollen tubes, which resulted in the reduction in grains per ear or panicle and subsequently grain yield [7,40]. Even if the anther were not affected, heat stress influences meiosis, fertilization, and the growth of the fertilized embryo, ultimately causing a noticeable reduction in grain yield [41]. Supporting the earlier research, our study, using the single-marker analysis (SMA) and gene annotation analysis, identified several genes involved in cell division, pollen tube development, and membrane stability under heat stress (Table 4); their functions will be discussed in details later.
In our study, the plants at the grain filling stage were exposed to high day temperatures but also heat waves (Figure S1). These temperature fluctuations hastened grain filling by shortening the time to maturity, eventually resulting in poor grain quality and a reduction in grain yield [42]. High temperatures speed up rather than postpone the onset of anthesis, which switches on the reproductive stage before the accumulation of sufficient resources to later help fill the grain [43]. This conclusion is supported by the negative and significant correlations between the percentage changes in DTF with the changes in Str and Pro with r = −0.35** and r = −0.27*, respectively (Figure 4c).
Moreover, the reduction in accumulated reserves under heat stress may occur due to the inhibition of growth-related metabolism involving numerous enzymes and hormones [44]. This finding suggests that heat stress strongly inhibited the resource accumulation in the grains of the genotypes that belong to class D, compared to the genotypes of category A that had the lowest decline in all yield-related traits.
Most of the physiological traits increased under heat stress especially in class A, whilst class D showed a reduction in all these traits. For example, classes A, B, and C exhibited an increment in chlorophyll content during flowering. The changes in CCF were significantly and positively correlated with GYPS and YPP (Figure 4c), indicating that chlorophyll content is important for grain filling and subsequently to yield-related traits. Our results agree with previous research in chickpea (Cicer arietinum L.), where a high photosynthetic rate positively and significantly correlated with yield-related traits [45], as in the case of class A in our study. It was noted that earlier heading in response to high temperature is profitable in the retention of more green leaves at anthesis, leading to increased evapotranspiration and a smaller reduction in wheat yield [46,47]. Furthermore, Lin et al. [48] found that in rice, chlorophyll composition and chlorophyll fluorescence were associated with the changes in grain yield. The reduction in chlorophyll content in group D might be attributed to the induction of chlorophyllase activity and reduction of the photosynthetic pigments by heat stress, hence causing less plant photosynthetic and respiratory activity [49].
Plant water status is important under heat stress conditions. Among all physiological traits, leaf WC is the single trait that declined in all classes, especially in class D (Figure 5). Retaining high water content under heat is essential for grain filling development, as demonstrated by positive significant correlations between the change in WC and all yield-related traits, namely GYPS and YPP (Figure 4c). Plant water loss under heat stress is greater during the day due to an increased transpiration rate, ultimately impairing important physiological processes in plants [42]. The reduction in leaf water content in our study might reduce assimilate transport from leaves to the developing grains, thereby reducing grain reserved assimilates. It has been demonstrated that heat stress may limit mobilization at the vascular (phloem) or enzymatic level, hence reducing the flow of sucrose to the developing seeds [8,50].
The grain development and filling are primarily associated with the translocation of sucrose, and precursors of proteins, fats, and minerals from the leaves to grains [51]. Thus, in our study, the content of grain metabolites of different classes could be associated with the content of carbohydrates, proteins, amino acids, and proline. In our study, in class A, both Str and Carb elevated under heat stress (Table 3 and Figure 5) and recording the lowest reduction in water content, suggesting that the genotypes in this group have a more efficient enzymatic machinery that keeps the levels of both metabolites balanced. This result agrees with the results of Sita et al. [39], who found that sucrose, imported from the leaves or synthesized in seeds, is metabolized into glucose and fructose; glucose enters into the starch formation through various enzymes in the seed. Several studies found that plants retaining high carbohydrate levels upon heat stress were more heat-tolerant [52]. However, both Str and Carb markedly decreased in class D, indicating that heat stress in some genotypes inhibited the starch biosynthesizing enzymes, as well as those of hexoses biosynthesis. Similarly, Makonya et al. [45] found that starch and carbohydrate contents have been successfully used to discriminate between the heat-tolerant and heat-sensitive genotypes of chickpea. Our conclusion concurs with the research of Wilhelm et al. [14], who demonstrated that the reduction in wheat grains by heat stress was associated with a decline in starch, protein, and oil contents, as well as the low activity of ADP glucose pyrophosphorylase, glucokinase, sucrose synthase, and soluble starch synthase. Nagarajan et al. [53] stated that heat-tolerant genotypes should have a better photosynthetic rate and seed setting under high temperature relative to the sensitive ones.
Overall, sugars are the most suitable source to energize most metabolic processes in plant cells. Additionally, they regulate other cellular responses to extracellular stimuli when they acted as osmotica to maintain cell turgidity or as a signal molecule. More likely, the reduction in WC decreased the reserves’ translocation, which diminished the grain reserve of Str and Carb by different magnitudes revealing class-dependency.
Of the nitrogenous metabolites in plants, the role of proline and protein content to resist abiotic stress has been intensively investigated. In our study, only class D showed a decrease in proline content under heat stress. Frances et al. [54] concluded that the accumulation of proline increased the grain yield by maintaining leaf water potential. Proline accumulation under heat stress increased protein stability and stabilized the structure of the membrane bilayer [50]. Thus, genotypes that maintain high proline content without yield penalty are very valuable for breeding programs [55]. The accumulation of proline, proteins, and sugars in plants under stresses like drought and high temperature is an effective mechanism for plants to survive under harsh conditions by maintaining cell turgidity [51]. Noteworthily, PC strictly increased in class A, indicating the importance of PC to tolerate heat stress. The reduction in PC in the remaining classes may be caused by the inhibition of protein biosynthesis enzymes [52]. This observation might explain the higher levels of AA in class B than in class A where reduction of PC could br in favor of AA accumulation.
Proline and protein accumulation conferred heat and drought tolerance in maize during flowering and reproductive stages [51]. Overaccumulation of soluble protein was found to be associated with heat tolerance in tomato (Solanum lycopersicum L.) and wheat [56,57]. These results show the interdependency of the physiological and yield-related traits to ameliorate the deleterious effects of heat stress. This conclusion can be explained by the positive and significant correlations between the changes in Pro with the changes in yield-related parameters. Pro positively and significantly correlated with GYPS and YPP, with r = 0.58*** and r = 0.43***, respectively. Noteworthily, the changes in all physiological traits (except AA) had positive and significant correlations with GYPS.
The significant positive correlations among the changes in GYPS with those of the physiological traits indicate that the increment of these traits may account for the increase in GYPS. Taken together, these traits are reasonable selection tools to select for heat tolerance; as the most tolerant, class A exhibited an increase in all of these traits relative to the remaining classes.
Classifying the elite barley genotypes based on a reduction in GYPS and studying the physiological changes in each group facilitated our understanding of the physiological changes that the plant made to alleviate the effect of heat stress. This information will undoubtedly help plant breeders and agronomist to select genotypes which can increase proline content, chlorophyll content, starch content, and carbohydrate content, and hence lessen the reduction in leaf water content and grain weight. Selecting such genotypes is very important to be integrated into the breeding program to produce barley cultivars with suitable physiological parameters that alleviate the heat stress effect in barley.

4.2. Single Marker Analysis and Candidate Genes

Identifying genes and QTL controlling physiological traits under heat stress are needed in breeding and genetics programs to accelerate the genetic improvement of heat tolerance. Several SNPs showed significant associations with traits of interest. Among them, three SNPs—two on 1H and one on 4H—exhibited a pleiotropic effect, i.e., they regulate the variation in multiple traits at a time (Table 4). The gene annotation in the regions flanking these markers resulted in the identification of numerous genes that code different functional proteins (Table S3). Most of these genes reside on 1H. Of these, the gene HORVU1Hr1G013210 encodes IQ-domain 2, that acts as a Calmodulin-binding (calcium-modulated) protein. Calmodulin is known as a membrane protein that is directly involved in the plant response to external stimuli, especially heat and hydration/dehydration status [58]. In Arabidopsis thaliana L., calmodulin was found to be involved in heat-tolerance by regulating the reactive oxygen species’ homeostasis. The calmodulin-related genes were expressed at higher levels in tolerant genotypes than in sensitive ones [59]. Additionally, the gene HORVU1Hr1G013450 was annotated as Alpha, alpha-trehalose-phosphate synthase, which regulates the biosynthesis of trehalose. Trehalose (a disaccharide) is a precursor of starch that helps plants to withstand abiotic stressors such as heat stress. Trehalose accumulation conferred tolerance against several abiotic stressors in rice by promoting carbohydrate accumulation and improving the photosynthetic rate [60]. Trehalose was found to act as a positive signal in starch biosynthesis and embryo development in Arabidopsis [61]. Furthermore, trehalose accumulation conferred heat tolerance in transgenic tomato (Solanum lycopersicum L.) overexpressing the Escherichia coli trehalose-6-phosphate synthase/phosphatase (TPSP) and triggered the expression of heat stress-responsive genes [62]. In barley grains, two trehalose phosphate synthase genes, HvTPS1 and HvTPS2, were upregulated under heat stress without a negative effect on grain filling [20]. The authors concluded that the induction of trehalose biosynthesis in grains under heat stress is a pivotal marker to select for heat tolerance in barley. In maize, the expression of trehalose-6-phosphate phosphatase increased grain yield by channeling more reserves to grain filling at the expense of stem reserves [63]. In addition, on 1H, the gene HORVU1Hr1G013470 encodes Delta-aminolevulinic acid dehydratase. Its ortholog in Arabidopsis, AT1G44318, was found to be involved in chlorophyll biosynthesis. The silencing of this gene in citrus leaves resulted in a reduction in chlorophyll levels, starch, and sucrose [64]. These results indicate that this gene is crucial for chlorophyll biosynthesis, and subsequently, starch and sucrose biosynthesis, which could explain our results that CCF is positively and significantly correlated with starch content (Figure 4a). Another important gene on 1H is HORVU1Hr1G013580, which was annotated as Importin subunit beta-1, which regulates protein transport. Its ortholog in Arabidopsis, AT5G53480, was found to be involved in protein transport and stomatal closure. The rice importin β1 has been found to be vital for pollen tube elongation, which is necessary for successful subsequent fertilization and embryo development [65]. This supports our conclusion about the role of floret sterility in reducing yield as a result of impairing pollen tube elongation.
To sum up, the genes on 1H are regulating different biological and molecular processes that are essential for heat tolerance in barley during flowering, grain filling, and seed set.
Among the genes that were identified on 4H, we will focus on the genes that code for proteins that are directly related to photosynthesis, pollen, and embryo development. Out of these, the gene HORVU4Hr1G034360 encodes nuclear transcription factor Y subunit C-3 (NF-YC), which regulates the transcription of genes that are involved in flowering and the positive regulation of photomorphogenesis. Sato et al. [66] found that the expression of these genes enhanced heat tolerance in Arabidopsis by regulating the expression of heat-shock factor A3 (HsfA3). Additionally, the transcription factor nuclear factor Y, subunit C4 (NF-YC) proteins modulated carbon and nitrogen partitioning between carbohydrate and protein biosynthesis [67]. The second gene on 4H is HORVU4Hr1G034650, which encodes protein ABERRANT POLLEN TRANSMISSION 1 (APT1). APT1 was found to be essential for membrane transport and pollen tube development in maize. The mutant (apt1) had a defective short, twisted pollen tube that resulted in poor fertilization [68]. The last gene on 4H is HORVU4Hr1G034750, annotated to U4/U6 small nuclear ribonucleoprotein PRP4-like protein (snRNP) that regulates the embryo sac–egg cell differentiation.

5. Conclusions

Our study combined information on the changes in grain yield and important physiological traits to better understand heat stress tolerance in barley. Moreover, integrating the advances in DNA technology using genotyping-by-sequencing facilitated suggesting the potential candidate genes affecting heat stress tolerance in barley. Heat stress significantly reduced all yield-related traits, whilst many physiological traits increased. Grain yield per spike (GYPS), starch content (Str), protein content (PC), and proline content (Pro) discriminated the respective genotypes into four different classes from highly heat tolerant to very heat sensitive. Maintaining leaf water content, chlorophyll content stability, as well as starch rather than soluble carbohydrates content of grains are suitable selecting traits for heat tolerance. Chromosomes 1H and 4H harbor the most effective alleles/genes that may regulate some of the most important traits such as protein content and grain yield per spike. Our results provide a solid base to select for heat tolerance in barley using yield, physiological, and genetic parameters.

Supplementary Materials

The following are available online at https://www.mdpi.com/2073-4395/10/11/1730/s1, Figure S1: Daily temperatures, Maximum (Max), minimum (Min); (a) March and April 2015, (b) March and April 2016 at the experimental station of Assiut University; Figure S2: Histogram shows the distribution of the traits under control and pre-anthesis heat in barley; (a) Yield per plot (YPP), (b) Thousand kernel weight (TKW), (c) Day to flowering (DTF), (d) Chlorophyll content at flowering, (e) Water content (WC), (f) Protein content (PC), (g) Carbohydrates (Carb), (h) Starch (Str) and (i) Proline (Pro). Table S1: List of barley genotypes used in this study; Table S2: List of all significant SNPs associated with the traits in barley under control and heat stress during anthesis and seed set; Table S3: Full description, annotation, and orthologs of the candidate genes on chromosomes 1H and 4H associated with the traits in barley under control and heat during flowering and seed set. The potential genes on each chromosome were considered in the discussion section are highlighted yellow.

Author Contributions

Conceptualization, M.F.A.D., A.A., and A.S.; methodology, M.F.A.D. and A.S.; software, Y.S.M. and A.S., validation, Y.S.M., A.S., M.F.A.D., and A.A.; formal analysis, M.F.A.D., Y.S.M. and A.S.; investigation, M.F.A.D., A.S., Y.S.M. and A.A.; visualization, Y.S.M. and A.S.; resources, M.F.A.D. and A.S.; writing—original draft preparation, M.F.A.D., Y.S.M., and A.S.; writing—review and editing, M.F.A.D., Y.S.M., A.S., and P.S.B. All authors have read and agreed to the published version of the manuscript.

Funding

There is no external funding.

Acknowledgments

The authors would like to thank all who contributed to this work. We thank Ammar Elakhdar, Agricultural Research Center, Field Crops Research Institute, Gama St, Giza, Egypt, for providing seeds of all genotypes.

Conflicts of Interest

The authors declare no conflict of interest.

References

  1. Hasanuzzaman, M.; Nahar, K.; Alam, M.M.; Roychowdhury, R.; Fujita, M. Physiological, biochemical, and molecular mechanisms of heat stress tolerance in plants. Int. J. Mol. Sci. 2013, 14, 9643–9684. [Google Scholar] [CrossRef] [PubMed]
  2. Lobell, D.B.; Schlenker, W.; Costa-Roberts, J. Climate trends and global crop production since 1980. Science 2011, 333, 616–620. [Google Scholar] [CrossRef] [PubMed] [Green Version]
  3. Ortiz, R.; Braun, H.J.; Crossa, J.; Crouch, J.H.; Davenport, G.; Dixon, J.; Dreisigacker, S.; Duveiller, E.; He, Z.; Huerta, J.; et al. Wheat genetic resources enhancement by the International Maize and Wheat Improvement Center (CIMMYT). Genet. Resour. Crop Evol. 2008, 55, 1095–1140. [Google Scholar] [CrossRef]
  4. Weichert, H.; Högy, P.; Mora-Ramirez, I.; Fuchs, J.; Eggert, K.; Koehler, P.; Weschke, W.; Fangmeier, A.; Weber, H. Grain yield and quality responses of wheat expressing a barley sucrose transporter to combined climate change factors. J. Exp. Bot. 2017, 68, 5511–5525. [Google Scholar] [CrossRef] [Green Version]
  5. Christensen, J.H.; Christensen, O.B. A summary of the PRUDENCE model projections of changes in European climate by the end of this century. Springer 2007, 81, 7–30. [Google Scholar] [CrossRef]
  6. Fang, S.; Cammarano, D.; Zhou, G.; Tan, K.; Ren, S. Effects of increased day and night temperature with supplemental infrared heating on winter wheat growth in North China. Eur. J. Agron. 2015, 64, 67–77. [Google Scholar] [CrossRef]
  7. Fahad, S.; Hussain, S.; Saud, S.; Khan, F.; Hassan, S.; Amanullah Nasim, W.; Arif, M.; Wang, F.; Huang, J. Exogenously Applied Plant Growth Regulators Affect Heat-Stressed Rice Pollens. J. Agron. Crop Sci. 2016, 202, 139–150. [Google Scholar] [CrossRef]
  8. Wahid, A.; Gelani, S.; Ashraf, M.; Foolad, M.R. Heat tolerance in plants: An overview. Environ. Exp. Bot. 2007, 61, 199–223. [Google Scholar] [CrossRef]
  9. Bita, C.E.; Gerats, T. Plant tolerance to high temperature in a changing environment: Scientific fundamentals and production of heat stress-tolerant crops. Front. Plant Sci. 2013, 4, 273. [Google Scholar] [CrossRef] [Green Version]
  10. Sekhon, H.S.; Singh, G.; Sharma, P.; Bains, T.S. Water Use Efficiency Under Stress Environments. In Climate Change and Management of Cool Season Grain Legume Crops; Yadav, S.S., Redden, R., Eds.; Springer: Dordrecht, The Netherlands, 2010; pp. 207–227. ISBN 978-90-481-3709-1. [Google Scholar]
  11. Li, H.; Wang, X.M.; Chen, L.; Ahammed, G.J.; Xia, X.J.; Shi, K.; Considine, M.J.; Yu, J.Q.; Zhou, Y.H. Growth temperature-induced changes in biomass accumulation, photosynthesis and glutathione redox homeostasis as influenced by hydrogen peroxide in cucumber. Plant Physiol. Biochem. 2013, 71, 1–10. [Google Scholar] [CrossRef]
  12. Mathur, S.; Agrawal, D.; Jajoo, A. Photosynthesis: Response to high temperature stress. J. Photochem. Photobiol. B Biol. 2014, 137, 116–126. [Google Scholar] [CrossRef]
  13. Howarth, C.J. Genetic improvements of tolerance to high temperature. In Abiotic Stresses: Plant Resistance through Breeding and Molecular Approaches; Ashraf, M., Harris, P.J.C., Eds.; Haworth Press Inc.: New York, NY, USA, 2005; pp. 277–300. [Google Scholar]
  14. Wilhelm, E.P.; Mullen, R.E.; Keeling, P.L.; Singletary, G.W. Heat Stress during Grain Filling in Maize: Effects on Kernel Growth and Metabolism. Crop Sci. 1999, 39, 1733–1741. [Google Scholar] [CrossRef]
  15. Maestri, E.; Klueva, N.; Perrotta, C.; Gulli, M.; Nguyen, H.T.; Marmiroli, N. Molecular genetics of heat tolerance and heat shock proteins in cereals. Plant Mol. Biol. 2002, 48, 667–681. [Google Scholar] [CrossRef]
  16. Kishor, P.K.; Sangam, S.; Amrutha, R.N.; Laxmi, P.S.; Naidu, K.R.; Rao, K.S.; Sreenivasulu, N. Regulation of proline biosynthesis, degradation, uptake and transport in higher plants: Its implications in plant growth and abiotic stress tolerance. Curr. Sci. 2005, 88, 424–438. [Google Scholar] [CrossRef]
  17. Zhang, J.; Li, D.M.; Gao, Y.; Yu, B.; Xia, C.X.; Bai, J.G. Pretreatment with 5-aminolevulinic acid mitigates heat stress of cucumber leaves. Biol. Plant. 2012, 56, 780–784. [Google Scholar] [CrossRef]
  18. Ehlers, J.D.; Hall, A.E. Heat tolerance of contrasting cowpea lines in short and long days. Field Crop. Res. 1998, 55, 11–21. [Google Scholar] [CrossRef]
  19. Gous, P.W.; Hickey, L.; Christopher, J.T.; Franckowiak, J.; Fox, G.P. Discovery of QTL for stay-green and heat-stress in barley (Hordeum vulgare) grown under simulated abiotic stress conditions. Euphytica 2016, 207, 305–317. [Google Scholar] [CrossRef]
  20. Mangelsen, E.; Kilian, J.; Harter, K.; Jansson, C.; Wanke, D.; Sundberg, E. Transcriptome analysis of high-temperature stress in developing barley caryopses: Early stress responses and effects on storage compound biosynthesis. Mol. Plant 2011, 4, 97–115. [Google Scholar] [CrossRef]
  21. Templer, S.E.; Ammon, A.; Pscheidt, D.; Ciobotea, O.; Schuy, C.; McCollum, C.; Sonnewald, U.; Hanemann, A.; Förster, J.; Ordon, F.; et al. Metabolite profiling of barley flag leaves under drought and combined heat and drought stress reveals metabolic QTLs for metabolites associated with antioxidant defense. J. Exp. Bot. 2017, 68, 1697–1713. [Google Scholar] [CrossRef] [Green Version]
  22. Elakhdar, A.; EL-Sattar, M.A.; Amer, K.; Rady, A.; Kumamaru, T. Population structure and marker–trait association of salt tolerance in barley (Hordeum vulgare L.). Comptes Rendus Biol. 2016, 339, 454–461. [Google Scholar] [CrossRef]
  23. Sallam, A.; Amro, A.; EL-Akhdar, A.; Dawood, M.F.A.; Kumamaru, T.; Stephen Baenziger, P. Genetic diversity and genetic variation in morpho-physiological traits to improve heat tolerance in Spring barley. Mol. Biol. Rep. 2018, 45, 2441–2453. [Google Scholar] [CrossRef]
  24. LOWRY, O.H.; ROSEBROUGH, N.J.; FARR, A.L.; RANDALL, R.J. Protein measurement with the Folin phenol reagent. J. Biol. Chem. 1951, 193, 265–275. [Google Scholar] [CrossRef] [PubMed]
  25. MOORE, S.; STEIN, W.H. Photometric ninhydrin method for use in the chromatography of amino acids. J. Biol. Chem. 1948, 176, 367–388. [Google Scholar]
  26. FALES, F.W. The assimilation and degradation of carbohydrates by yeast cells. J. Biol. Chem. 1951, 193, 113–124. [Google Scholar] [CrossRef] [PubMed]
  27. Schlegel, H.-G. Die Verwertung organischer Säuren durch Chlorella im Licht. Planta 1956, 47, 510–526. [Google Scholar] [CrossRef]
  28. Bates, L.S.; Waldren, R.P.; Teare, I.D. Rapid determination of free proline for water-stress studies. Plant Soil 1973, 39, 205–207. [Google Scholar] [CrossRef]
  29. Julkowska, M.M.; Saade, S.; Agarwal, G.; Gao, G.; Pailles, Y.; Morton, M.; Awlia, M.; Tester, M. MV app-multivariate analysis application for streamlined data analysis and curation. Plant Physiol. 2019, 180, 1261–1276. [Google Scholar] [CrossRef] [Green Version]
  30. Utz, H. PLABSTAT: A Computer Program for the Statistical Analysis of Plant Breeding Experiments; Institute of Plant Breeding, Seed Science and Population Genetics: Stuttgart, Germany, 2011. [Google Scholar]
  31. 3.5.1., R.D.C.T. A Language and Environment for Statistical Computing. R Found. Stat. Comput. 2018, 2. Available online: https://www.R-project.org (accessed on 5 November 2020).
  32. Poland, J.A.; Rife, T.W. Genotyping-by-Sequencing for Plant Breeding and Genetics. Plant Genome 2012, 5, 92–102. [Google Scholar] [CrossRef] [Green Version]
  33. Bradbury, P.J.; Zhang, Z.; Kroon, D.E.; Casstevens, T.M.; Ramdoss, Y.; Buckler, E.S. TASSEL: Software for association mapping of complex traits in diverse samples. Bioinformatics 2007, 23, 2633–2635. [Google Scholar] [CrossRef]
  34. Francis, D.; Merk, H.; Namuth-Covert, D. Introduction to Single Marker Analysis (SMA). 3–5. 2011. Available online: https://plant-breeding-genomics.extension.org/introduction-to-single-marker-analysis-sma/ (accessed on 30 August 2020).
  35. Mascher, M.; Gundlach, H.; Himmelbach, A.; Beier, S.; Twardziok, S.O.; Wicker, T.; Radchuk, V.; Dockter, C.; Hedley, P.E.; Russell, J.; et al. A chromosome conformation capture ordered sequence of the barley genome. Nature 2017, 544, 427–433. [Google Scholar] [CrossRef] [PubMed] [Green Version]
  36. Bayer, M.M.; Rapazote-Flores, P.; Ganal, M.; Hedley, P.E.; Macaulay, M.; Plieske, J.; Ramsay, L.; Russell, J.; Shaw, P.D.; Thomas, W.; et al. Development and evaluation of a barley 50k iSelect SNP array. Front. Plant Sci. 2017, 8. [Google Scholar] [CrossRef] [Green Version]
  37. Kinsella, R.J.; Kähäri, A.; Haider, S.; Zamora, J.; Proctor, G.; Spudich, G.; Almeida-King, J.; Staines, D.; Derwent, P.; Kerhornou, A.; et al. Ensembl BioMarts: A hub for data retrieval across taxonomic space. Database 2011, 2011. [Google Scholar] [CrossRef]
  38. Pathak, S.; Poudyal, C.; Ojha, B.R.; Marahatta, S. Evaluation of the effects of terminal heat stress on grain traits of barley (Hordeum vulgare L.) IN CHITWAN. Int. J. Agric. Environ. Res. 2017, 3, 2856–2869. [Google Scholar]
  39. Sita, K.; Sehgal, A.; Bhandari, K.; Kumar, J.; Kumar, S.; Singh, S.; Siddique, K.H.M.; Nayyar, H. Impact of heat stress during seed filling on seed quality and seed yield in lentil (Lens culinaris Medikus) genotypes. J. Sci. Food Agric. 2018, 98, 5134–5141. [Google Scholar] [CrossRef]
  40. Sinsawat, V.; Leipner, J.; Stamp, P.; Fracheboud, Y. Effect of heat stress on the photosynthetic apparatus in maize (Zea mays L.) grown at control or high temperature. Environ. Exp. Bot. 2004, 52, 123–129. [Google Scholar] [CrossRef]
  41. Camejo, D.; Rodríguez, P.; Morales, M.A.; Dell’Amico, J.M.; Torrecillas, A.; Alarcón, J.J. High temperature effects on photosynthetic activity of two tomato cultivars with different heat susceptibility. J. Plant Physiol. 2005, 162, 281–289. [Google Scholar] [CrossRef]
  42. Fahad, S.; Bajwa, A.A.; Nazir, U.; Anjum, S.A.; Farooq, A.; Zohaib, A.; Sadia, S.; Nasim, W.; Adkins, S.; Saud, S.; et al. Crop production under drought and heat stress: Plant responses and management options. Front. Plant Sci. 2017, 8. [Google Scholar] [CrossRef] [PubMed] [Green Version]
  43. Zinn, K.E.; Tunc-Ozdemir, M.; Harper, J.F. Temperature stress and plant sexual reproduction: Uncovering the weakest links. J. Exp. Bot. 2010, 61, 1959–1968. [Google Scholar] [CrossRef] [Green Version]
  44. Rollins, J.A.; Habte, E.; Templer, S.E.; Colby, T.; Schmidt, J.; Von Korff, M. Leaf proteome alterations in the context of physiological and morphological responses to drought and heat stress in barley (Hordeum vulgare L.). J. Exp. Bot. 2013, 64, 3201–3212. [Google Scholar] [CrossRef] [Green Version]
  45. Makonya, G.M.; Ogola, J.B.O.; Muthama Muasya, A.; Crespo, O.; Maseko, S.; Valentine, A.J.; Ottosen, C.O.; Rosenqvist, E.; Chimphango, S.B.M. Chlorophyll fluorescence and carbohydrate concentration as field selection traits for heat tolerant chickpea genotypes. Plant Physiol. Biochem. 2019, 141, 172–182. [Google Scholar] [CrossRef]
  46. Tewolde, H.; Fernandez, C.J.; Erickson, C.A. Wheat cultivars adapted to post-heading high temperature stress. J. Agron. Crop Sci. 2006, 192, 111–120. [Google Scholar] [CrossRef]
  47. Vadez, V.; Kholova, J.; Choudhary, S.; Zindy, P.; Terrier, M.; Krishnamurthy, L.; Kumar, P.R.; Turner, N.C. Responses to Increased Moisture Stress and Extremes: Whole Plant Response to Drought under Climate Change. In Crop Adaptation to Climate Change; Yadav, S.S., Redden, R., Hatfield, J.L., Lotze-Campen, H., Hall, A.E., Eds.; Wiley/Blackwell: Chichester, UK, 2011; pp. 186–197. ISBN 9780813820163. [Google Scholar]
  48. Lin, W.; Guo, X.; Pan, X.; Li, Z. Chlorophyll composition, chlorophyll fluorescence, and grain yield change in esl mutant rice. Int. J. Mol. Sci. 2018, 19, 2945. [Google Scholar] [CrossRef] [Green Version]
  49. Sharkey, T.D.; Zhang, R. High Temperature Effects on Electron and Proton Circuits of Photosynthesis. J. Integr. Plant Biol. 2010, 52, 712–722. [Google Scholar] [CrossRef] [PubMed]
  50. Mirzaei, M.; Pascovici, D.; Atwell, B.J.; Haynes, P.A. Differential regulation of aquaporins, small GTPases and V-ATPases proteins in rice leaves subjected to drought stress and recovery. Proteomics 2012, 12, 864–877. [Google Scholar] [CrossRef]
  51. Hussain, H.A.; Men, S.; Hussain, S.; Chen, Y.; Ali, S.; Zhang, S.; Zhang, K.; Li, Y.; Xu, Q.; Liao, C.; et al. Interactive effects of drought and heat stresses on morpho-physiological attributes, yield, nutrient uptake and oxidative status in maize hybrids. Sci. Rep. 2019, 9. [Google Scholar] [CrossRef] [Green Version]
  52. Triboï, E.; Martre, P.; Triboï-Blondel, A.M. Environmentally-induced changes in protein composition in developing grains of wheat are related to changes in total protein content. J. Exp. Bot. 2003, 54, 1731–1742. [Google Scholar] [CrossRef] [PubMed]
  53. Nagarajan, S.; Jagadish, S.V.K.; Prasad, A.S.H.; Thomar, A.K.; Anand, A.; Pal, M.; Agarwal, P.K. Local climate affects growth, yield and grain quality of aromatic and non-aromatic rice in northwestern India. Agric. Ecosyst. Environ. 2010, 138, 274–281. [Google Scholar] [CrossRef]
  54. Dupont, F.M.; Hurkman, W.J.; Vensel, W.H.; Tanaka, C.; Kothari, K.M.; Chung, O.K.; Altenbach, S.B. Protein accumulation and composition in wheat grains: Effects of mineral nutrients and high temperature. Eur. J. Agron. 2006, 25, 96–107. [Google Scholar] [CrossRef]
  55. Ahmed, M.; Hassan, F.U.; Qadir, G.; Shaheen, F.A.; Aslam, M.A. Response of proline accumulation in bread wheat (Triticum aestivum L.) under rainfed conditions. J. Agric. Meteorol. 2017, 73, 147–155. [Google Scholar] [CrossRef] [Green Version]
  56. Khan, A.; Khan, A.L.; Imran, M.; Asaf, S.; Kim, Y.H.; Bilal, S.; Numan, M.; Al-Harrasi, A.; Al-Rawahi, A.; Lee, I.J. Silicon-induced thermotolerance in Solanum lycopersicum L. via activation of antioxidant system, heat shock proteins, and endogenous phytohormones. BMC Plant Biol. 2020, 20. [Google Scholar] [CrossRef]
  57. Sattar, A.; Sher, A.; Ijaz, M.; Ul-Allah, S.; Rizwan, M.S.; Hussain, M.; Jabran, K.; Cheema, M.A. Terminal drought and heat stress alter physiological and biochemical attributes in flag leaf of bread wheat. PLoS ONE 2020, 15. [Google Scholar] [CrossRef] [PubMed]
  58. Zargar, S.M.; Nagar, P.; Deshmukh, R.; Nazir, M.; Wani, A.A.; Masoodi, K.Z.; Agrawal, G.K.; Rakwal, R. Aquaporins as potential drought tolerance inducing proteins: Towards instigating stress tolerance. J. Proteom. 2017, 169, 233–238. [Google Scholar] [CrossRef]
  59. Larkindale, J.; Knight, M.R. Protection against heat stress-induced oxidative damage in Arabidopsis involves calcium, abscisic acid, ethylene, and salicylic acid. Plant Physiol. 2002, 128, 682–695. [Google Scholar] [CrossRef]
  60. Garg, A.K.; Kim, J.K.; Owens, T.G.; Ranwala, A.P.; Do Choi, Y.; Kochian, L.V.; Wu, R.J. Trehalose accumulation in rice plants confers high tolerance levels to different abiotic stresses. Proc. Natl. Acad. Sci. USA 2002, 99, 15898–15903. [Google Scholar] [CrossRef] [Green Version]
  61. Gómez, L.D.; Baud, S.; Gilday, A.; Li, Y.; Graham, I.A. Delayed embryo development in the ARABIDOPSIS TREHALOSE-6-PHOSPHATE SYNTHASE 1 mutant is associated with altered cell wall structure, decreased cell division and starch accumulation. Plant J. 2006, 46, 69–84. [Google Scholar] [CrossRef]
  62. Lyu, J.I.; Park, J.H.; Kim, J.K.; Bae, C.H.; Jeong, W.J.; Min, S.R.; Liu, J.R. Enhanced tolerance to heat stress in transgenic tomato seeds and seedlings overexpressing a trehalose-6-phosphate synthase/phosphatase fusion gene. Plant Biotechnol. Rep. 2018, 12, 399–408. [Google Scholar] [CrossRef]
  63. Nuccio, M.L.; Wu, J.; Mowers, R.; Zhou, H.P.; Meghji, M.; Primavesi, L.F.; Paul, M.J.; Chen, X.; Gao, Y.; Haque, E.; et al. Expression of trehalose-6-phosphate phosphatase in maize ears improves yield in well-watered and drought conditions. Nat. Biotechnol. 2015, 33, 862–869. [Google Scholar] [CrossRef]
  64. Killiny, N.; Hijaz, F.; Nehela, Y.; Hajeri, S.; Gowda, S. Effects of δ-aminolevulinic acid dehydratase silencing on the primary and secondary metabolisms of citrus. Plant Direct 2018, 2. [Google Scholar] [CrossRef] [Green Version]
  65. Han, M.J.; Jung, K.H.; Yi, G.; An, G. Rice Importin β1 gene affects pollen tube elongation. Mol. Cells 2011, 31, 523–530. [Google Scholar] [CrossRef] [Green Version]
  66. Sato, S.; Kamiyama, M.; Iwata, T.; Makita, N.; Furukawa, H.; Ikeda, H. Moderate increase of mean daily temperature adversely affects fruit set of Lycopersicon esculentum by disrupting specific physiological processes in male reproductive development. Ann. Bot. 2006, 97, 731–738. [Google Scholar] [CrossRef]
  67. Li, L.; Zheng, W.; Zhu, Y.; Ye, H.; Tang, B.; Arendseea, Z.W.; Jones, D.; Li, R.; Ortiz, D.; Zhao, X.; et al. QQS orphan gene regulates carbon and nitrogen partitioning across species via NF-YC interactions. Proc. Natl. Acad. Sci. USA 2015, 112, 14734–14739. [Google Scholar] [CrossRef] [Green Version]
  68. Xu, Z.; Dooner, H.K. The maize aberrant pollen transmission 1 gene is a SABRE/KIP homolog required for pollen tube growth. Genetics 2006, 172, 1251–1261. [Google Scholar] [CrossRef] [PubMed] [Green Version]
Figure 1. The distribution of the grain yield per spike (GYPS) under control and heat stress during pre-anthesis in barley.
Agronomy 10 01730 g001
Figure 2. The histograms show the yield-related traits and the physiological traits in barley under control and heat stress during pre-anthesis in barley. Traits were grouped based on the range of their values; (a) traits with values less than 50 and (b) traits with values more than 50. The analysis of variation for yield traits (yield per plot (YPP), GYPS, and thousand kernel weight (TKW)) was fully described previously by Sallam et al. [23].
Agronomy 10 01730 g002
Figure 3. (a) Principal component analysis for the percentage changes of the traits in barley under heat stress during flowering and seed set. Traits names, abbreviations, and measurements are listed in Table 1; (b) the percentage contribution of each trait in the principal component biplot dimension 1 for the traits in barley under heat stress during flowering and seed set.
Agronomy 10 01730 g003aAgronomy 10 01730 g003b
Figure 4. (a,b) Correlation of traits in barley (a) under control (b) under heat stress during pre-anthesis in barley. The full names and abbreviations of the traits are listed in Table 1. X indicates the non-significant correlations at p = 0.05; (c) correlation of the percentage changes in all traits in barley. The full names and abbreviations of the traits are listed in Table 1. X indicates the non-significant correlations at p = 0.05. *, **, and *** encode to significane levels at 0.05, 0.01 and 0.001, respectively.
Agronomy 10 01730 g004aAgronomy 10 01730 g004b
Figure 5. The percentage changes of all traits in the four classes; A (10%), B (20%), C (30%), and D (40%) under heat stress during pre-anthesis in barley.
Agronomy 10 01730 g005
Figure 6. (a) Significant single nucleotide polymorphisms (SNPs) associated with changes in protein content (PC) and TKW and their candidate genes; (b) significant SNPs associated with the changes in chlorophyll content (CCF) and proline content (Pro), TKW, and GYPS and its candidate genes. Black bands refer to the physical position of the SNP on the respective chromosome.
Agronomy 10 01730 g006aAgronomy 10 01730 g006b
Table 1. The names, abbreviations, and descriptions of measurements of all traits.
TraitAbbreviationDescription of Measurement
Grain Yield per SpikeGYPSGrain weight in gram per spike
Yield per PlotYPPGrain weight per area
Days to FloweringDTFDays from sowing to 50% flowering
Chlorophyll at FloweringCCFMeasured by SPAD
Leaves Water contentWC WC = ( FW DW FW )   ×   100
StarchStrFales (1951) and Schlegel (1956); mg/g DW
CarbohydratesCarbFales (1951) and Schlegel (1956); mg/g DW
Protein contentPCLowery et al. (1951); mg/g DW
Amino acidsAAMoore and Stein (1948); mg/g DW
ProlinePro(Bates et al. 1973); mg/g DW
Each trait was estimated under control and heat stress conditions as described in Table 1.
Table 2. Analysis of variation (F-values among genotypes) for all physiological traits scored on the barley population under control and heat stress conditions.
TraitControlHeat Stress
Starch (Str)62.42 **138.80 **
Carbohydrates (Carb)101.95 **161.96 **
Amino Acid (AA)862.45 **494.39 **
Protein content (PC)22.42 **56.16 **
Proline content (Pro)816.03 **979.71 **
** highly significant change at p = 0.01.
Table 3. Ranges of the percentage changes in all traits of control and heat stressed plants in the four classes, A, B, C, and D.
TraitClass A (≤10%)Class B (≤20%)Class C (≤30%)Class D (≤40%)
MinMaxMeanMinMaxMeanMinMaxMeanMinMaxMean
Yield-Related Traits
GYPS−0.35−9.97−5.27−10.12−17.96−13.88−20.33−29.10−24.07−33.66−39.87−36.63
YPP−0.61−28.25−16.21−9.92−50.57−30.96−7.68−56.61−35.02−32.59−61.84−49.34
TKW−1.39−24.22−10.91−3.07−15.07−9.90−0.36−18.57−7.95−22.22−29.67−25.81
DTF−6.52−19.47−12.41−8.45−16.62−12.18−8.49−14.36−11.5610.37−9.94−2.87
Physiological Traits
CCF−22.9469.9614.54−22.5930.178.16−15.6135.1813.94−17.13−27.03−22.68
WC−21.179.54−9.25−26.806.19−10.60−13.53−37.94−21.32−24.83−33.60−28.58
Str−13.68109.3110.84−43.6445.78−8.99−4.76−41.27−22.15−45.88−53.63−50.76
Car−51.39248.6554.56−23.67169.9047.52−48.81120.8214.07−34.54−55.42−43.20
AA−88.13561.6263.04−74.39463.27116.44−83.58355.7512.78−50.9960.98−13.35
PCC−36.68325.6356.70−90.85371.32−10.16−84.65141.29−22.100.00−52.97−28.20
Pro−1.27356.09126.29−4.15239.8492.31−50.60210.732.57−47.60−64.13−54.44
Traits are abbreviated in Table 1. Min = Minimum, Max = Maximum.
Table 4. Candidate genes associated with the variation of the traits in spring barley under control and heat during flowering and seed setting.
TraitChrGene NameGene StartGene EndGene LengthGene AnnotationOrthologs
PC, TKWH1HORVU1Hr1G01321034083562340887315170IQ-domain 2-
PC, TKWH1HORVU1Hr1G01336035213246352185505305HexosyltransferaseAT3G25140
PC, TKWH1HORVU1Hr1G01345035606596356160679472Alpha, alpha-trehalose-phosphate synthase [UDP-forming] 1AT1G68020
PC, TKWH1HORVU1Hr1G01347035676705356782801576Delta-aminolevulinic acid dehydrataseAT1G44318
PC, TKW1HORVU1Hr1G01348035679610356834343825sugar transporter 1AT1G08890
PC, TKWH1HORVU1Hr1G01352035975927359771081182Pectin lyase-like superfamily proteinAt3g16850
PC, TKWH1HORVU1Hr1G01358036169093361728783786Importin subunit beta-1AT5G53480
PC, TKWH1HORVU1Hr1G013600364386913646161522925E3 SUMO-protein ligase SIZ1AT5G60410
PC, GYPS4HORVU4Hr1G0343602473667272473717224996Nuclear transcription factor Y subunit C-3AT1G54830
CCFH4HORVU4Hr1G03465025160027525163708336809Protein ABERRANT POLLEN TRANSMISSION 1-
TKWH4HORVU4Hr1G0347502526326532526373684716U4/U6 small nuclear ribonucleoprotein PRP4-like protein-
Publisher’s Note: MDPI stays neutral with regard to jurisdictional claims in published maps and institutional affiliations.

