Article

Do Triticum aestivum L. and Triticum spelta L. Hybrids Constitute a Promising Source Material for Quality Breeding ofNew Wheat Varieties?

1
Department of Plant Breeding and Seed Production, Faculty of Environmental Management and Agriculture, University of Warmia and Mazury in Olsztyn, pl. Łódzki 3, 10-727 Olsztyn, Poland
2
Institute of Bioanalytics and Agro-Metabolomics, Department of Agrobiotechnology (IFA-Tulln), University of Natural Resources and Life Sciences, Vienna (BOKU), Konrad Lorenz Str. 20, 3430-Tulln, Austria
*
Author to whom correspondence should be addressed.
Agronomy 2020, 10(1), 43; https://doi.org/10.3390/agronomy10010043
Submission received: 14 October 2019 / Revised: 20 December 2019 / Accepted: 24 December 2019 / Published: 27 December 2019
(This article belongs to the Special Issue Wheat Breeding: Procedures and Strategies)

Abstract

:
The aim of this two-year study was to determine whether the contents of macronutrients and macro and microelements in wheat grain can be increased by crossbreeding Triticum aestivum and T. spelta. The experimental material comprised the grains of F6 and F7 hybrids and their parental forms. The element content of grain was determined by ICP-SFMS. Hybrid grains had significantly higher ash contents than bread wheat grain (1.90% and 1.93% versus 1.62%). Crude protein content was lowest in bread wheat grain (11.75%) and highest in spelt grain (14.67%). Hybrid grains had significantly higher protein contents (12.97% and13.19%) than bread wheat grain. In both years of the study, the concentrations of P, S, Mg and Ca were highest in spelt grain, whereas their content in hybrids was lower than in spelt grain, but higher than in bread wheat grain. The concentrations of desirable microelements were highest in spelt grain, and the micronutrient profile of hybrid grains was more similar to bread wheat than spelt. Therefore, the hybrids can constitute promising source material for quality breeding in wheat.

1. Introduction

In 2018/2019, the global production of wheat was estimated at 735 million tons, and allohexaploid bread wheat (Triticum aestivum L.) accounted for around 94% of total output. In 2017/2018, the production of allotetraploid durum wheat Triticum durum L. reached around 37.5 million tons with more than a 5% share of the global output [1,2]. Small quantities of other wheat species, including allohexaploid spelt (Triticum spelta L.), allotetraploid emmer (Triticum dicoccon Schrank) and diploid einkorn (Triticum monococcum L.), are grown in selected regions of the world, including the European Union, Balkans and the Indian subcontinent [3]. Despite the growing demand for high-quality food products, yield continues to be the main determinant of profitability in cereal production. The maximization of yield requires progress in breeding methods. High-yielding crop varieties are often characterized by low nutritional quality due to low levels of protein, minerals (in particular Fe and Zn) and selected nutraceuticals [4,5]. However, it should be noted that high-yielding bread wheat varieties with high contents of selected phytochemicals in grain have been described by Ward et al. [6]. For this reason, modern cereals are becoming less suitable for the production of functional foods. The Green Revolution provided only a short-term solution to global hunger. The resulting increase in food production was not accompanied by an improvement in the nutritional quality of food [7]. Hidden hunger and malnutrition affect more than two billion people around the world [8]. According to Bouis and Welch [9], malnutrition is caused by dysfunctional food systems that cannot supply all the nutrients and health-promoting factors required for human life in a sustainable way. In their opinion, diets deficient in vitamins and essential nutrients are the chief cause of malnutrition. Magnesium, zinc and iron are found mainly in the aleurone layer of cereal kernels. Cereal products are a vital source of the above elements and trace minerals that are essential for human health [10,11]. A balanced diet should contain the optimal proportions of seven macro elements (Na, K, Ca, Mg, S, P and Cl) and ten essential trace elements (Fe, Zn, Cu, Mn, I, F, Se, Mo, Co and B) [11]. Micro element deficiencies are noted not only in developing countries where cereals are staple foods, but are observed increasingly often in developed countries [12,13]. Human diets are most deficient in iron, zinc and vitamin A [14]. According to the WHO, iron deficiency is responsible for 74% of the cases of anemia in children [15]. The availability of iron from ferrous sulfate, one of the most widely used iron fortifiers in cereal grain, is relatively low [16]. Zinc deficiency poses a serious problem in many developing countries, and it is regarded as the fifth most common risk factor for disease in children, especially diarrhea and pneumonia, that can contribute to high mortality rates in underdeveloped regions [17]. According to the International Zinc Association, 49% of the world’s population suffers from zinc deficiency [18]. Insufficient zinc intake contributes to growth disorders, sexual dysfunctions (hypogonadism, hypospermia), hair loss, skin disorders, nyctalopia and loss of appetite [19,20]. Plant breeders continue to search for new genetic sources of minerals that are essential in human nutrition. However, the mineral profile of grain can vary across geographic locations [21]. The interest in spelt wheat (T. spelta) has been recently revived due to the development of alternative farming techniques and efforts aiming to preserve the biodiversity of agricultural ecosystems. The area under spelt has increased in response to the overproduction of the basic cereals, the introduction of environmentally-friendly cultivation methods and the growing demand for new foods with health-promoting properties [22]. According to Kohajdová and Karovicová [23], spelt wheat has high nutritional value on account of its composition and high content of protein, lipids and crude fiber. Spelt grain is more abundant in iron, zinc, copper, magnesium, potassium, sodium and selenium than bread wheat [24,25]. Spelt-based foods deliver greater health benefits than those made from modern wheat varieties [26]. The genetic distance between spelt and bread wheat is relatively small, which contributes to the production of stable hybrids, where bread wheat is used as a source material for breeding modern spelt varieties. Bread wheat and spelt are allohexaploid cereals with the same genome, AABBDD. Cytogenetic and phylogenetic analyses of T. spelta and T. aestivum revealed considerable similarities in their chromosomal structure and homology. It is generally believed that hexaploid wheat originated from the hybridization of hulled tetraploid emmer and Aegilops tauschii (genomes DD), and that the nascent hexaploid was spelt, which evolved into free-threshing wheat through mutations [27]. Hybrids between T. aestivum and T. spelta could offer an interesting alternative by eliminating the adverse qualities of spelt and improving the nutritional value of bread wheat [28]. However, the resulting benefits have not been studied extensively to date. The discussed hybrids are characterized by similar threshability and resistance to lodging to bread wheat, and they could also constitute promising source materials for breeding new wheat varieties. Spelt is a valuable source of genes for breeding wheat varieties with increased Zn and Fe contents [29]. Genetic biofortification (and, consequently, plant breeding) is a widely accepted strategy and the most sustainable approach to minimizing mineral and nutrient deficiencies, especially low levels of micro elements, such as Fe and Zn [30]. F1 hybrids produced by crossing bread wheat and spelt demonstrated considerable heterosis effects on grain yield, the number of grains per spike, and grain weight [31].
The aim of this study was to compare the content of macro elements and micro elements in the grain of T. aestivum and T. spelta hybrids and their parental forms and to determine whether the crossbreeding of both species could contribute to improving the nutritional quality of wheat.

2. Materials and Methods

2.1. Field Experiment

The experimental material comprised the grain of F6 and F7 hybrids from single crosses between T. spelta × T. aestivum and T. aestivum × T. spelta and their parental forms: spring spelt breeding lines (S10, S11, S12, S13 and S14) selected at the Department of Plant Breeding and Seed Production of the University of Warmia and Mazury in Olsztyn, Poland, and three spring cultivars of bread wheat: Torka, Kontesa and Zebra. The studied breeding lines of spring spelt were selected from more than ten accessions acquired from the National Center for Plant Genetic Resources in Radzików, Poland. The analyzed lines fully meet “true spelt” criteria in terms of phenotypic traits. The examined lines were bred for resistance to lodging, resistance to fungal pathogens and high yields. Torka and Zebra are elite wheat cultivars (E) with the highest flour strength and high protein content, whereas Kontesa is a high-yielding variety of quality class A [32]. A total of 23 hybrids were investigated (Table 1). The field experiment was performed in the growing seasons of 2014 and 2015 at the Agricultural Experiment Station in Bałcyny near Ostróda, Poland (53°36′ N latitude; 19°5′ E longitude). Spikelets (spelt and hybrids) or seeds (bread wheat) were sown in triplicate with 10×20 cm spacing and were fertilized with N/P/K 60/25/80 kg/ha in plots with an area of 6 m2. Chemical plant protection was not applied. Grain (bread wheat) and spikelets (spelt and hybrids) were harvested in the over-ripe stage (BBCH 92) [33] with a Wintersteiger Classic (Austria) plot harvester. At the same time, 30 heads from each plot were hand-harvested for biometric measurements. Spikelets were threshed with the Wintersteiger LD 180 (Austria) laboratory thresher, and grain was refrigerated until analysis.

2.2. Biometric Measurements

The following biometric measurements of major yield components and morphological parameters of spikes were conducted after harvest: kernel number per spike, kernel weight per spike, one-kernel weight, spike length and spike density (number of spikelets per 10 cm of spike length). Yield per 1 ha was estimated based on yield per plot, and it was expressed as the yield of dehulled kernels in both spelt and the hybrids.

2.3. Analysis of the Content of Macronutrients in Grain

The content of macronutrients in grain was analyzed according to the method proposed by Wiwart et al. [34] and Suchowilska et al. [35]. Grain samples were milled in the Cyclotec 1093 sample mill (FOSS, Hillerød, Denmark). Crude protein content (N × 5.7) [36] was determined in two replicates in the Bűchi system (K-424 Digestion Unit and B-324 Distillation Unit, Flawil, Switzerland). Crude fat was extracted by the Soxhlet method (Bűchi Extraction System B-811, Flawil, Switzerland) (solvent: diethyl ether (POCh, Gliwice, Poland); extractor size—100 mL; 2.5 g analytical samples of air-dried ground grain). Extraction was carried out at a temperature of 60 °C for 4 h, in two replicates. After ether evaporation, solvent caps containing crude fat were dried for 2 h at 105 °C in a desiccator and weighed. Crude fiber content was determined using the Fibertec 2010 system (FOSS, Hillerød, Denmark) and the Weende method. Ground samples of 2 g were placed in FOSS crucibles with P2 porosity (40–100 μm). The samples were placed in a hot extraction unit, immersed in 1.25% H2SO4 (POCh, Gliwice, Poland) and boiled for 40 min. Sulfuric acid was removed; the samples were rinsed three times with hot demineralized water, placed in a cold extraction unit and rinsed with acetone (POCh, Gliwice, Poland). The samples were dried at 105 °C for 3 h, and the amount of fiber was determined in a quantitative analysis.

2.4. Macro Element and Micro Element Analyses

Macro elements and micro elements were analyzed based on the method described by Bieńkowska et al. [37]. Samples were digested in a high pressure assure (HPA) device (Anton Paar, Graz, Austria). Macro element and micro element concentrations were determined in the Finnigan ELEMENT2 double-focusing sector field inductively coupled plasma mass spectrometer (ICP-MS, Thermo Electron Corporation, Bremen, Germany) with a CETAC ASX-520 autosampler (CETAC Technologies, Omaha, Nebraska, USA). The instrument was equipped with a cyclonic spray chamber (Jacketed Cinnabar Cyclonic, 20 mL) and a borosilicate glass conical nebulizer (Glass Expansion, West Melbourne, Australia) connected to a 700 µL min−1 self-aspiration capillary (0.5 µm I.D.) (AHF Analysentechnik, Tübingen, Germany).

2.4.1. Reagents and Standard Solutions

Water was purified successively by reverse osmosis in the PURELAB® Ultra water purification system (ELGA LabWater/VWS, High Wycombe, United Kingdom). HNO3 (69%) TraceSELECT®, single element spectroscopy standard solutions (1 g L−1 of Al, As, B, Ba, Cd, Ce, Co, Cr, Cu, Fe, Hg, In, La, Mn, Mo, Na, Ni, Pb, Rb, Se, Sr, Tl, V, Y and Zn in 2% HNO3; 1 g L−1 of Sb; Sn in 10% HCl), MgSO4·6H2O, KH2PO4, CaCO3 and CaCl2·4H2O of Suprapur® quality (for trace analysis) were purchased from Fluka, Sigma-Aldrich (Steinheim, Germany), CPI International (Amsterdam, The Netherlands) and Merck (Darmstadt, Germany). An internal standard (IS) solution with 40 µg L−1 Sc, 20 µg L−1 In and 20 µg L−1 Tl in 0.5% HNO3 was used to prepare calibration standards and dilute digestion solutions in such a way that all aspirated test samples contained 20 µg L−1 of Sc and 10 µg L−1 of In and Tl. The calibration standards had the following concentration: 0.02–1 µg L−1 of Cd, Ce Co, Cr, Hg, La, Pb, Sb, Sn, V and Y; 0.1–5 µg L−1 of As, Se and Ni; 1–50 µg L−1 of Al, B, Ba, Cu, Mo, Rb and Sr; 4–200 µg L−1 of Fe, Mn and Zn; 0.02–1 mg L−1 of Na; 0.8–4 mg L−1 of Ca and Cl; 2–10 mg L−1 of Mg and S; 8–40 mg L−1 of K and P in 1.5% HNO3.

2.4.2. Digestion Procedure

Wheat kernel samples of 500 (±20) mg each were transferred to 30 mL quartz vessels and 2 mL HNO3 was added. The vessels were sealed with Teflon tape and quartz disks, and they were placed inside the HPA. An initial pressure of 100 bar nitrogen was applied to the vessels, and the following temperature program was run: 80 °C for 15 min, 110 °C for 15 min, 240 °C for 10 min and 240 °C for 90 min. The vessels were cooled to obtain clear digestion solutions, and the samples appeared to be completely mineralized. The digestion solutions were transferred to pre-weighed 50 mL polystyrene (PS) tubes and diluted with ultra-pure water to 50.0 g. Prior to ICP-MS measurements, aliquots of 3 mL were combined with 3 mL of the IS solution. The dilution factor was 1:200 for the samples and 1:50 for HNO3 used in digestion. The sample solutions were stored at room temperature until ICP-MS analysis.

2.4.3. ICP-SFMS Measurements

Argon (Ar 4.6, 99.996%) flow rate was 16 L min−1, and the flow rates of auxiliary (plasma) and sample (nebulizer) gas were optimized daily before each measurement series to obtain maximum signal intensity, the former typically at 0.70 L min−1, and the latter at 1.00 L min−1. RF power was 1185–1195 W. The following nuclides were measured in low-resolution mode (Rs = 300, 10% valley definition): 11B, 45Sc, 89Y, 97Mo, 115In, 118Sn, 121Sb, 139La, 201Hg, 205Tl, 206Pb and 208Pb. 23Na, 24Mg, 27Al, 35Cl, 44Ca, 45Sc, 51V, 52Cr, 55Mn, 56Fe, 59Co, 60Ni, 63Cu, 66Zn, 88Sr, 111Cd, 115In, 118Sn, 137Ba and 140Ce were determined in medium-resolution mode (Rs = 4000), whereas 31P, 32S, 39K, 45Sc, 75As 77Se and 85Rb were measured in high-resolution mode (Rs = 10 000). Sc, In and Tl were used as internal standards to compensate for changes in signal intensity during measurement. The samples were quantified by external calibration.

2.5. Statistical Analysis

The results of all measurements performed during the two-year study were processed statistically by ANOVA, where the significance of differences between means was determined by the Student–Newman–Keuls (SNK) test and principal component analysis (PCA). Statistical analyses were performed in Statistica 13 software [38].

3. Results

The contents of macro and micro elements in soil before the field experiment are presented in Table S1.

3.1. Yield Components

Yield components, spike length, spike density and the yield of the analyzed hybrids and their parental forms are presented in Table 2. Average spike length did not differ significantly between hybrids and bread wheat, whereas spike density in hybrids occupied the mid-range of values noted in spelt and bread wheat and differed significantly from both parental forms. Similar observations were made in one-kernel weight, the major yield component. Interestingly, despite the absence of significant differences in average kernel weight between treatments, this parameter was somewhat higher in hybrids than in their parental forms. Yields were lower in hybrids than in bread wheat and spelt, but the noted difference was significantly only in hybrids originating from spelt as the maternal component.

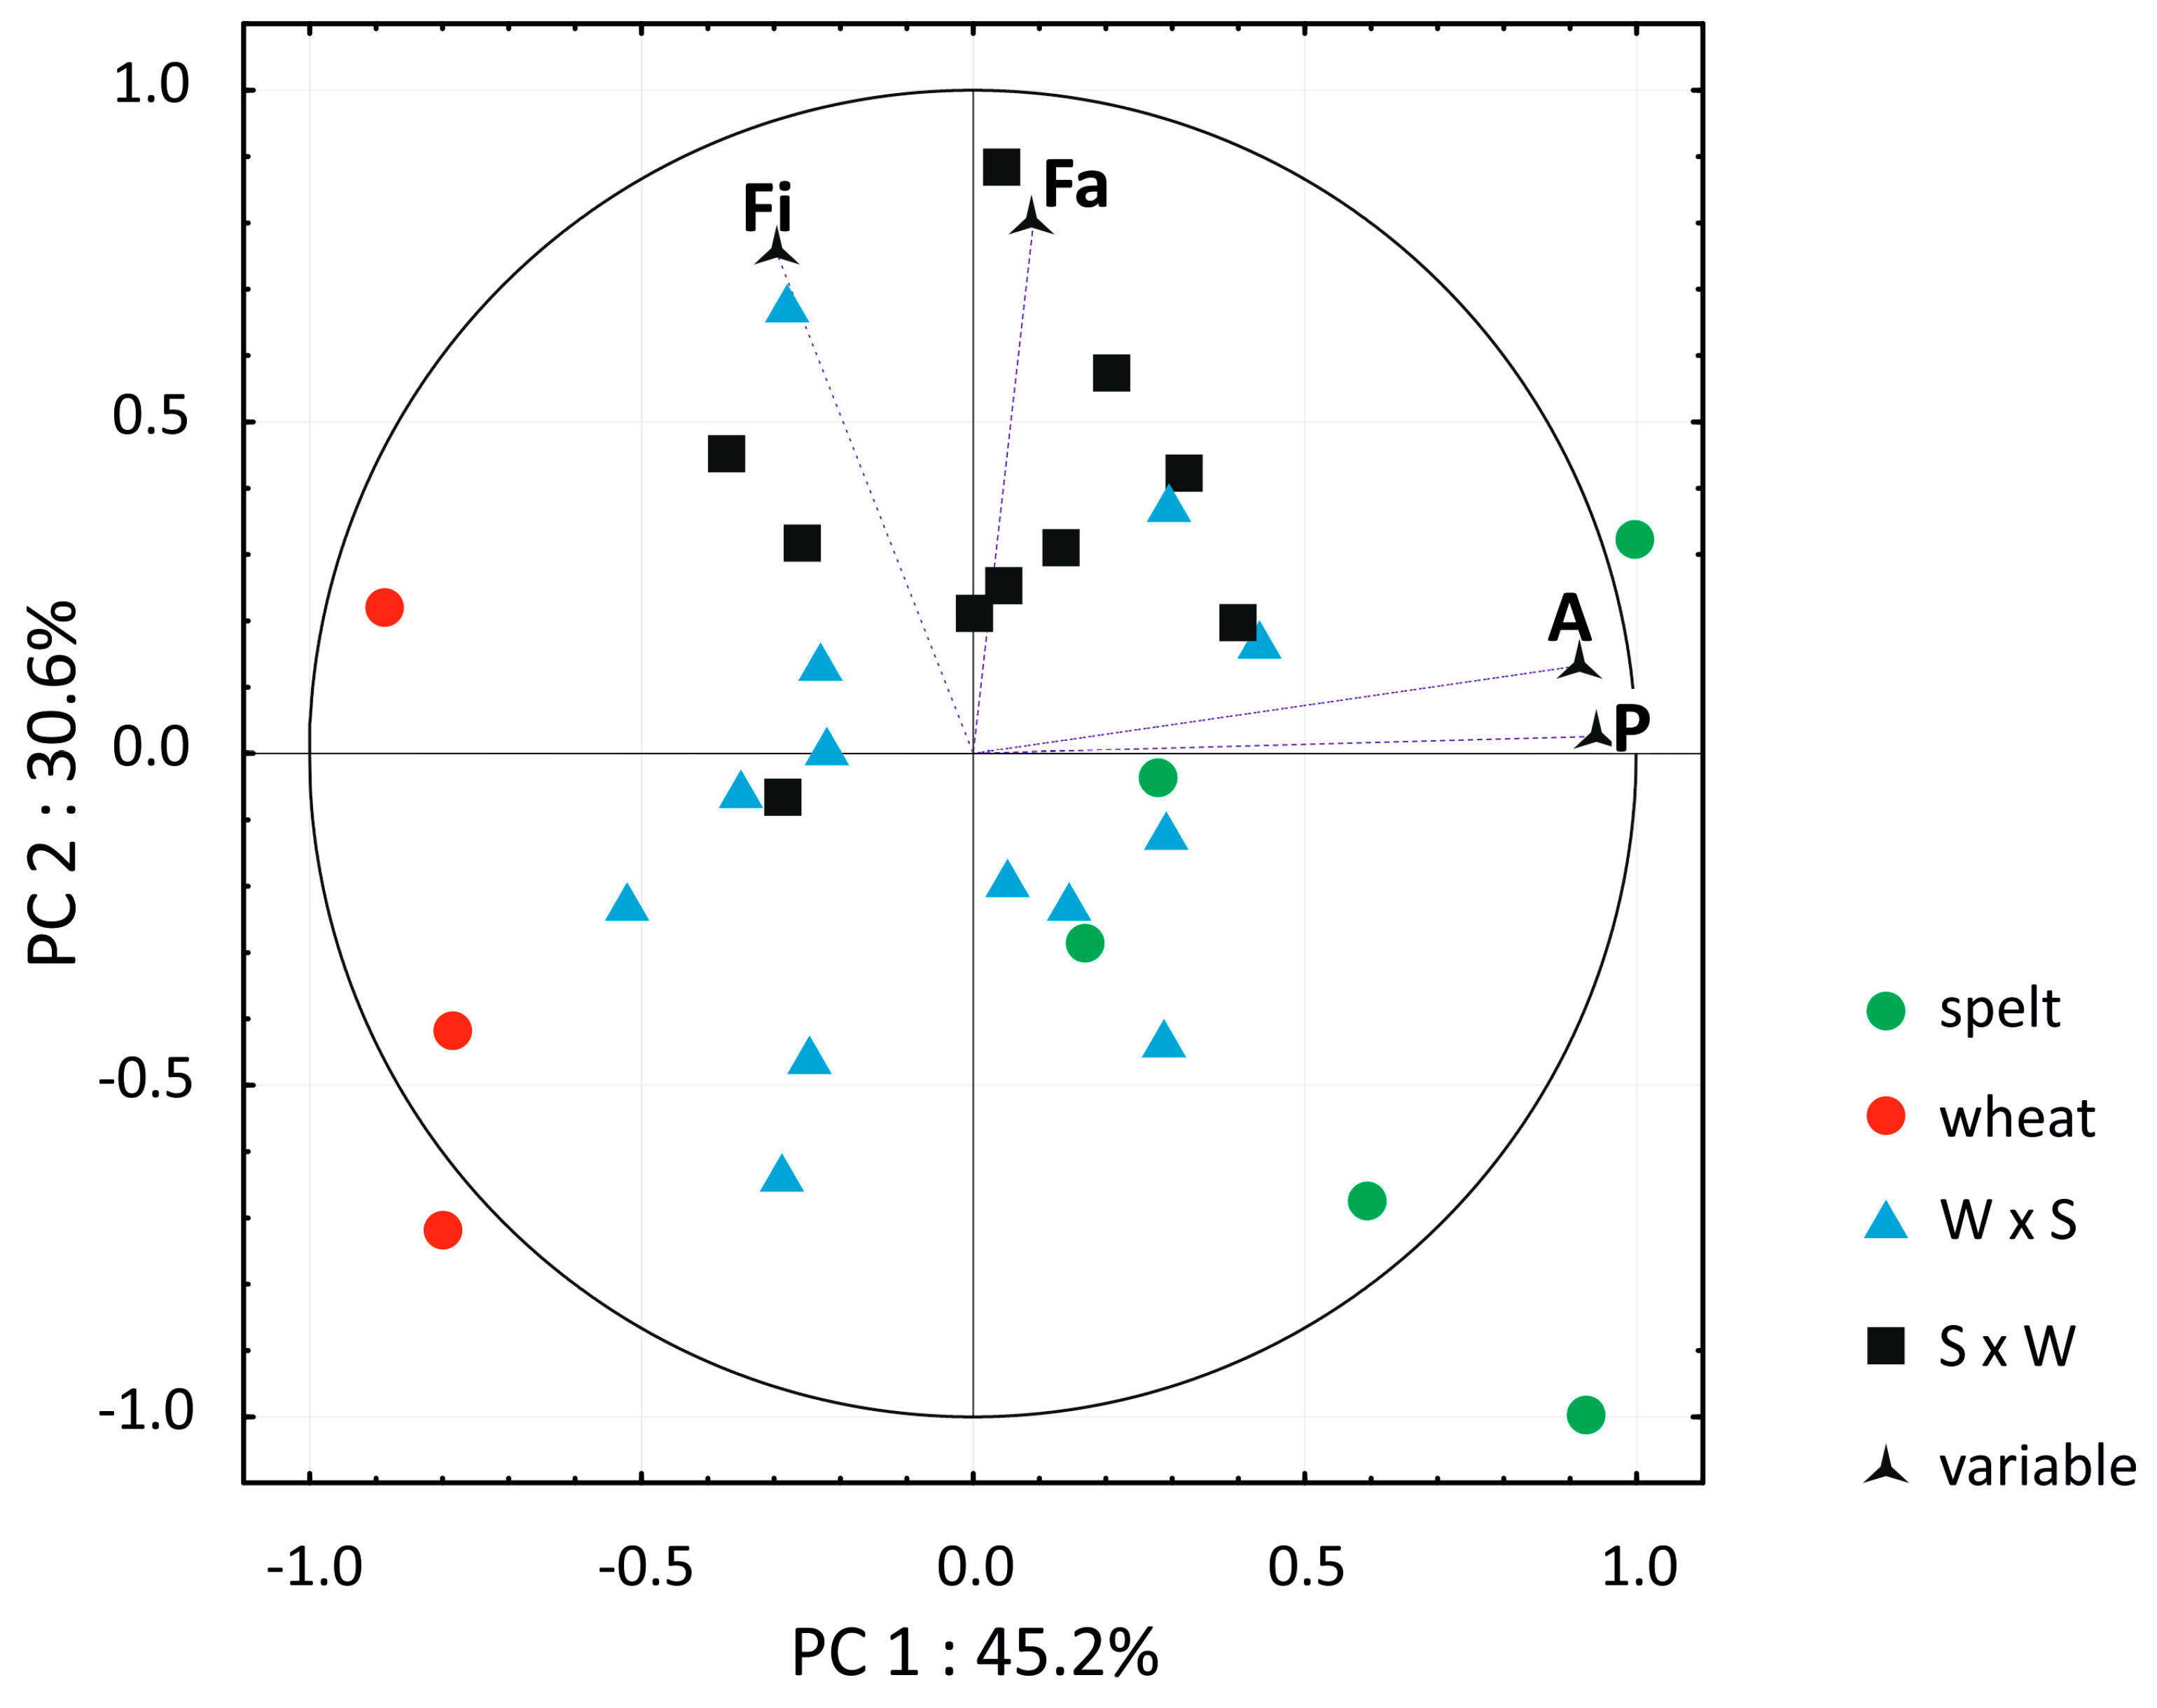
3.2. Macronutrient Analysis

The macronutrient content of grain is presented in Table 3.
Regardless of the direction of crossbreeding, the hybrids were characterized by significantly higher contents of ash than bread wheat. These differences ranged from 5.1%–7.8% in 2014 to 23.2%–27.3% in 2015. The average content of ash in the grain of all analyzed wheat forms was nearly 12% lower in 2015 than in 2014. In this respect, the evaluated hybrids were more similar to spelt than bread wheat. Dietary fiber content did not differ significantly between hybrids and bread wheat. Only in 2014, was the content of dietary fiber significantly the lowest in spelt grain (2.23%), and it was significantly the highest in bread wheat grain (2.85%). In both years, crude protein content was significantly the lowest in bread wheat (12.17% and 11.33%, respectively) and significantly the highest in spelt (15.60% and 13.74%, respectively). The evaluated hybrids were generally more abundant in crude protein than bread wheat, but the noted difference was significant only in the first year of the study. Significant differences in crude fat content were observed between hybrids and bread wheat only in 2014 when this parameter was significantly the highest in the grain of spelt hybrids (2.44% on average) and significantly the lowest in bread wheat grain (2.07% on average). The average contents of ash, crude fiber and crude protein were significantly lower in the second than in the first year of the study, which could be attributed to different weather conditions in July in both years of the experiment. In July 2014, precipitation reached 164 mm and mean temperature −17.9 °C, whereas in July 2015, the corresponding values were determined at 20.4 mm and 21 °C, respectively. These differences undoubtedly influenced the contents of the analyzed macronutrients. The results of the two-year experiment were subjected to PCA, and the PCA biplot is presented in Figure 1. The first two principal components (PC1 and PC2) explained 70.1% of total variance. The points corresponding to each treatment (PC1–PC2 in a Cartesian coordinate system) are presented in a biplot, and the points corresponding to the four macronutrients are presented in a single diagram. In the biplot, variable points are distributed inside a circle with a radius of 1, which corresponds to the maximum (+1) and minimum (−1) value of the correlation coefficient between the variable and the PC. The closer a given variable point is located to the circle, the stronger its discriminatory power. A point’s location indicates whether the correlation coefficient has a positive or a negative value (+ or –). The distribution of points in the biplot indicates that the grain of bread wheat and spelt had a completely different nutrient profile. Most W × S hybrids were somewhat similar to bread wheat than S × W hybrids. The distribution of the points corresponding to the concentrations of four macronutrients suggests that crude protein and ash had slightly greater discriminatory power than crude fat and dietary fiber.
The correlations between one-kernel weight, yield and macronutrient content were not statistically significant, and the values of the correlation coefficient ranged from r = −0.320 (protein–yield) to r = 0.315 (ash–yield).

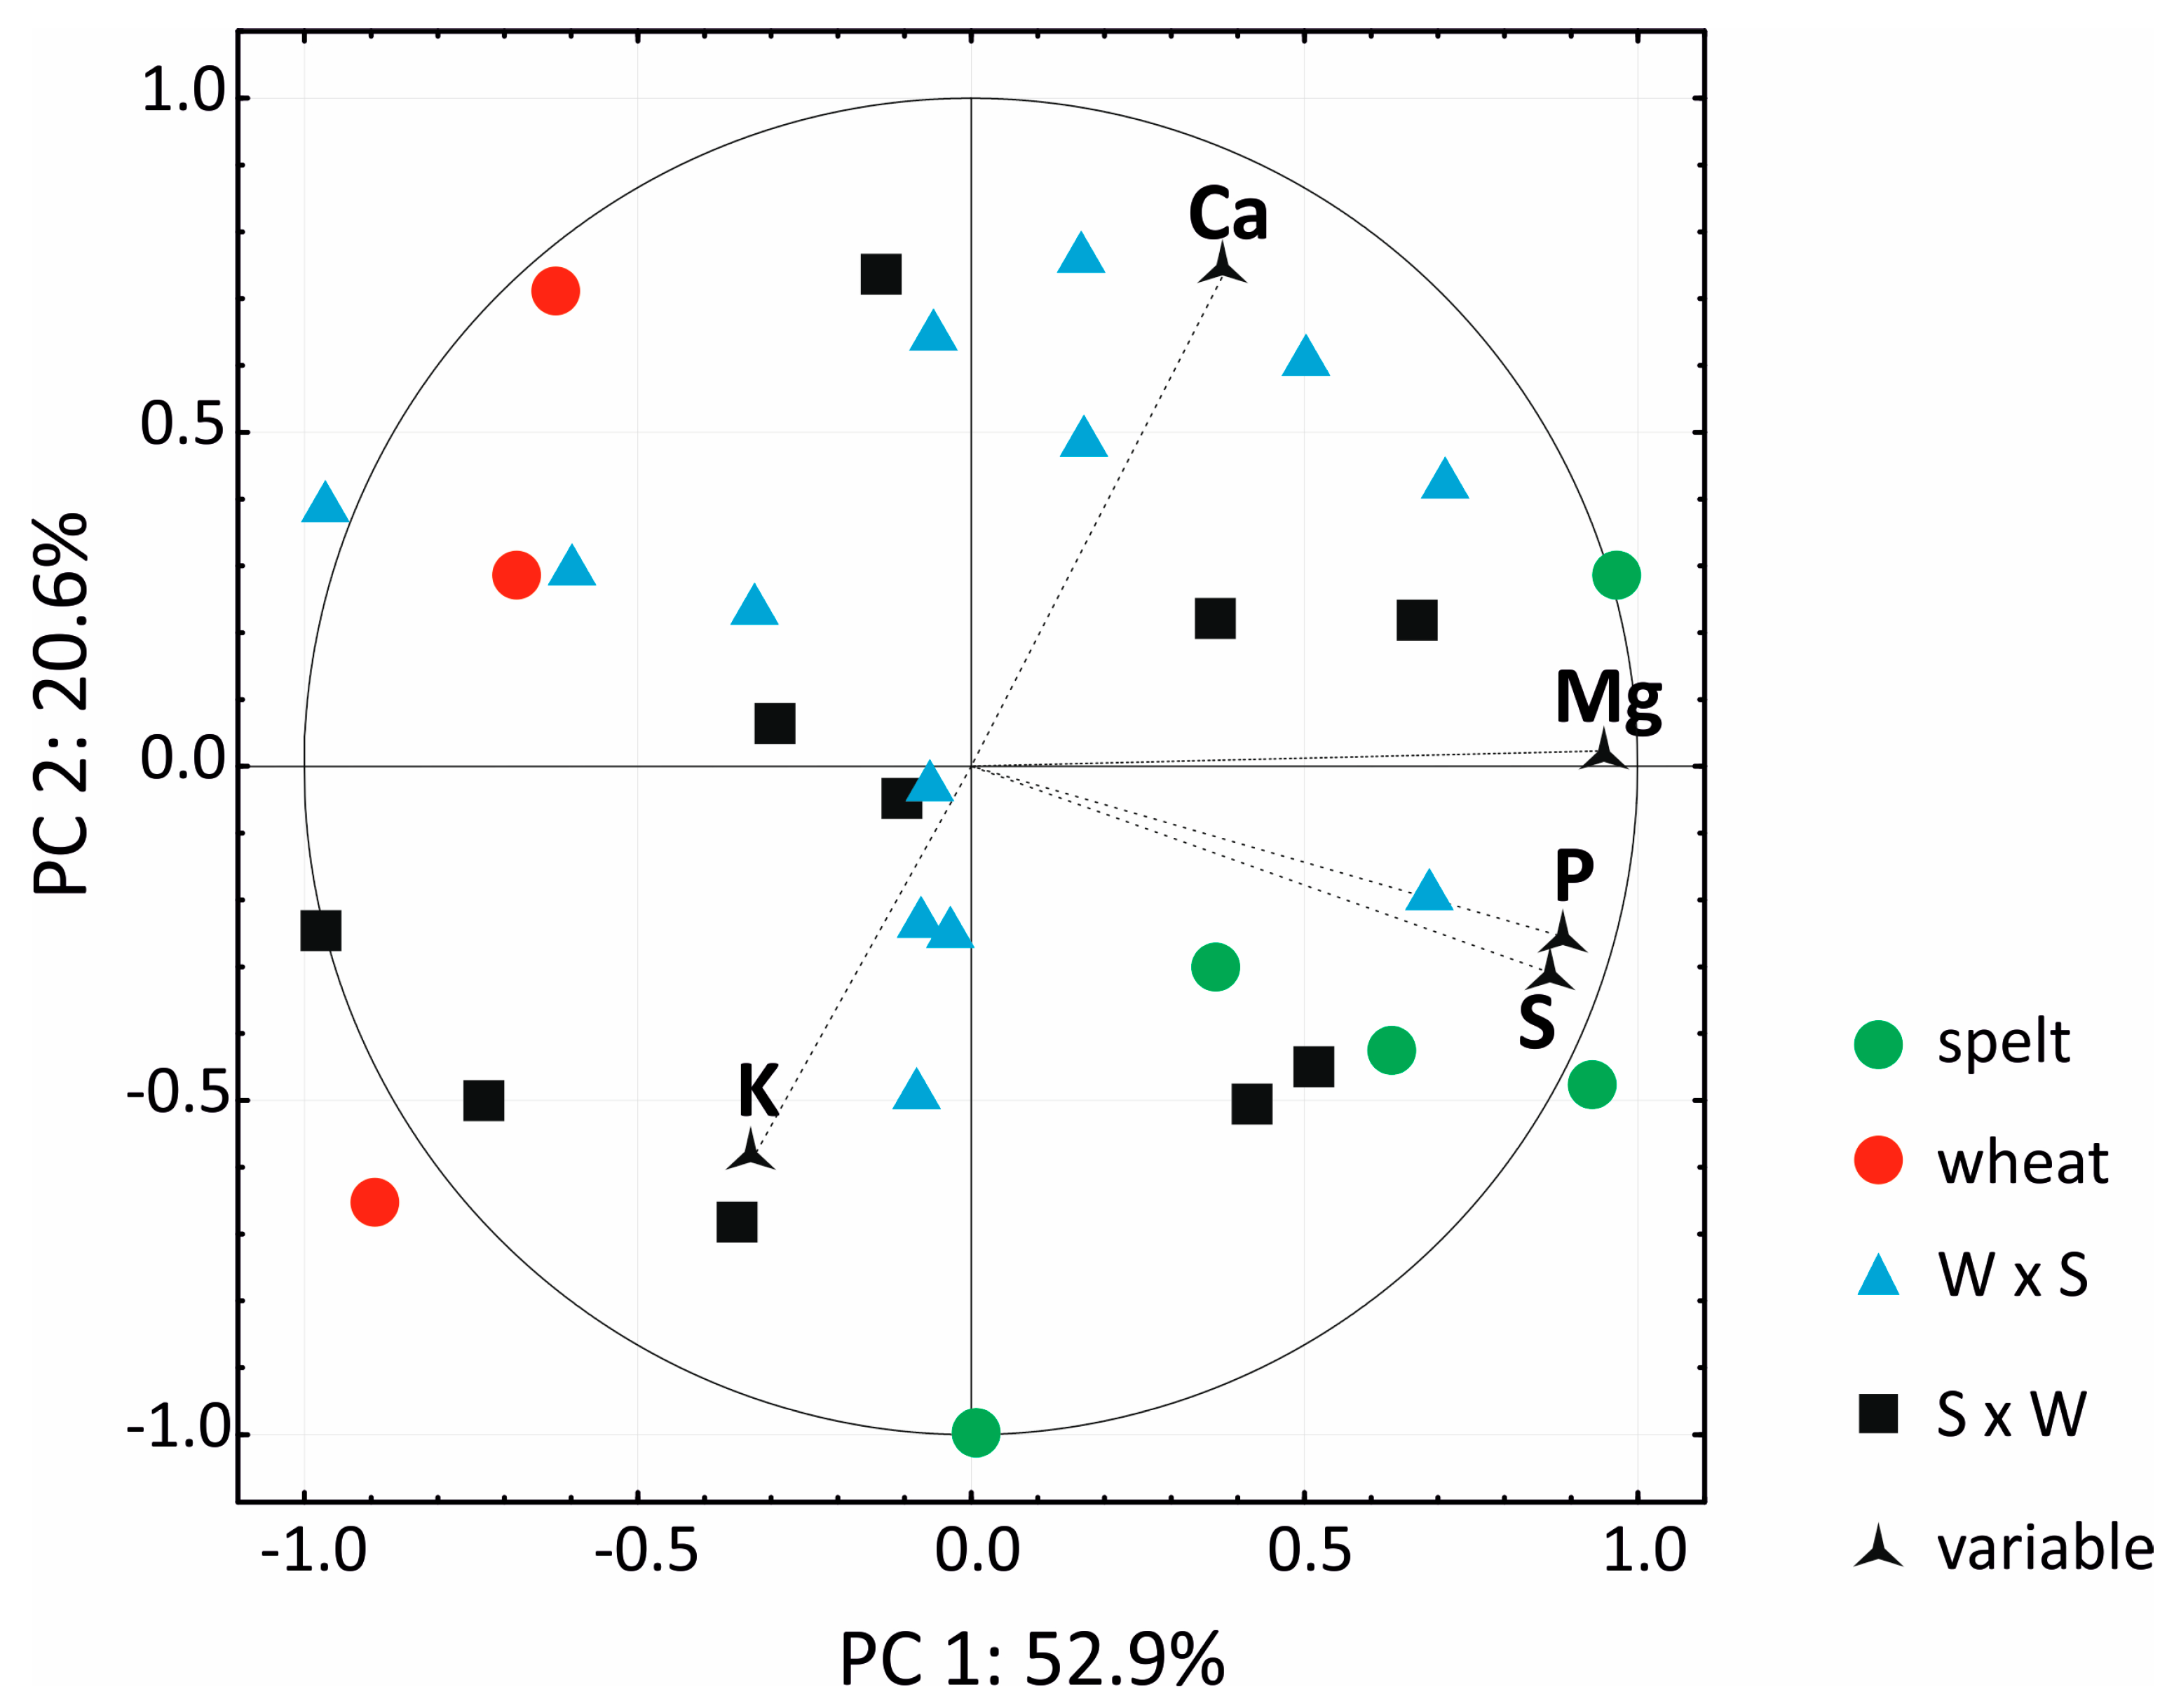
3.3. Macro Element Analysis

The contents of five macro elements in the grain of the studied hybrids and their parental forms are presented in Table 4. The concentrations of P, S and Mg were significantly higher (by 7.8%–15.7%) in the second year of the study. In both years, the macro element content of grain (excluding K) was higher in spelt than in bread wheat, but the differences observed were significant only for P, S and Mg. The contents of macro elements in hybrids occupied the mid-range of the values noted in the parental forms. High positive values of the standard error of skewness (SES) for K and S levels in 2015 indicate that unlike P concentration, hybrids were characterized by below-average contents of K and S. In both years, the standard error of kurtosis (SEK) was higher than 1 and lower than −1 in several cases only, which suggests that most frequency distributions were normal. The higher the positive values of SEK, the greater the concentration of the measured parameters around the average value. The lower the negative values of SEK, the flatter the distribution (greater scatter of the measured parameters). The PCA result for macro element content indicates that PC1 and PC2 explained 73.5% of total variance (Figure 2). Macro element concentrations in hybrids occupied the mid-range of the values noted in the parental forms, without a clear distinction between W × S and S × W hybrids. In both years of the study, the concentrations of P, S and Mg had the greatest discriminatory power relative to PC1, and the concentrations of K and Ca—relative to PC2.

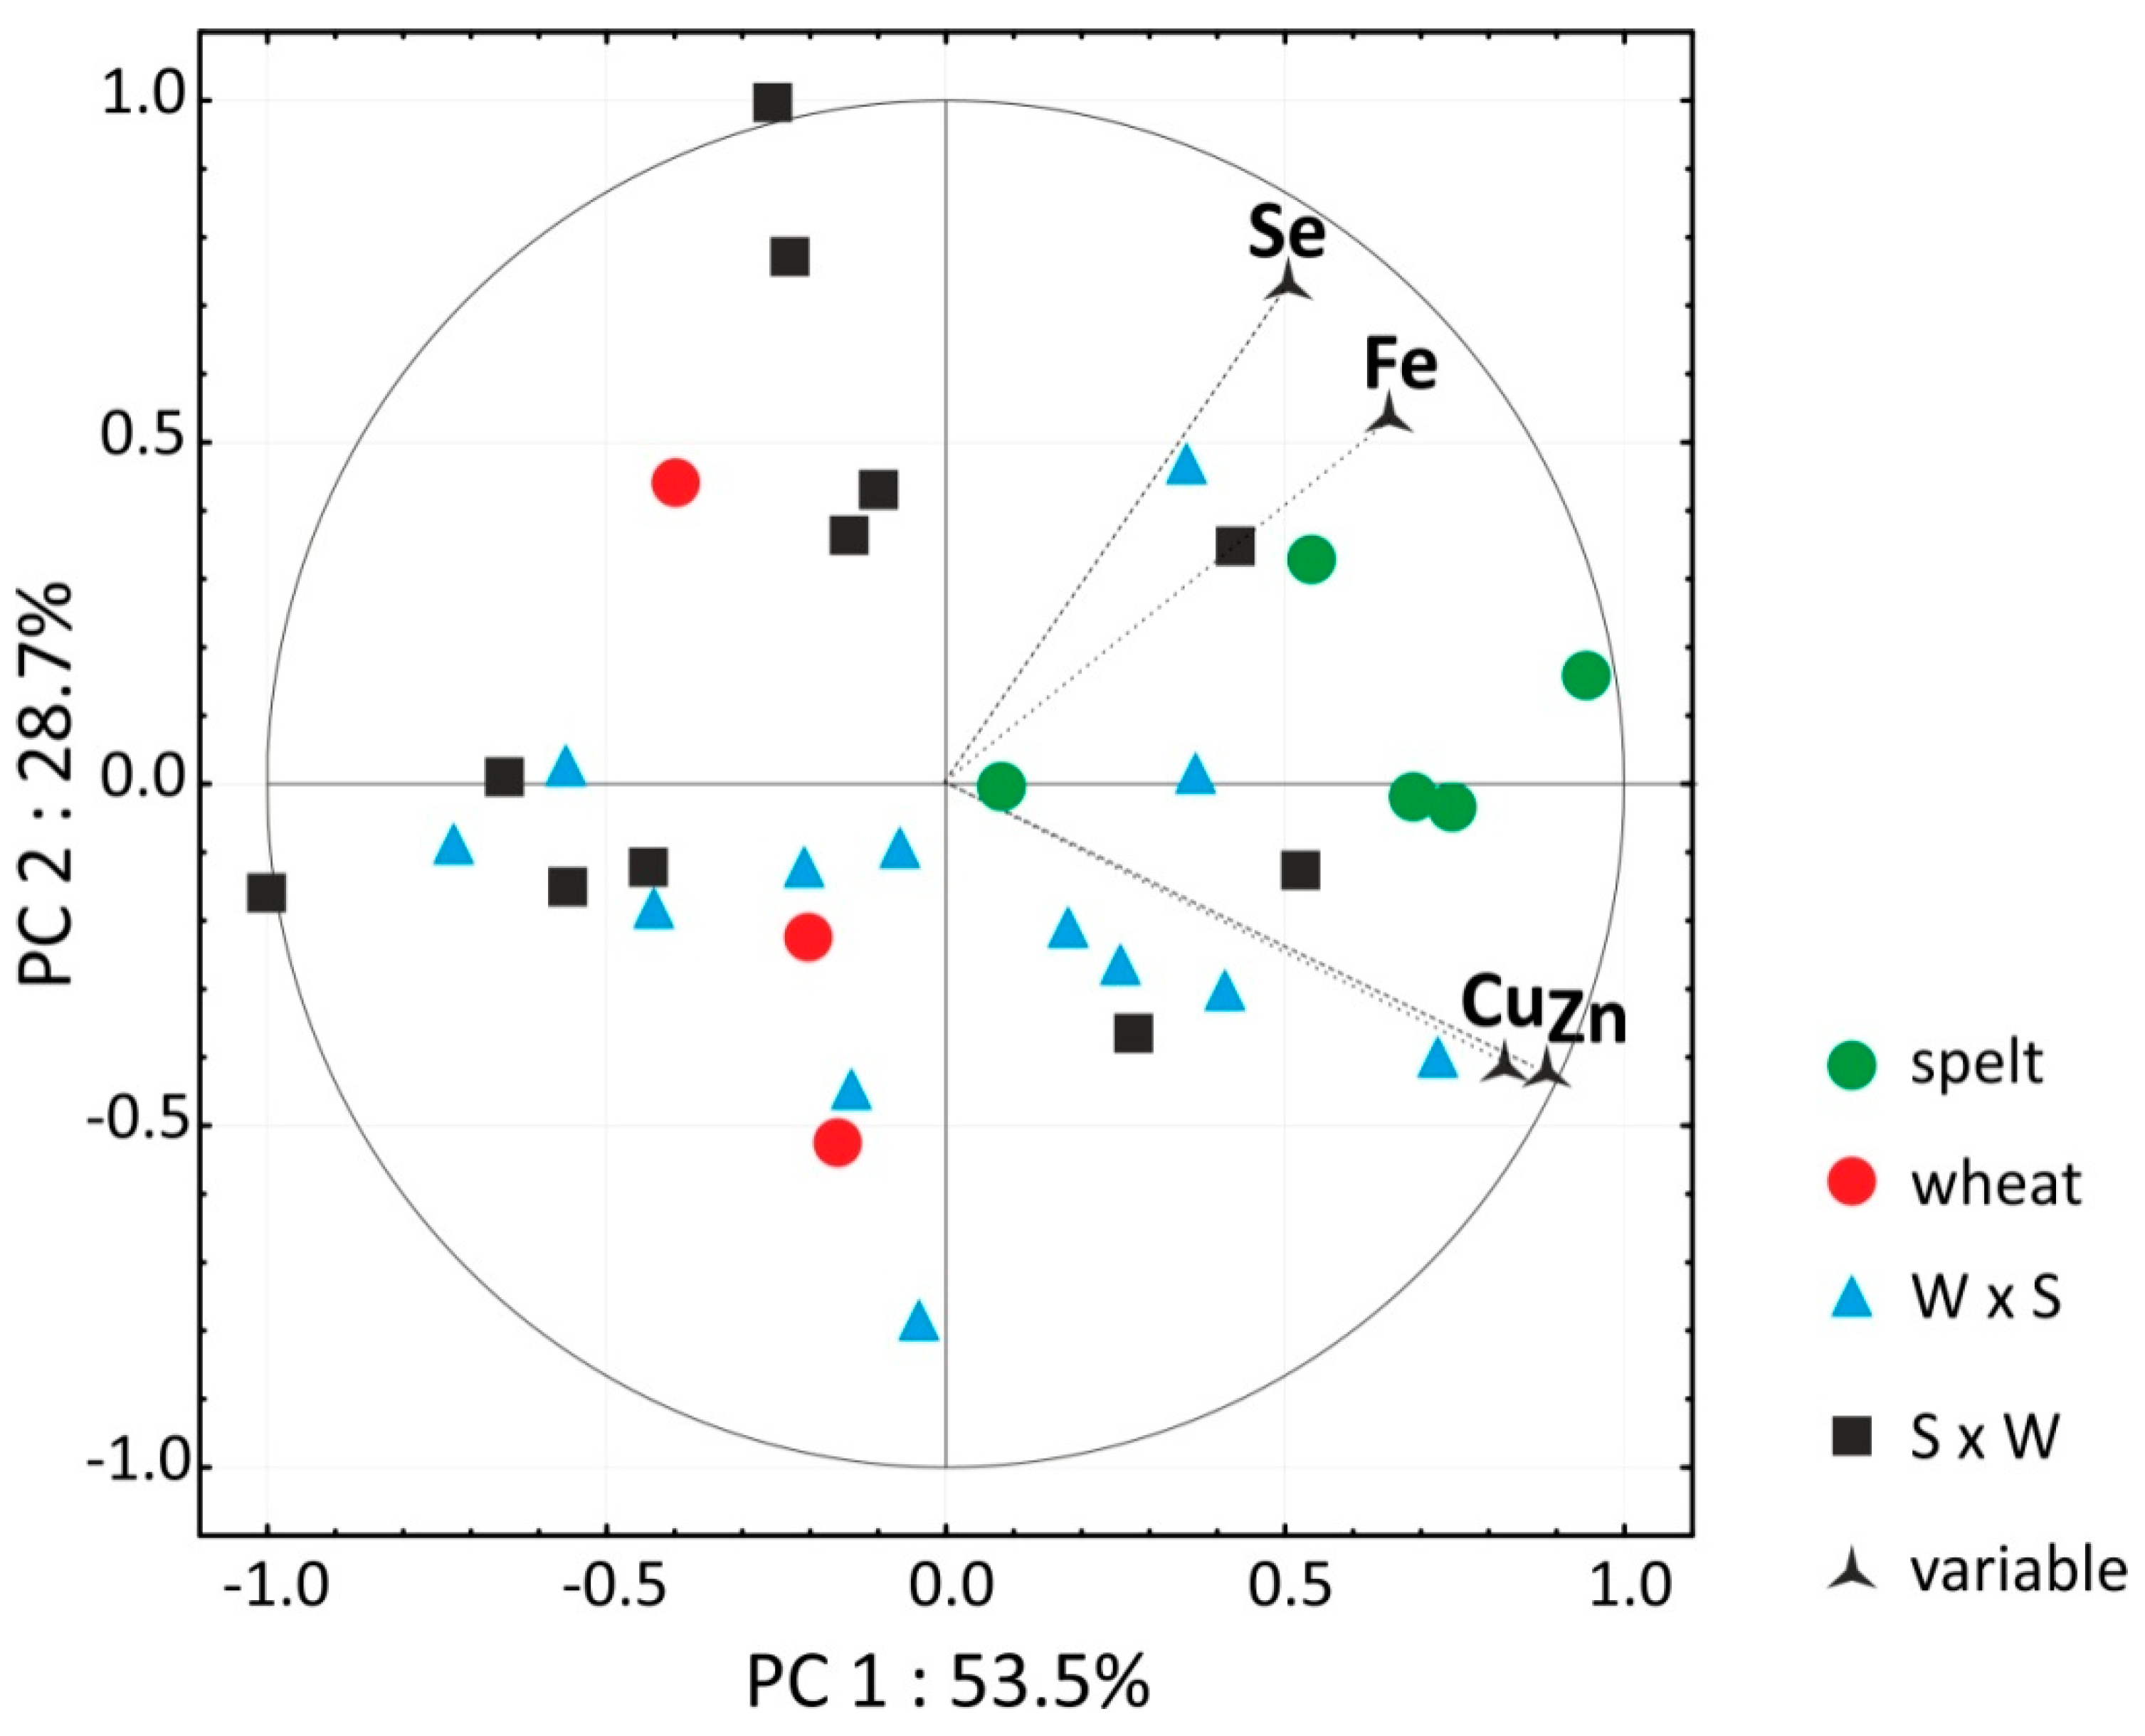
3.4. Micro Element Analysis

Micronutrient concentrations in the grain of the evaluated hybrids and cultivars during the two-year study are presented in Table 5. The contents of health-promoting elements (Fe, Zn, Cu, B, Mn and Se) were always higher in spelt than in bread wheat grain. The proportions of the microelements in hybrid and bread wheat grain fluctuated during the experiment.
Significant differences between years were noted in the levels of Mn, Cu, Sr, Rb, B, Mo and Ni. In the PCA, spelt and bread wheat were clearly discriminated based on the content of the most desirable micro elements, but hybrids were not discriminated based on their parental forms (Figure 3). In most hybrids, the micro element profile of grain was more similar to bread wheat than spelt. It should also be noted that none of the tested hybrids had a more desirable micro element profile than spelt.
The average concentrations of undesirable elements, in particular heavy metals, were very low. Many hybrids, particularly S × W hybrids, were characterized by a more favorable profile of undesirable elements than spelt. Heavy metal (Pb, Sr, Ba, Cd and Ni) levels were very low, and significant differences in this parameter were not observed between hybrids and their parental forms. In most grain samples, the content of Pb and Cd did not exceed 0.005 mg kg−1, and safe levels (0.02mg kg−1 Pb; 0.05 mg kg−1 Cd) [39] were not exceeded in any of the analyzed samples. Only minor fluctuations in aluminum concentration were observed in the study, as demonstrated by the low value of Femp for the analyzed treatments (0.52). Aluminum is associated with the risk of Alzheimer’s disease [40], and its content was low and very similar in all studied wheat forms.
The average contents of macro elements, nutritionally desirable micro elements and undesirable micro elements are presented in Table 6. The contents of the five essential macro elements (K, P, Mg, S and Ca) were significantly the lowest in bread wheat grain (14,600 mg kg−1) and significantly the highest in spelt grain (15,800 mg kg−1) which was also most abundant in desirable micro elements (Fe, Zn, Cu and Se) (total content—79 mg kg−1). The grains of T. spelta and W × S hybrids contained more undesirable micro elements (Al, Pb, Cd, Sr, Ni and Ba) (58 and 52 mg kg−1, respectively) than the grain of bread wheat and S × W hybrids (44 and 42 mg kg−1, respectively). This was confirmed by the PCA result (Figure 4).
No correlations were observed between the content of macro elements, iron, zinc and selenium versus one-kernel weight and yield. The values of the correlation coefficient ranged from −0.212 to 0.198, and were always below the critical value of r = 0.355. Interestingly, significant correlations were noted between the content of zinc and phosphorus (r = 0.537), zinc and sulfur (r = 0.410) and zinc and magnesium (r = 0.403), whereas the correlation between the content of zinc and iron was not significant (r = 0.104). It should also be noted that protein content was bound by significant positive correlations with the content of three macro elements: phosphorus (r = 0.770), sulfur (r = 0.761) and magnesium (r = 0.882), and iron (r = 0.758), zinc (r = 0.642) and selenium (r = 0.383).

4. Discussion

The contents of macronutrients and minerals in the grains of bread wheat and spelt hybrids were analyzed in a two-year study. Spelt is a hulled wheat species whose popularity has been revived in recent years on account of its high nutritional value and high suitability for food production [41]. Dietary deficiencies of minerals, nutrients and vitamins pose a growing problem in human nutrition around the world [42]. The chemical composition of grain is the main determinant of its nutritional value, and it is influenced by both genetic and environmental factors [22]. Despite its unquestioned quality attributes and health benefits, spelt has two main weaknesses; namely, the low threshability of hulled kernels, and considerable susceptibility to lodging [43]. Spelt is closely related to bread wheat, and attempts are being made to cross the two species with the aim of eliminating the above negative traits [44]. The resulting new varieties are characterized by high yields and phenotypic similarity to spelt, but they are not highly popular among breeders and agricultural producers, in particular in organic farms. The main argument against bread wheat and spelt hybrids is that these varieties are devoid of the nutritional and health-promoting benefits of “true spelt.” The proportions of bread wheat genes in such hybrids are difficult to determine because breeders are reluctant to disclose the information about source breeding material. The technological properties of grain of the “new” spelt varieties and “true spelt” are comparable. Hybrid grains and “true spelt” grain are characterized by similar flour strength and similar rheological properties of dough [45]. The nutritional value of spelt and bread wheat hybrids can be accurately determined in studies of genetically stable lines from single crosses between the two cereal species. According to some authors, spelt grain is more abundant in macronutrients, including protein and ash, than bread wheat [26,41,46]. Also in the present study, protein content was nearly 25% higher in T. spelta than in T. aestivum. Regardless of the direction of crossbreeding, protein content was 10%–12% higher in hybrid grains than in bread wheat grain, but it was lower than in spelt grain. The ash content of hybrid grains was higher relative to bread wheat and similar to spelt, which confirms the high nutritional value of hybrids. In hybrid grains, the concentrations of macronutrients were higher than in bread wheat and only somewhat lower than in spelt.
The macro element content of hybrid grains occupied the mid-range of the values noted in the parental species. The greatest differences were noted in phosphorus levels. In bread wheat grain, phosphorus occurs in the form of phytic acid which is regarded as an anti-nutritional factor due to its strong affinity for divalent cations (Ca2+, Mg2+ and Zn2+). However, the high phosphorus content of spelt grain cannot be attributed to an abundance of phytic acid, because spelt contains mostly non-phytate phosphorus [24]. Therefore, hybrid grains are also likely to contain large amounts of non-phytate phosphorus. However, the above observation is highly speculative, and its validation requires further research. The development of new wheat varieties with a higher content of Fe and Zn is highly desirable in order to achieve a significant biological impact on health and nutrition, because Zn deficiency is the ultimate cause of hidden hunger [47]. The parental forms of the studied hybrids differed significantly in concentration of Zn, but the Zn contents of hybrid grains approximated that of bread wheat. Similarly to Fe levels in grain, the absence of significant differences in Zn content between years could point to the low influence of environmental factors and the high impact of genetic variation on the content of both elements. Interestingly, the concentrations of Cu and Mn were significantly affected by the year of the study, as demonstrated by Femp values which were more than 12and 13-fold higher for years than treatments.
Selenium is a trace element with important health-promoting properties. Selenium deficiency can increase the risk of thyroid dysfunction, cancer, severe viral diseases, cardiovascular diseases and inflammation. At least one billion people around the world are affected by Se deficiency [48]. According to Breuer and Longin [49], spelt grain contains around 33% more Se (0.045 mg kg−1) than bread wheat (0.034 mg kg−1) on average. In the current study, Se concentration was nearly 2.5-fold higher in the grain of T. spelta (0.022 mg kg−1) than in bread wheat (0.0079 mg kg−1). There are two reasons why Se concentrations were lower in our study. Firstly, the German researchers studied winter cultivars, which are probably more abundant in Se than spring cultivars because similar differences exist in einkorn and emmer [50]. Secondly, soil Se is highly available for cereals in particular wheat, and the application of sodium selenate fertilizers in soils deficient in this element can increase Se concentration in spring wheat grain by as much as 20–30 fold [51]. The average Se content of hybrid grains was approximately 42% (W × S hybrids) and was 77% (S × W) higher in comparison with bread wheat, and the latter difference was significant. It should also be noted that, similarly to the effect of treatment × year interaction, the difference between years was not significant. The above implies that the Se content of grain in the evaluated treatments was relatively similar in both years. The average Se content of grain was also similar in both years of the experiment.
Despite the fact that spelt and bread wheat share a common evolutionary history and belong to the same species, a recent study by Liu et al. [52] revealed significant differences in their genetic sequence. Therefore, T. spelta could play a huge role in enriching the gene pool of bread wheat. For this reason, spelt has been long used in breeding programs of bread wheat as a source of valuable genes [28,30,53,54]. Significant genetic variation between spelt and bread wheat is highly promising for improving the nutritional value of wheat. Further research is required to identify the molecular markers associated with the high nutrient content of spelt and to enhance spelt and wheat breeding programs.
The presence of significant positive correlations between the contents of protein and six nutritionally desirable elements (P, S, Mg, Fe, Zn and Se) indicates that selective breeding of hybrids for high protein content can be linked with selective breeding for high content of nutritionally desirable elements. Similar correlations in bread wheat were reported by Zhao et al. [5], who observed that both Zn and Fe concentrations in grain were positively and significantly correlated with the contents of protein and P. In the cited study, the correlations with kernel size, kernel weight and bran yield were weak. The above findings are partially consistent with the results of our study, which demonstrated that the protein content and grain yield of the analyzed genotypes were bound by a negative, but a non-significant correlation.
The presented findings should not be used to formulate general conclusions regarding the suitability of bread wheat and spelt hybrids for food production. Nonetheless, our results indicate that the grains of spelt and bread wheat hybrids are generally more abundant in macronutrients, in particular protein, than bread wheat. Most importantly, the yields of certain hybrids, in particular wheat and spelt hybrids, do not differ significantly from that of their parental forms. The above suggests that some of the examined hybrids can be successfully used for breeding high-yielding bread wheat varieties of high nutrient content. However, the concentrations of desirable macro elements and micro elements were significantly lower in hybrid grains than in T. spelta, and only somewhat higher than in bread wheat. These findings suggest that spelt and bread wheat hybrids can constitute promising source material in quality breeding in wheat.
It should also be noted that the yields of breeding lines and varieties are very difficult to determine reliably, because yield is a quantitative trait that is significantly determined by environmental factors. Bread wheat, spelt and their hybrids are self-pollinating plants that are far more sensitive to environmental changes than cross-pollinating crops such as rye. This paper presents the results of a two-year experiment conducted in a single location. Several locations would have to be analyzed in order to evaluate yields reliably. Nitrogen fertilization is one of the most important yield components. The nitrogen fertilizer rates for spring bread wheat (for example, a total rate of 120–160 kg ha−1) are not appropriate for spelt, which is susceptible to lodging and does not respond well to excessive nitrogen supply. Unlike in bread wheat, high rates of nitrogen fertilizer do not induce a significant increase in spelt yield. Therefore, a moderate fertilizer rate was applied in the present study (60 kg ha−1). This rate is not sufficient for bread wheat, but according to our extensive experience, it is the maximum amount of nitrogen that can be applied to spring spelt without retardants. The optimal rate of nitrogen fertilizer for the analyzed hybrids is difficult to determine based on the current state of knowledge.

Supplementary Materials

The following are available online at https://www.mdpi.com/2073-4395/10/1/43/s1, Table S1: Concentrations of elements (µg g−1) in the soil under the field experiment.

Author Contributions

Conceptualization, E.S. and M.W.; methodology, E.S. and W.K.; formal analysis, W.K. and R.K.; writing—original draft preparation, E.S. and M.W.; supervision, R.K. All authors have read and agreed to the published version of the manuscript.

Funding

This research was financially supported by the Ministery of Science and Higher Education in the scopeof the program entitled “Regional Initiative of Excellence” for the years 2019–2022, project number 010/RID/2018/19, amount of funding 12.000.000 PLN.

Acknowledgments

The authors wish to thank Waldemar Lajszner and Łukasz Graban for analysis of macronutrients.

Conflicts of Interest

The authors declare no conflict of interest.

References

  1. The Statistics Portal for Market Data, Market Research and Market Studies. Available online: https://www.statista.com/topics/1668/wheat/ (accessed on 2 November 2019).
  2. North America’s Grain Marketplace. Available online: https://farmlead.com/blog/graincents/april-8-durum-wheat-weekly-graincents-digest/ (accessed on 2 November 2019).
  3. Callejo, M.J.; Vargas-Kostiuk, M.E.; Rodríguez-Quijano, M. Selection, training and validation process of a sensory panel for bread analysis: Influence of cultivar on the quality of breads made from common wheat and spelt wheat. J. Cereal Sci. 2015, 61, 55–62. [Google Scholar] [CrossRef] [Green Version]
  4. Fan, M.S.; Zhao, F.J.; Fairweather-Tait, S.J.; Poulton, P.R.; Dunham, S.J.; McGrath, S.P. Evidence of decreasing mineral density in wheat grain over the last 160 years. J. Trace Elem. Med. Biol. 2008, 22, 315–324. [Google Scholar] [CrossRef] [PubMed]
  5. Zhao, F.J.; Su, Y.H.; Dunham, S.J.; Rakszegi, M.; Bedo, Z.; McGrath, S.P.; Shewry, P.R. Variation in mineral micronutrient concentrations in grain of wheat lines of diverse origin. J. Cereal Sci. 2009, 49, 290–295. [Google Scholar] [CrossRef]
  6. Ward, J.L.; Poutanen, K.; Gebruers, K.; Piironen, V.; Lampi, A.-M.; Nyström, L.; Andersson, A.A.M.; Åman, P.; Boros, D.; Rakszegi, M.; et al. The HEALTHGRAIN cereal diversity screen: Concept, results, and prospects (Conference Paper). J. Agric. Food Chem. 2008, 21, 9699–9709. [Google Scholar] [CrossRef]
  7. Sharma, P.; Aggarwal, P.; Kaur, A. Biofortification: A new approach to eradicate hidden hunger. Food Rev. Int. 2016, 33, 1–21. [Google Scholar] [CrossRef]
  8. WHO. Guidelines on Food Fortification with Micronutrients; World Health Organization: Geneva, Switzerland, 2006. [Google Scholar]
  9. Bouis, H.E.; Welch, R.M. Biofortification—A sustainable agricultural strategy for reducing micronutrient malnutrition in the global south. Crop Sci. 2010, 50, 20–30. [Google Scholar] [CrossRef] [Green Version]
  10. Piergiovanni, A.R.; Rizzi, R.; Pannacciulli, E.; Della Gatta, C. Mineral composition in hulled wheat grains: A comparison between emmer (Triticum dicoccon Schrank) and spelt (T. spelta L.) accessions. Int. J. Food Sci. Nutr. 1997, 4, 381–386. [Google Scholar] [CrossRef]
  11. Tolonen, M. Vitamins and Minerals in Health and Nutrition; Woodhead Publishing Limited: Cambridge, UK, 1990; pp. 148–151. [Google Scholar]
  12. Diaz, J.R.; de Las Cagigas, A.; Rodriguez, R. Micronutrient deficiencies in developing and affluent countries. Eur. J. Clin. Nutr. 2003, 57, 70–72. [Google Scholar] [CrossRef]
  13. Whatham, A.; Bartlett, H.; Eperjesi, F.; Blumenthal, C.; Allen, J.; Suttle, C.; Gaskin, K. Vitamin and mineral deficiencies in the developed world and their effect on the eye and vision. Ophthalmic Physiol. Opt. 2008, 28, 1–12. [Google Scholar] [CrossRef]
  14. Bhullar, N.K.; Gruissem, W. Nutritional enhancement of rice for human health: The contribution of biotechnology. Biotechnol. Adv. 2013, 31, 50–57. [Google Scholar] [CrossRef]
  15. Miller, D.D.; Welch, R.M. Food system strategies for preventing micronutrient malnutrition. ESA Work. Pap. 2013, 13, 1–34. [Google Scholar] [CrossRef] [Green Version]
  16. Quintaes, K.D.; Barberá, R.; Cilla, A. Iron bioavailability in iron-fortified cereal foods: The contribution of in vitro studies. Crit. Rev. Food Sci. Nutr. 2017, 57, 2028–2041. [Google Scholar] [CrossRef] [PubMed]
  17. International Zinc Association. Available online: https://www.zinc.org/publications/ (accessed on 4 October 2019).
  18. Neeraja, C.N.; Kulkarni, K.S.; Madhu Babu, P.; Sanjeeva Rao, D.; Surekha, K.; Ravindra Babu, V. Transporter genes identified in landraces associated with high zinc in polished rice through panicle transcriptome for biofortification. PLoS ONE 2018, 13, e0192362. [Google Scholar]
  19. Velu, G.; Bhattacharjee, R.; Rai, K.N.; Sahrawat, K.L.; Longvah, T. A simple and rapid screening method for grain zinc content in pearl millet. J. SAT Agric. Res. 2018, 6, 1–4. [Google Scholar]
  20. Silva, C.A.; Abreu, A.F.B.; Ramalho, M.A.P. Genetic control of zinc and iron concentration in common bean seeds. Afr. J. Agric. Res. 2013, 8, 1001–1008. [Google Scholar]
  21. Pandey, A.; Khan, M.K.; Hakki, E.E.; Thomas, G.; Hamurcu, M.; Gezgin, S.; Gizlenci, O.; Akkaya, M.S. Assessment of genetic variability for grain nutrients from diverse regions potential for wheat improvement. Springer Plus 2016, 5, 1912. [Google Scholar] [CrossRef] [Green Version]
  22. Biel, W.; Stankowski, S.; Jaroszewska, A.; Pużyński, S.; Bośko, P. The influence of selected agronomic factors on the chemical composition of spelt wheat (Triticum aestivum ssp. spelta L.) grain. J. Integr. Agric. 2016, 15, 1763–1769. [Google Scholar] [CrossRef] [Green Version]
  23. Kohajdová, Z.; Karovicová, J. Nutritional value and baking applications of spelt wheat. Acta Sci. Pol. Technol. Aliment. 2008, 7, 5–14. [Google Scholar]
  24. Ruibal-Mendieta, N.L.; Delacroix, D.L.; Mignolet, J.M.P.; Marques, C.; Rozenberg, R.; Petitjean, G.; Habib-Jiwan, J.L.; Meurens, M.; Qeentin-Leclerco, J.; Delzenne, N.M.; et al. Spelt (Triticum aestivum ssp. spelta) as a source of bread making flours and bran naturally enriched in oleic acid and minerals but not phytic acid. J. Agric. Food Chem. 2005, 53, 2751–2759. [Google Scholar] [CrossRef]
  25. Suchowilska, E.; Wiwart, M.; Kandler, W.; Krska, R. A comparison of macro- and microelement concentrations in the wholegrain of four Triticum species. Plant Soil Environ. 2012, 58, 141–147. [Google Scholar] [CrossRef] [Green Version]
  26. Frakolaki, G.; Giannou, V.; Topakas, E.; Tzia, C. Chemical characterization and bread making potential of spelt versus wheat flour. J. Cereal Sci. 2018, 79, 50–56. [Google Scholar] [CrossRef]
  27. Dvorak, J.; Deal, K.R.; Luo, M.-C.; You, F.M.; von Borstel, K.; Dehghan, H. The Origin of Spelt and Free-Threshing Hexaploid Wheat. J. Hered. 2012, 103, 426–441. [Google Scholar] [CrossRef] [PubMed] [Green Version]
  28. Wiwart, M.; Suchowilska, E.; Lajszner, W.; Graban, Ł. Identification of hybrids of spelt and wheat and their parental forms using shape and color descriptors. Comput. Electron. Agric. 2012, 83, 68–76. [Google Scholar] [CrossRef]
  29. Srinivasa, J.; Arun, B.; Mishra, V.K.; Chand, R.; Sharma, D.; Bhardwaj, S.C.; Joshi, A.K. Accessing spelt gene pool to develop well-adapted Zinc-and Iron-Rich bread wheat. Crop Sci. 2014, 54, 2000–2010. [Google Scholar] [CrossRef]
  30. Cakmak, I. Enrichment of cereal grains with zinc: Agronomic or genetic biofortification? Plant Soil 2008, 302, 1–17. [Google Scholar] [CrossRef]
  31. Schmid, J.E.; Winzeler, M.; Winzeler, H. Analysis of disease resistance and quality characters of F1 hybrids of crosses between wheat (Triticum aestivum) and spelt (Triticum spelta). Euphytica 1994, 75, 105–110. [Google Scholar] [CrossRef]
  32. Gacek, E. Polish National List of Agricultural Varieties; Research Center for Cultivar Testing: Słupia Wielka, Poland, 2013. [Google Scholar]
  33. Witzenberger, A.H.; Hack, H.; van den Boom, T. Erläuterungen zum BBCH-Dezimal-Code für die Entwicklungsstadien des Getreides—mit Abbildungen. Gesunde Pflanz. 1989, 41, 384–388. [Google Scholar]
  34. Wiwart, M.; Suchowilska, E.; Kandler, W.; Sulyok, M.; Groenwald, P.; Krska, R. Can Polish wheat (Triticum polonicum L.) be an interesting gene source for breeding wheat cultivars with increased resistance to Fusarium head blight? Genet. Resour. Crop Evol. 2013, 60, 2359–2373. [Google Scholar] [CrossRef]
  35. Suchowilska, E.; Szafrańska, A.; Słowik, E.; Wiwart, M. Flour from Triticum polonicum L. as a potential ingredient in bread production. Cereal Chem. 2019, 96, 554–563. [Google Scholar] [CrossRef]
  36. Hoseney, R.C. Principles of Cereal Science and Technology; American Association of Cereal Chemists, Ed.; American Association of Cereal Chemists Inc.: StPaul, MN, USA, 1994; pp. 65–79, 87–93. [Google Scholar]
  37. Bieńkowska, T.; Suchowilska, E.; Kandler, W.; Krska, R.; Wiwart, M. Triticum polonicum L. as potential source material for the biofortification of wheat with essential micronutrients. Plant Genet. Resour. 2019, 17, 213–220. [Google Scholar] [CrossRef]
  38. TIBCO Software Inc. Statistica (Data Analysis Software System), version 13. 2017. Available online: http://statistica.io (accessed on 25 December 2019).
  39. European Commission. Commission Regulation (EC) No.1881/2006 of 19 December 2006 setting maximum levels for certain contaminants in food stuffs. Off. J. Eur. Union 2006, 364, 5–24. [Google Scholar]
  40. Rogers, M.A.M.; Simon, D.G. Aluminium intake and risk of Alzheimer’s disease. Age Ageing 1999, 28, 205–209. [Google Scholar] [CrossRef] [PubMed] [Green Version]
  41. Arzani, A.; Ashraf, M. Cultivated ancient wheats (Triticum spp.): A potential source of health-beneficial food products. Compr. Rev. Food Sci. Food Saf. 2017, 16, 477–488. [Google Scholar] [CrossRef] [Green Version]
  42. Gomez-Becerra, H.F.; Erdem, H.; Yazici, A.; Tutus, Y.; Torun, B.; Ozturk, L.; Cakmak, I. Grain concentrations of protein and mineral nutrients in a large collection of spelt wheat grown under different environments. J. Cereal Sci. 2010, 52, 342–349. [Google Scholar] [CrossRef]
  43. Miedaner, T.; Longin, C.F.H. Neglected Cereals: from Ancient Grains to Superfood; Agrimedia: Clenze, Germany, 2016; p. 157. [Google Scholar]
  44. Diordiieva, I.; Riabovol, L.; Riabovol, I.; Serzhyk, O.; Novak, A.; Kotsiuba, S. The characteristics of wheat collection samples created by Triticum aestivum L./Triticum spelta L.hybridization. Agron. Res. 2018, 16, 2005–2015. [Google Scholar]
  45. Wiwart, M.; Szafrańska, A.; Wachowska, U.; Suchowilska, E. Quality Parameters and Rheological Dough Properties of 15 Spelt (Triticum spelta L.) Varieties Cultivated Today. Cereal Chem. 2017, 94, 1037–1044. [Google Scholar]
  46. Rapp, M.; Beck, H.; Gütler, H.; Heilig, W.; Starck, N.; Römer, P.; Cuendet, C.; Kurz, H.; Uhlig, F.; Würschum, T.; et al. Spelt: Agronomy, Quality, and Flavor of Its Breads from 30 Varieties Tested across Multiple Environments. Crop Sci. 2017, 57, 1–9. [Google Scholar] [CrossRef]
  47. Graham, R.D.; Welch, R.M.; Saunders, D.A.; Ortiz-Monasterio, I.; Bouis, H.E.; Bonierbale, M.S.; deHaan, S.; Burgos, G.; Thiele, G.; Liria, R.; et al. Nutritious subsistence food systems. Adv. Agron. 2007, 92, 1–74. [Google Scholar]
  48. Lyons, G.; Stangoulis, J.; Graham, R. High-selenium wheat: Biofortification for better health. Nutr. Res. Rev. 2003, 16, 45–60. [Google Scholar] [CrossRef] [Green Version]
  49. Breuer, F.; Longin, F. Alte Weizenarten. Ein Comeback fast vergessener Kulturpflanzen. Backwarenaktuell 2011, 3, 9–13. [Google Scholar]
  50. Lachman, J.; Miholová, D.; Pivec, V.; Jírů, K.; Janovská, D. Content of phenolic antioxidants and selenium in grain of einkorn (Triticum monococcum), emmer (Triticum dicoccum) and spring wheat (Triticum aestivum) varieties. Plant Soil Environ. 2011, 57, 235–243. [Google Scholar] [CrossRef] [Green Version]
  51. Eurola, M.; Ekholm, P.; Ylinen, M.; Koivistoinen, P.; Varo, P. Effects of selenium fertilization on the selenium content of cereal grains, flour, and bread produced in Finland. Cereal Chem. 1990, 67, 334–337. [Google Scholar]
  52. Liu, M.; Zhao, Q.; Qi, F.; Stiller, J.; Tang, S.; Miao, J.; Vrána, J.; Holušová, K.; Liu, D.; Doležel, J.; et al. Sequence divergence between spelt and common wheat. Theor. Appl. Genet. 2018, 131, 1125–1132. [Google Scholar] [CrossRef] [PubMed]
  53. Zanetti, S.; Winzeler, M.; Keller, M.; Keller, B.; Messmer, M. Genetic analysis of pre-harvest sprouting resistance in a wheat x spelt cross. Crop Sci. 2000, 40, 1406–1417. [Google Scholar] [CrossRef]
  54. Sakai, Y.; Cao, L.; Funata, R.; Shiraishi, T.; Yoshikawa, K.; Maeno, K.; Miura, H.; Onishi, K. QTLs for agronomic traits detected in recombinant inbred lines derived from a bread wheat × spelt cross. Breed. Sci. 2018, 68, 587–595. [Google Scholar] [CrossRef] [Green Version]
Figure 1. Biplot presenting principal component analysis (PCA) results for macronutrient content in the grain of thestudied cereals. Fi—fiber; Fa—fat; A—Ash; P—protein. W × S—wheat × spelt; S × W—spelt × wheat.
Agronomy 10 00043 g001
Figure 2. Biplot presenting PCA results for the contents of the five macro elements in the grains of the studied cereals. W × S—wheat × spelt; S × W—spelt × wheat.
Agronomy 10 00043 g002
Figure 3. Biplot presenting PCA results for the contents of four desirable micro elements in the grain of the studied cereals. W × S—wheat × spelt; S × W—spelt × wheat.
Agronomy 10 00043 g003
Figure 4. Biplot presenting PCA results for the contents of six undesirable microelements in the grain of the studied cereals. W × S—wheat × spelt; S × W—spelt × wheat hybrids.
Agronomy 10 00043 g004
Table 1. Hybrids and their parental forms analyzed in the study.
NoParentNoHybridNoHybridNoHybrid
1S101Torka × S109Kontesa × S1417S13 × Torka
2S112Torka × S1110Zebra × S1018S14 × Torka
3S123Torka × S1211Zebra × S1119S10 × Kontesa
4S134Torka × S1412Zebra × S1220S11 × Kontesa
5S145Kontesa × S1013Zebra × S1421S12 × Kontesa
6Torka6Kontesa × S1114S10 × Torka22S13 × Kontesa
7Kontesa7Kontesa × S1215S11 × Torka23S14 × Kontesa
8Zebra8Kontesa × S1316S12 × Torka
Table 2. Mean values (±standard deviations) of spike length, spike density, kernel number per spike, kernel weight per spike, one-kernel weight and the yield of the examined hybrids and their parental forms in two years of the experiment.
SL (cm)DKNSKWS (g)OKW (mg)Yield (t ha−1)
Spelt (n = 5)12.16 a ± 1.4614.41 c ± 1.0923.41 c ± 0.930.92 c ± 0.1039.11 ± 3.794.48 a ± 0.57
Wheat (n = 3)9.40 b ± 0.6421.07 a ± 0.9040.39 a ± 0.651.67 a ± 0.1041.06 ± 2.575.98 a ± 0.44
W × S (n = 13)9.92 b ± 0.7818.02 b ± 1.0229.85 b ± 2.001.24 b ± 0.0641.74 ± 2.454.31 ab ± 0.59
S × W (n = 10)10.21 b ± 1.8818.11 b ± 2.2529.83 b ± 2.601.25 b ± 0.1441.81 ± 3.194.02 b ± 0.62
SL—spike length; D—spike density (number of spikelets per 10 cm of the spike length); KNS—kernel number per spike; KWS—kernel weight per spike; OKW—one-kernel weight. —expressed as the yield of dehulled kernels for spelt and hybrids. W × S—wheat × spelt; S × W—spelt × wheat; a,b—mean values followed by the same letter do not differ significantly within a column at p < 0.05.
Table 3. The content of ash, dietary fiber, crude protein and crude fat (in percent of dry matter) in the grains of the hybrids and their parental forms in 2014 and 2015.
AshCrude FiberCrude ProteinCrude Fat
20142015Mean20142015Mean20142015Mean20142015Mean
Spelt (n = 5)2.15 v1.87 v–y2.01 a2.23 y2.28 y2.25 b15.6013.7414.67 a2.37 xy2.12 y2.24 ab
Wheat (n = 3)1.88 v–y1.36 z1.62 b2.85 x2.35 xy2.60 a12.1711.3311.75 c2.07 y2.18 y2.12 b
W × S (n = 13)2.04 vx1.77 y1.90 a2.79 x2.31 y2.55 a13.7212.2312.97 b2.18 y2.27 y2.22 b
S × W (n = 10)1.98 vx1.87 v–y1.93 a2.80 x2.57 xy2.68 a14.3012.0713.19 b2.44 x2.32 y2.38 a
Mean (n = 31)2.02 A1.78 B 2.71 A2.39 B 14.06 A12.34 B 2.282.25
F values for:
Cereals (C)F(3,54) = 69.37F(3,54) = 17.00F(3,54) = 34.69F(3,54) = 4.77
Years (Y)F(1,54) = 14.11F(1,54) = 7.53F(1,54) = 14.23F(1,54) = 0.62
Interaction (CxY)F(3,54) = 5.05F(3,54) = 3.61F(3,54) = 1.15F(3,54) = 3.01
W × S—wheat × spelt, S × W—spelt × wheat; a,b—mean values calculated for two years followed by the same letter do not differ significantly within a column (objects) at p < 0.05,v–z mean values followed by the same letter do not differ significantly within a columns and rows (interaction) at p < 0.05, A,B-difference between general means for 2014 and 2015 significant at p < 0.05.
Table 4. Mean contents of potassium phosphorus, sulfur, magnesium and calcium (mg kg−1) in the grains of hybrids between bread wheat and spelt in relation to their parental forms.
K (103)P (103)S (103)Mg (103)Ca (102)
Year20142015Mean20142015Mean20142015Mean20142015Mean20142015Mean
Spelt (n = 5)4.964.564.764.204.994.47 a1.651.911.71 a1.331.491.41 a3.493.443.47
Wheat (n = 3)5.064.594.823.394.033.72 c1.321.511.39 c1.121.311.24 b3.383.453.42
W × S (n = 13)5.044.534.783.784.574.15 b1.471.641.50 b1.281.401.34 ab3.703.813.76
S × W (n = 10)4.944.704.823.894.574.16 b1.451.671.49 b1.291.401.35 ab3.693.243.47
mean (n = 31)5.00 A4.60 B4.793.85 B4.59 A4.161.48 B1.68 A1.521.28 B1.41 A1.343.633.533.59
F values for:
Cereals(C)F(3,54) = 0.16F(3,54) = 5.97F(3,54) = 10.09F(3,54) = 2.95F(3,54) = 2.67
Years (Y)F(1,54) = 25.49F(1,54) = 45.63F(1,54) = 17.53F(1,54) = 15.29F(1,54) = 0.47
Interaction (C × Y)F(3,54) = 0.97F(3,54) = 0.72F(3,54) = 0.73F(3,54) = 0.11F(3,54) = 1.92
SEW (n = 23)0.2330.0870.4410.3370.395
SEK (n = 23)1.4470.4441.4591.7381.730
SEW, SEK—standard error of skewness and kurtosis, respectively; all other designations as in Table 3.
Table 5. Mean contents of the studied micro elements (mg kg−1) in the grains of hybrids between bread wheat and spelt in relation to their parental forms.
Fe (101)Zn (101)Mn (101)CuNa
Year20142015Mean20142015Mean20142015Mean20142015Mean20142015Mean
Spelt (n = 5)4.464.124.28 a3.24 x3.24 x3.24 a3.132.232.67 a3.474.934.20 a7.167.387.27
Wheat (n = 3)3.713.883.79 ab3.14 x2.28 v2.70 b2.762.052.41 ab2.354.283.31 bc7.537.517.52
W × S (n = 13)3.573.783.67 b3.05 xy2.84 v2.94 ab2.651.852.25 b2.944.603.77 ab7.957.717.83
S × W (n = 10)4.183.753.96 ab2.43 yv2.71 v2.56 b2.582.012.29 ab2.683.883.28 c7.448.137.79
mean (n = 31)3.923.83 2.892.81 2.72 A1.98 B 2.88 A4.39 B 7.627.77
F values for:Cereals (C)F(3,54) = 3.05F(3,54) = 7.47F(3,54) = 2.85F(3,54 ) = 7.62F(3,54) = 1.08
Years (Y)F(1,54) = 0.36F(1,54) = 2.75F(1,54) = 38.07F(1,54) = 93.11F(1,54) = 0.372
Int. (C × Y)F(3,54) = 1.49F(3,54) = 3.58F(3,54) = 0.48F(3,54) = 1.02F(3,54) = 1.00
SEW (n = 23)0.1660.209−0.391−0.6140.306
SEK (n = 23)2.3101.450−0.8200.3451.542
AlSrRbBaB (10−1)
Year20142015Mean20142015Mean20142015Mean20142015Mean20142015Mean
Spelt (n = 5)0.701.591.151.541.871.702.411.712.062.942.522.730.620.720.67 a
Wheat (n = 3)0.891.381.141.211.561.394.341.252.791.511.831.670.530.650.59 ab
W × S (n = 13)1.131.031.081.321.871.593.371.102.242.212.862.540.590.700.65 a
S × W (n = 10)1.211.241.231.041.351.193.031.272.151.521.851.680.490.650.57 b
mean (n = 31)1.061.22 1.25 B1.67 A 3.20 A1.27 B 2.042.38 0.56 B0.68 A
F values for:Cereals (C)F(3,54) = 0.52F(3,54) = 4.97F(3,54) = 0.57F(3,54) = 4.55F(3,54) = 4.74
Years (Y)F(1,54) = 3.49F(1,54) = 0.94F(1,54) = 31.13F(1,54) = 0.61F(1,54) = 26.44
Int. (CxY)F(3,54) = 2.53F(3,54) = 0.40F(3,54) = 1.59F(3,54) = 0.75F(3,54) = 0.42
SEW (n = 23)0.155−0.349−0.184−0.1020.270
SEK (n = 23)1.4490.1671.5210.6421.642
Mo (·10−1)Ni (·10−1)Cd (·10−2)Se (·10−2)Pb (·10−3)
Year20142015Mean20142015Mean20142015Mean20142015Mean20142015Mean
Spelt (n = 5)2.98 x–z4.08 x–z3.53 b2.41 x1.19 yz1.79 a7.995.466.732.701.702.20 a3.034.893.95
Wheat (n = 3)2.03 yz6.15 vx4.09 ab2.51 x0.67 z1.59 ab4.943.564.250.650.930.79 c1.723.312.51
W × S (n = 13)2.85 yz7.41 v5.13 a1.75 xy0.66 z1.20 bc4.294.534.411.270.971.12 bc2.592.102.34
S × W (n = 10)3.57 x–z4.81 xy4.19 ab1.13 yz0.73 z0.92 c3.534.554.041.850.951.40 b2.643.953.30
mean (n = 31)3.02 B5.91 A 1.73 A0.81 B 4.704.59 1.631.08 2.593.26
F values for:Cereals(C)F(3,54) = 3.59F(3,54) = 8.77F(3,54) = 1.83F(3,54) = 4.09F(3,54) = 1.27
Years (Y)F(1,54) = 40.77F(1,54) = 65.68F(1,54) = 3.30F(1,54) = 3.03F(1,54) = 2.09
Int. (C × Y)F(3,54) = 6.72F(3,54) = 4.49F(3,54) = 2.43F(3,54) = 0.98F(3,54) = 0.84
SEW (n = 23)−0.344−0.5520.280−0.542−2.305
SEK (n = 23)−0.314−1.2431.8700.722−6.627
All designations as in Table 4.
Table 6. The average content (mg kg−1) of macro elements, nutritionally desirable micro elements and undesirable micro elements in the grain of the studied cereals in the two-year experiment.
Macro Elements (103)Micro Elements (101)
DesirableUndesirable
Spelt (n = 5)15.8 a7.9 a5.8 a
Wheat (n = 3)14.6 b6.8 b4.4 b
W × S (n = 13)15.5 ab6.9 b5.2 ab
S × W (n = 10)15.3 ab6.9 b4.2 b
mean (n = 31)15.47.14.9
Macro elements—sum of K, P, S, Mg and Ca; desirable micro elements—sum of Fe, Zn, Cu and Se; undesirable micro elements—sum of Cd, Pb, Sr, Ba, Ni and Al; a,b—mean values followed by the same letter do not differ significantly within a column at p < 0.01.

