
Preparation and Chromatographic Application of β-Cyclodextrin Molecularly Imprinted Microspheres for Paeoniflorin


Abstract
:
1. Introduction
2. Experimental
2.1. Instruments and Reagents
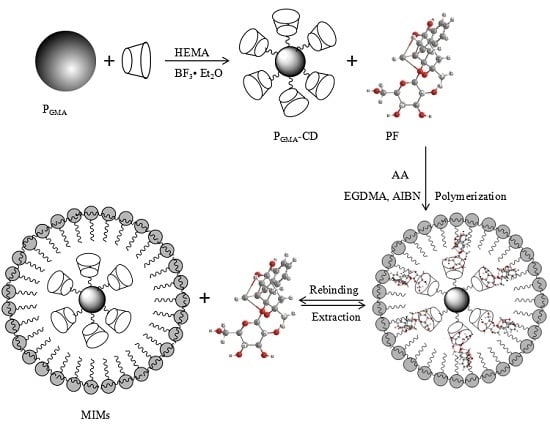
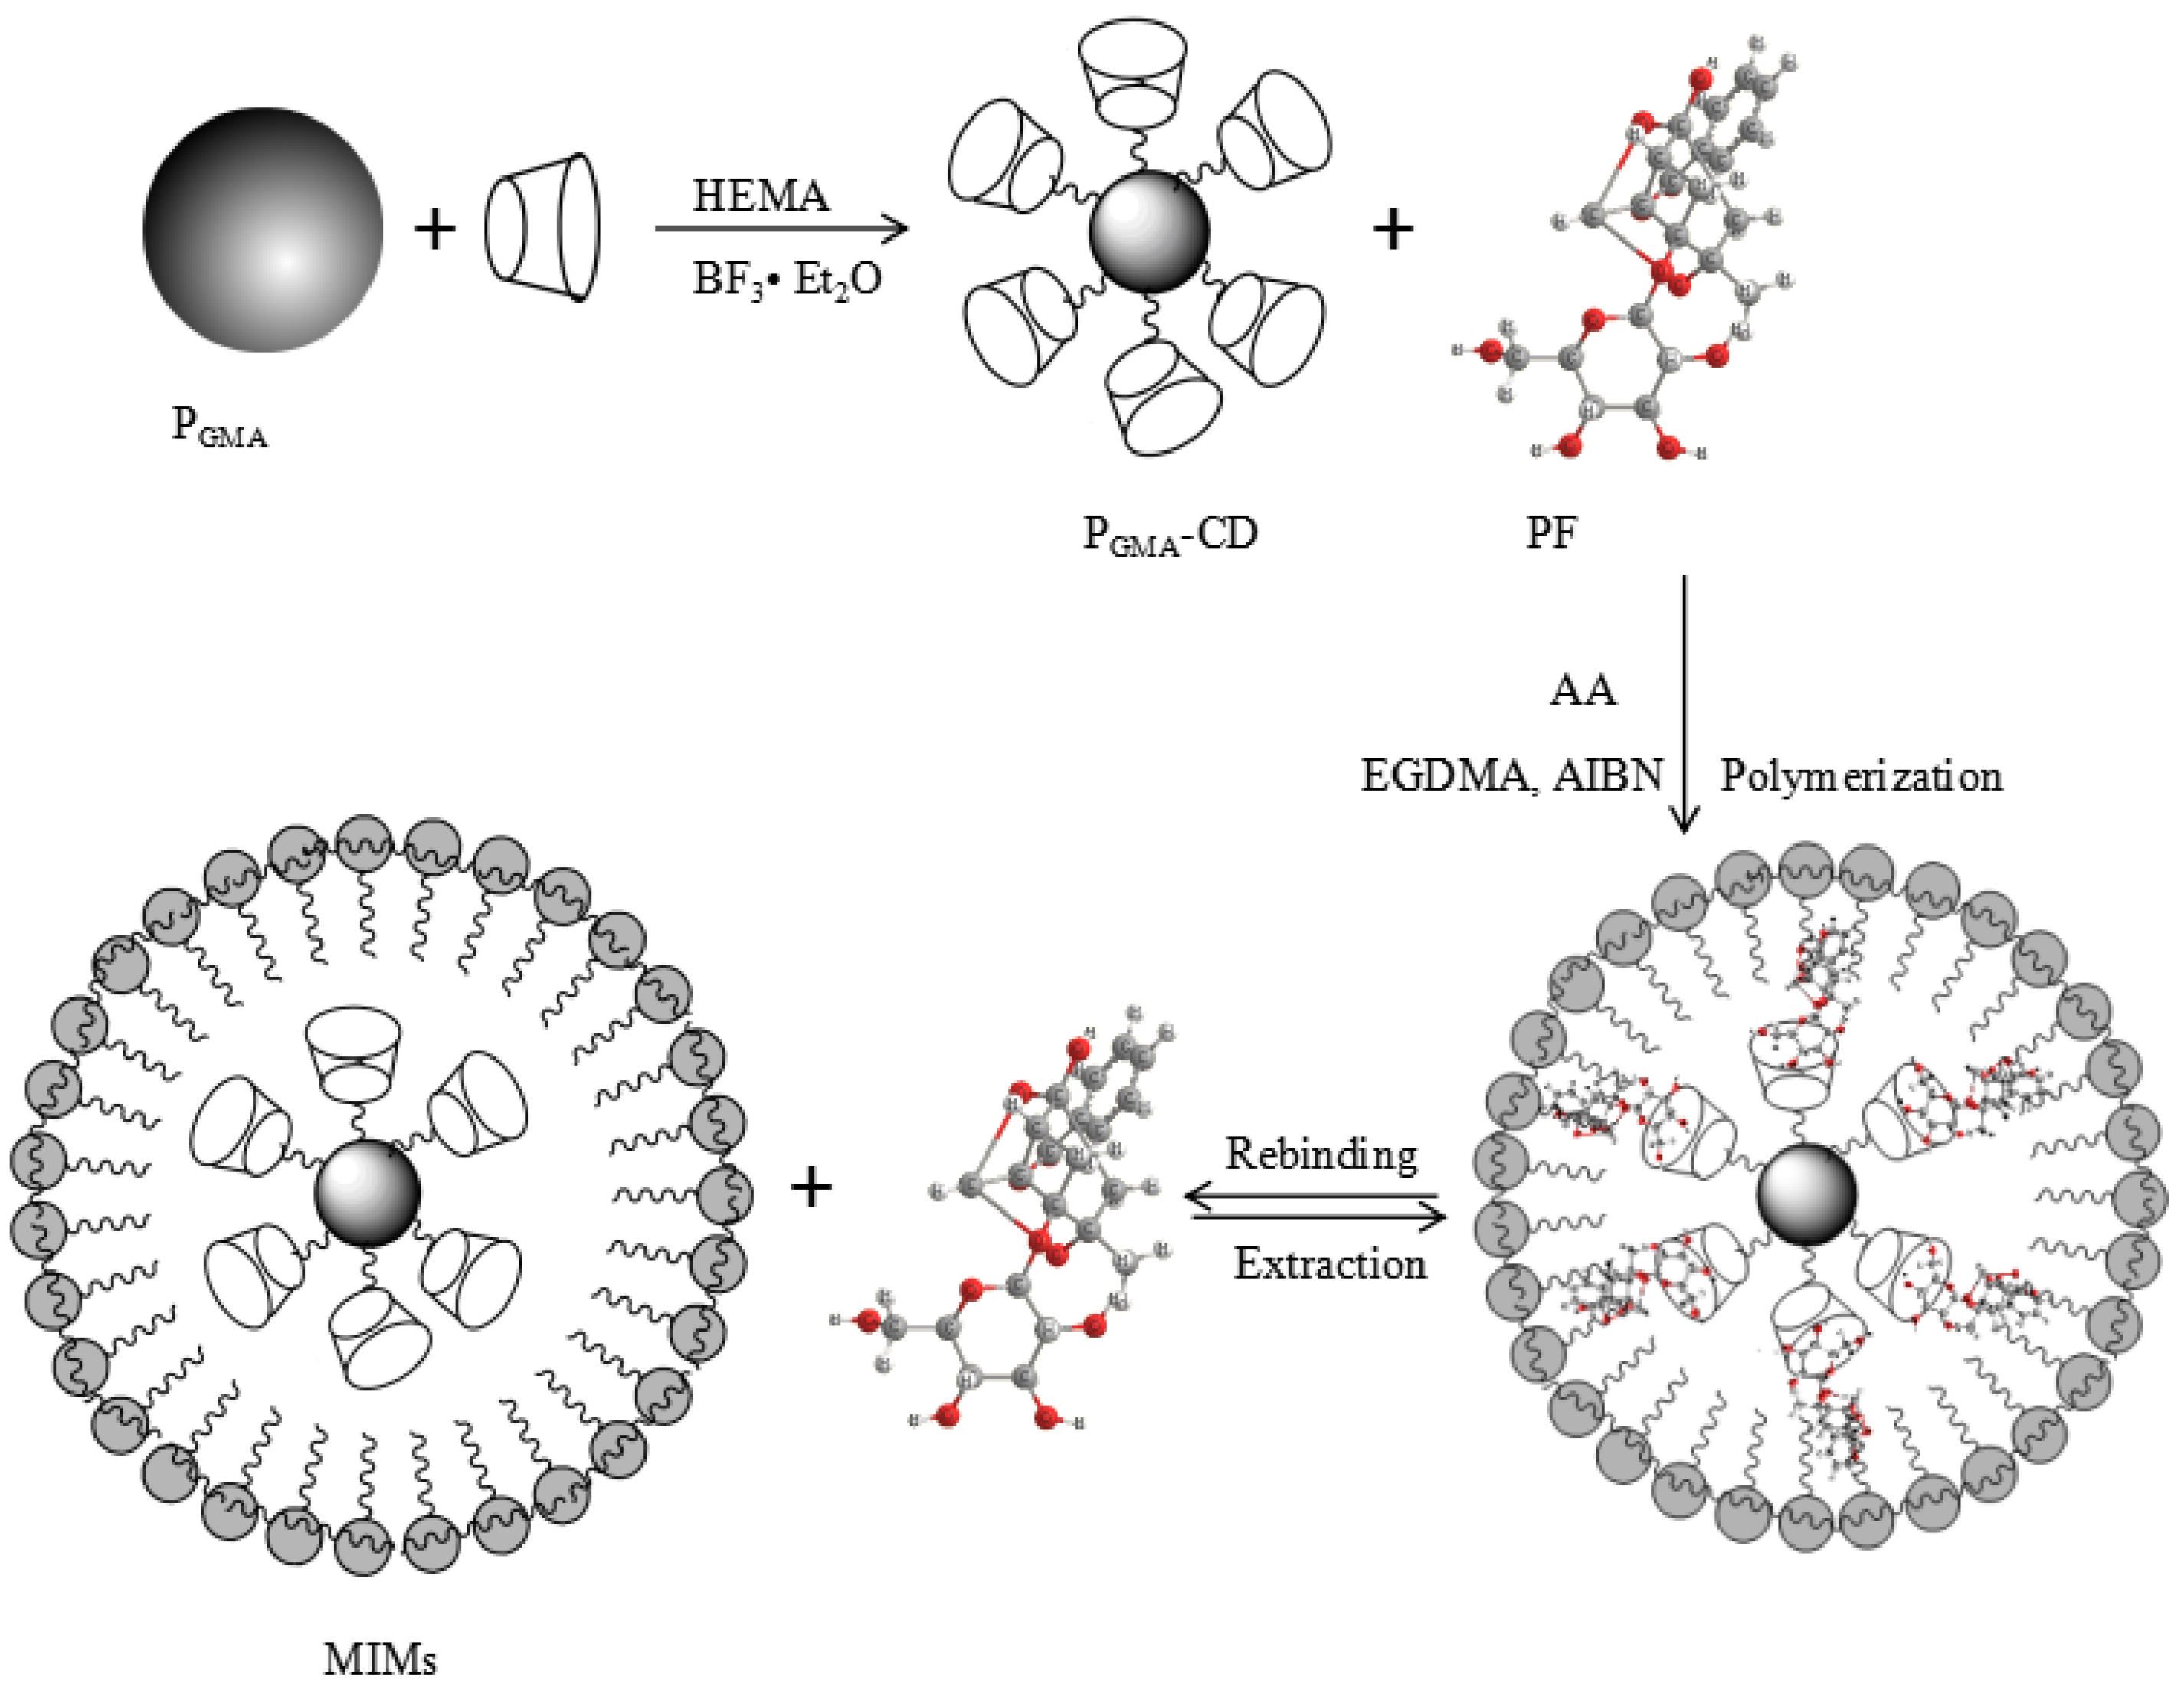
2.2. Synthesis of MIMs
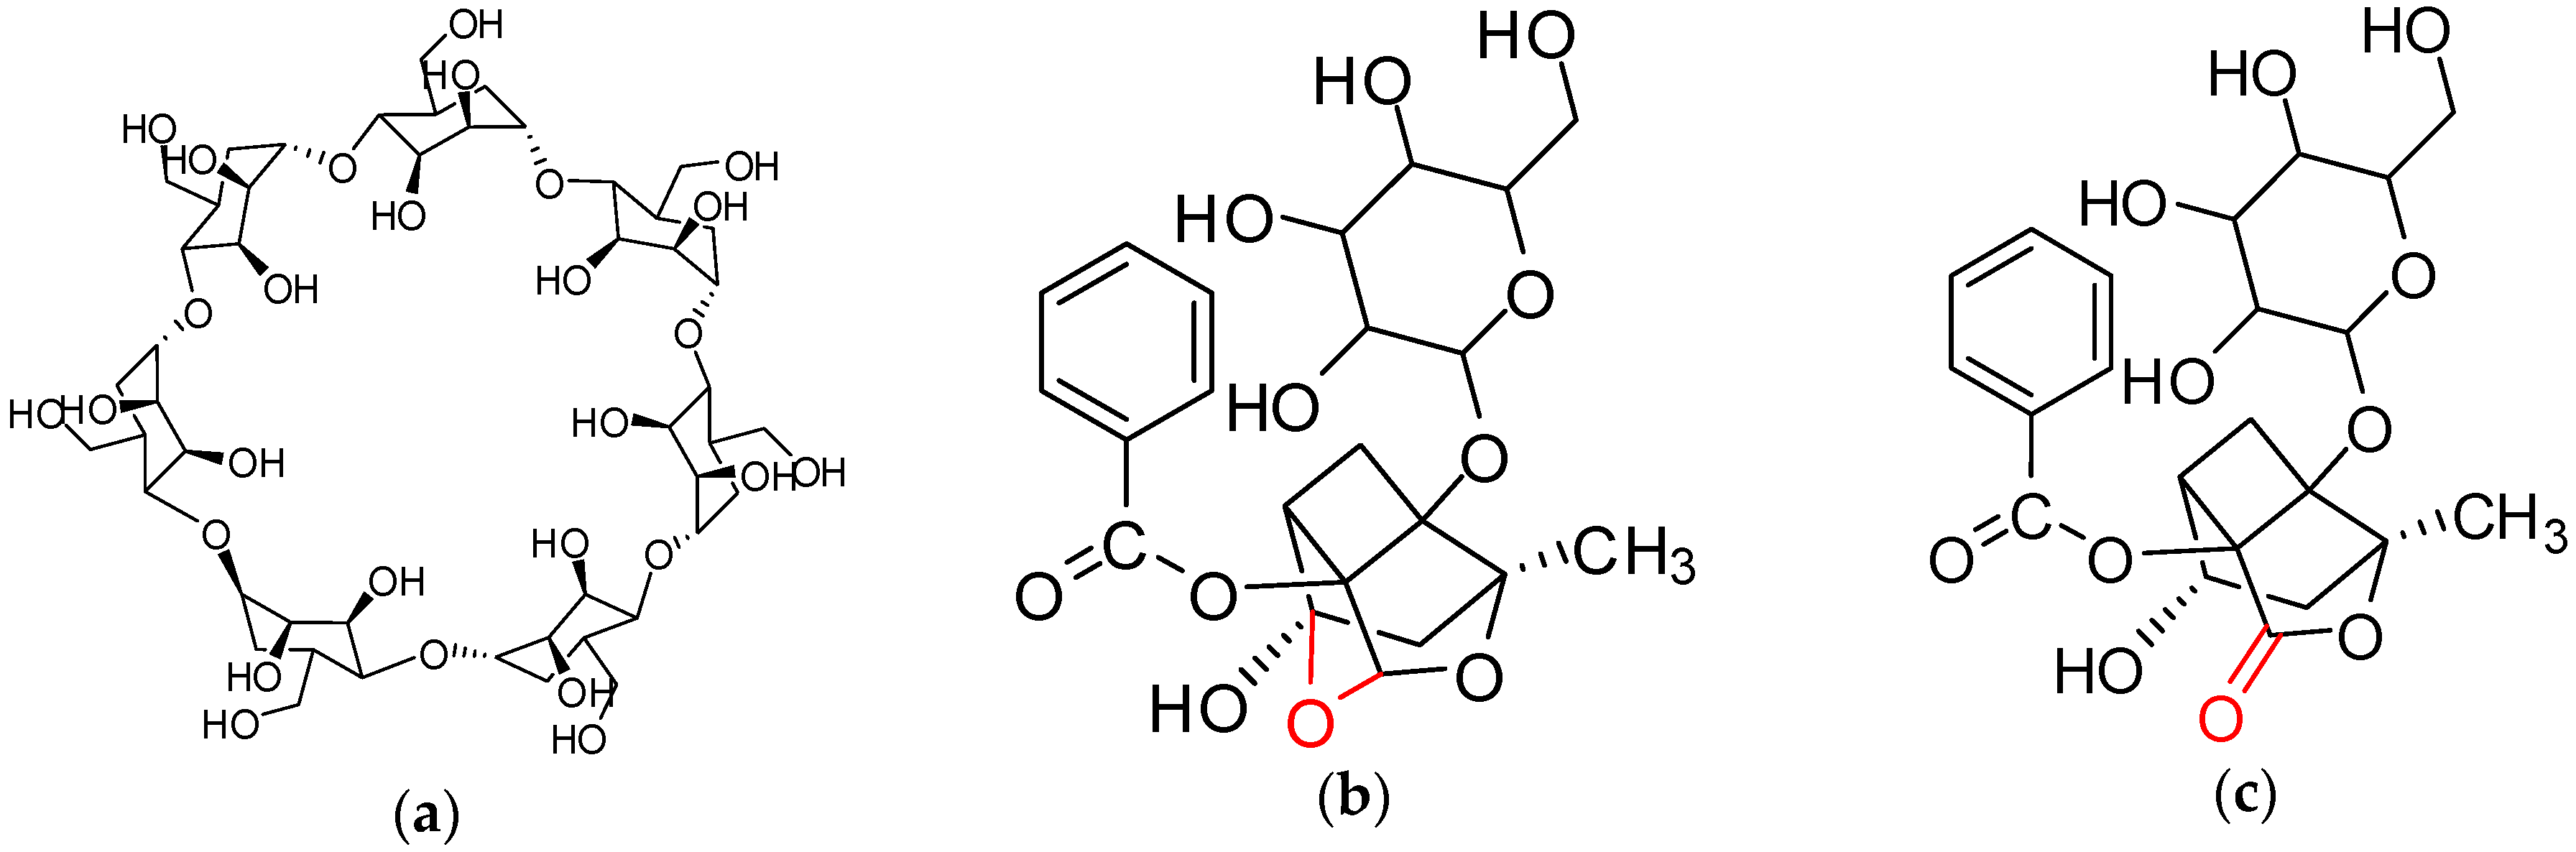
2.2.1. Synthesis of PGMA-CD
2.2.2. Synthesis of MIMs
2.3. Adsorption Experiments
2.4. Chromatographic Experiments
3. Results and Discussion
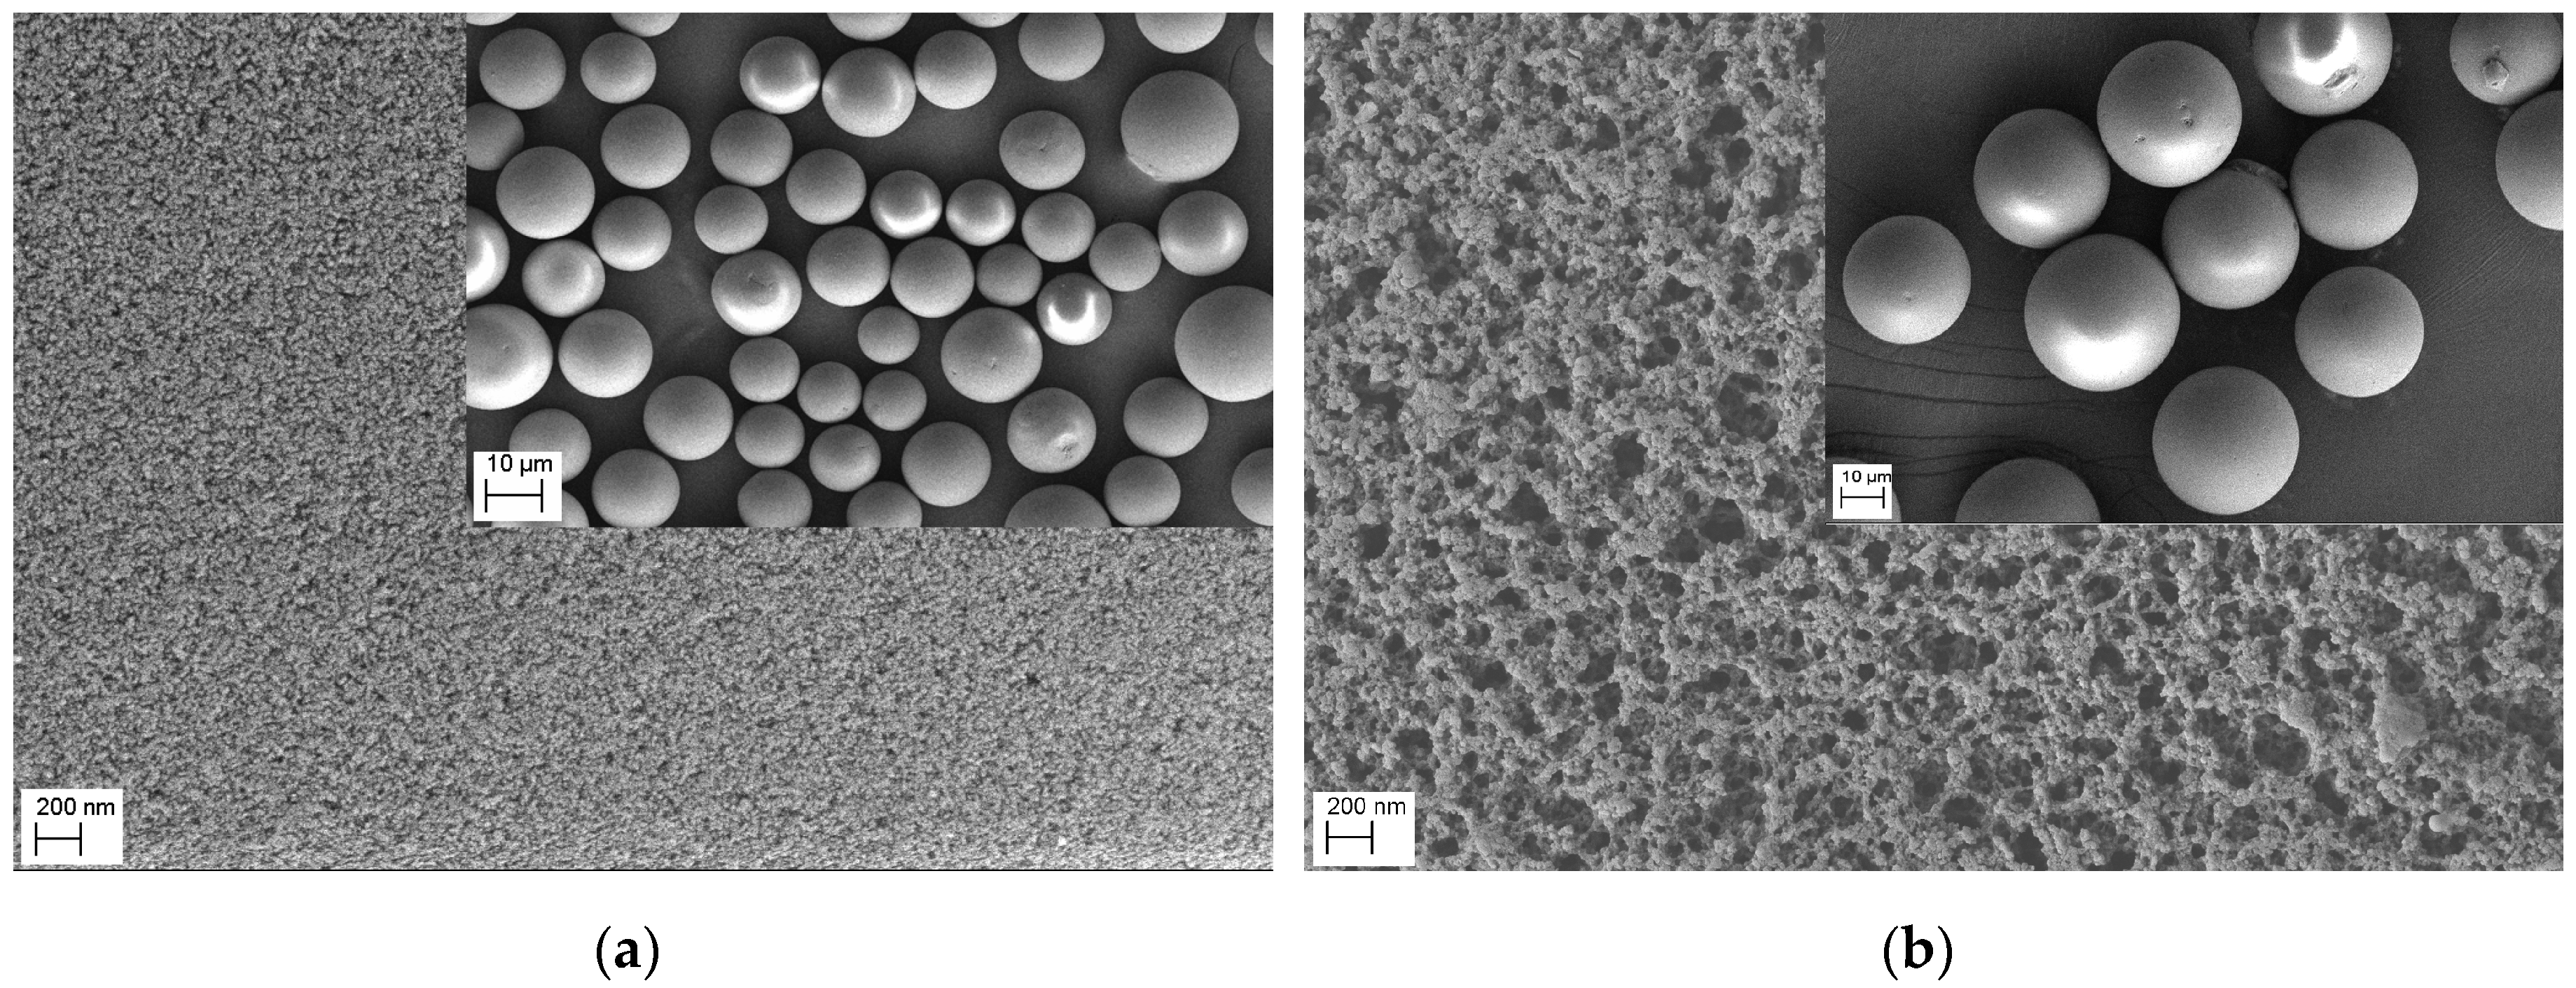
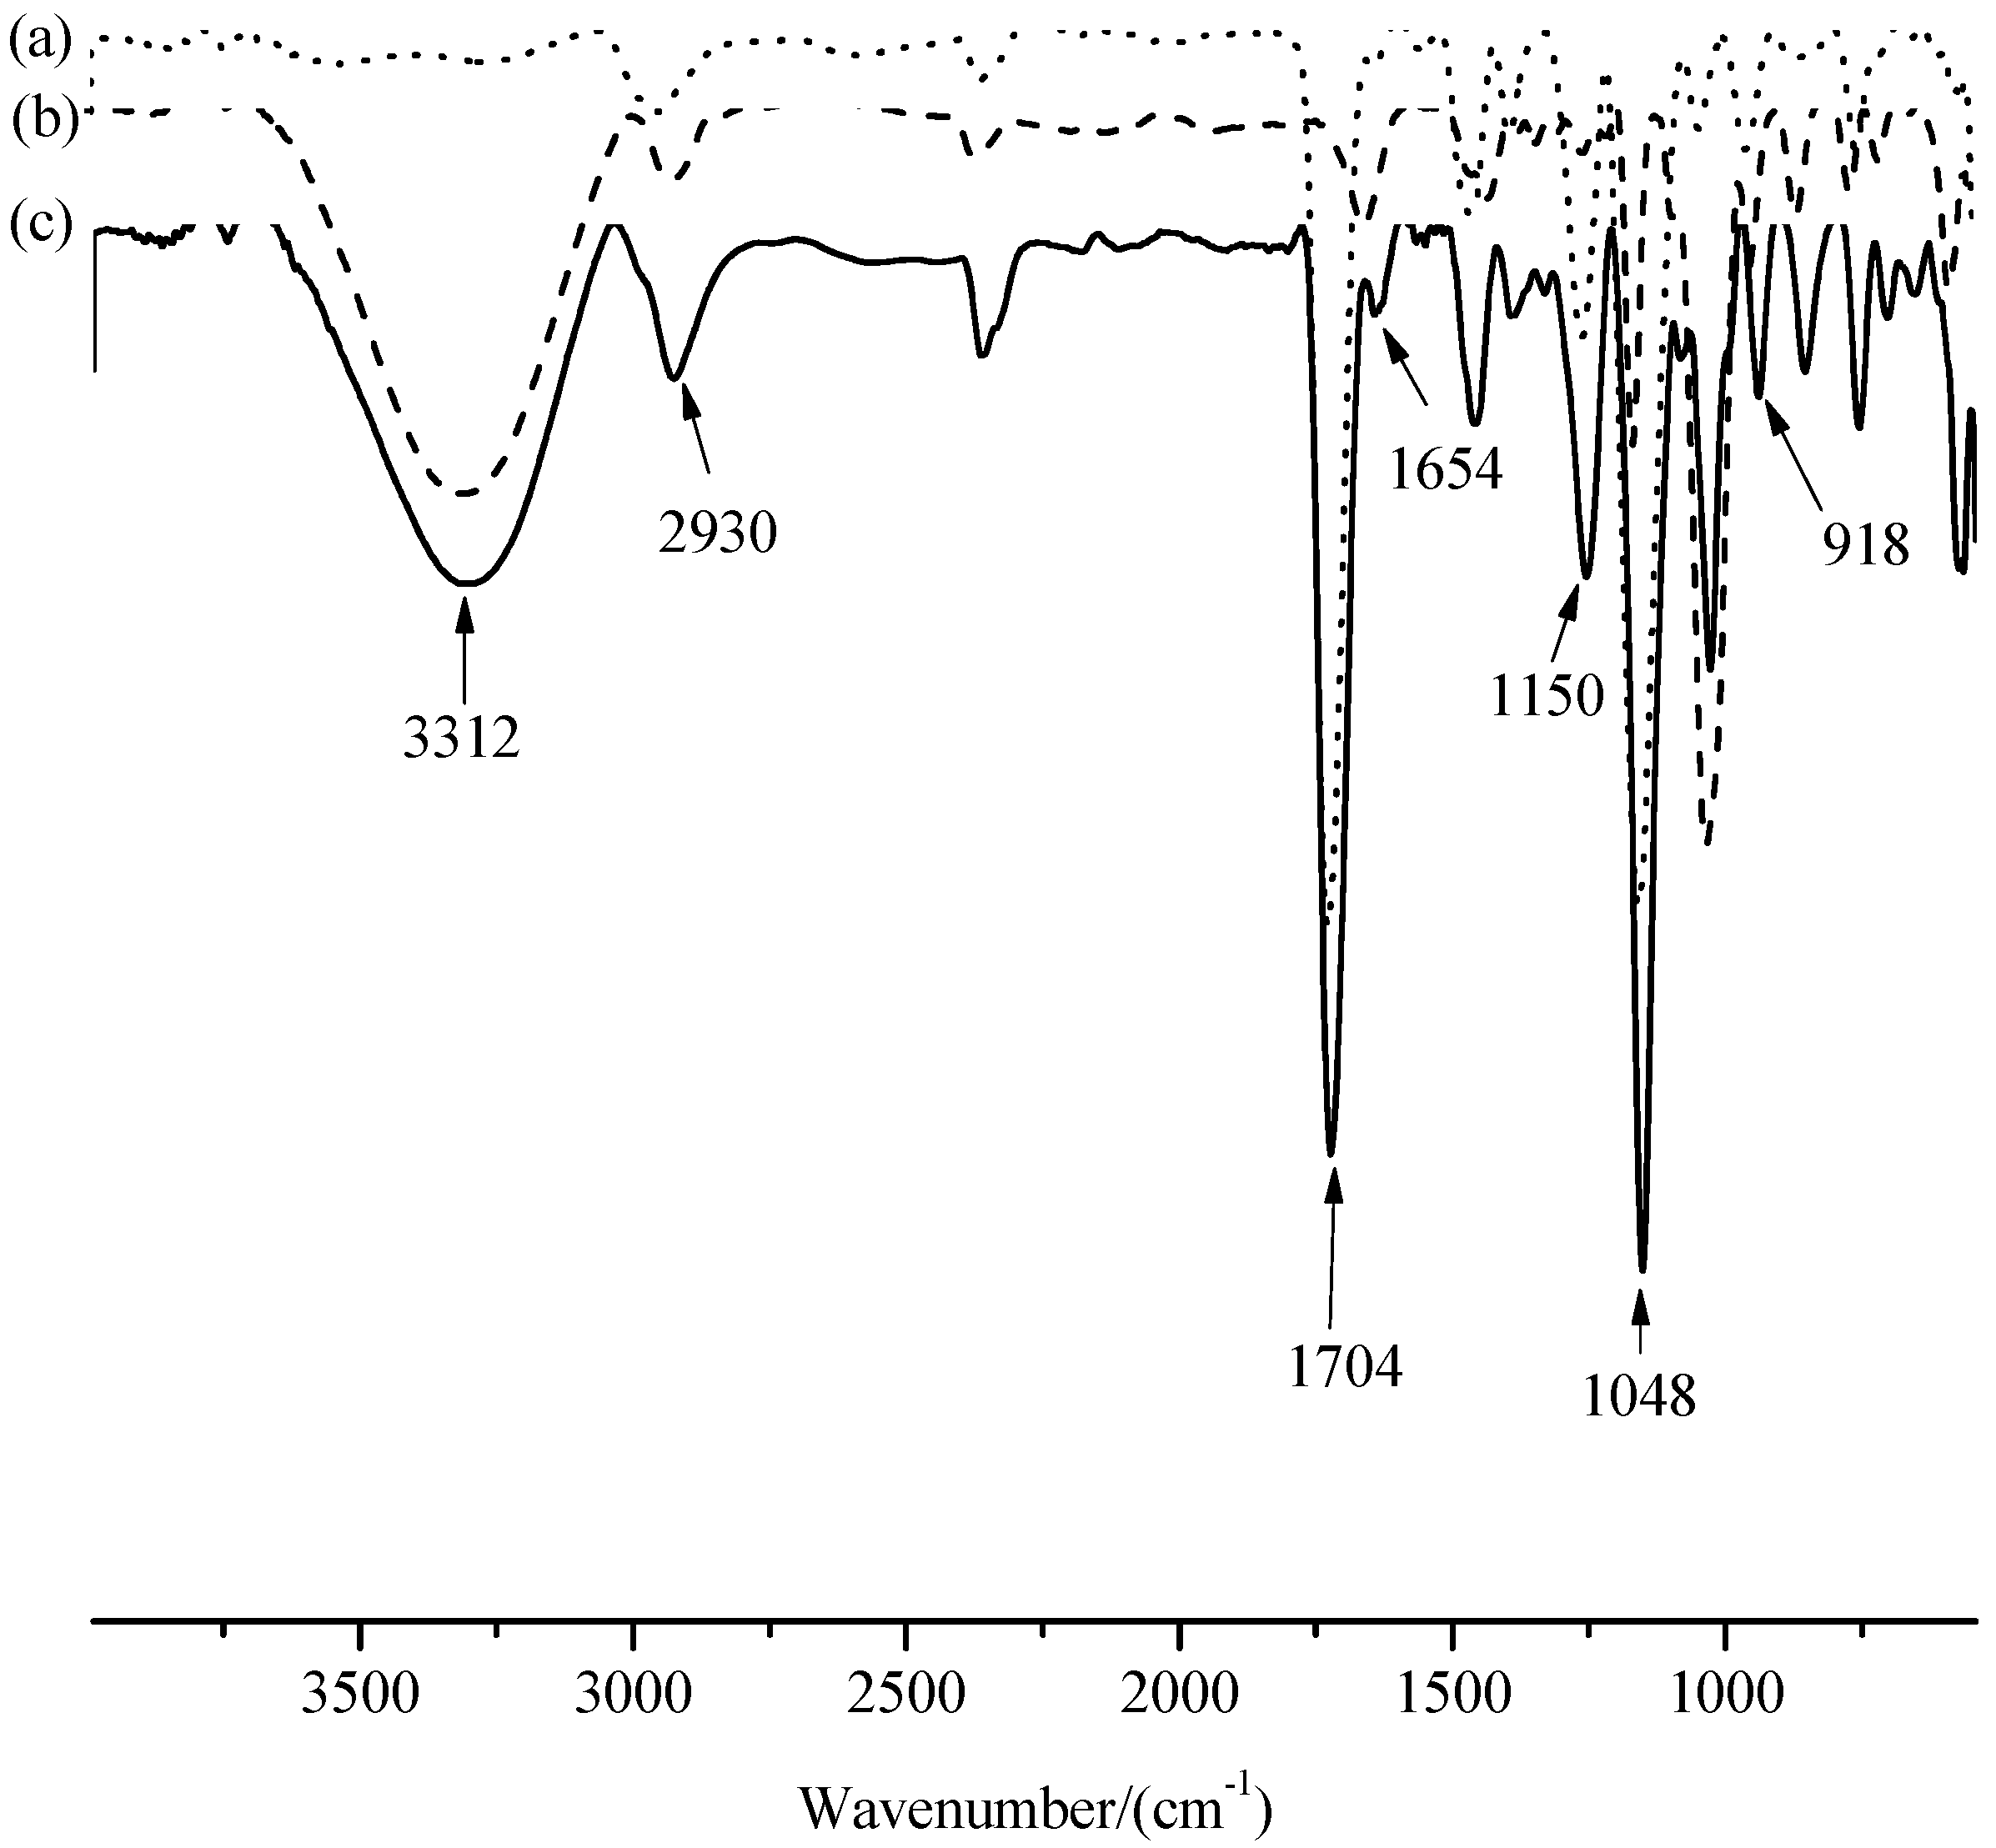
3.1. Characterization of MIMs
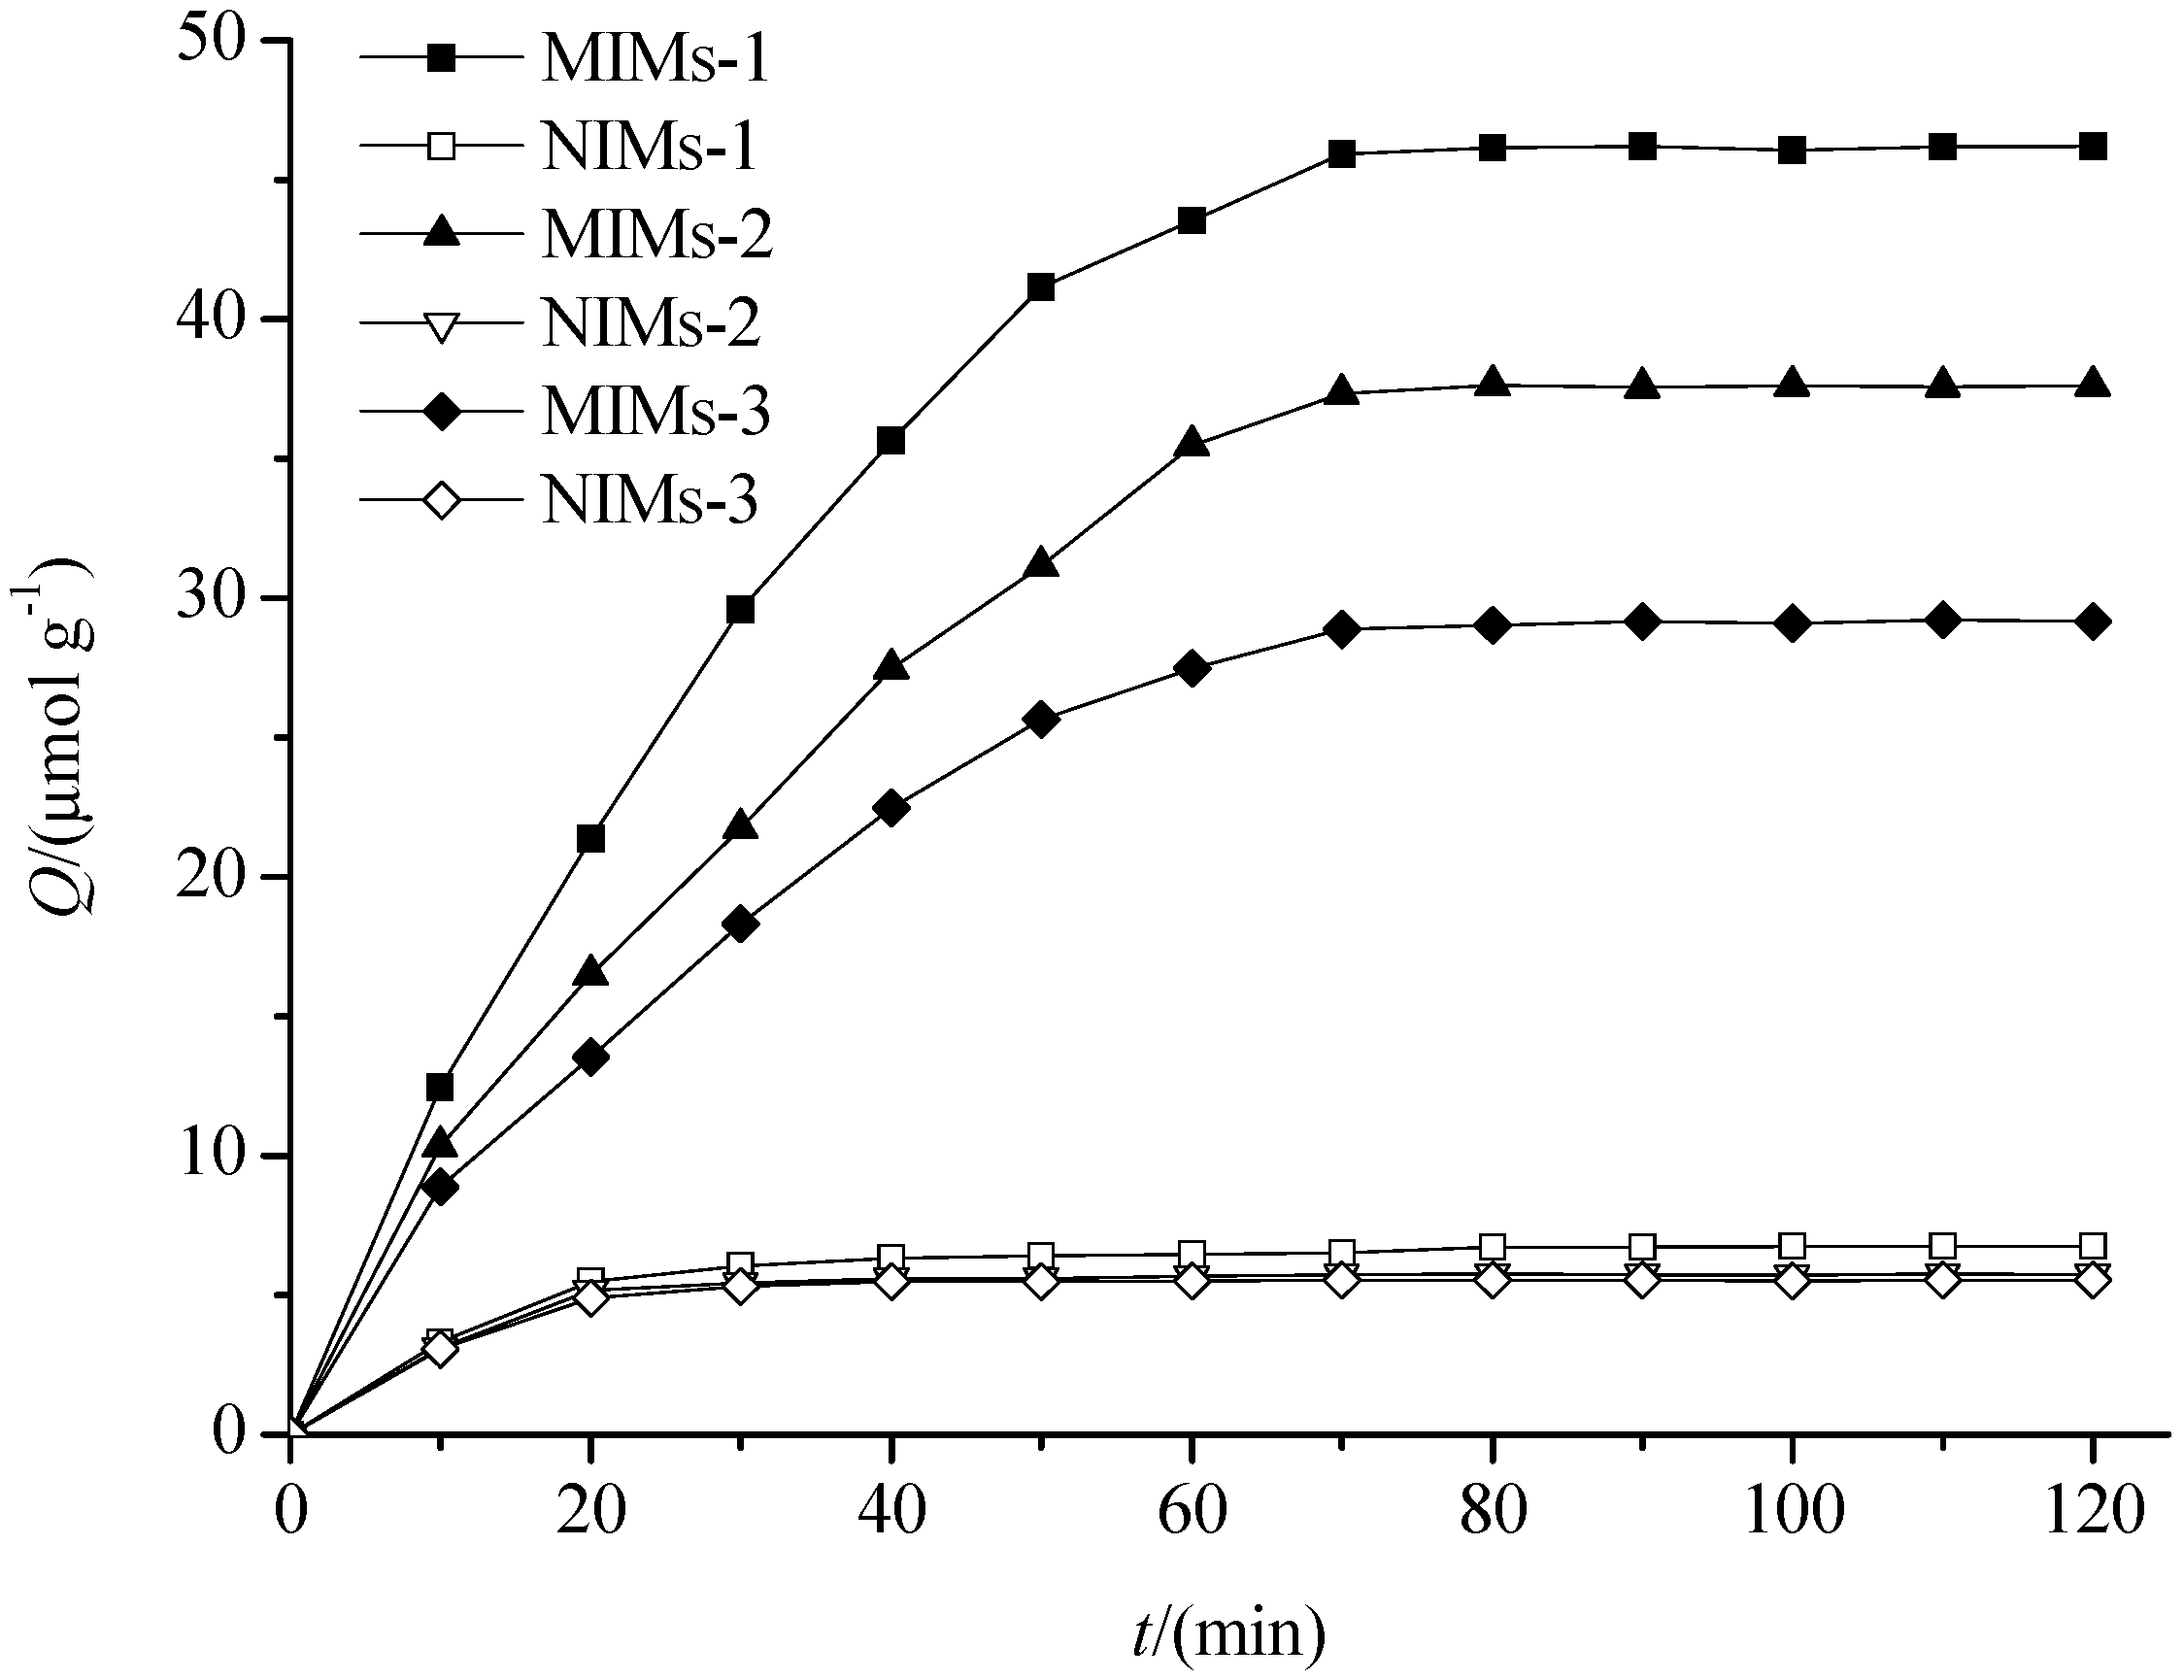
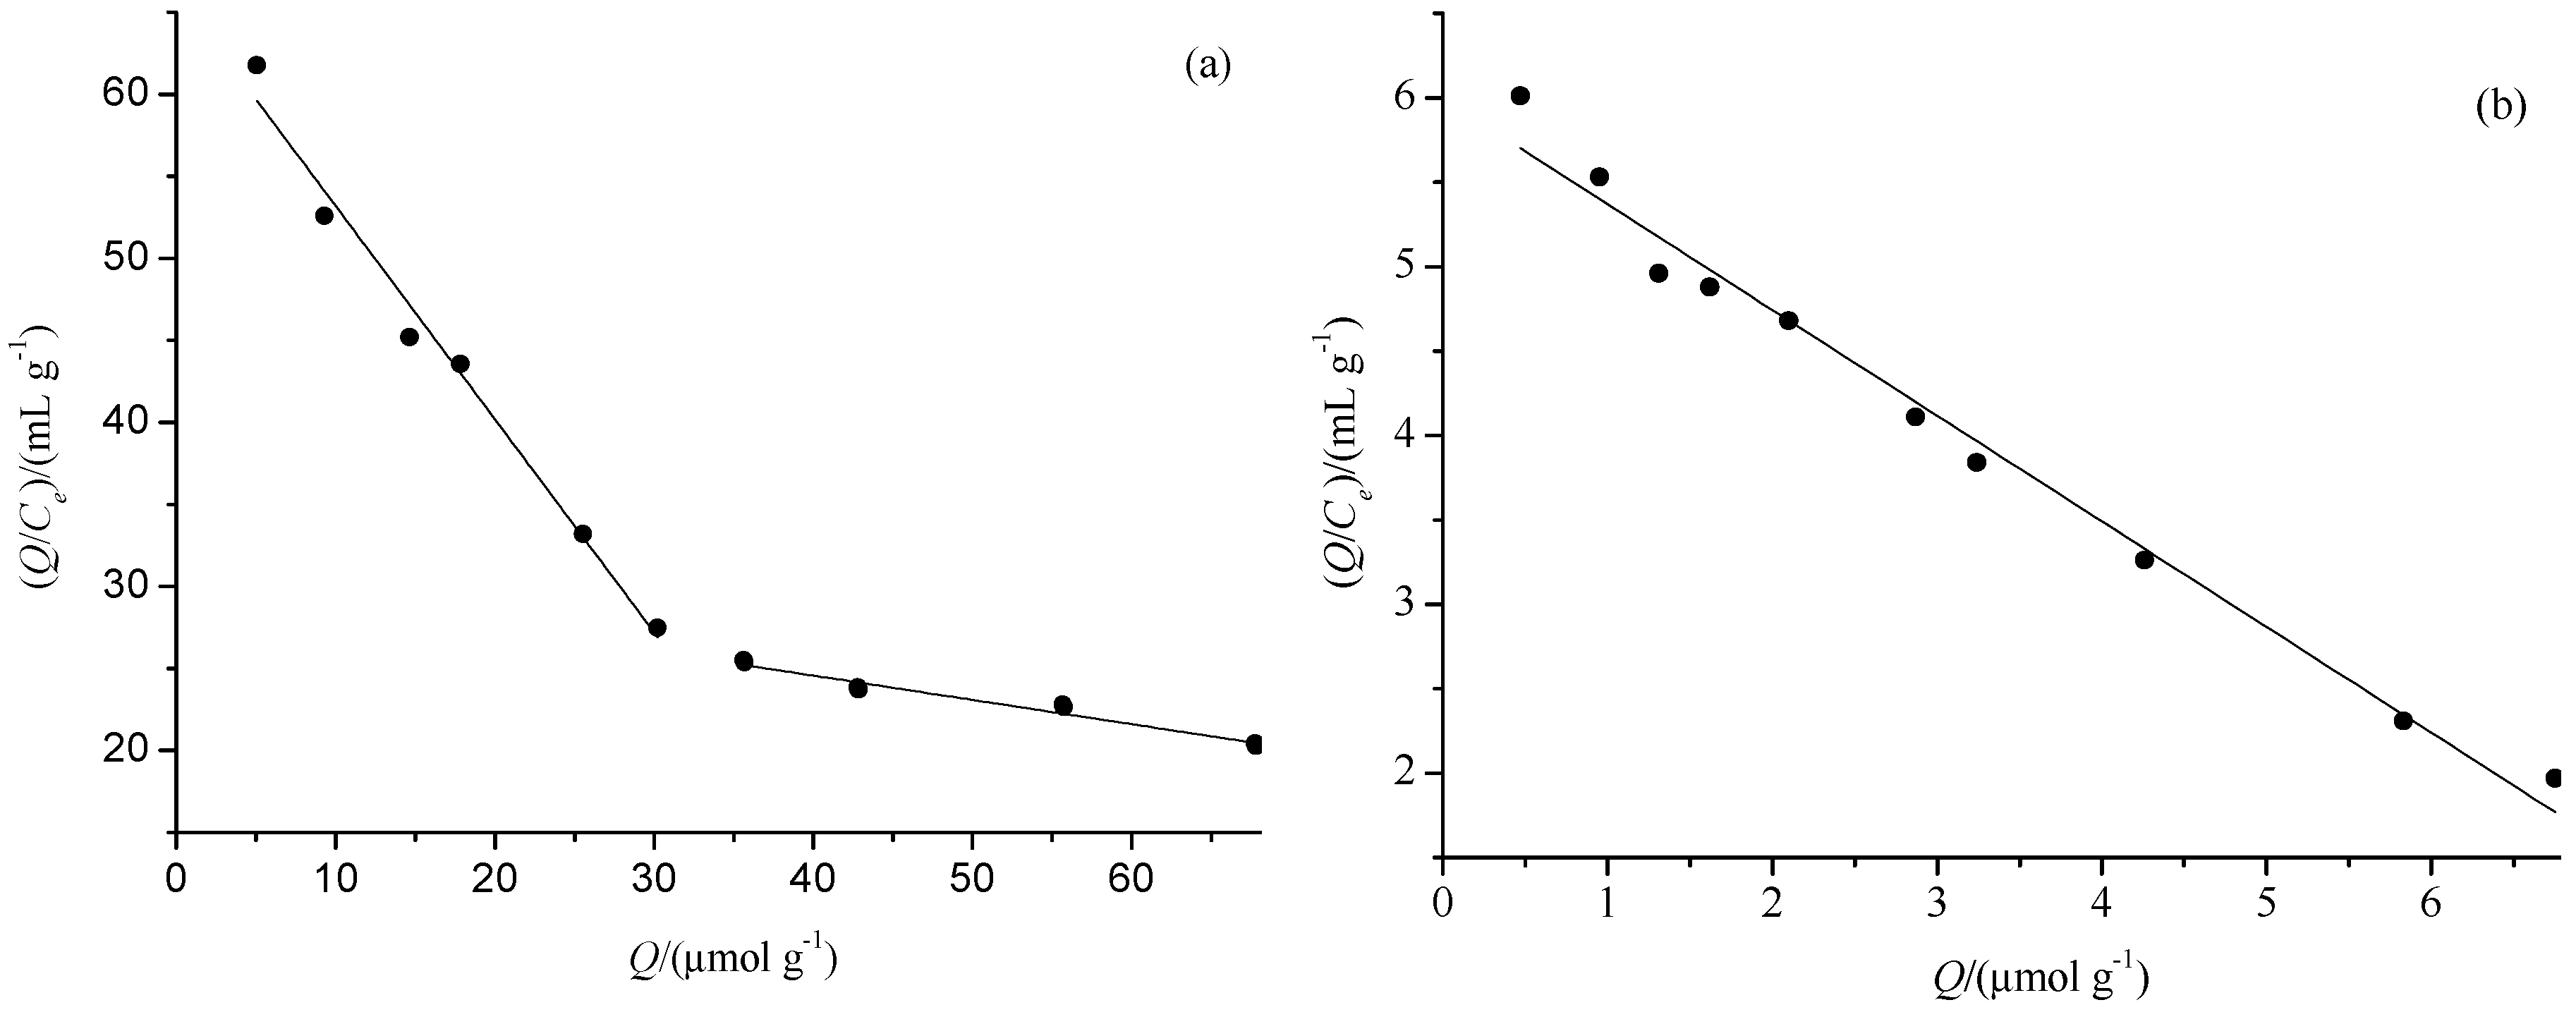
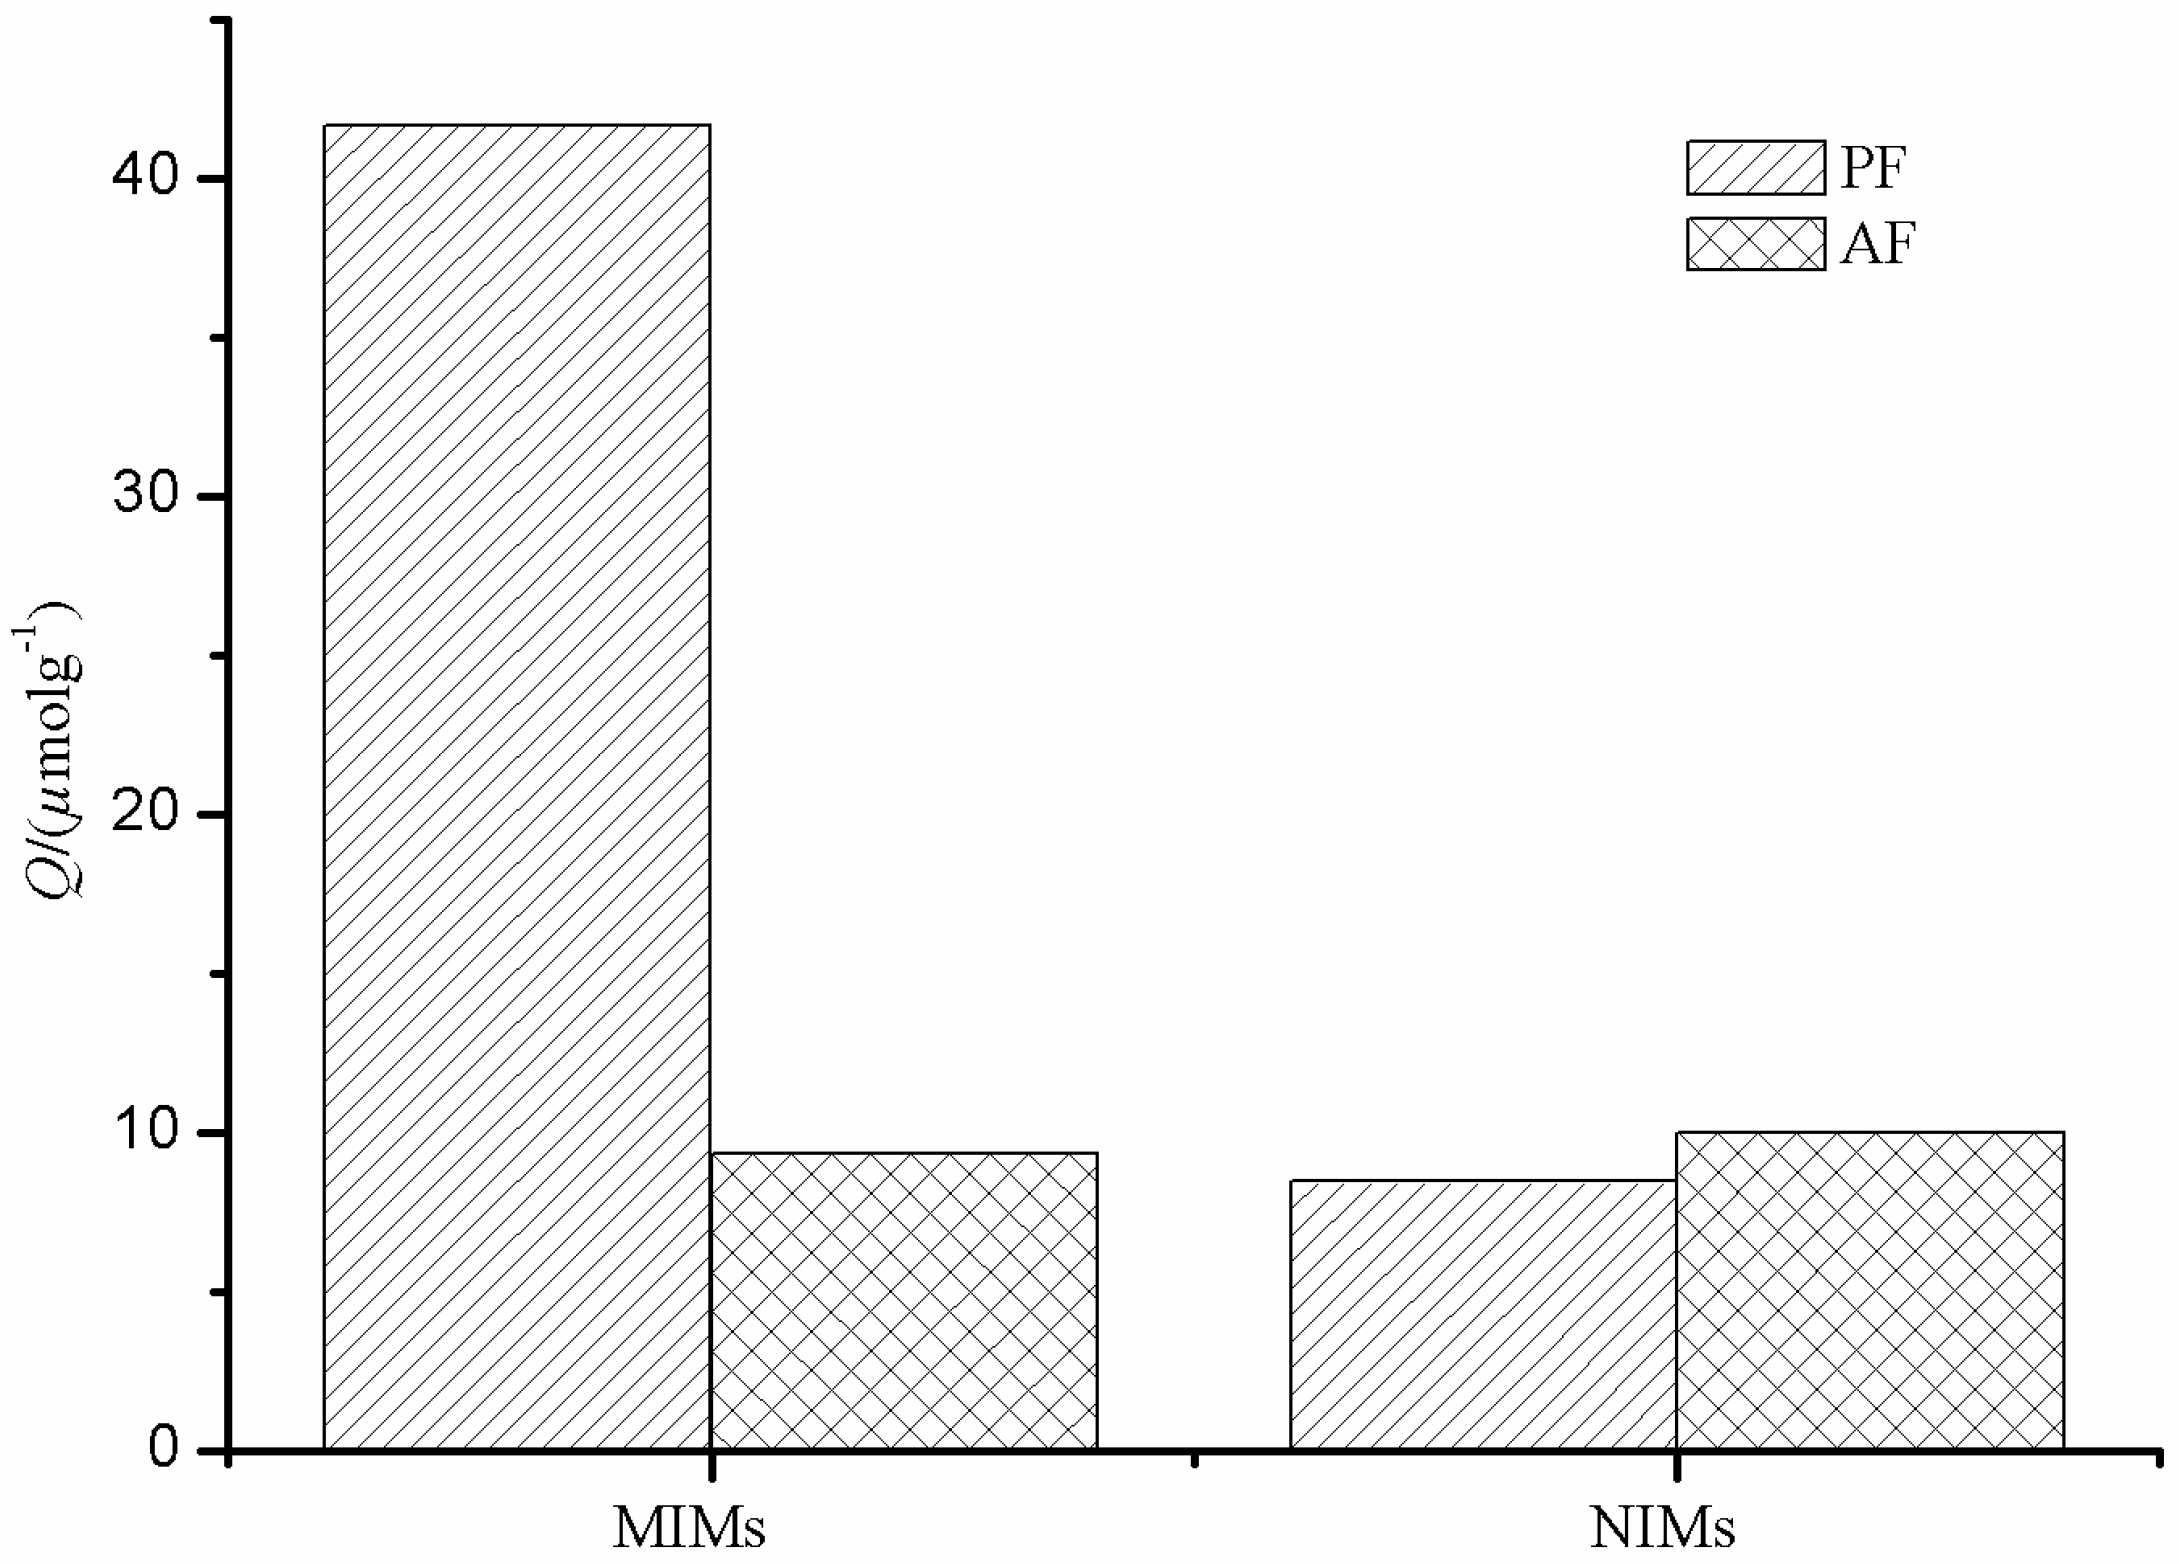
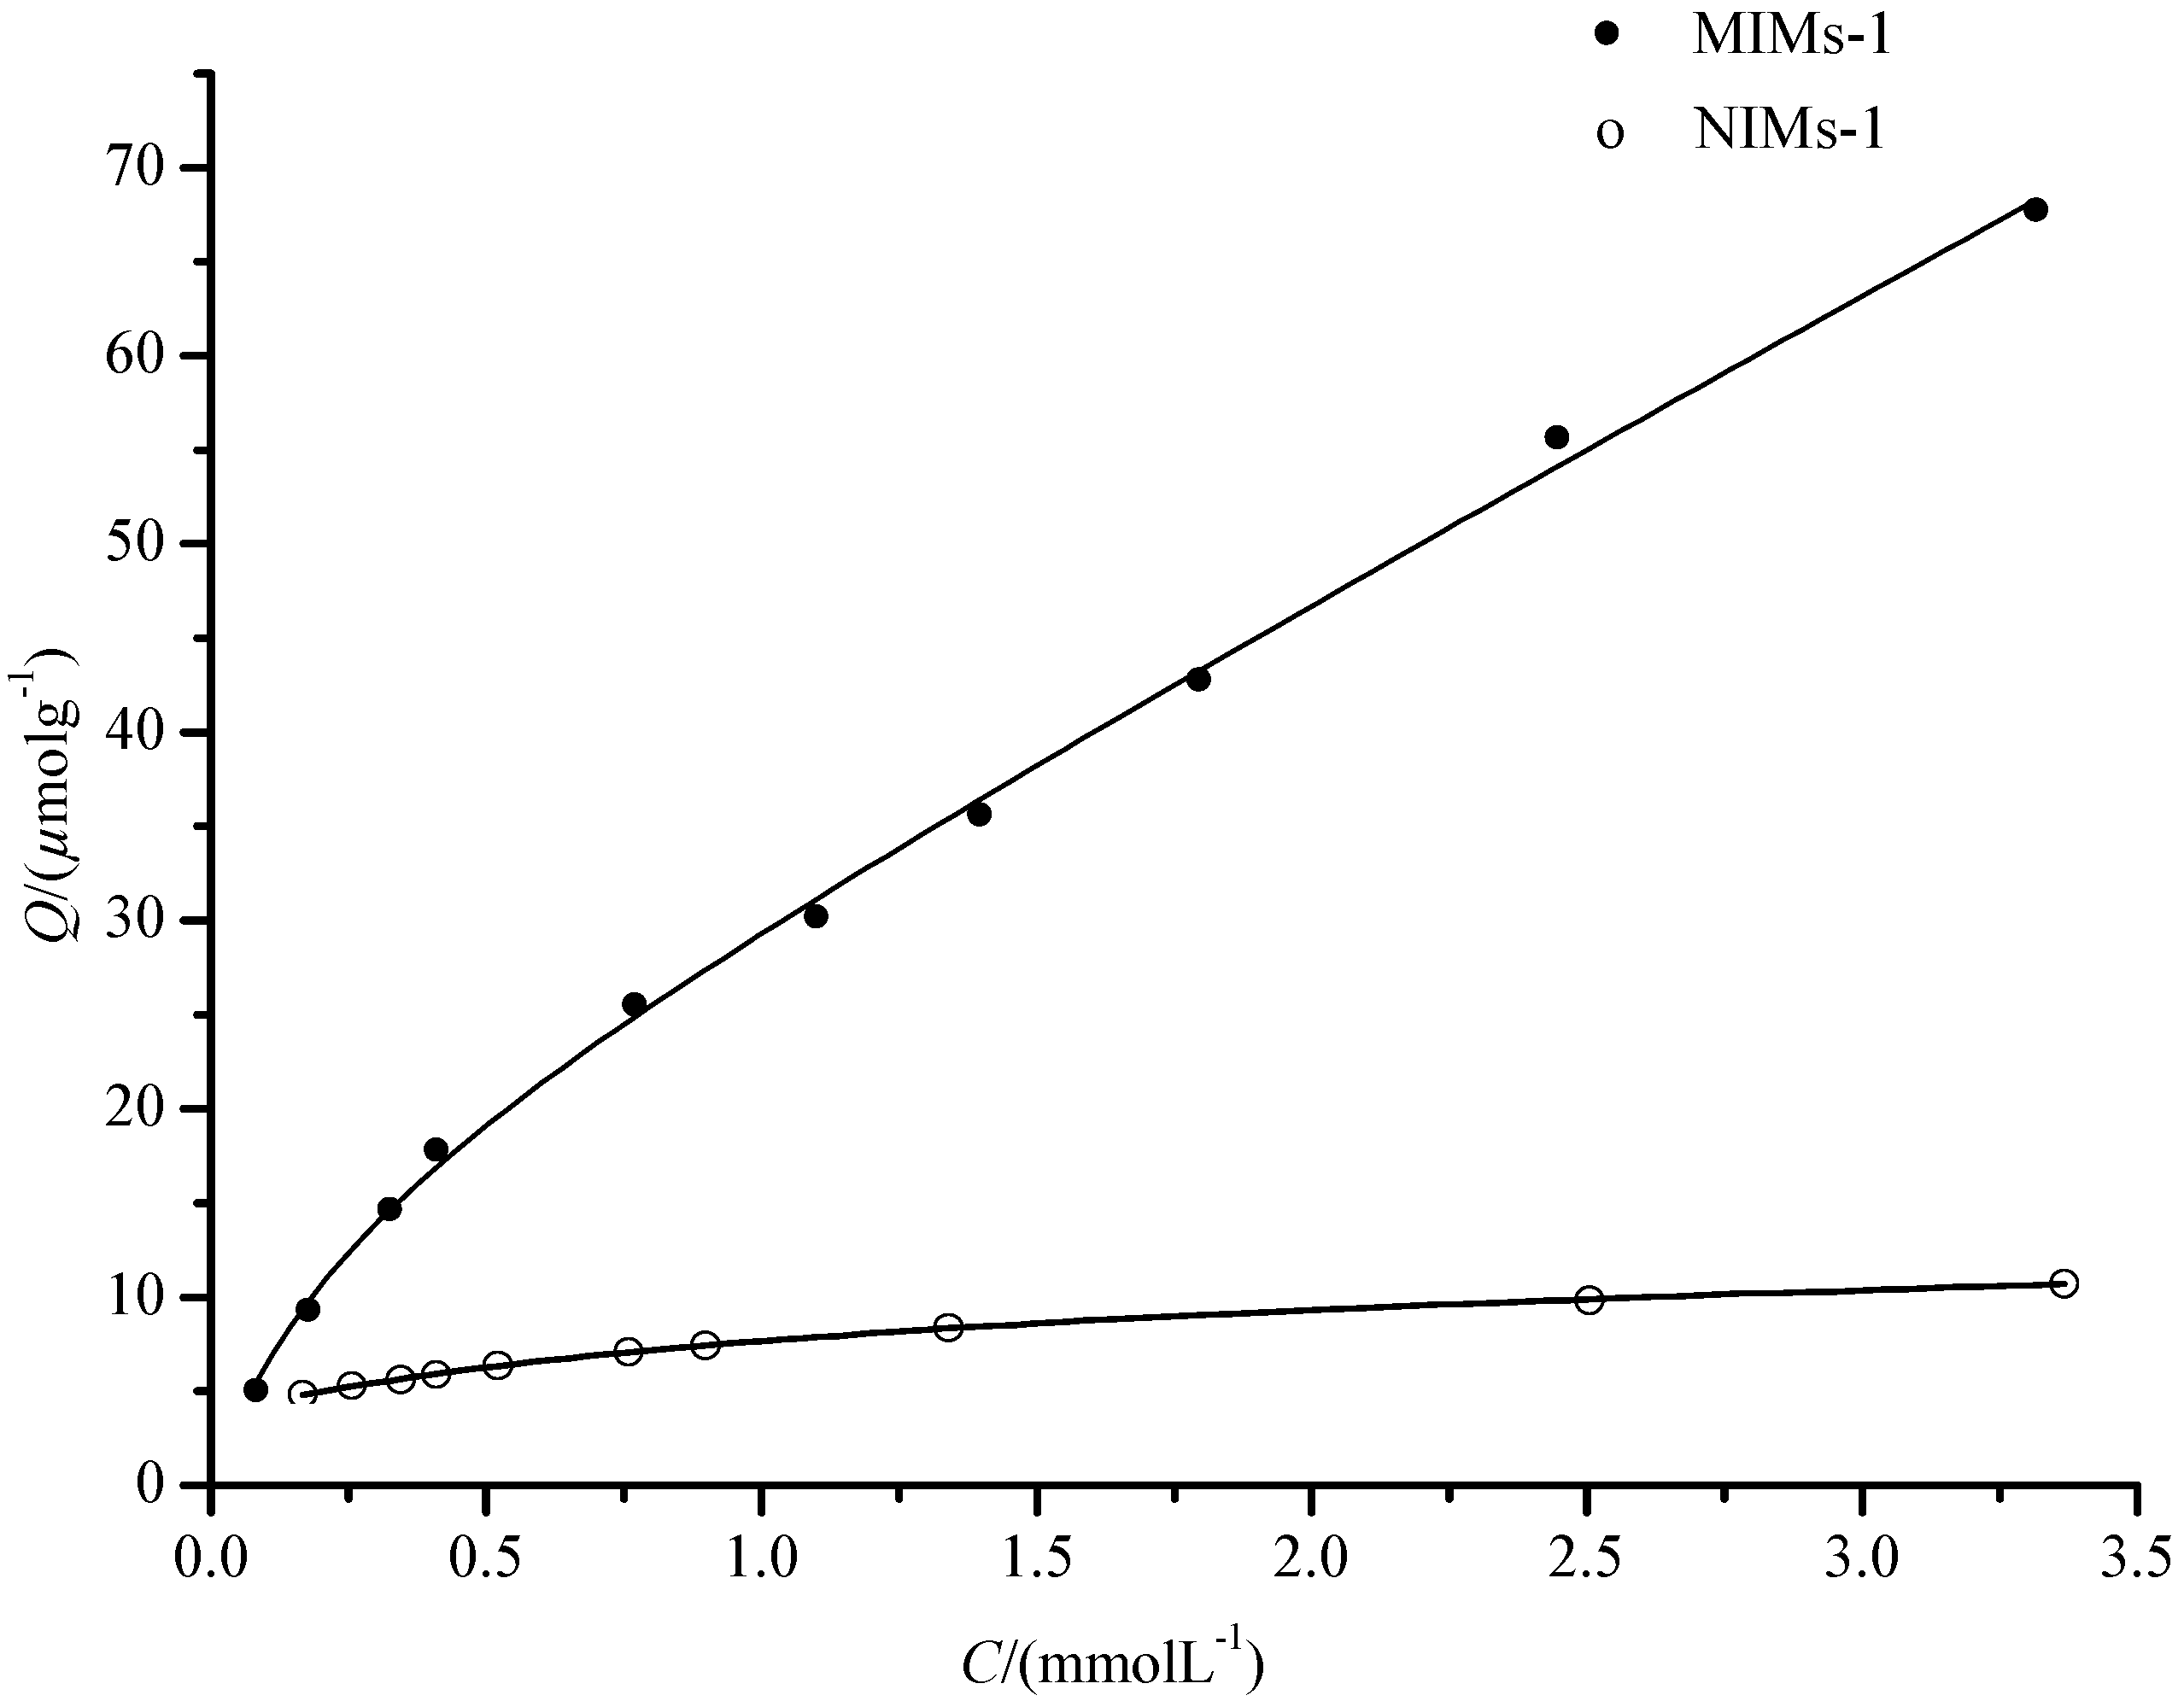
3.2. Adsorption Studies of MIMs
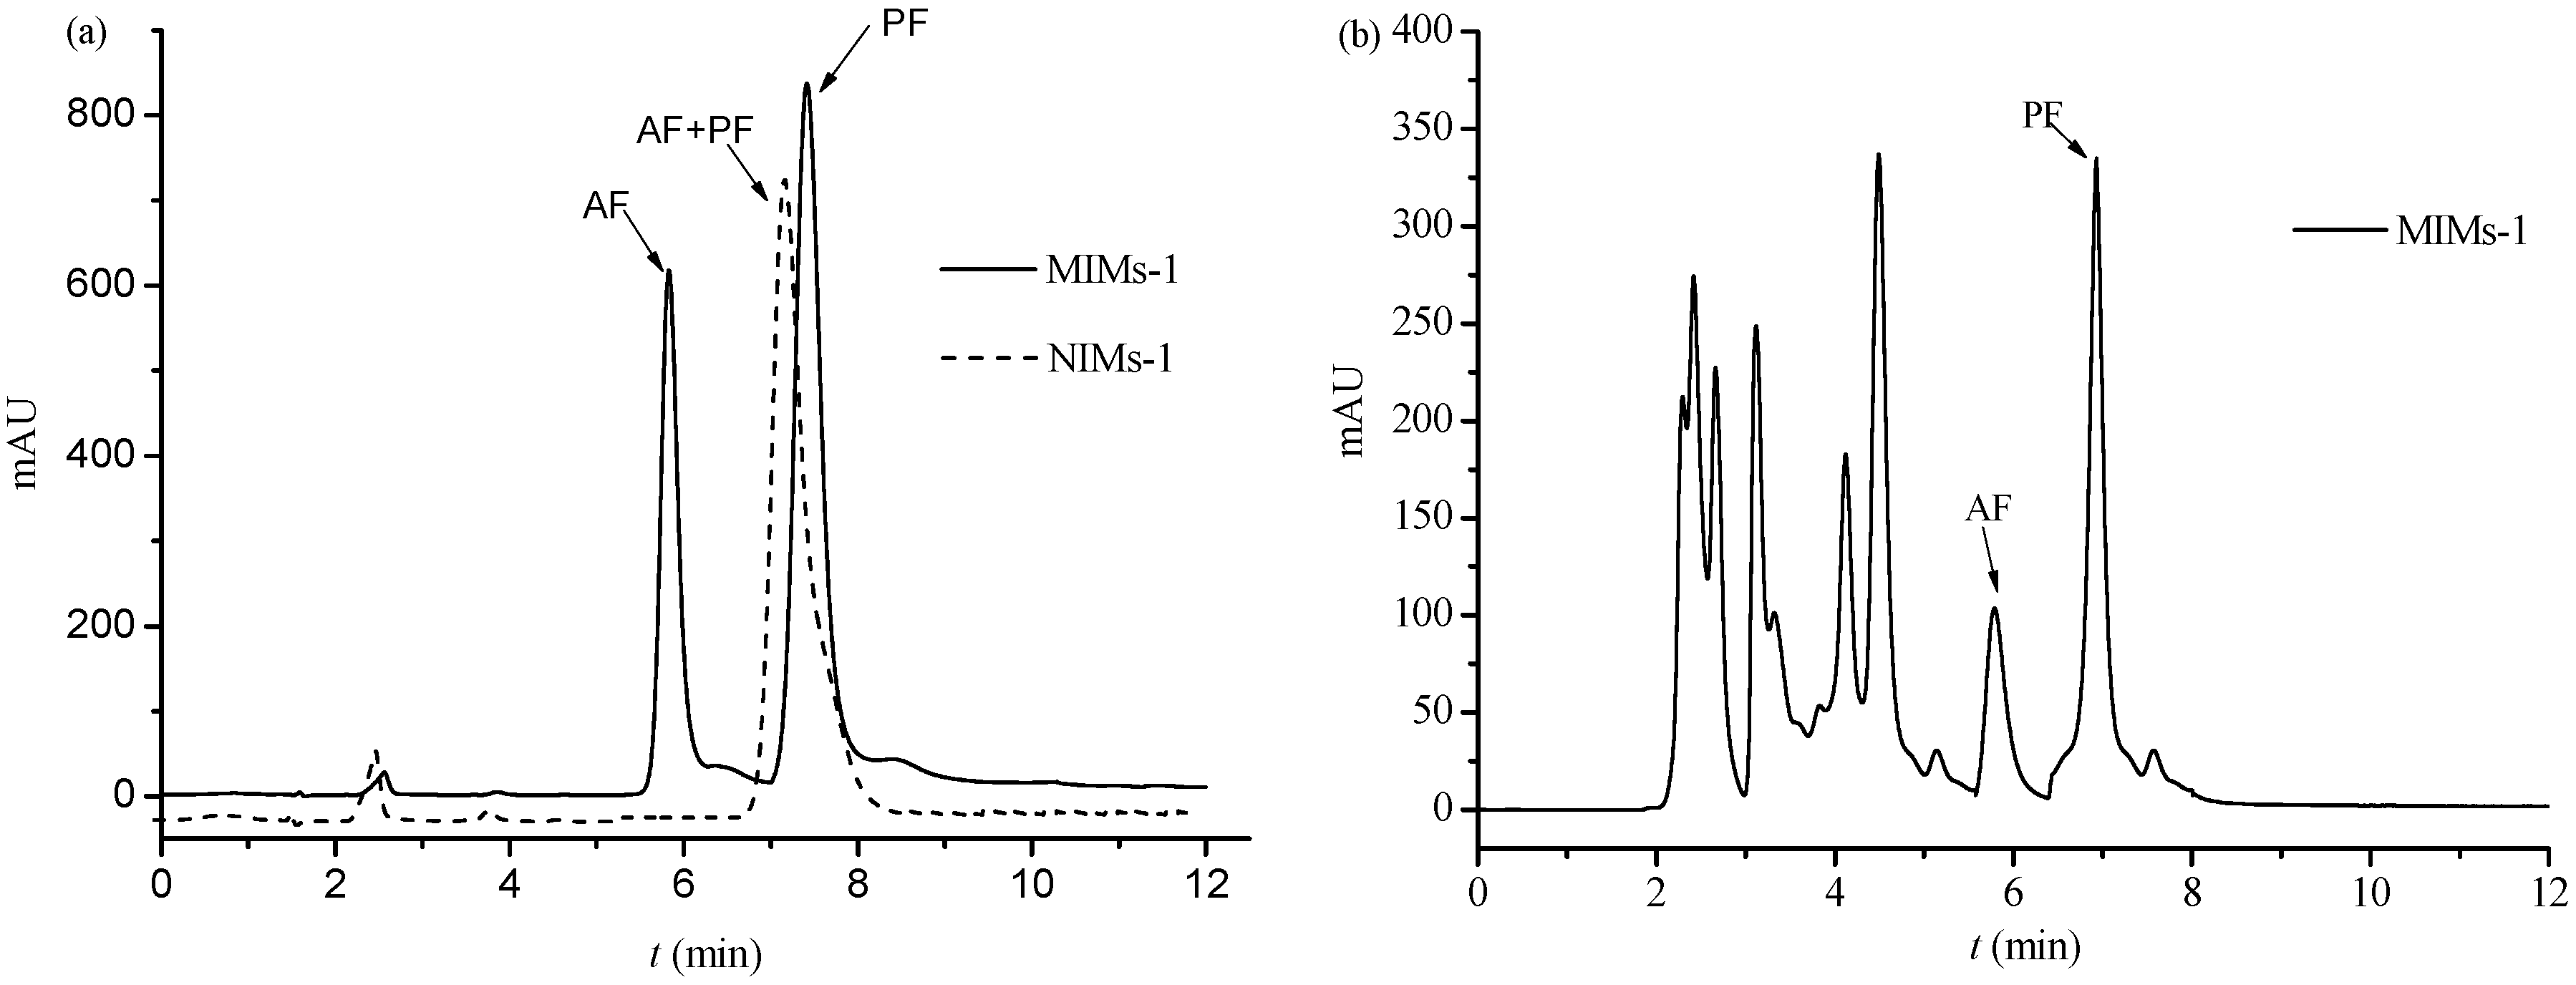
3.3. Chromatographic Analysis
4. Conclusions
Acknowledgments
Author Contributions
Conflicts of Interest
References
- Kaneda, M.; Iitaka, Y.; Shibata, S. Chemical studies on the oriental plant drugs-XXXIII: The absolute structures of paeoniflorin, albiflorin, oxypaeoniflorin and benzoylpaeoniflorin isolated from Chinese paeony root. Tetrahedron 1972, 28, 4309–4317. [Google Scholar] [CrossRef]
- Zhang, M.H.; Feng, L.; Zhu, M.M.; Gu, J.F.; Wu, C.; Jia, X.B. Antioxidative and anti-inflammatory activities of paeoniflorin and oxypaeoniflora on AGEs-induced mesangial cell damage. Planta Med. 2013, 79, 1319–1323. [Google Scholar] [CrossRef] [PubMed]
- Sun, R.; Yi, Y.P.; Lv, L.L.; Zhang, Z.P.; Sun, H.; Liu, G.Q. Effects of paeoniflorin on pathological changes in global brain ischemia model rats. China J. Chin. Mater. Med. 2007, 32, 2518–2522. [Google Scholar]
- Tang, X.; Liu, J.; Dong, W.; Li, P.; Li, Lei.; Lin, C.R.; Zheng, Y.Q.; Hou, J.C.; Li, D. The cardioprotective effects of citric acid and L-malic acid on myocardial ischemia/reperfusion injury. Evid. Based Complement. Altern. Med. 2013, 3, 820695. [Google Scholar] [CrossRef] [PubMed]
- Rosen, R. Herbal Skin Formulation. U.S. Patent 7,235,265, 26 June 2007. [Google Scholar]
- Yoshihisa, Y.; Furuichi, M.; Rehman, M.R.; Ueda, C.; Makino, T.; Shimizu, T. The Traditional Japanese Formula Keishibukuryogan Inhibits the Production of Inflammatory Cytokines by Dermal Endothelial Cells. Mediat. Inflamm. 2010, 1, 60–68. [Google Scholar] [CrossRef] [PubMed]
- Liu, A.L.; Zhang, S.; Wang, K.B.; He, W.; Liu, H.Y.; He, Y.C. Purification technology of paeoniflorin and albiflorin from Paeonia lactiflora Pall. J. Tradit. Chin. Med. Univ. Hunan 2008, 3, 35–37. [Google Scholar]
- Shibutani, S.; Nagasawa, T.; Oura, H.; Nonaka, G.; Nishioka, I. Effect of extract from Paeoniae Radix on urea-nitrogen concentration in rat serum. I. Chem. Pharm. Bull. 1981, 29, 874–878. [Google Scholar] [CrossRef] [PubMed]
- Dou, Z.H.; Luo, L.; Lu, D. Purification of total paeony glycoside by macroporous resin with double indices of albiflorin and paeoniflorin. J. Chin. Med. Mater. 2009, 32, 1282–1284. [Google Scholar]
- Qin, A.X.; Shu-Jing, J.I.; Mao, W.Y.; Gao, Z.; Kang, X.H.; Jia, Y.N.; Chen, C.; Cui, T. Identification and Purification of Paeoniflorins in Seed Cakes of Paeonia sufruticosa by Macroporous Adsorption Resin. Prepr. Pap. Am. Chem. Soc. Div. Fuel Chem. 1989, 34, 63–66. [Google Scholar]
- Wullff, G. Molecular recognition in polymers prepared by imprinting with templates. Am. Chem. Soc. 1986, 9, 186–230. [Google Scholar]
- Tan, C.J.; Tong, Y.W. Molecularly imprinted beads by surface imprinting. Anal. Bioanal. Chem. 2007, 389, 369. [Google Scholar] [CrossRef] [PubMed]
- Caro, E.; Marcé, R.M.; Cormack, P.A.; Sherrington, D.C.; Borrull, F. Molecularly imprinted solid-phase extraction of naphthalene sulfonates from water. J. Chromatogr. A 2004, 1047, 175–180. [Google Scholar] [CrossRef]
- Andrade, F.N.; Santosneto, A.J.; Lanças, F.M. Microextraction by packed sorbent liquid chromatography with time-of-flight mass spectrometry of triazines employing a molecularly imprinted polymer. J. Sep. Sci. 2014, 37, 3150–3156. [Google Scholar] [CrossRef] [PubMed]
- Chen, Z.; Zhao, R.; Shangguan, D.; Liu, G.Q. Preparation and evaluation of uniform-sized molecularly imprinted polymer beads used for the separation of sulfamethazine. Biomed. Chromatogr. 2005, 19, 533–538. [Google Scholar] [CrossRef] [PubMed]
- Lai, J.P.; Lu, X.Y.; Lu, C.Y.; Ju, H.F.; He, X.W. Preparation and evaluation of molecularly imprinted polymeric microspheres by aqueous suspension polymerization for use as a high-performance liquid chromatography stationary phase. Anal. Chim. Acta 2001, 442, 105–111. [Google Scholar] [CrossRef]
- Shi, Y. Narrowly dispersed molecularly imprinted microspheres prepared by a modified precipitation polymerization method. Anal. Chim. Acta 2008, 612, 105. [Google Scholar]
- Lu, S.; Cheng, G.; Zhang, H.; Pang, X. Preparation and characteristics of Tryptophan-imprinted Fe3O4/P(TRIM) composite microspheres with magnetic susceptibility by inverse emulsion–suspension polymerization. J. Appl. Polym. Sci. 2006, 99, 3241–3250. [Google Scholar] [CrossRef]
- Liu, H.M.; Liu, C.H.; Yang, X.J.; Zeng, S.J.; Xiong, Y.Q.; Xu, W.J. Uniformly sized β-cyclodextrin molecularly imprinted microspheres prepared by a novel surface imprinting technique for ursolic acid. Anal. Chim. Acta 2008, 628, 87–94. [Google Scholar] [CrossRef]
- Suzuki, I.; Egawa, Y.; Mizukawa, Y.; Hoshi, T.; Anzai, J. Construction of positively-charged layered assemblies assisted by cyclodextrin complexation. Chem. Commun. 2002, 13, 164. [Google Scholar] [CrossRef]
- Pariot, N.; Edwards-Lévy, F.; Andry, M.C.; Lévy, M.C. Cross-linked β-cyclodextrin microcapsules. II. Retarding effect on drug release through semi-permeable membranes. Int. J. Pharm. 2002, 232, 175–181. [Google Scholar] [CrossRef]
- Pariot, N.; Edwards-lévy, F.; Andry, M.C.; Lévy, M.C. Cross-linked beta-cyclodextrin microcapsules: preparation and properties. Int. J. Pharm. 2000, 211, 19. [Google Scholar] [CrossRef]
- Gong, B.; Shen, Y.; Geng, X. Preparation of Strong Cation Exchange Packings Based on Monodisperse Poly(glycidyl methacrylate-co-ethylenedimethacrylate) Particles and Their Application. J. Liq. Chromatogr. Relat. Technol. 2003, 26, 963–976. [Google Scholar] [CrossRef]
- He, B.; Zhao, X. Study on the Synthesis and Characterization of Novel Immobilized β-Cyclodextrin Polymer (I). Sci. China Ser. B 1993, 7, 19–29. [Google Scholar]
- Dubois, M.; Gilles, K.A.; Hamilton, J.K.; Rebers, P.; Smith, F. Colorimetric Method for Determination of Sugars and Related Substances. Anal. Chem. 1956, 28, 350–356. [Google Scholar] [CrossRef]
- Fu, C.; Li, Z.; Liu, S.; Chen, C. The study of Ethanol Water Used as Reversed Phase High Performance Liquid Chromatographic Mobile Phase. Chin. J. Chromatogr. 1999, 17, 466–468. [Google Scholar]


| Polymer | PF (μmol) | β-CD a (μmol) | AA (μmol) | EGDMA (mmol) | AIBN (mg) |
|---|---|---|---|---|---|
| MIMs-1 | 104.9 | 102.9 | 914.5 | 1.25 | 20 |
| NIMs-1 | - | 102.9 | 914.5 | 1.25 | 20 |
| MIMs-2 | 104.9 | 102.9 | - | 1.25 | 20 |
| NIMs-2 | - | 102.9 | - | 1.25 | 20 |
| MIMs-3 | 104.9 | - | 914.5 | 1.25 | 20 |
| NIMs-3 | - | - | 914.5 | 1.25 | 20 |
| Polymer | Specific surface area a (m2·g−1) | Average pore diameter b (nm) | Specific pore volume c (mL·g−1) |
|---|---|---|---|
| PGMA | 148.35 | 21.85 | 0.74 |
| MIMs-1 | 240.38 | 35.58 | 0.85 |
| NIMs-1 | 254.16 | 28.92 | 0.83 |
| MIMs-2 | 234.84 | 33.47 | 0.84 |
| NIMs-2 | 242.52 | 28.73 | 0.87 |
| MIMs-3 | 227.81 | 31.83 | 0.83 |
| NIMs-3 | 230.77 | 29.14 | 0.86 |
| Polymer | Q a | IF |
|---|---|---|
| MIMs-1 | 45.93 | 7.06 |
| NIMs-1 | 6.51 | |
| MIMs-2 | 37.33 | 6.53 |
| NIMs-2 | 5.72 | |
| MIMs-3 | 28.87 | 5.22 |
| NIMs-3 | 5.53 |
© 2017 by the authors. Licensee MDPI, Basel, Switzerland. This article is an open access article distributed under the terms and conditions of the Creative Commons Attribution (CC BY) license (http://creativecommons.org/licenses/by/4.0/).
Share and Cite
Zhang, W.; Wei, B.; Li, S.; Wang, Y.; Wang, S. Preparation and Chromatographic Application of β-Cyclodextrin Molecularly Imprinted Microspheres for Paeoniflorin. Polymers 2017, 9, 214. https://doi.org/10.3390/polym9060214
Zhang W, Wei B, Li S, Wang Y, Wang S. Preparation and Chromatographic Application of β-Cyclodextrin Molecularly Imprinted Microspheres for Paeoniflorin. Polymers. 2017; 9(6):214. https://doi.org/10.3390/polym9060214
Chicago/Turabian StyleZhang, Wei, Bofeng Wei, Shoujiang Li, Yueming Wang, and Shaoyan Wang. 2017. "Preparation and Chromatographic Application of β-Cyclodextrin Molecularly Imprinted Microspheres for Paeoniflorin" Polymers 9, no. 6: 214. https://doi.org/10.3390/polym9060214
APA StyleZhang, W., Wei, B., Li, S., Wang, Y., & Wang, S. (2017). Preparation and Chromatographic Application of β-Cyclodextrin Molecularly Imprinted Microspheres for Paeoniflorin. Polymers, 9(6), 214. https://doi.org/10.3390/polym9060214