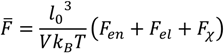
pH and Salt Effects on the Associative Phase Separation of Oppositely Charged Polyelectrolytes


Abstract
:1. Introduction
 for phase separation (phase separation regime) is maximum for intermediate pH (~ 6.5) conditions, when both PAA and PDMAEMA are highly charged. Surprisingly, we observe that the critical salt concentration for phase separation (phase separation regime) is maximum for low pH (≤ 4) conditions where PDMAEMA is highly charged but PAA is barely charged. We show that this could be explained by assuming a Flory parameter (χ+w = 0.75) between the PAA monomers and water, which is further justified by atomistic simulations. In the next section, we discuss the theoretical, experimental, and simulation approaches we have used to study pH and salt effects on polyelectrolyte complexation. In the “Results and Discussion” section, we show the comparison of theoretical and experimental results of the critical salt concentration of phase separation and water content and volume of the resulting dense phase, followed by a brief discussion of simulation results.
2. Methods
2.1. Theory
 .
.
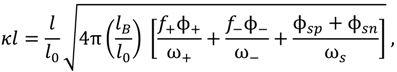
 , can be obtained by taking the lowest order term of the Taylor’s expansion of Equation (3) for small κ, and is given by:
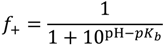
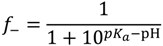
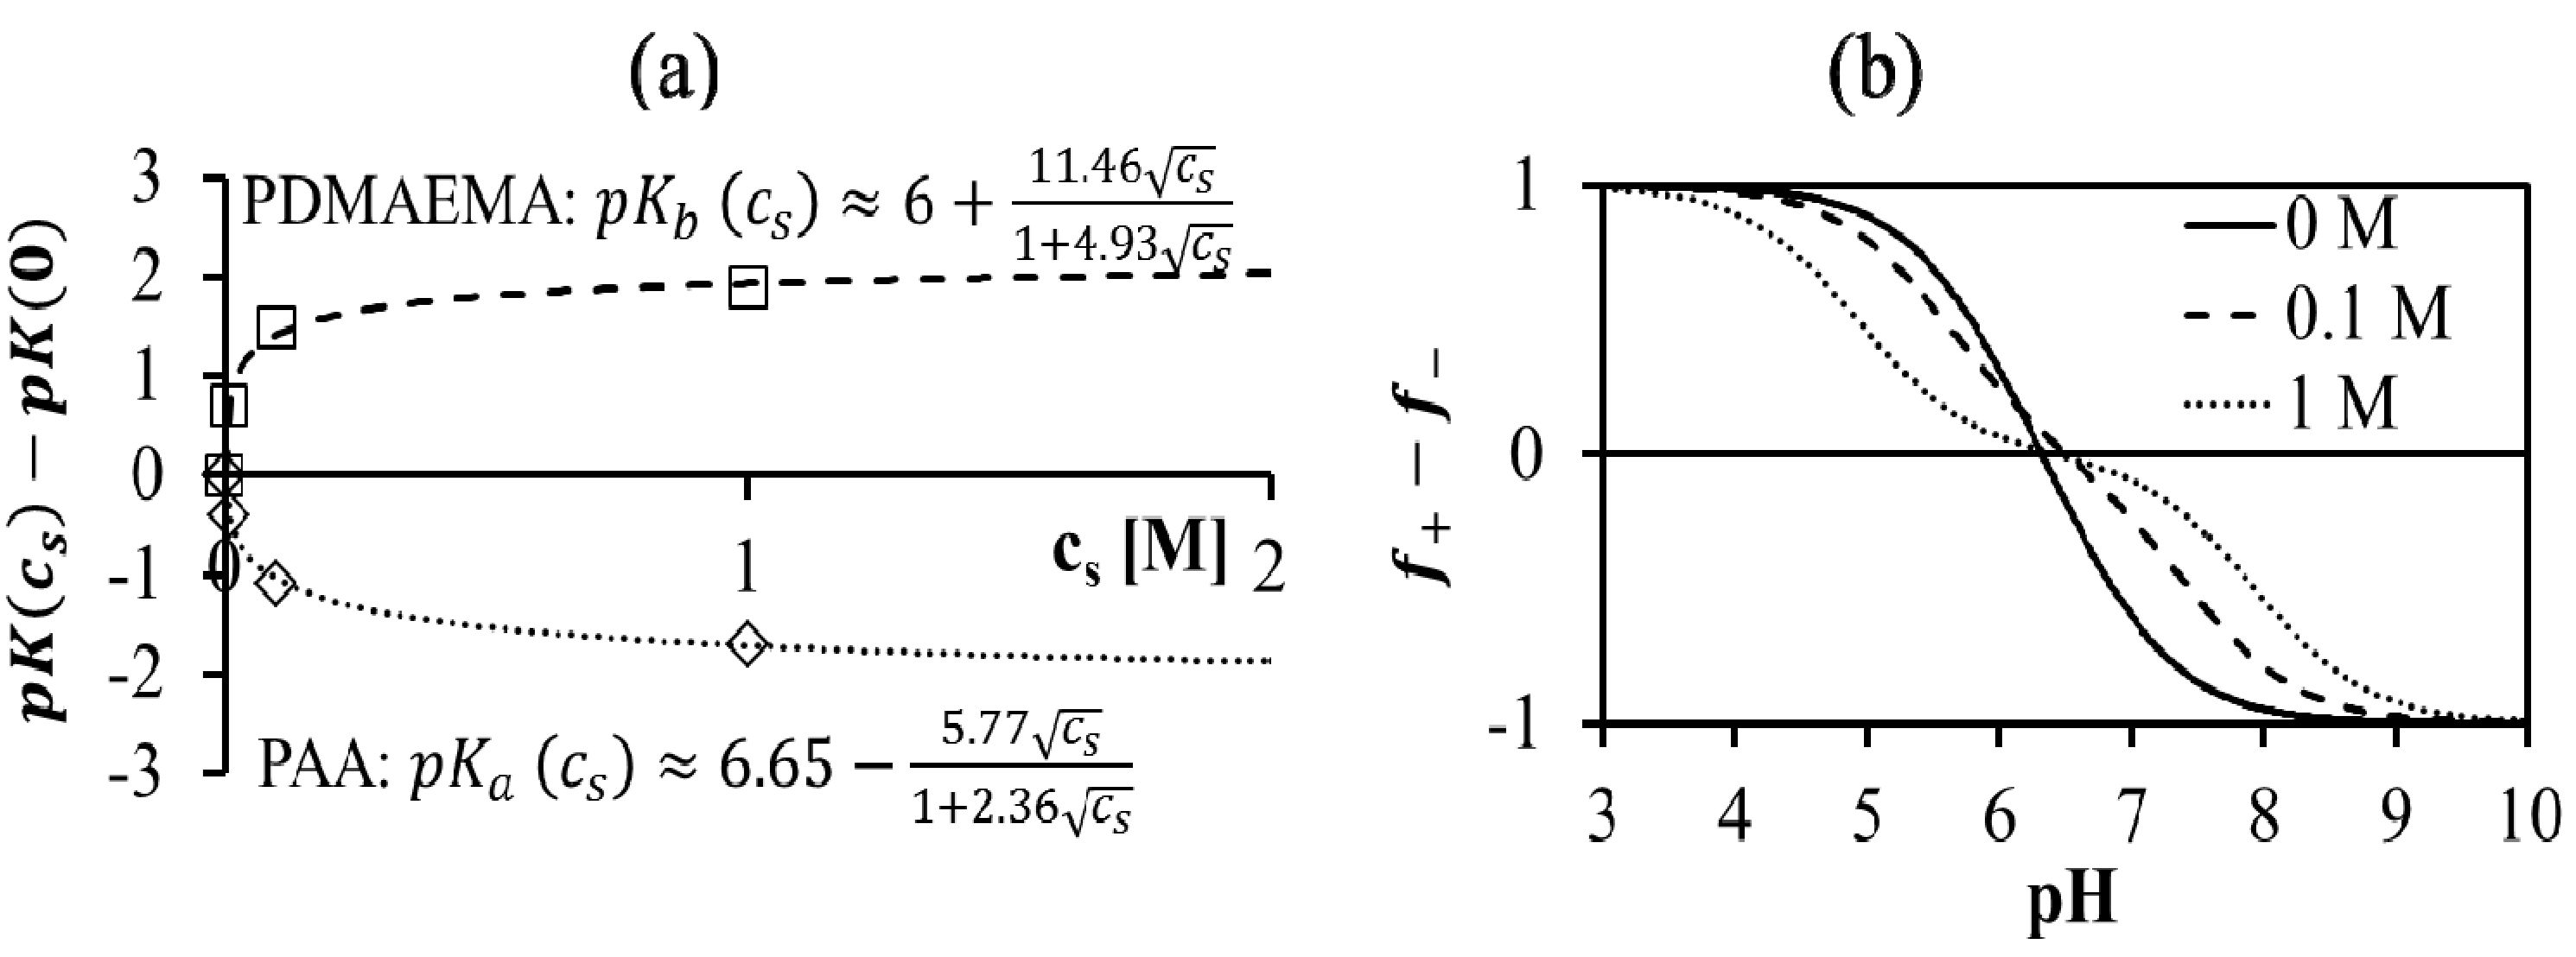
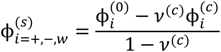
 , such that cs = 0 for no added salt. Both f+ and f− increases with increase in salt concentration [40]. Also, as evident from Figure 2b, the magnitude of “charge asymmetry” (quantified by the absolute value of f+ − f−) at any fixed pH value away from the isoelectric point (f+ = f−) decreases with increase in salt concentration. It is important to point out that we have neglected the charge regulation effect of polycations (polyanions) due to the presence of oppositely charged polyanions (polycations), which would further decrease the magnitude of charge asymmetry. This is particularly relevant in the coacervate phase, where the polyion concentrations can be comparable to or larger than the salt concentration.
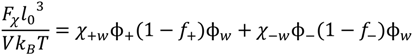

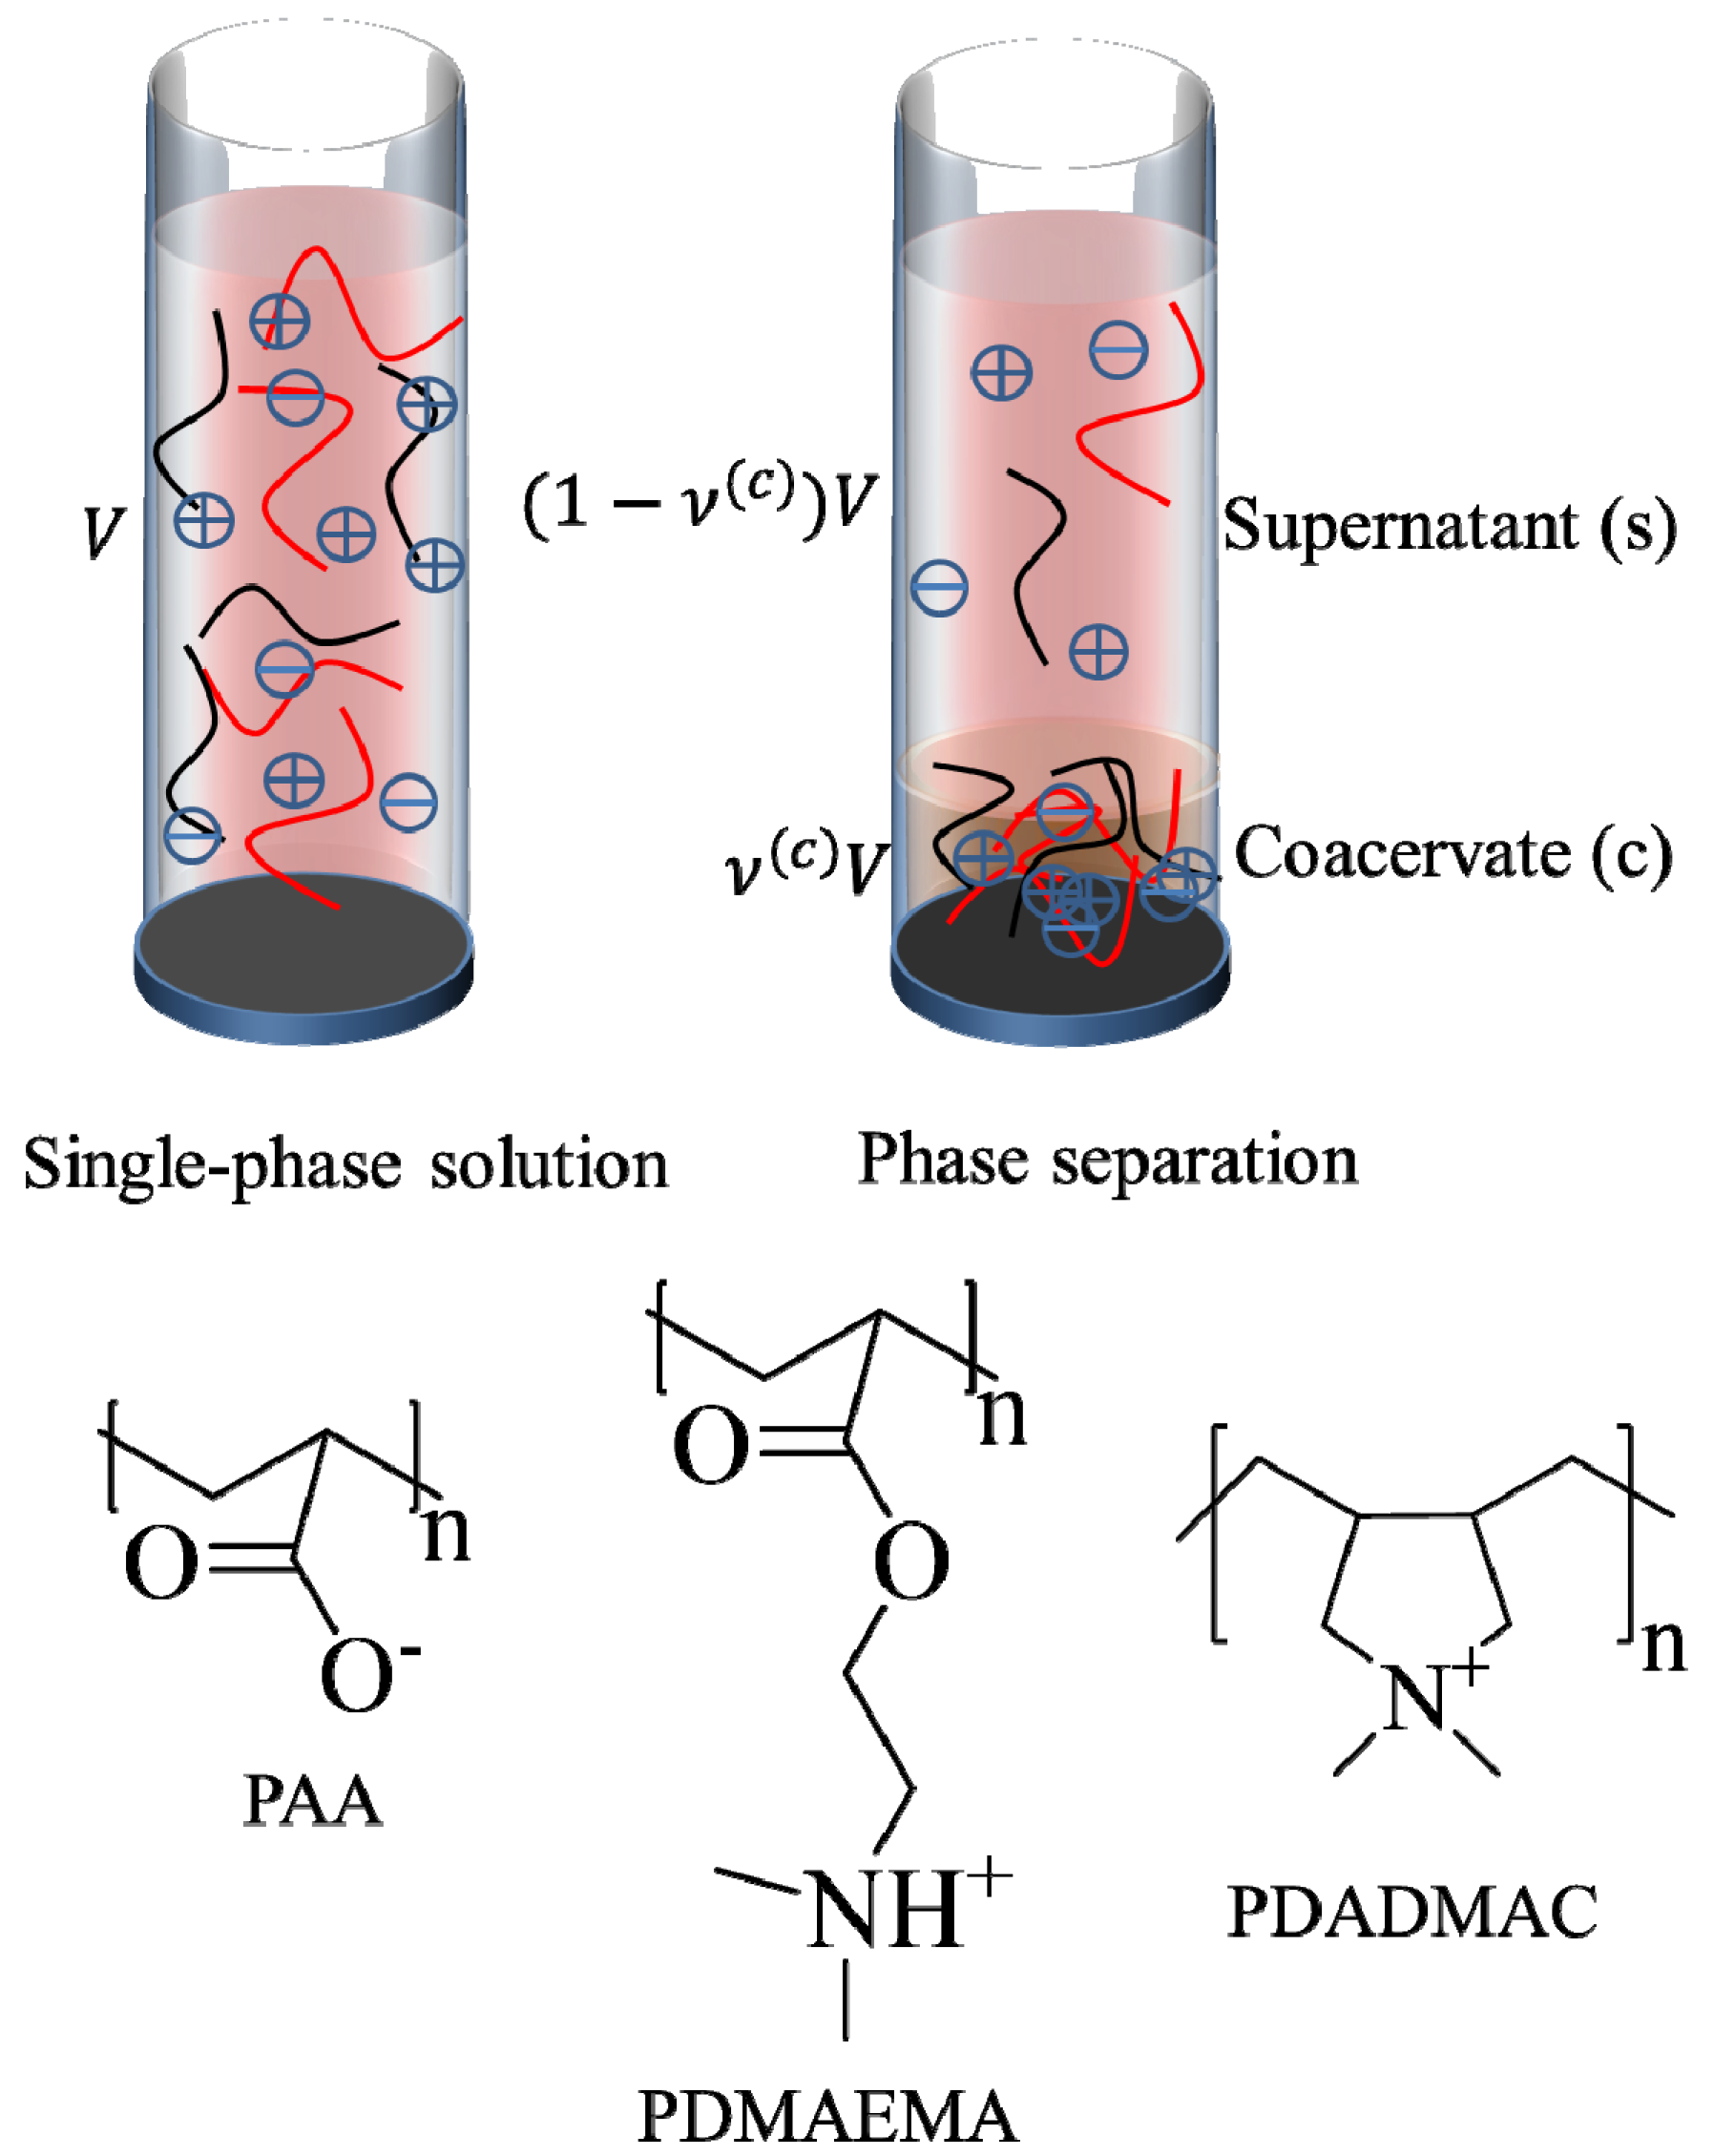
 . Other variables can be found by using the species/overall mass balance and electroneutrality condition in the individual phases and are given by the following expressions:
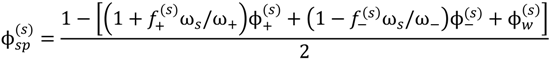
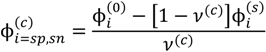
 , since a dense phase with very small volume or with nearly the same water content as the supernatant phase is difficult to resolve in experiments. Note that the free energy minimization approach we have employed to find the two phase equilibrium is equivalent to the standard approach of equating electrochemical potentials of components in the two phases [10], but is numerically more convenient for the present case.
 and
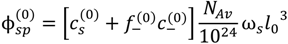
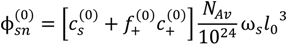
and  , can be obtained from their overall molar concentrations,
  and
and  , using Equation (1). The volume fractions of salt ions in the single-phase solution can also be given in terms of the overall salt concentration,
  , but also includes the concentrations of counterions of polyions. That is:
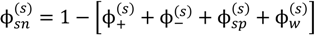
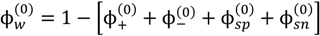
 at which phase separation occurs. Finally, the volume fraction of water in the single-phase solution is determined from the overall mass balance as:
2.2. Experiments
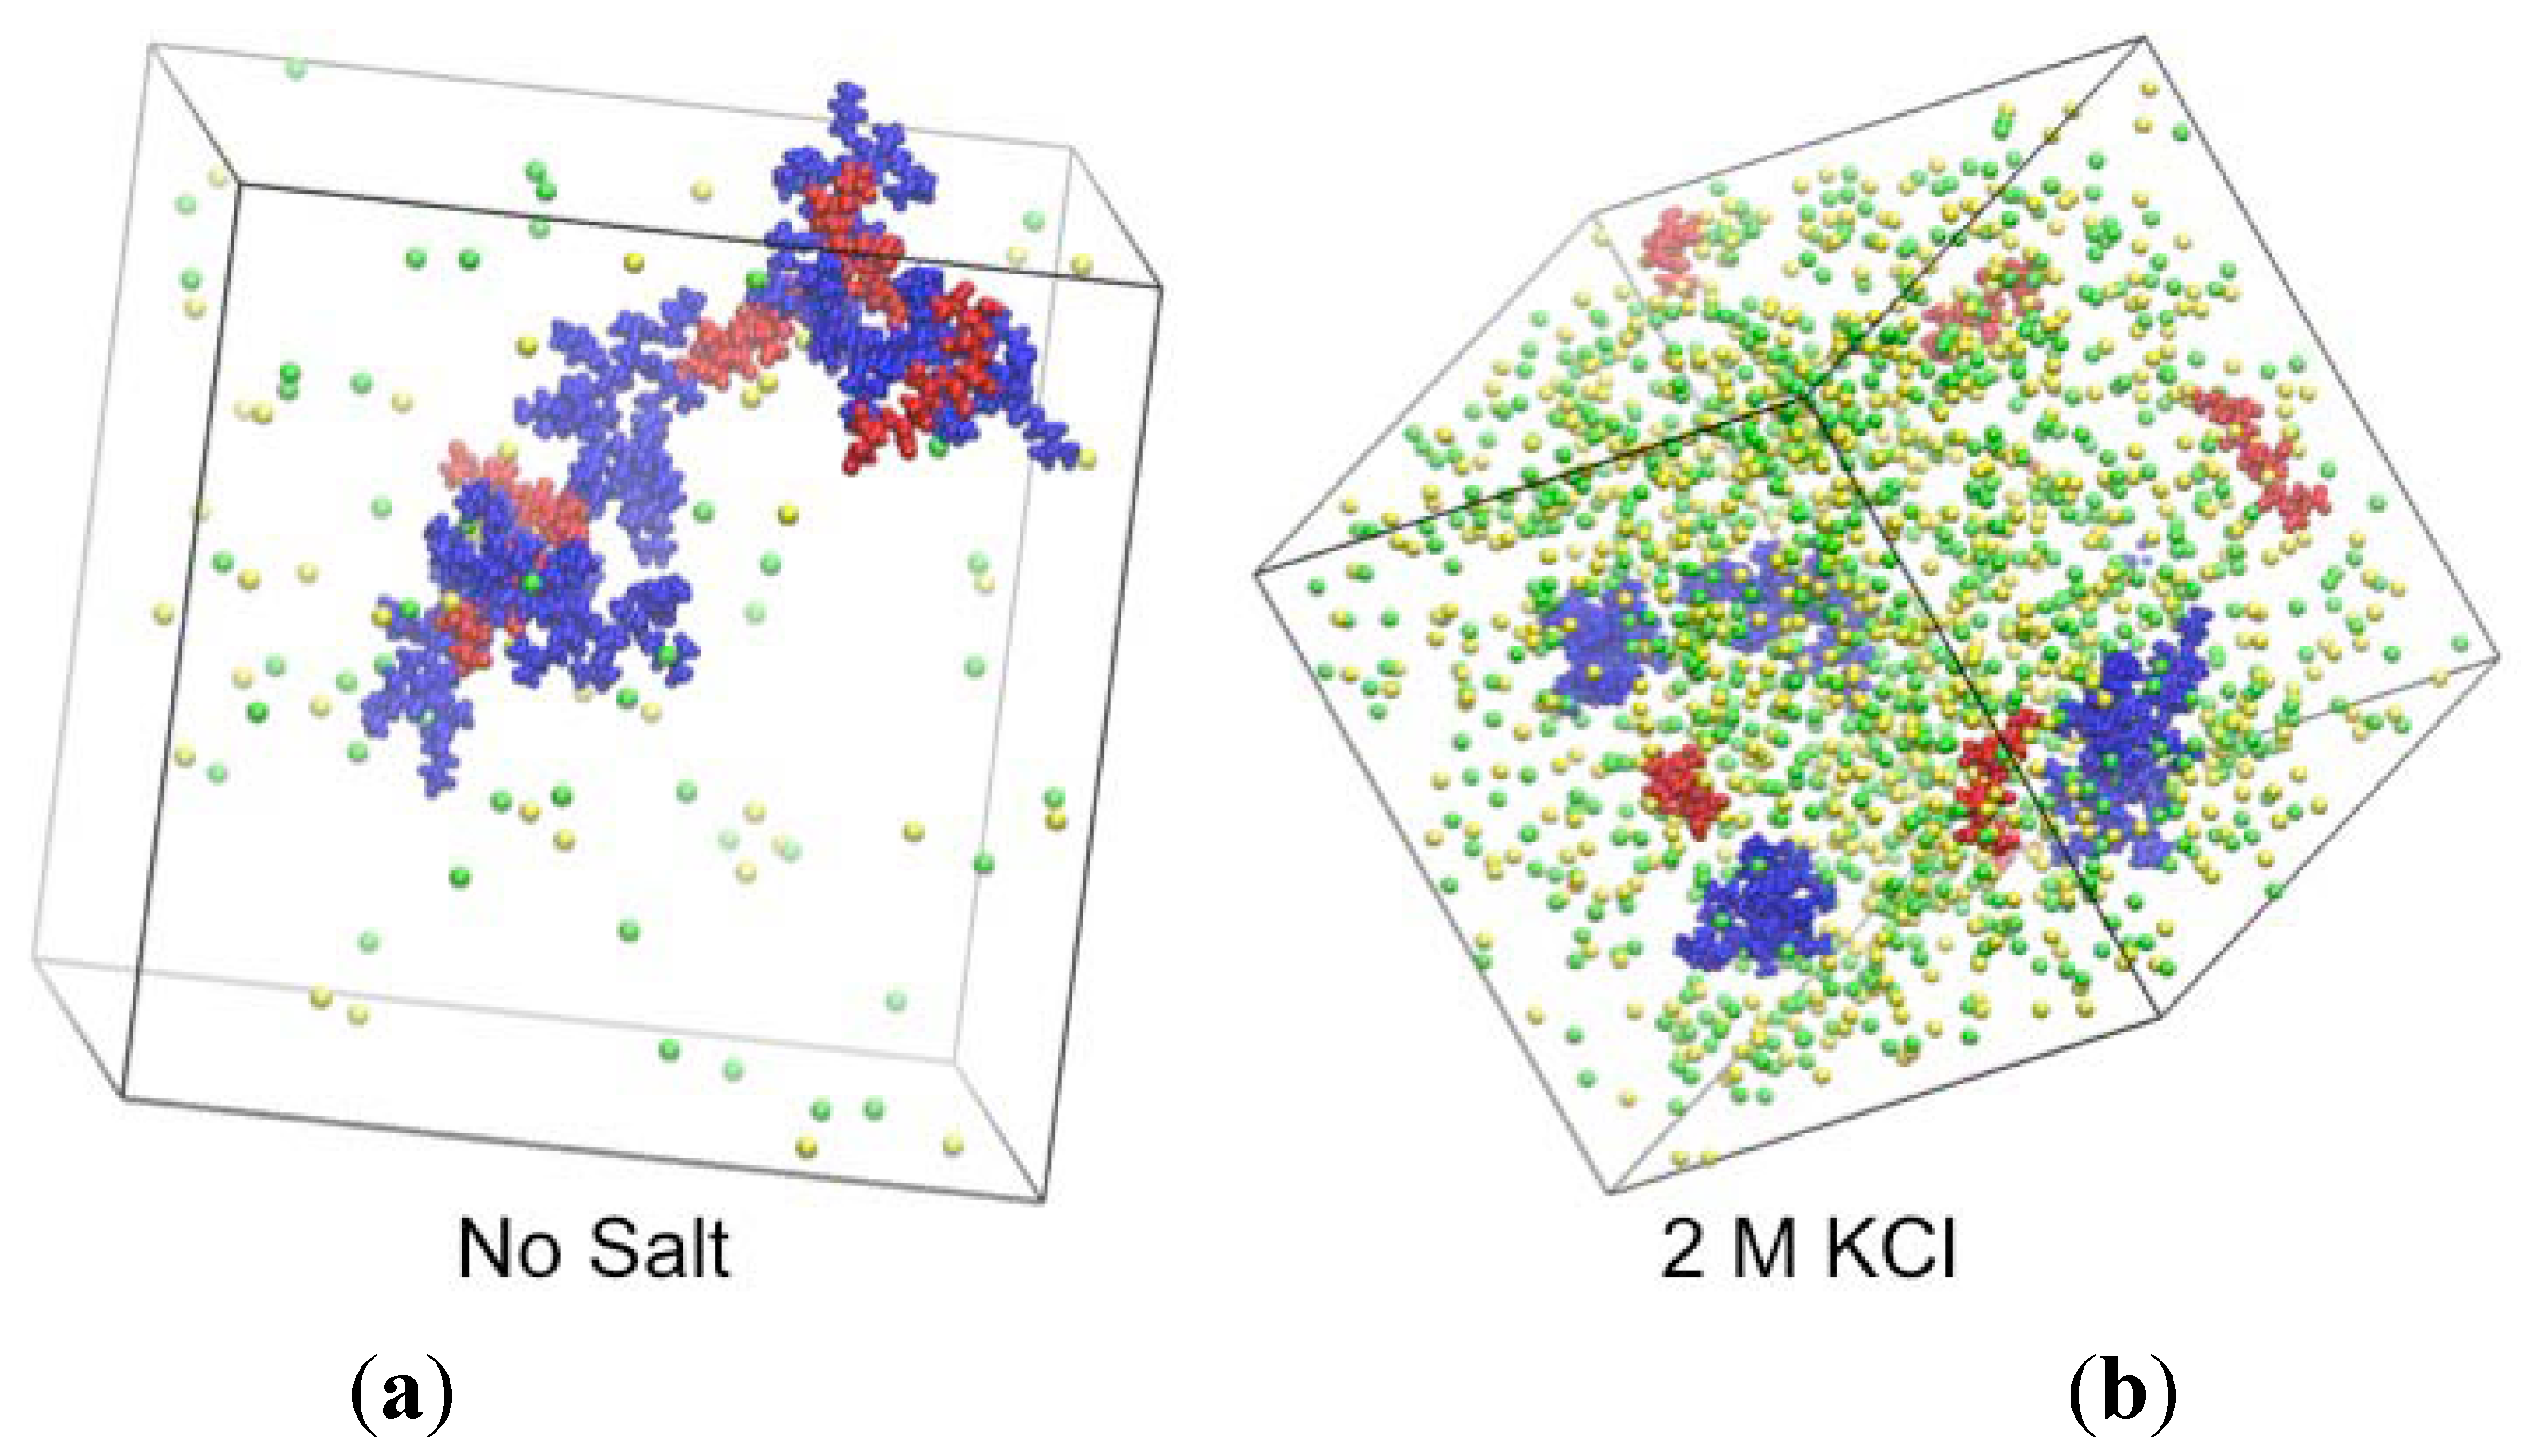
2.3. Simulations
3. Results and Discussion
) first increases with N and plateaus to a nearly constant value for high N. This is explained by a reduction in the translational entropy of polyions with increase in N. For N ≫ 1, the entropic penalty of forming a polyion complex is minimal and the enthalpic gain on complexation (accounted by the DH term in our theory) dominates, thus leading to large magnitude of . Satisfactory agreement is found between the theory and experiment using ω+ (PDMAEMA) = 1.8, ω− (PAA) = 1.2, and l = 0.26 nm, but at small N is slightly underestimated by the theory (as also observed by Spruijt et al. [10]). One possible cause of this discrepancy is that the polyions with small N are not flexible enough for the validity of Flory-Huggins expression (Equation (2)) for the translational entropy of polyions. Note that the agreement can be improved by adjusting ω+ or ω− with changes in N, with some loss of generality. Figure 3b shows the magnitude of of the PAA500-PDMAEMA527 system for different salts as a function of the average ion size l (experimental data) and fitting parameter l (theory). In general, salts with small ion size (e.g., LiCl) have higher than salts with large ion size (e.g., KI), with some exceptions. In our theory, this effect is accounted by using a smaller value of l for smaller ions compared to larger ions, which in turn reduces the entropic penalty for phase separation and gives rise to a higher  . In practice, an “effective” ion size l (reasonably close to the average ion size) can be chosen for any salt that allows a match to the experimental value of . However, the observed trend with different salts is often instead attributed to hydration effect of small ions not accounted in our theory [35]; small ions (e.g., Li+) have larger hydration shells than large ions (e.g., I−) and are therefore less effective in screening the electrostatic interactions between polyions. = = 0.11 M, l = 0.26 nm, and ω+ (PDMAEMA) = 1.8. (b) Critical salt concentration of PAA500-PDMAEMA527 system for different salts against the average ion size l (experiments, given by markers) and fitting parameter l (theory, given by the line). The model parameters are = = 0.05 M, ω+ (PDMAEMA) = 2, and χ+w = χ−w = 0. In both (a) and (b), the charge fraction of polyelectrolytes are assumed to be constant, f+ = f− = 0.95.
= = 0.11 M, l = 0.26 nm, and ω+ (PDMAEMA) = 1.8. (b) Critical salt concentration of PAA500-PDMAEMA527 system for different salts against the average ion size l (experiments, given by markers) and fitting parameter l (theory, given by the line). The model parameters are = = 0.05 M, ω+ (PDMAEMA) = 2, and χ+w = χ−w = 0. In both (a) and (b), the charge fraction of polyelectrolytes are assumed to be constant, f+ = f− = 0.95.
. In practice, an “effective” ion size l (reasonably close to the average ion size) can be chosen for any salt that allows a match to the experimental value of . However, the observed trend with different salts is often instead attributed to hydration effect of small ions not accounted in our theory [35]; small ions (e.g., Li+) have larger hydration shells than large ions (e.g., I−) and are therefore less effective in screening the electrostatic interactions between polyions. = = 0.11 M, l = 0.26 nm, and ω+ (PDMAEMA) = 1.8. (b) Critical salt concentration of PAA500-PDMAEMA527 system for different salts against the average ion size l (experiments, given by markers) and fitting parameter l (theory, given by the line). The model parameters are = = 0.05 M, ω+ (PDMAEMA) = 2, and χ+w = χ−w = 0. In both (a) and (b), the charge fraction of polyelectrolytes are assumed to be constant, f+ = f− = 0.95.
= = 0.11 M, l = 0.26 nm, and ω+ (PDMAEMA) = 1.8. (b) Critical salt concentration of PAA500-PDMAEMA527 system for different salts against the average ion size l (experiments, given by markers) and fitting parameter l (theory, given by the line). The model parameters are = = 0.05 M, ω+ (PDMAEMA) = 2, and χ+w = χ−w = 0. In both (a) and (b), the charge fraction of polyelectrolytes are assumed to be constant, f+ = f− = 0.95.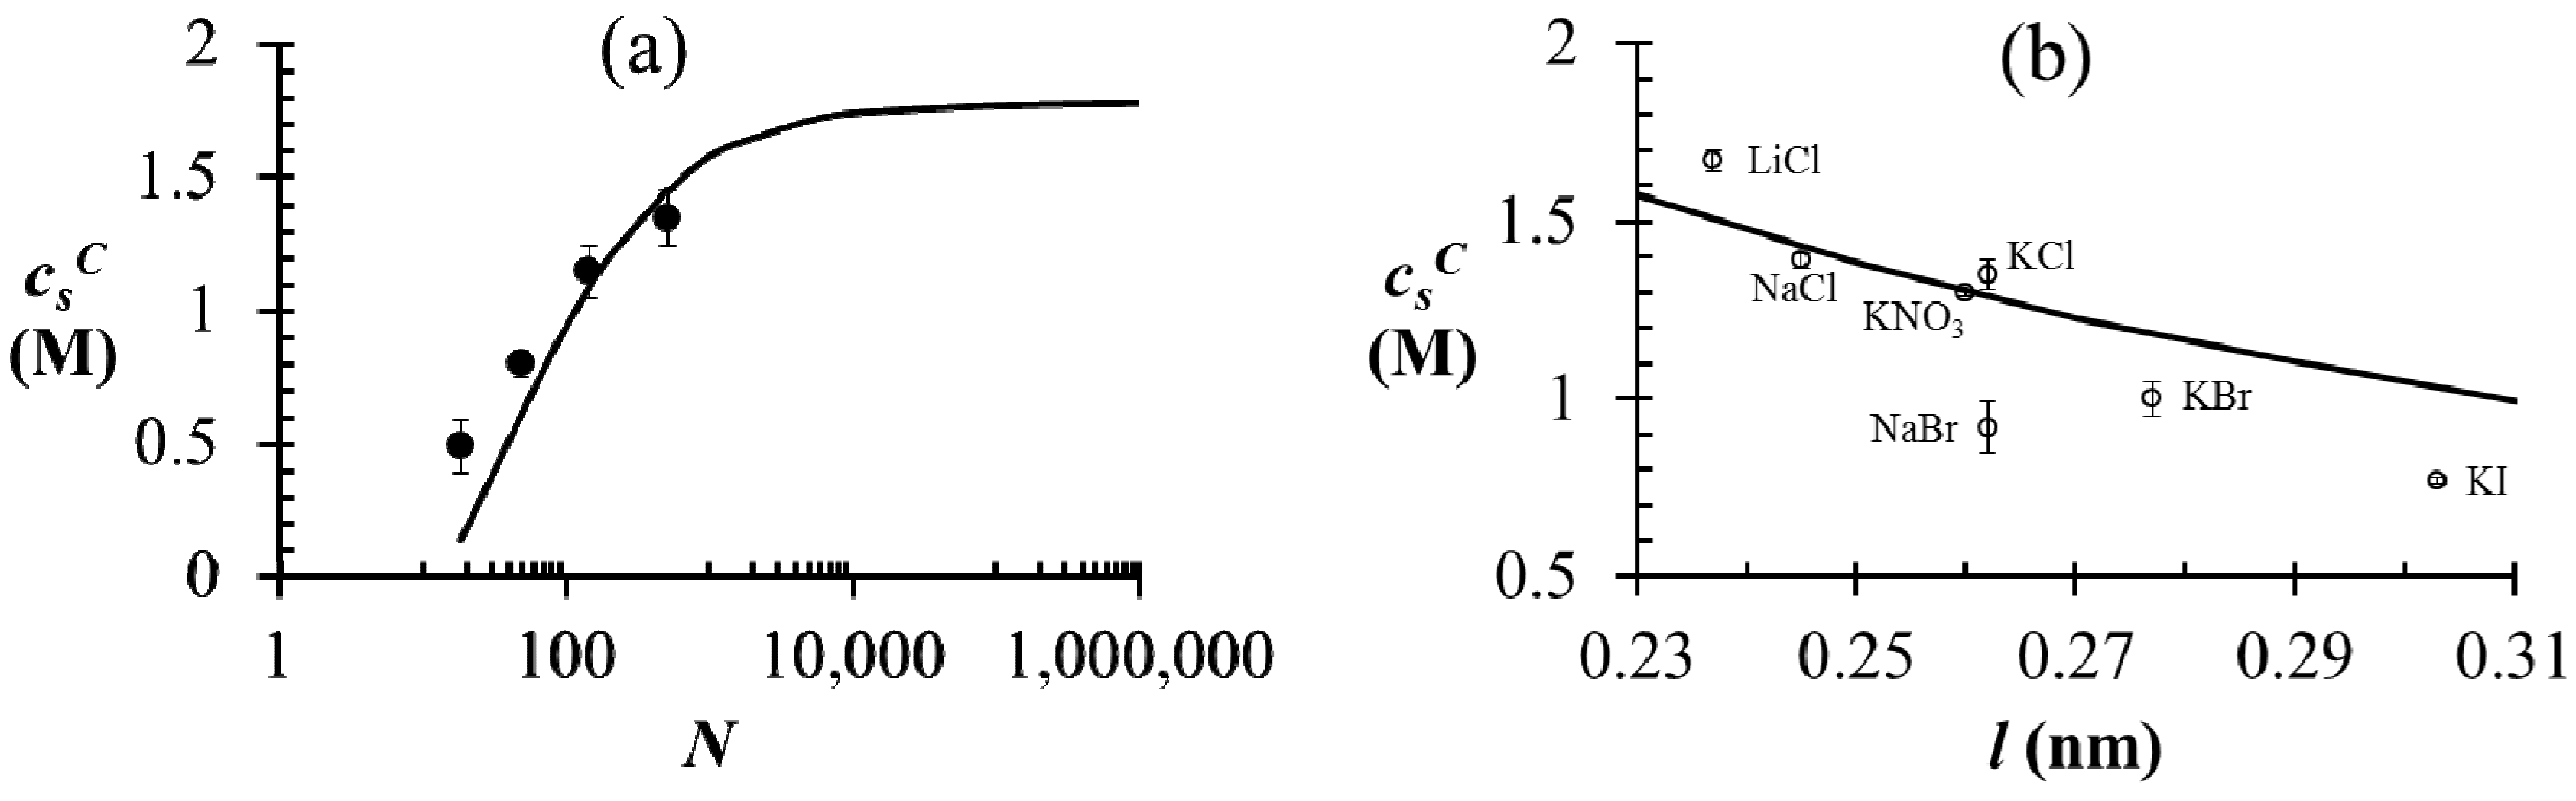 of PAA-PDMAEMA-KCl and PAA-PDADMAC-KCl mixtures against the mixture pH. For PAA-PDMAEMA-KCl system, the theory without additional hydrophobic effects (χ+w = χ−w = 0) predicts little or no coacervation ( ≈ 0 M) at low and high pH (pH < 4.5 and pH > 8), and maximum coacervation in the intermediate pH range (pH = 5 − 7.5). Overall, the profile is symmetric around pH ≈ 6.5. This is understandable since PAA at low pH and PDMAEMA at high pH are barely charged, thus resulting in vanishing of the electrostatic driving force for coacervation. However, the experimental results show a non-symmetric profile with > 3 M for pH < 4.5. This necessitates the introduction of hydrophobic interactions (χ−w = 0.75), which satisfactorily captures this asymmetry in the profile of . This assumption appears to be justified for PAA, since PAA is relatively insoluble at low pH when most carboxylic groups are protonated and form intra-chain hydrogen bonds [42,43]. The PAA-PDADMAC-KCl system shows a non-symmetric profile even for the theory without additional hydrophobic effects, since PDADMAC is fully ionized at all pH values. However, additional hydrophobic interactions (χ−w = 0.75) are still needed to account for its high at low pH (pH < 5), since PAA is barely charged under those conditions. Note that, in both these cases, while the inclusion of additional hydrophobic interactions does capture the qualitative trend and theoretical predictions match well with experiments for intermediate and high pH, the quantitative agreement is relatively poor for low pH. > 3 M imply phase separation over the entire experimental range ( ≤ 3 M). Bold lines represent fits of the theory with no Flory interactions (χij = 0). Dashed lines are fits with additional Flory interactions between neutral PAA monomers and water, χ−w (PAA) = 0.7. In this and the following figures, = = 0.11 M, ω+ (PDMAEMA) = 2, ω+ (PDADMAC) = 4.5, χ+w (PDMAEMA) = χ+w (PDADMAC) = 0, f− (PAA) and f+ (PDMAEMA) are determined using Equations (6) and (7) with pKa (PAA) and pKb (PDMAEMA) evaluated using the empirical equation given in Figure 2a, and f+ (PDADMAC) = 1. (b) Theoretical predictions of critical salt concentration against pH for PAA597-PDMAEMA526-KCl for different lB values and χ−w (PAA) = 0.75.
> 3 M imply phase separation over the entire experimental range ( ≤ 3 M). Bold lines represent fits of the theory with no Flory interactions (χij = 0). Dashed lines are fits with additional Flory interactions between neutral PAA monomers and water, χ−w (PAA) = 0.7. In this and the following figures, = = 0.11 M, ω+ (PDMAEMA) = 2, ω+ (PDADMAC) = 4.5, χ+w (PDMAEMA) = χ+w (PDADMAC) = 0, f− (PAA) and f+ (PDMAEMA) are determined using Equations (6) and (7) with pKa (PAA) and pKb (PDMAEMA) evaluated using the empirical equation given in Figure 2a, and f+ (PDADMAC) = 1. (b) Theoretical predictions of critical salt concentration against pH for PAA597-PDMAEMA526-KCl for different lB values and χ−w (PAA) = 0.75.
of PAA-PDMAEMA-KCl and PAA-PDADMAC-KCl mixtures against the mixture pH. For PAA-PDMAEMA-KCl system, the theory without additional hydrophobic effects (χ+w = χ−w = 0) predicts little or no coacervation ( ≈ 0 M) at low and high pH (pH < 4.5 and pH > 8), and maximum coacervation in the intermediate pH range (pH = 5 − 7.5). Overall, the profile is symmetric around pH ≈ 6.5. This is understandable since PAA at low pH and PDMAEMA at high pH are barely charged, thus resulting in vanishing of the electrostatic driving force for coacervation. However, the experimental results show a non-symmetric profile with > 3 M for pH < 4.5. This necessitates the introduction of hydrophobic interactions (χ−w = 0.75), which satisfactorily captures this asymmetry in the profile of . This assumption appears to be justified for PAA, since PAA is relatively insoluble at low pH when most carboxylic groups are protonated and form intra-chain hydrogen bonds [42,43]. The PAA-PDADMAC-KCl system shows a non-symmetric profile even for the theory without additional hydrophobic effects, since PDADMAC is fully ionized at all pH values. However, additional hydrophobic interactions (χ−w = 0.75) are still needed to account for its high at low pH (pH < 5), since PAA is barely charged under those conditions. Note that, in both these cases, while the inclusion of additional hydrophobic interactions does capture the qualitative trend and theoretical predictions match well with experiments for intermediate and high pH, the quantitative agreement is relatively poor for low pH. > 3 M imply phase separation over the entire experimental range ( ≤ 3 M). Bold lines represent fits of the theory with no Flory interactions (χij = 0). Dashed lines are fits with additional Flory interactions between neutral PAA monomers and water, χ−w (PAA) = 0.7. In this and the following figures, = = 0.11 M, ω+ (PDMAEMA) = 2, ω+ (PDADMAC) = 4.5, χ+w (PDMAEMA) = χ+w (PDADMAC) = 0, f− (PAA) and f+ (PDMAEMA) are determined using Equations (6) and (7) with pKa (PAA) and pKb (PDMAEMA) evaluated using the empirical equation given in Figure 2a, and f+ (PDADMAC) = 1. (b) Theoretical predictions of critical salt concentration against pH for PAA597-PDMAEMA526-KCl for different lB values and χ−w (PAA) = 0.75.
> 3 M imply phase separation over the entire experimental range ( ≤ 3 M). Bold lines represent fits of the theory with no Flory interactions (χij = 0). Dashed lines are fits with additional Flory interactions between neutral PAA monomers and water, χ−w (PAA) = 0.7. In this and the following figures, = = 0.11 M, ω+ (PDMAEMA) = 2, ω+ (PDADMAC) = 4.5, χ+w (PDMAEMA) = χ+w (PDADMAC) = 0, f− (PAA) and f+ (PDMAEMA) are determined using Equations (6) and (7) with pKa (PAA) and pKb (PDMAEMA) evaluated using the empirical equation given in Figure 2a, and f+ (PDADMAC) = 1. (b) Theoretical predictions of critical salt concentration against pH for PAA597-PDMAEMA526-KCl for different lB values and χ−w (PAA) = 0.75.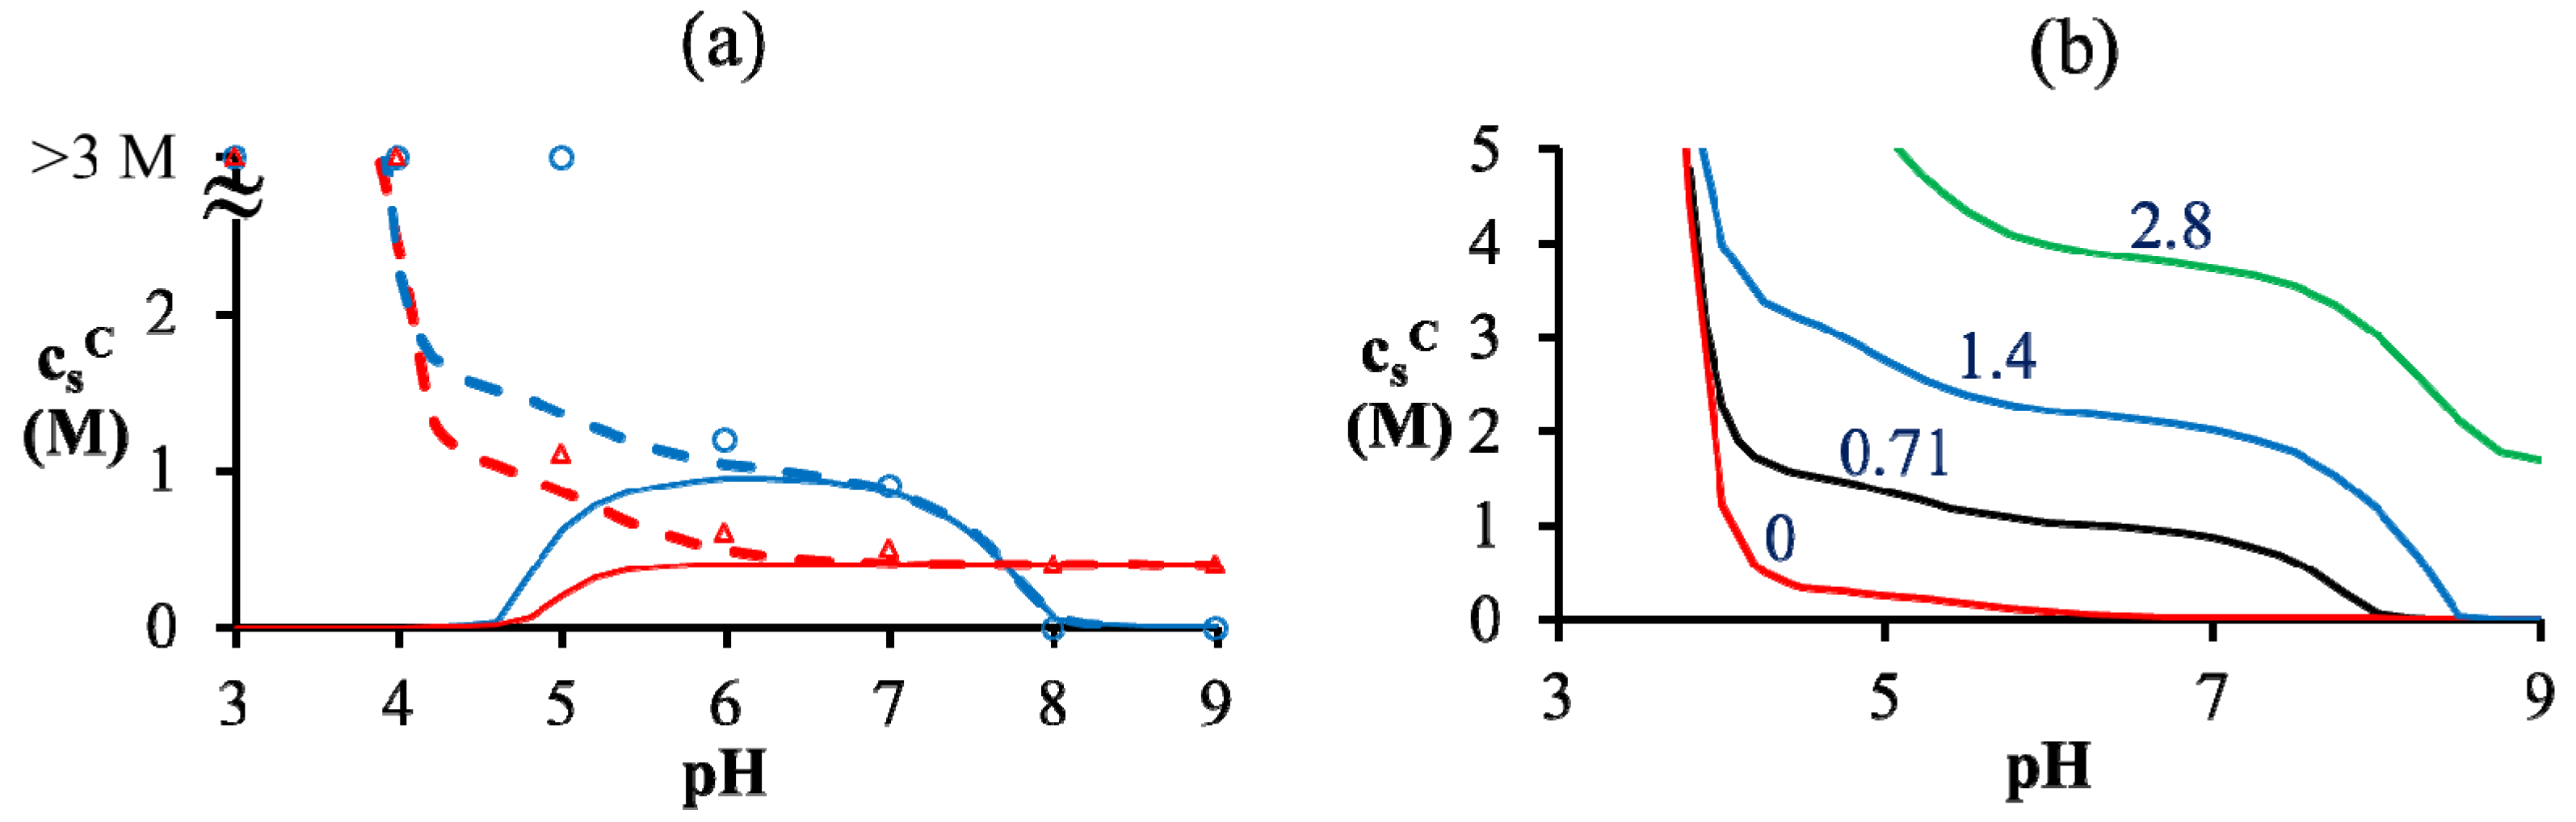 at low pH compared to intermediate pH, where both polyions are almost fully charged. Another explanation could be the presence of additional, secondary interactions between polyions such as ion-dipole interactions speculated for the PAA-PDADMAC pair in an earlier study [43]. This effect could be included by using a non-zero Flory interaction between polyions χ+−, which is not considered here. Yet another, more reasonable, explanation is that even the extended DH approximation does not capture the electrostatic effects at salt concentrations > 2 M, where excluded volume effects of salt ions are expected to be important. If, in addition, polyion concentrations in the dense phase are also high (or equivalently, water content is low), the dielectric constant of the dense phase would be significantly smaller than the water dielectric constant used in the theory. The proper treatment of dielectric constant variations is complicated by the need to assume an expression for the concentration dependence of dielectric constant and account for the differences in the ion solvation energies between the coacervate and supernatant. However, we illustrate the effect of changes in dielectric constant in Figure 4b using a simplifying assumption that the dielectric constant is still same in the dense phase and supernatant, but less than that of water. This simplification ensures the applicability of our theory without extending it to include ion solvation effects and concentration dependence of dielectric constant. A decrease in dielectric constant indeed results in an increase in as illustrated in Figure 4b for different lB (∝ 1/ϵr) values. Since the dielectric constant of polyelectrolytes (ϵr ∼ 1) is much smaller than water (ϵr ≈ 80), lB of a dense phase containing ~50 wt% water should be roughly twice (lB ∼ 1.4 at 20 °C) that of pure water (lB ≈ 0.71 nm at 20 °C), if the dielectric constant varies linearly with weight fraction of components. As we show later, water weight fractions at low pH (pH = 4 and pH = 5) are indeed low (∼ 50 wt%). Thus, we believe that the changes in dielectric constant on complexation could explain the behavior at low pH in Figure 4a, in addition to inclusion of hydrophobicity of neutral PAA monomers. ≈ 1 M. At intermediate pH (pH = 7 in the Figure 5a,b), both PAA and PDMAEMA/PDADMAC are almost fully ionized, thus leading to almost equal concentration of the two polyions in the dense phase at high salt concentrations (> 1 M). However, the concentration of PAA and PDMAEMA/PDADMAC in the supernatant/dense phase is significantly different for low salt concentrations (< 1 M). This can be attributed to the fact that the degree of dissociation of PAA and PDMAEMA (Figure 2b) at a given pH first increases with increase in salt concentration and then plateaus at high salt concentration, while the degree of dissociation of PDADMAC is always near unity. It is worth pointing out that Figure 5a,b are not binodal plots in a strict sense, since the concentrations of positive and negative salt ions are not assumed to be identical, cs+ ≠ cs−, and the salt concentrations in the supernatant and dense phases are not equal. While a quaternary phase diagram in terms of concentrations of polyions (c+ and c−) and salt ions (cs+ and cs−) could be more appropriate, we use a simpler representation in Figure 5a,b in terms of polyion concentrations, c+ and c−, and the total salt concentration, . Therefore, the polyion concentrations in the dense phase and supernatant do not appear to converge (c+ ≠ c−) at the critical salt concentration in some cases in Figure 5a,b as one might expect for a binodal plot. The convergence is particularly poor for the pH = 4 case, where larger hydrophobicity of PAA compared to PDMAEMA and PDADMAC results in a larger accumulation of PAA in the dense phase than required for neutralizing the polyanion charge. This, in turn, results in a larger accumulation of positive salt ions in the dense phase than compared to the supernatant phase,
  , in order to maintain charge neutrality in the dense phase. On the other hand,
  at the critical salt concentration for pH = 5 and pH = 7 cases in Figure 5a,b, which results in an apparent convergence (c+ ≠ c−) at the critical salt concentration.
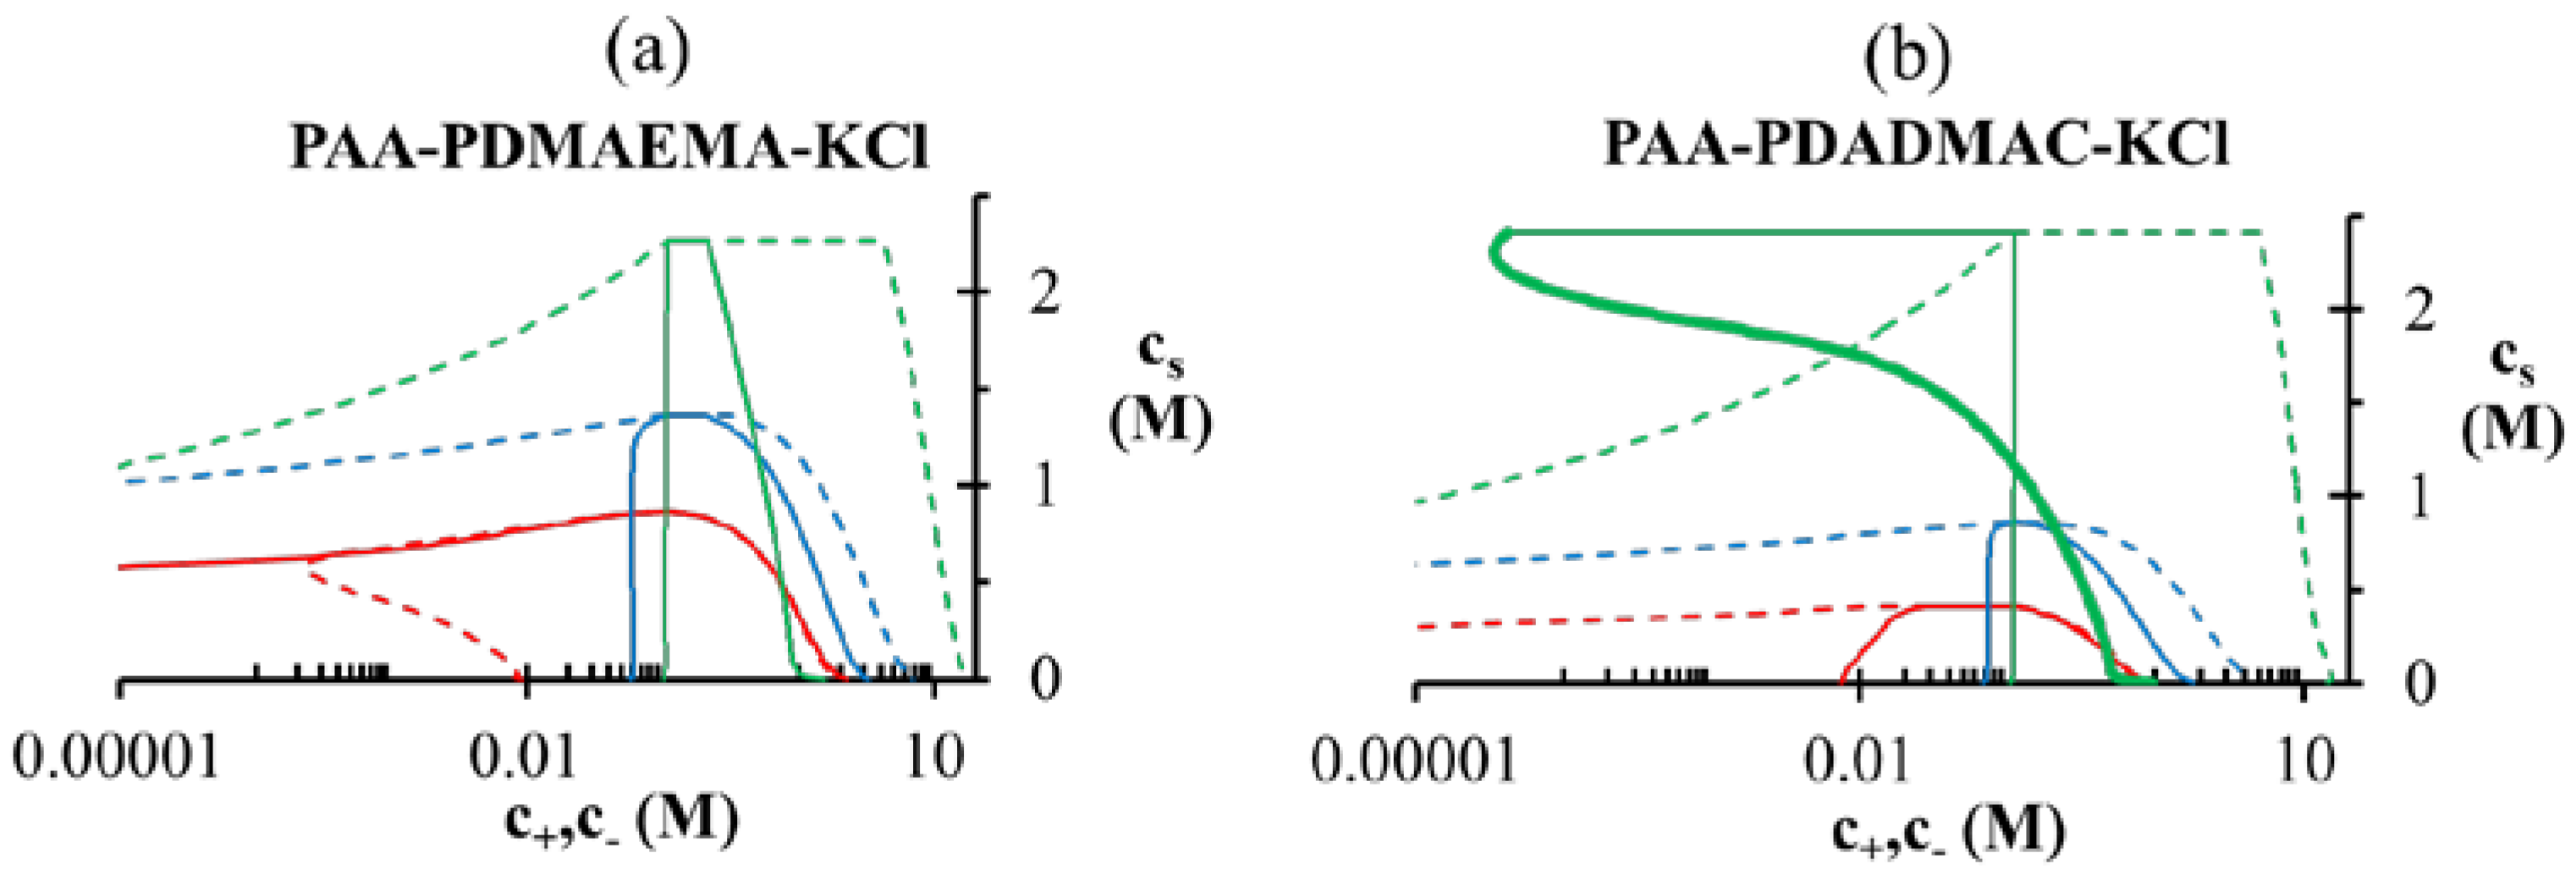
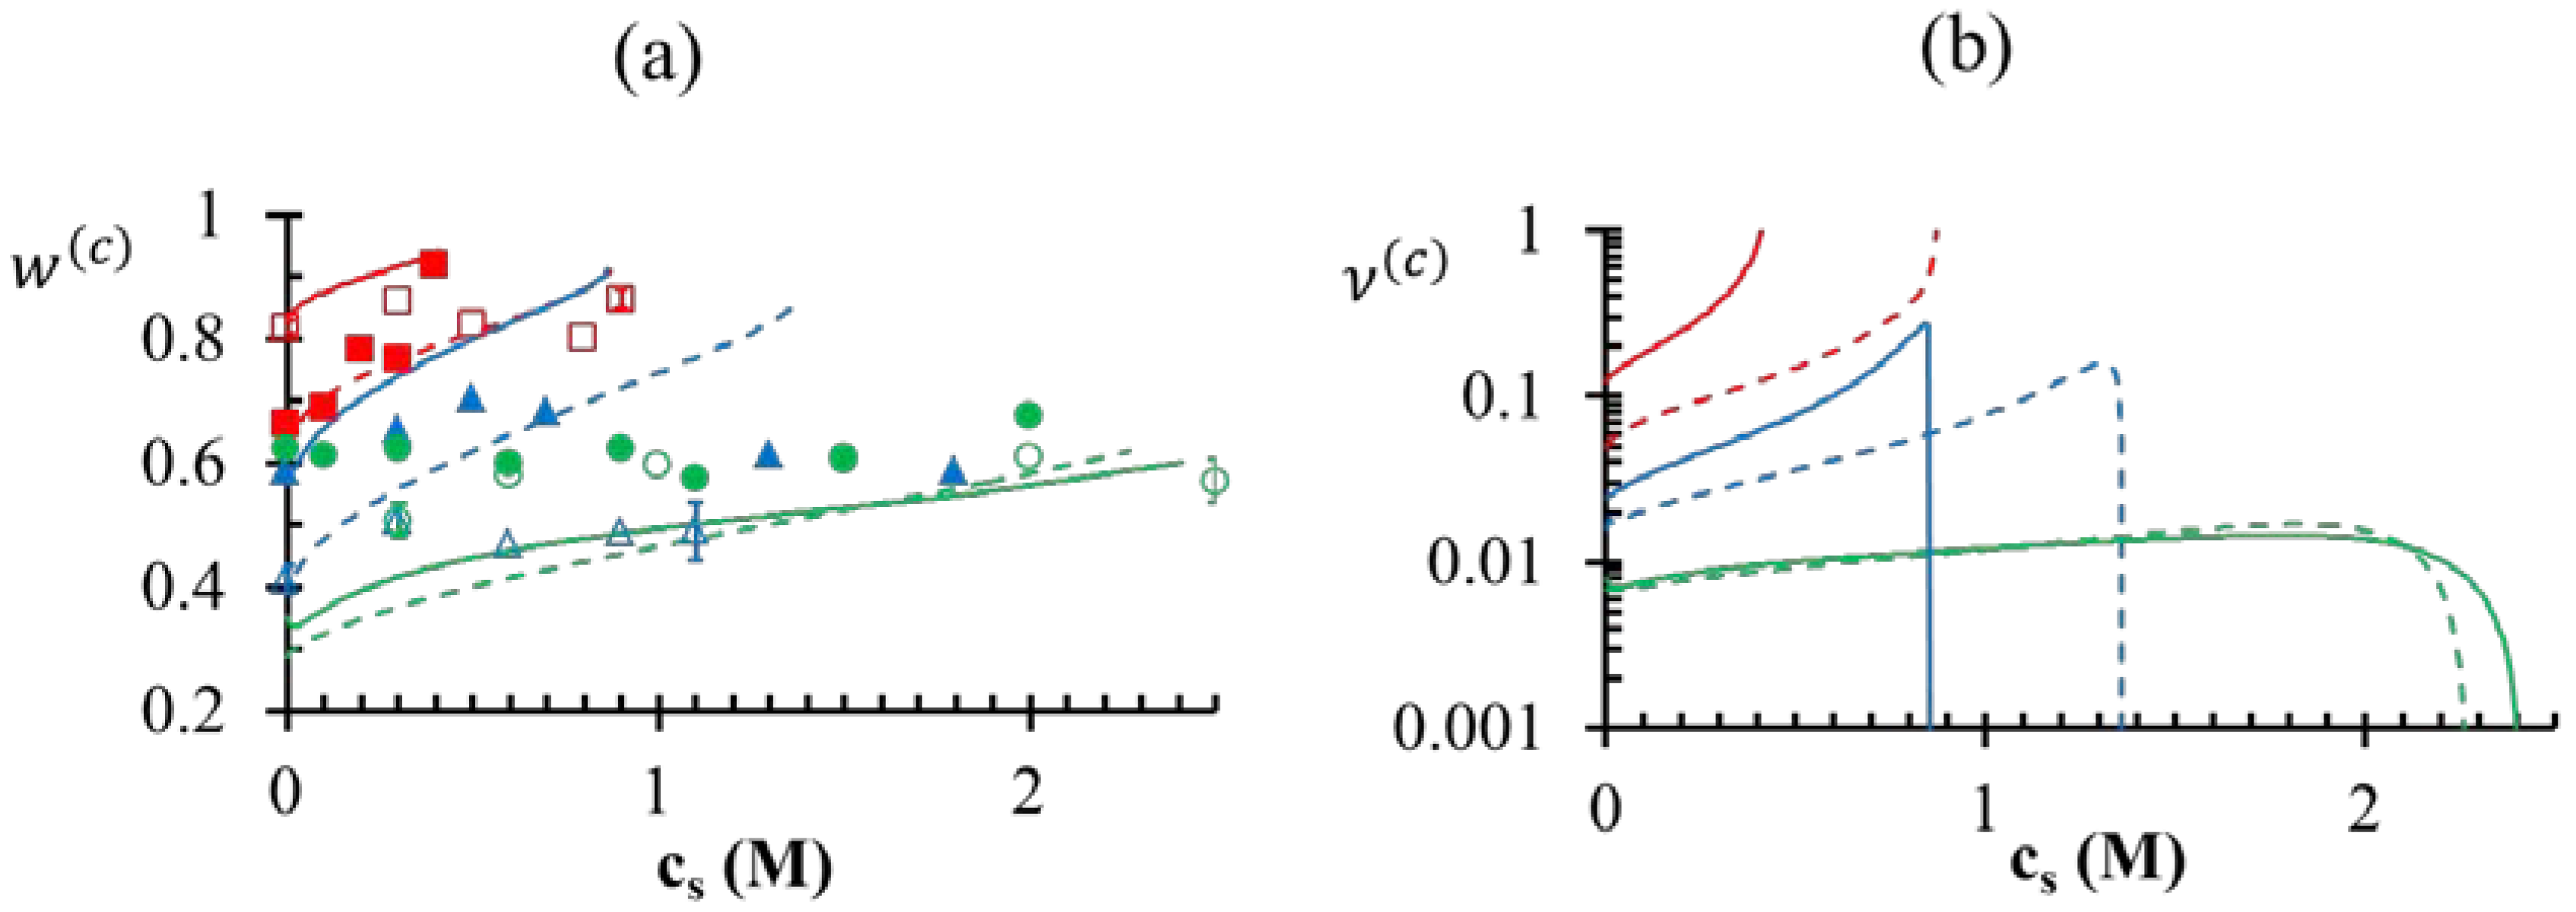
 ). At the critical salt concentration, the volume fractions of the water in the two phases are equal (
  ). Also, the maximum value of v(c) is generally attained at a salt concentration smaller than, but in the vicinity of, the critical salt concentration. Further increase in salt concentration beyond this point results in vanishing of the dense phase accompanied by a sharp decrease in the dense-phase volume (for pH = 4 and pH = 5 cases represented by green and blue lines, respectively, in Figure 7a,b) or the vanishing of the supernatant phase accompanied by a sharp increase in the dense phase volume (for pH = 7 case represented by red lines in Figure 7a,b). ≤ 5 M for the pH = 5 case, which bears similarity to the low pH behavior we observe for the PAA-PDMAEMA-KCl and PAA-PDADMAC-KCl systems. However, Priftis and Tirrell [9] observed a somewhat different trend in their experiments on polypeptide complexation. They observed that the critical salt concentration always increased with an increase in degree of dissociation of polyelectrolytes, as we find theoretically in the absence of hydrophobicity effects (χ+w = χ−w = 0) in Figure 4a. Further, all these studies [2,3,9] have reported a precipitate → coacervate transition with increase in salt concentration. The high critical salt concentrations at low pH observed in our experiments also shows resemblance to the increased stability of multilayer films containing weak polycarboxylic acids at low pH observed in an earlier experimental study [45], where the critical salt concentration required to dissolve the multilayers was found to increase dramatically at low pH.
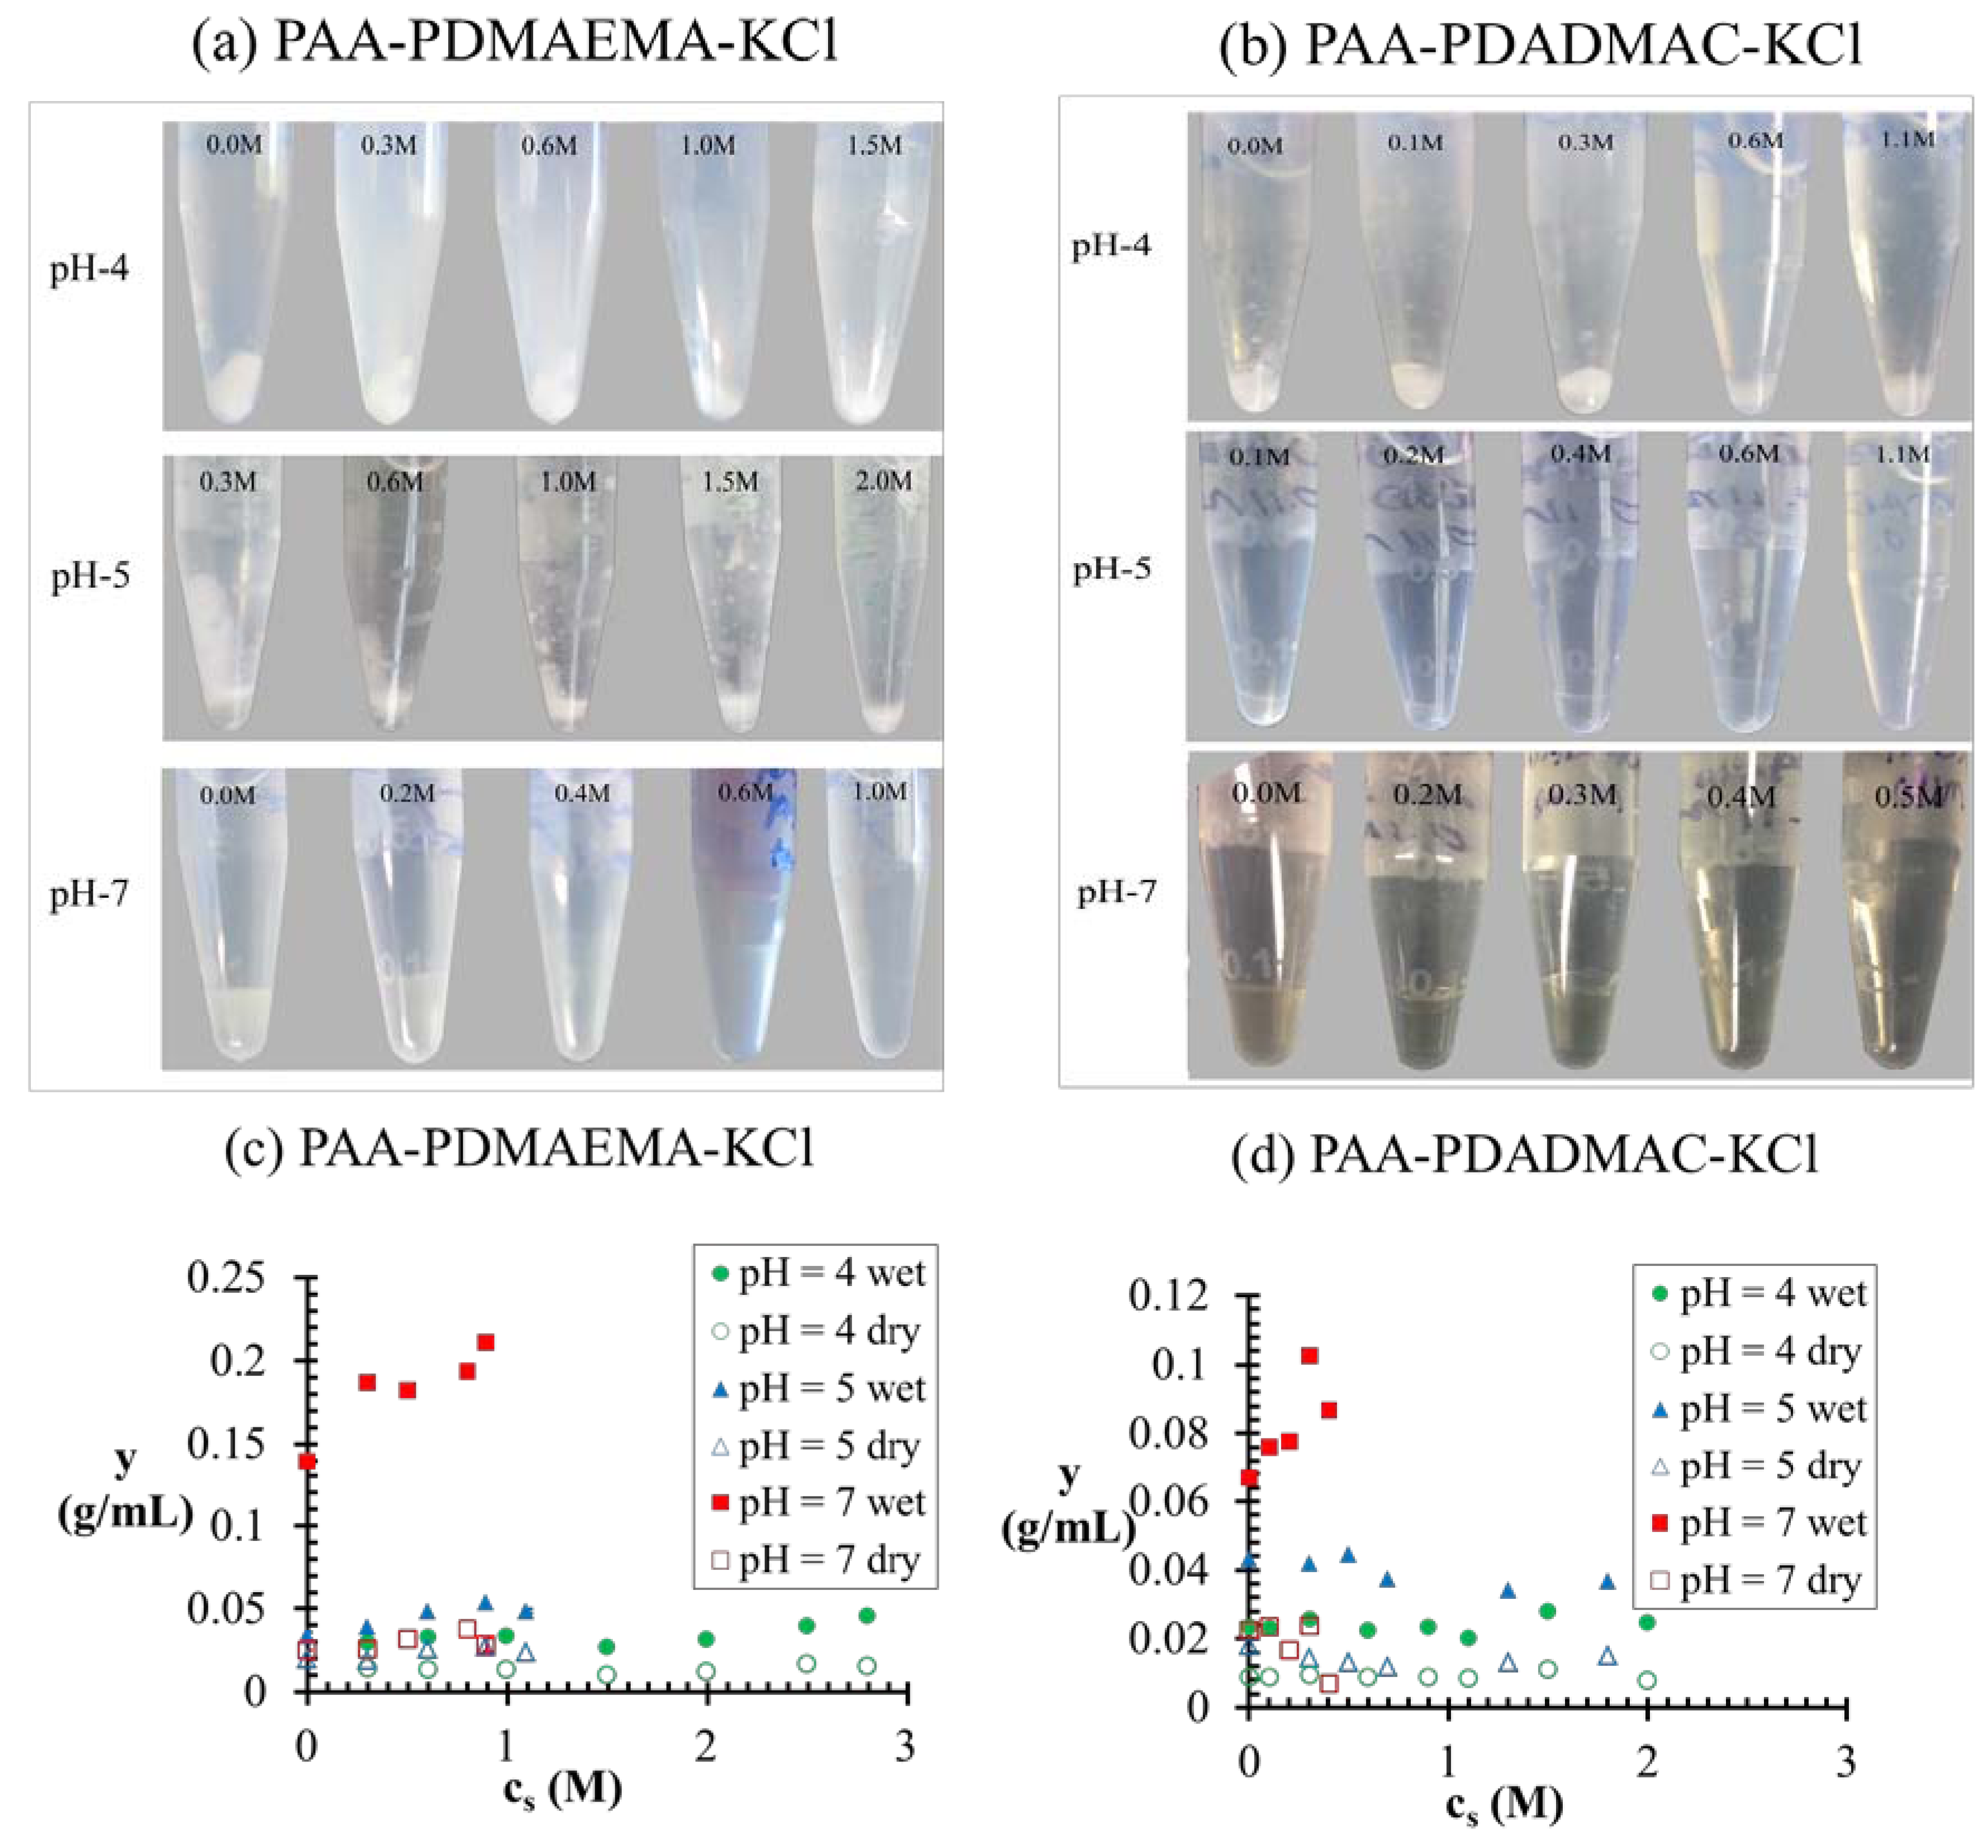
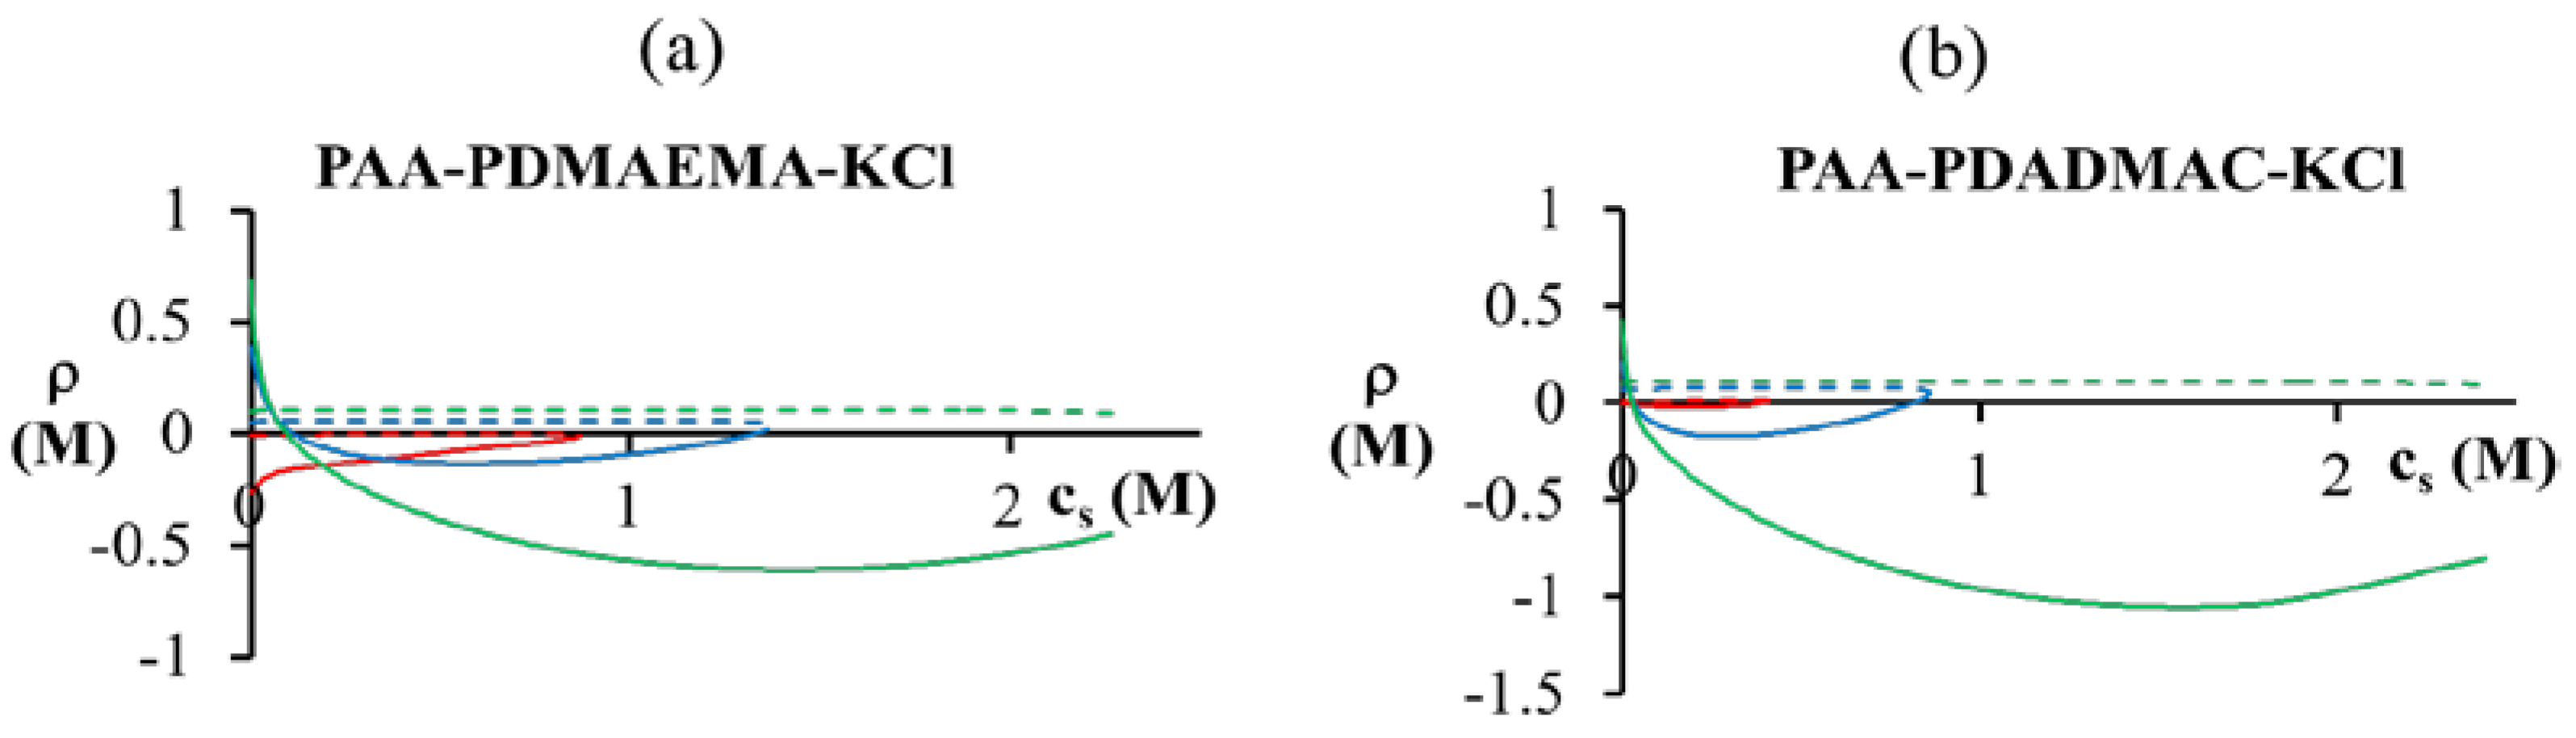
 < 0.1 M), PDMAEMA charges in the dense phase are not completely compensated (ρ > 0). The situation is reversed for high salt concentrations ( > 0.1 M), where the PDMAEMA charges are overcompensated by PAA (ρ < 0). Some overcompensation by PAA in the dense phase is observed even at other pH values in the figure, but little or no overcompensation occurs in the supernatant phase (ρ ≈ 0).

4. Conclusions
Acknowledgments
Author Contributions
Conflicts of Interest
References
- Van der Gucht, J.; Spruijt, E.; Lemmers, M.; Cohen Stuart, M.A. Polyelectrolyte complexes: Bulk phases and colloidal systems. J. Colloid Interface Sci. 2011, 361, 407–422. [Google Scholar] [CrossRef]
- Chollakup, R.; Beck, J.B.; Dirnberger, K.; Tirrell, M.; Eisenbach, C.D. Polyelectrolyte Molecular Weight and Salt Effects on the Phase Behavior and Coacervation of Aqueous Solutions of Poly(acrylic acid) Sodium Salt and Poly(allylamine) Hydrochloride. Macromolecules 2013, 46, 2376–2390. [Google Scholar] [CrossRef]
- Chollakup, R.; Smitthipong, W.; Eisenbach, C.D.; Tirrell, M. Phase Behavior and Coacervation of Aqueous Poly(acrylic acid)−Poly(allylamine) Solutions. Macromolecules 2010, 43, 2518–2528. [Google Scholar] [CrossRef]
- Lindhoud, S.; Cohen Stuart, M.A. Relaxation phenomena during polyelectrolyte complex formation. Adv. Polym. Sci. 2012, 255, 139–172. [Google Scholar] [CrossRef]
- Bungenberg de Jong, H.G.; Kruyt, H.R. Coacervation. (Partial Miscibility in Colloid Systems). Available online: http://www.dwc.knaw.nl/DL/publications/PU00015781.pdf (accessed on 12 May 2014).
- Oparin, A.I. The Origin of Life; The Macmillan Company: New York, NY, USA, 1938. [Google Scholar]
- Miller, S.L.; Schopf, J.W.; Lazcano, A. Oparin’s “Origin of Life”: Sixty Years Later. J. Mol. Evol. 1997, 44, 351–353. [Google Scholar] [CrossRef]
- Priftis, D.; Megley, K.; Laugel, N.; Tirrell, M. Complex Coacervation of Poly(ethylene-imine)/Polypeptide Aqueous Solutions: Thermodynamic and Rheological Characterization. J. Colloid Interface Sci. 2013, 398, 39–50. [Google Scholar] [CrossRef]
- Priftis, D.; Tirrell, M. Phase behaviour and complex coacervation of aqueous polypeptide solutions. Soft Matter 2012, 8, 9396–9405. [Google Scholar] [CrossRef]
- Spruijt, E.; Westphal, A.H.; Borst, J.W.; Cohen Stuart, M.A.; van der Gucht, J. Binodal compositions of polyelectrolyte complexes. Macromolecules 2010, 43, 6476–6484. [Google Scholar] [CrossRef]
- Wang, J.; Cohen Stuart, M.A.; van der Gucht, J. Phase Diagram of Coacervate Complexes Containing Reversible Coordination Structures. Macromolecules 2012, 45, 8903–8909. [Google Scholar] [CrossRef]
- Kizilay, E.; Kayitmazer, A.B.; Dubin, P.L. Complexation and coacervation of polyelectrolytes with oppositely charged colloids. Adv. Colloid Interface Sci. 2011, 167, 24–37. [Google Scholar] [CrossRef]
- Sukhishvili, S.A.; Kharlampieva, E.; Izumrudov, V. Where polyelectrolyte multilayers and polyelectrolyte complexes meet. Macromolecules 2006, 39, 8873–8881. [Google Scholar] [CrossRef]
- Xu, L.; Pristinski, D.; Zhuk, A.; Stoddart, C.; Ankner, J.F.; Sukhishvili, S.A. Linear versus Exponential Growth of Weak Polyelectrolyte Multilayers: Correlation with Polyelectrolyte Complexes. Macromolecules 2012, 45, 3892–3901. [Google Scholar] [CrossRef]
- Wohl, B.M.; Engbersen, J.F. Responsive layer-by-layer materials for drug delivery. J. Control. Release 2012, 158, 2–14. [Google Scholar] [CrossRef]
- Yoon, H.; Dell, E.J.; Freyer, J.L.; Campos, L.M.; Jang, W.D. Polymeric supramolecular assemblies based on multivalent ionic interactions for biomedical applications. Polymer 2014, 55, 453–464. [Google Scholar] [CrossRef]
- Overbeek, J.T.G.; Voorn, M.J. Phase separation in polyelectrolyte solutions. Theory of complex coacervation. J. Cell. Physiol. 1957, 49, 7–26. [Google Scholar] [CrossRef]
- Veis, A.; Aranyi, C. Phase separation in polyelectrolyte systems. I. Complex coacervates of gelatin. J. Phys. Chem. 1960, 64, 1203–1210. [Google Scholar] [CrossRef]
- Veis, A. A review of the early development of the thermodynamics of the complex coacervation phase separation. Adv. Colloid Interface Sci. 2011, 167, 2–11. [Google Scholar] [CrossRef]
- Burgess, D.J. Practical analysis of complex coacervate systems. J. Colloid Interface Sci. 1990, 140, 227–238. [Google Scholar] [CrossRef]
- Nakajima, A.; Sato, H. Phase relationships of an equivalent mixture of sulfated polyvinyl alcohol and aminoacetalyzed polyvinyl alcohol in microsalt aqueous solution. Biopolymers 1972, 11, 1345–1355. [Google Scholar] [CrossRef]
- Tainaka, K.I. Effect of counterions on complex coacervation. Biopolymers 1980, 19, 1289–1298. [Google Scholar] [CrossRef]
- Kudlay, A.; Olvera de la Cruz, M. Precipitation of oppositely charged polyelectrolytes in salt solutions. J. Chem. Phys. 2004, 120, 404–412. [Google Scholar] [CrossRef]
- Castelnovo, M.; Joanny, J.F. Complexation between oppositely charged polyelectrolytes: Beyond the Random Phase Approximation. Eur. Phys. J. E 2001, 6, 377–386. [Google Scholar] [CrossRef]
- Kudlay, A.; Ermoshkin, A.V.; Olvera de La Cruz, M. Complexation of oppositely charged polyelectrolytes: Effect of ion pair formation. Macromolecules 2004, 37, 9231–9241. [Google Scholar] [CrossRef]
- Biesheuvel, P.M.; Cohen Stuart, M.A. Cylindrical cell model for the electrostatic free energy of polyelectrolyte complexes. Langmuir 2004, 20, 4764–4770. [Google Scholar] [CrossRef]
- Biesheuvel, P.M.; Cohen Stuart, M.A. Electrostatic free energy of weakly charged macromolecules in solution and intermacromolecular complexes consisting of oppositely charged polymers. Langmuir 2004, 20, 2785–2791. [Google Scholar] [CrossRef]
- Da Silva, F.L.B.; Lund, M.; Jönsson, B.; Åkesson, T. On the complexation of proteins and polyelectrolytes. J. Phys. Chem. B 2006, 110, 4459–4464. [Google Scholar] [CrossRef]
- Oskolkov, N.N.; Potemkin, I.I. Complexation in asymmetric solutions of oppositely charged polyelectrolytes: Phase diagram. Macromolecules 2007, 40, 8423–8429. [Google Scholar] [CrossRef]
- Lee, J.; Popov, Y.O.; Fredrickson, G.H. Complex coacervation: A field theoretic simulation study of polyelectrolyte complexation. J. Chem. Phys. 2008, 128. [Google Scholar] [CrossRef]
- Ou, Z.; Muthukumar, M. Entropy and enthalpy of polyelectrolyte complexation: Langevin dynamics simulations. J. Chem. Phys. 2006, 124. [Google Scholar] [CrossRef]
- Jeon, J.; Dobrynin, A.V. Molecular Dynamics Simulations of Polyampholyte−Polyelectrolyte Complexes in Solutions. Macromolecules 2005, 38, 5300–5312. [Google Scholar] [CrossRef]
- Hoda, N.; Larson, R.G. Explicit-and implicit-solvent molecular dynamics simulations of complex formation between polycations and polyanions. Macromolecules 2009, 42, 8851–8863. [Google Scholar] [CrossRef]
- Priftis, D.; Xia, X.; Margossian, K.O.; Perry, S.L.; Leon, L.; Qin, J.; de Pablo, J.J.; Tirrell, M. Ternary, Tunable Polyelectrolyte Complex Fluids Driven by Complex Coacervation. Macromolecules 2014, 2014. [Google Scholar] [CrossRef]
- Spruijt, E. Strength, Structure and Stability of Polyelectrolyte Complex Coacervate. Ph.D. Thesis, Wageningen University, Wageningen, The Netherlands, 2012. [Google Scholar]
- Marcus, Y. Thermodynamics of solvation of ions. Part 5—Gibbs free energy of hydration at 298.15 K. J. Chem. Soc. Faraday Trans. 1991, 87, 2995–2999. [Google Scholar] [CrossRef]
- Larson, R.G. The Structure and Rheology of Complex Fluids; Oxford University Press: Oxford, UK, 1999. [Google Scholar]
- McQuarrie, D.A. Statistical Mechanics; University Science Books: Sausalito, CA, USA, 2000. [Google Scholar]
- Hill, T.L. An Introduction to Statistical Thermodynamics; Courier Dover Publications: Mineola, NY, USA,, 1960. [Google Scholar]
- Spruijt, E.; Cohen Stuart, M.A.; van der Gucht, J. Linear Viscoelasticity of Polyelectrolyte Complex Coacervates. Macromolecules 2013, 46, 1633–1641. [Google Scholar] [CrossRef]
- Zoete, V.; Cuendet, M.A.; Grosdidier, A.; Michielin, O. SwissParam: A Fast Force Field Generation Tool for Small Organic Molecules. J. Comput. Chem. 2011, 32, 2359–2368. [Google Scholar] [CrossRef]
- Schmaljohann, D. Thermo- and pH-responsive polymers in drug delivery. Adv. Drug Deliv. Rev. 2006, 58, 1655–1670. [Google Scholar] [CrossRef]
- Litmanovich, E.A.; Chernikova, E.V.; Stoychev, G.V.; Zakharchenko, S.O. Unusual Phase Behavior of the Mixture of Poly(acrylic acid) and Poly(diallyldimethylammonium chloride) in Acidic Media. Macromolecules 2010, 43, 6871–6876. [Google Scholar] [CrossRef]
- Xu, L.; Ankner, J.F.; Sukhishvili, S.A. Steric Effects in Ionic Pairing and Polyelectrolyte Interdiffusion within Multilayered Films: A Neutron Reflectometry Study. Macromolecules 2011, 44, 6518–6524. [Google Scholar] [CrossRef]
- Izumrudov, V.; Sukhishvili, S.A. Ionization-controlled stability of polyelectrolyte multilayers in salt solutions. Langmuir 2003, 19, 5188–5191. [Google Scholar] [CrossRef]
© 2014 by the authors; licensee MDPI, Basel, Switzerland. This article is an open access article distributed under the terms and conditions of the Creative Commons Attribution license (http://creativecommons.org/licenses/by/3.0/).
Share and Cite
Jha, P.K.; Desai, P.S.; Li, J.; Larson, R.G. pH and Salt Effects on the Associative Phase Separation of Oppositely Charged Polyelectrolytes. Polymers 2014, 6, 1414-1436. https://doi.org/10.3390/polym6051414
Jha PK, Desai PS, Li J, Larson RG. pH and Salt Effects on the Associative Phase Separation of Oppositely Charged Polyelectrolytes. Polymers. 2014; 6(5):1414-1436. https://doi.org/10.3390/polym6051414
Chicago/Turabian StyleJha, Prateek K., Priyanka S. Desai, Jingyi Li, and Ronald G. Larson. 2014. "pH and Salt Effects on the Associative Phase Separation of Oppositely Charged Polyelectrolytes" Polymers 6, no. 5: 1414-1436. https://doi.org/10.3390/polym6051414
APA StyleJha, P. K., Desai, P. S., Li, J., & Larson, R. G. (2014). pH and Salt Effects on the Associative Phase Separation of Oppositely Charged Polyelectrolytes. Polymers, 6(5), 1414-1436. https://doi.org/10.3390/polym6051414