
New Method Based on Direct Analysis in Real-Time Coupled with Time-of-Flight Mass Spectrometry (DART-ToF-MS) for Investigation of the Miscibility of Polymer Blends


Abstract
:1. Introduction
2. Experimental Section
2.1. Materials
2.2. Blends Preparation
2.3. Characterization
2.3.1. DSC
2.3.2. TGA
2.3.3. DART-ToF-MS
3. Results and Discussion
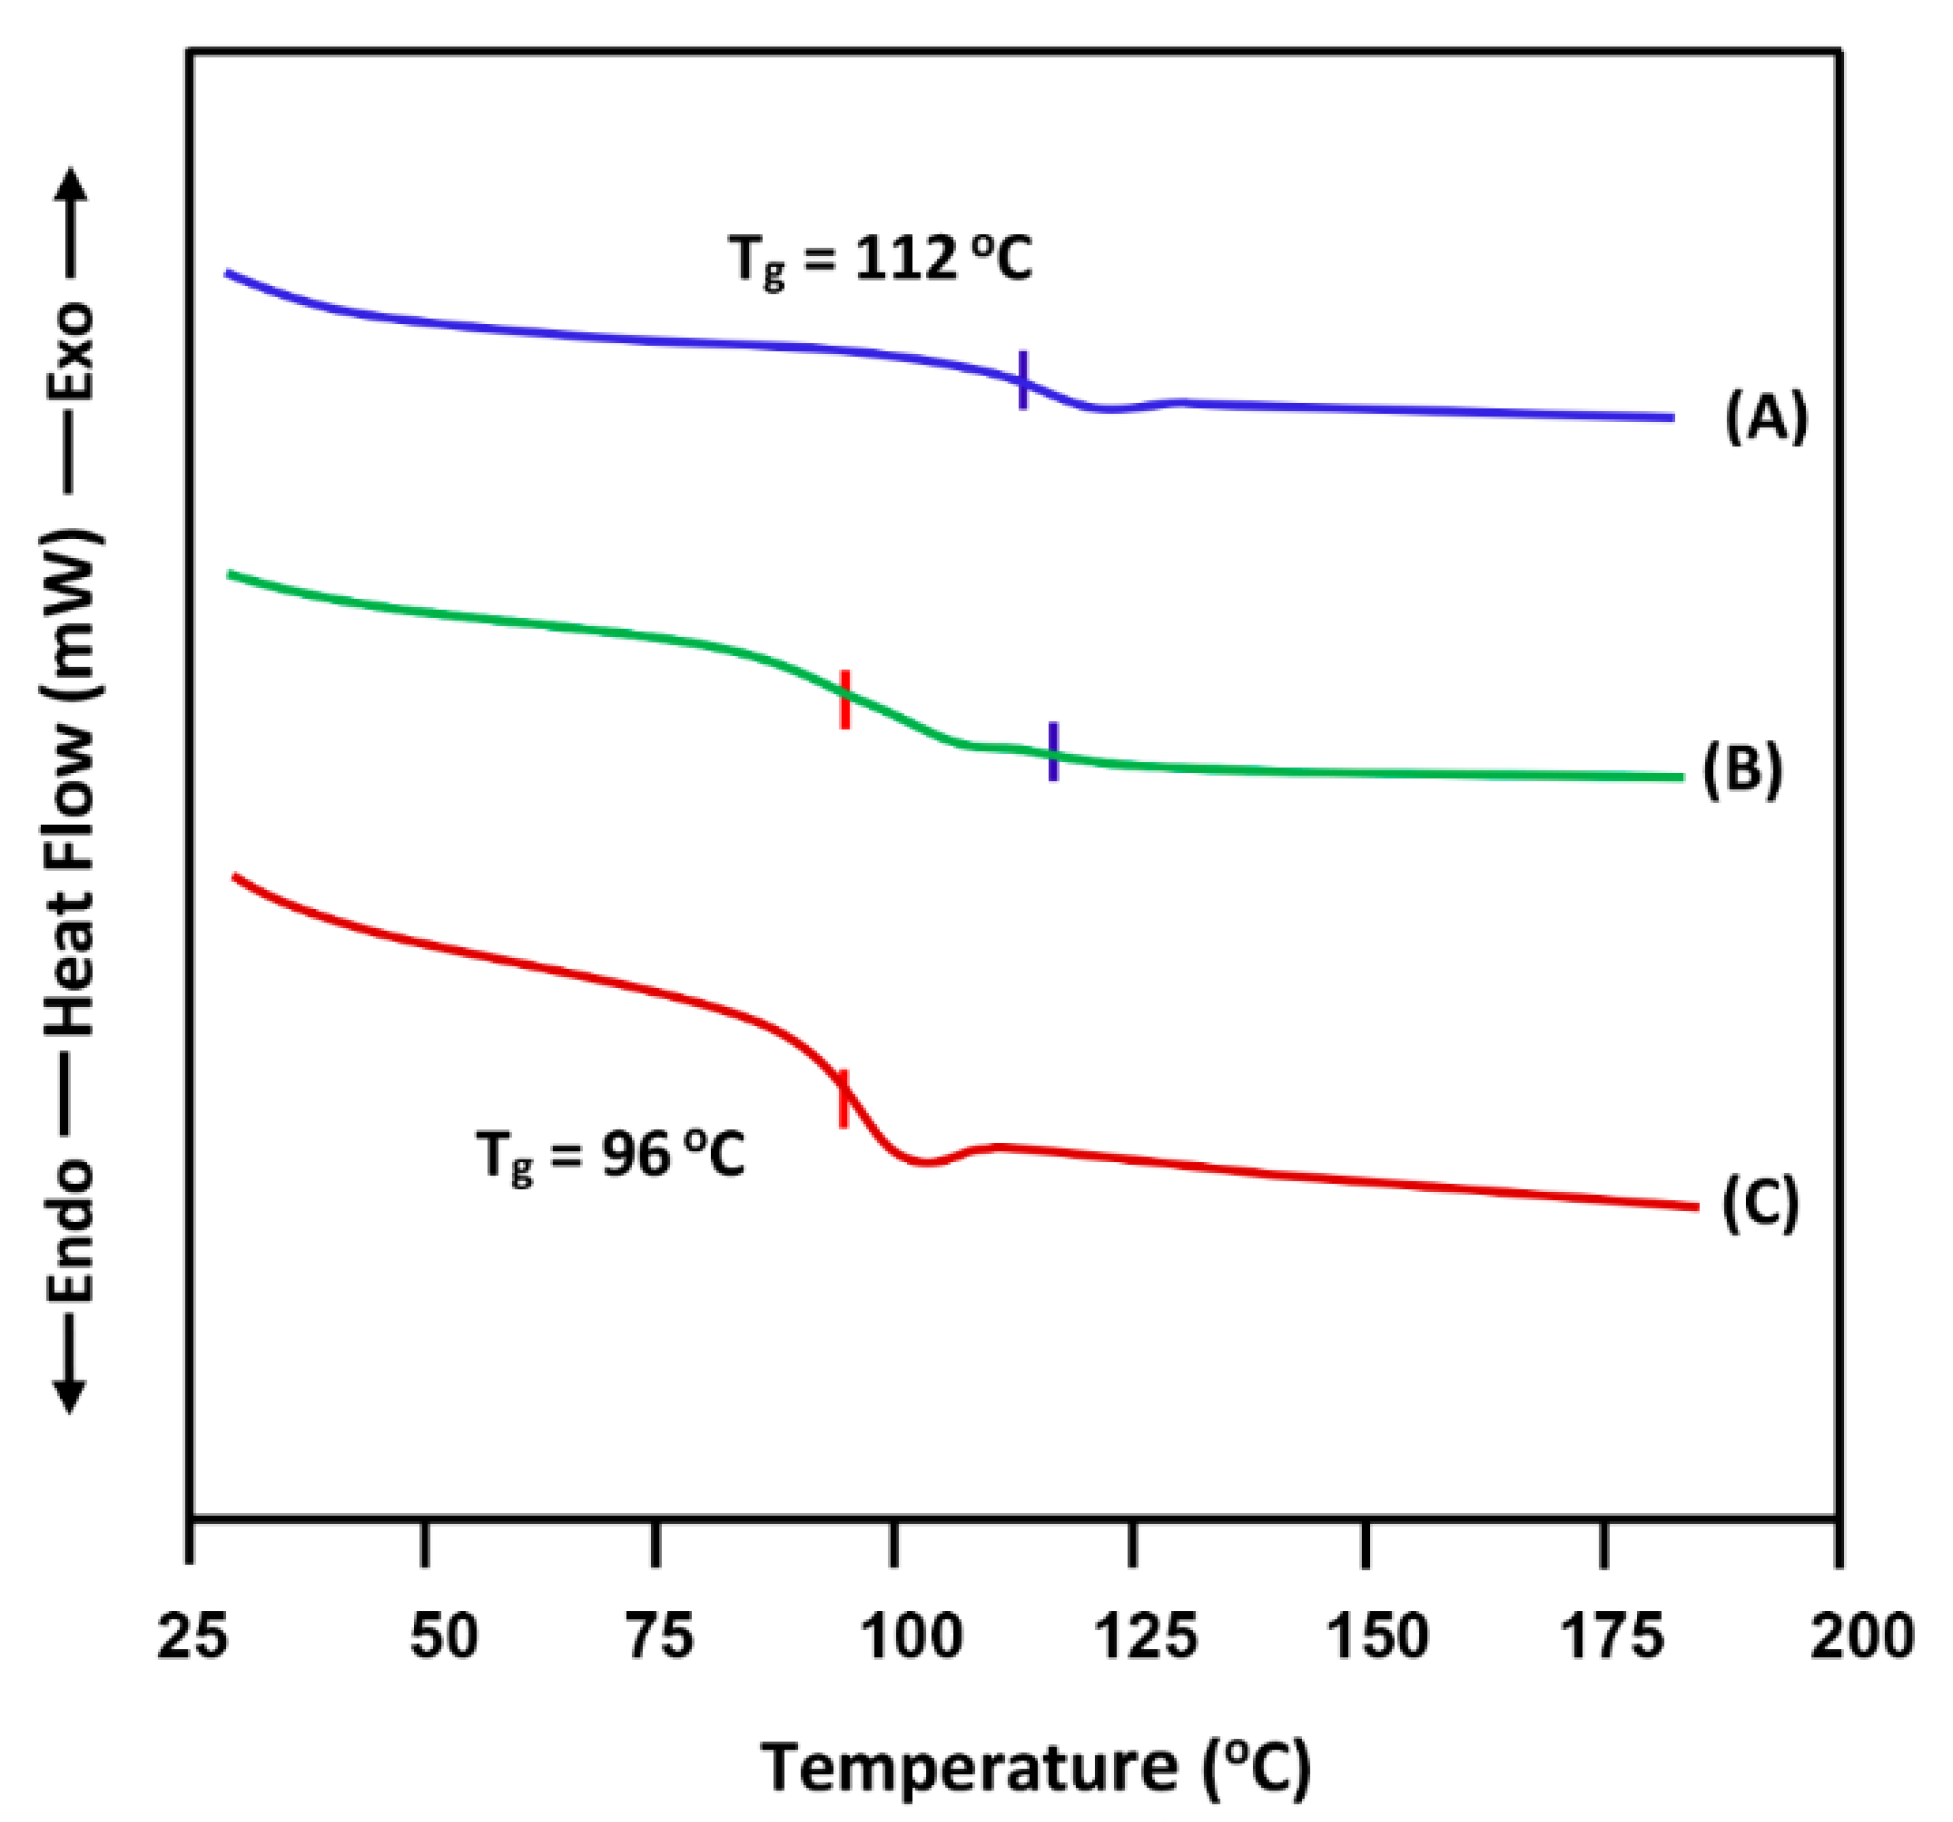
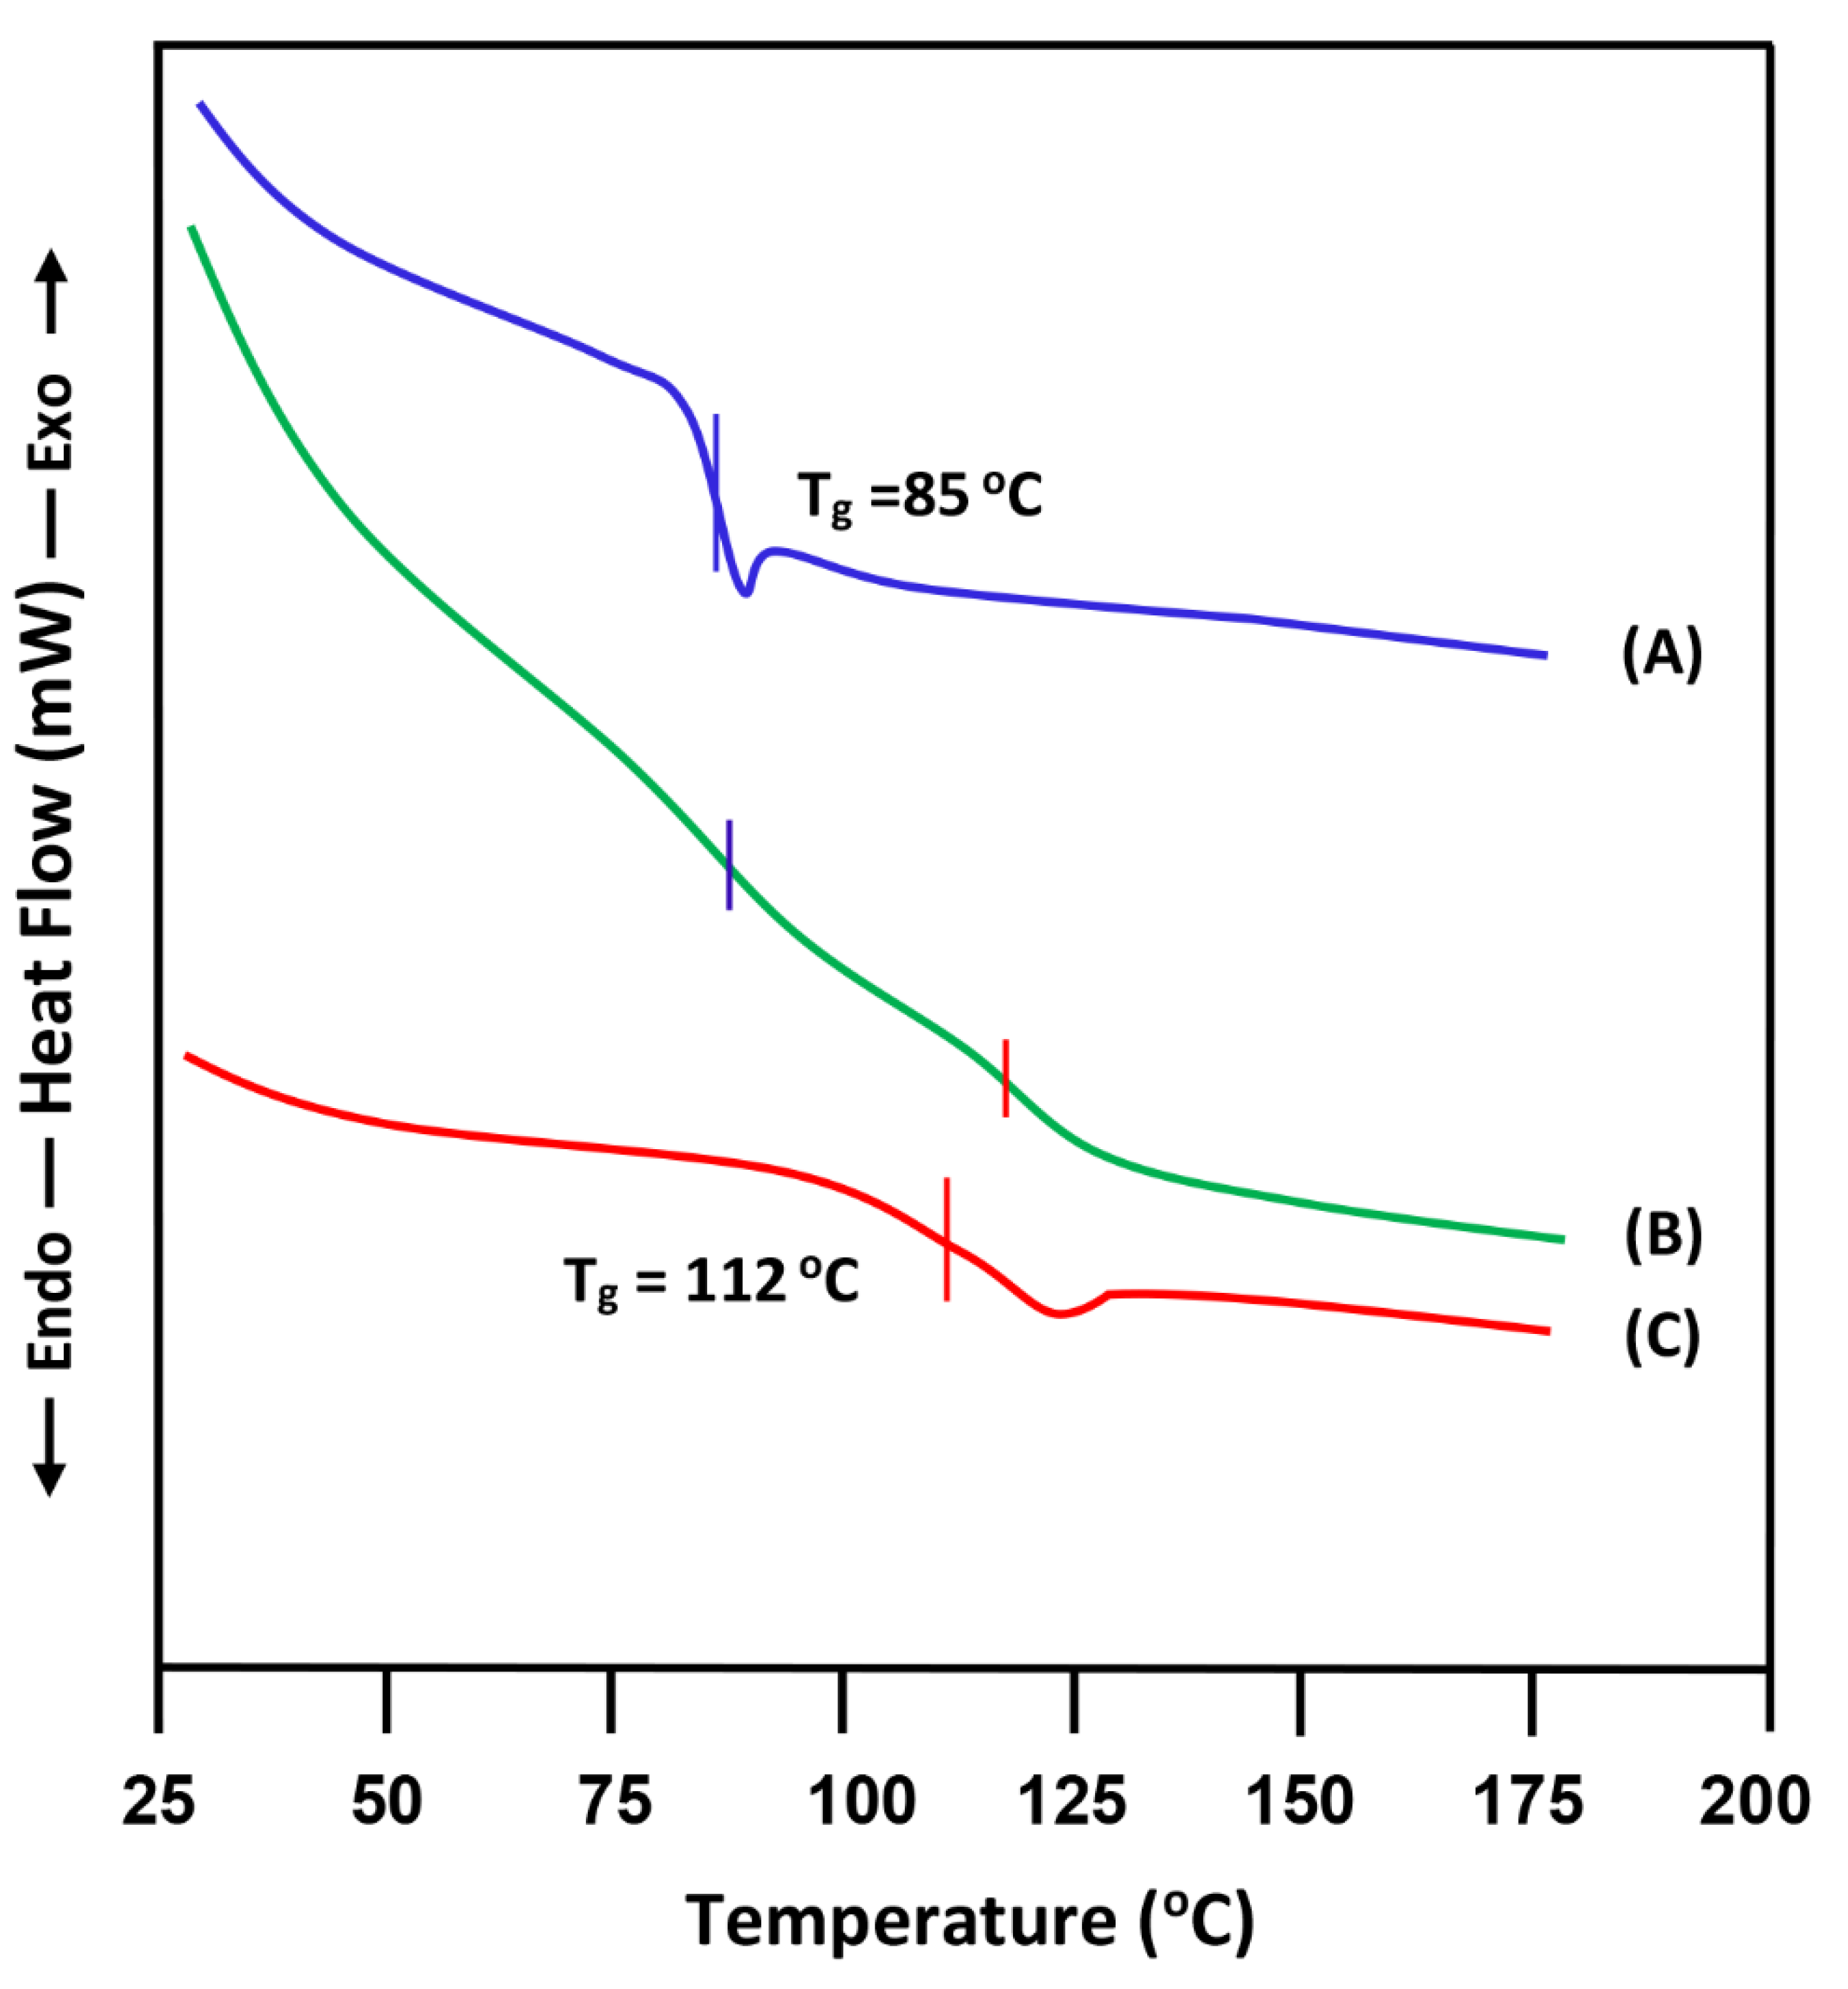
3.1. DSC Analysis
- (A)
- Miscibility of PS/PMMA-50
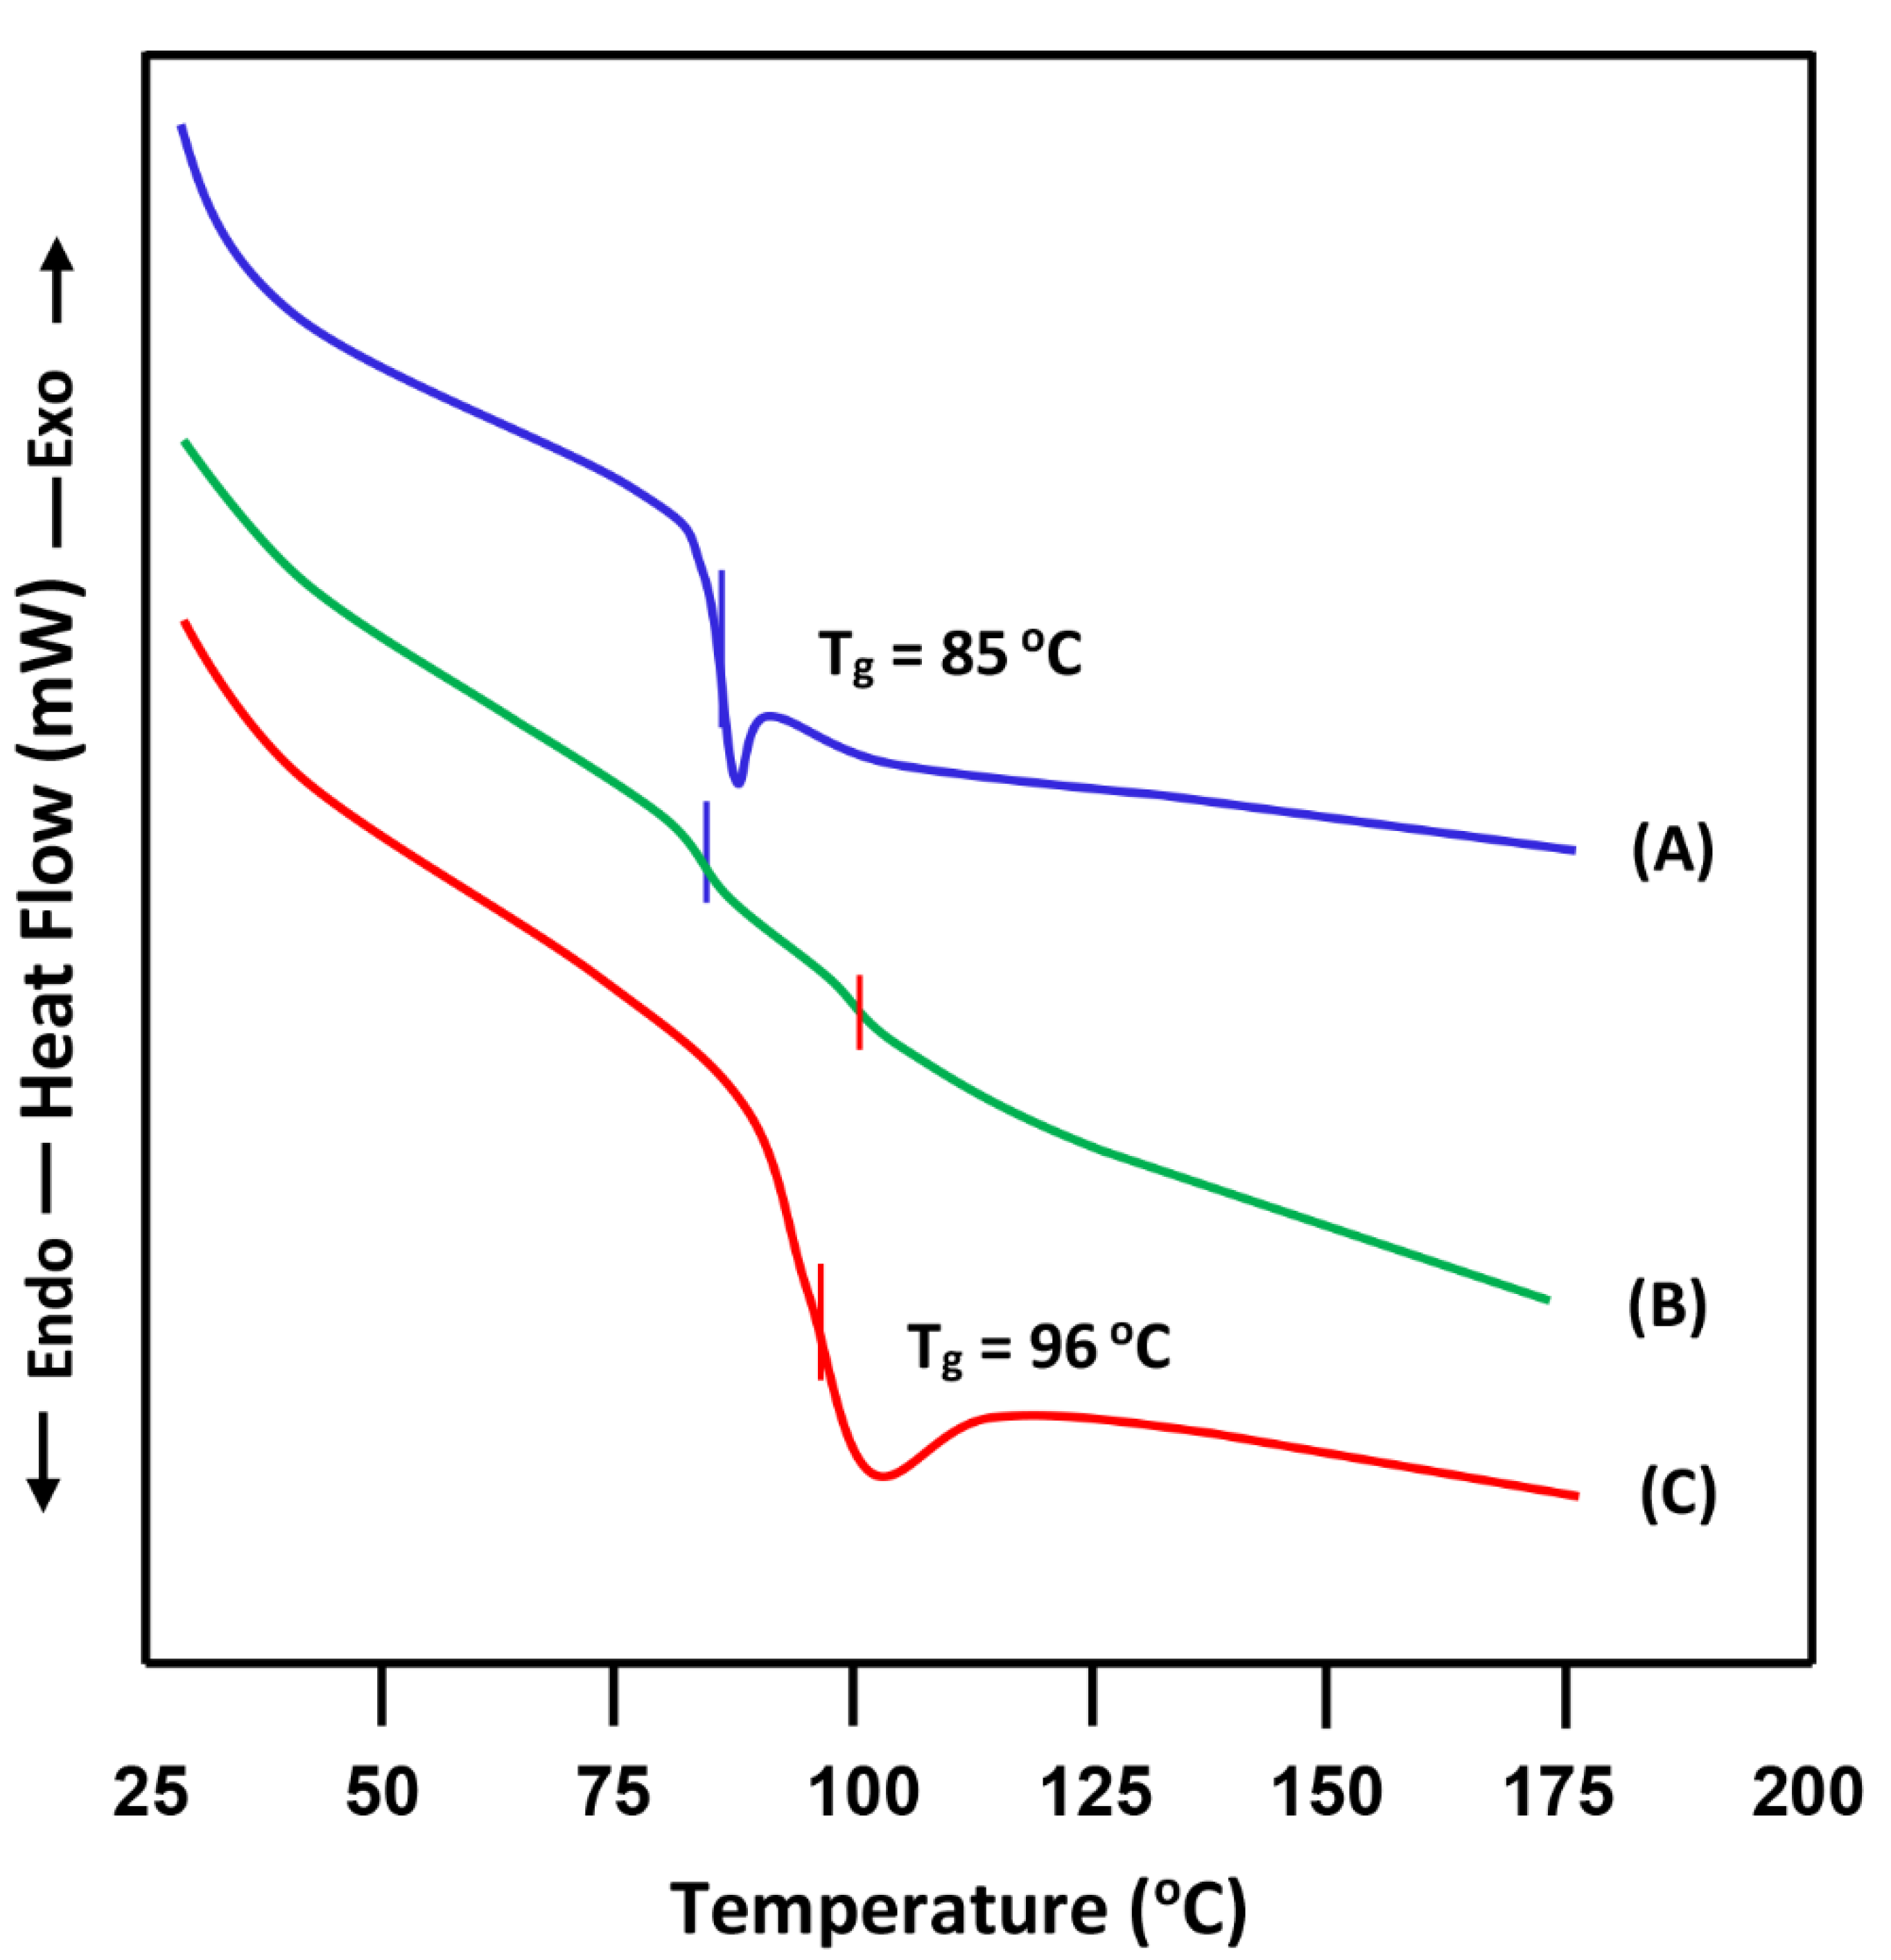
- (B)
- Miscibility of PS/PVC-50
- (C)
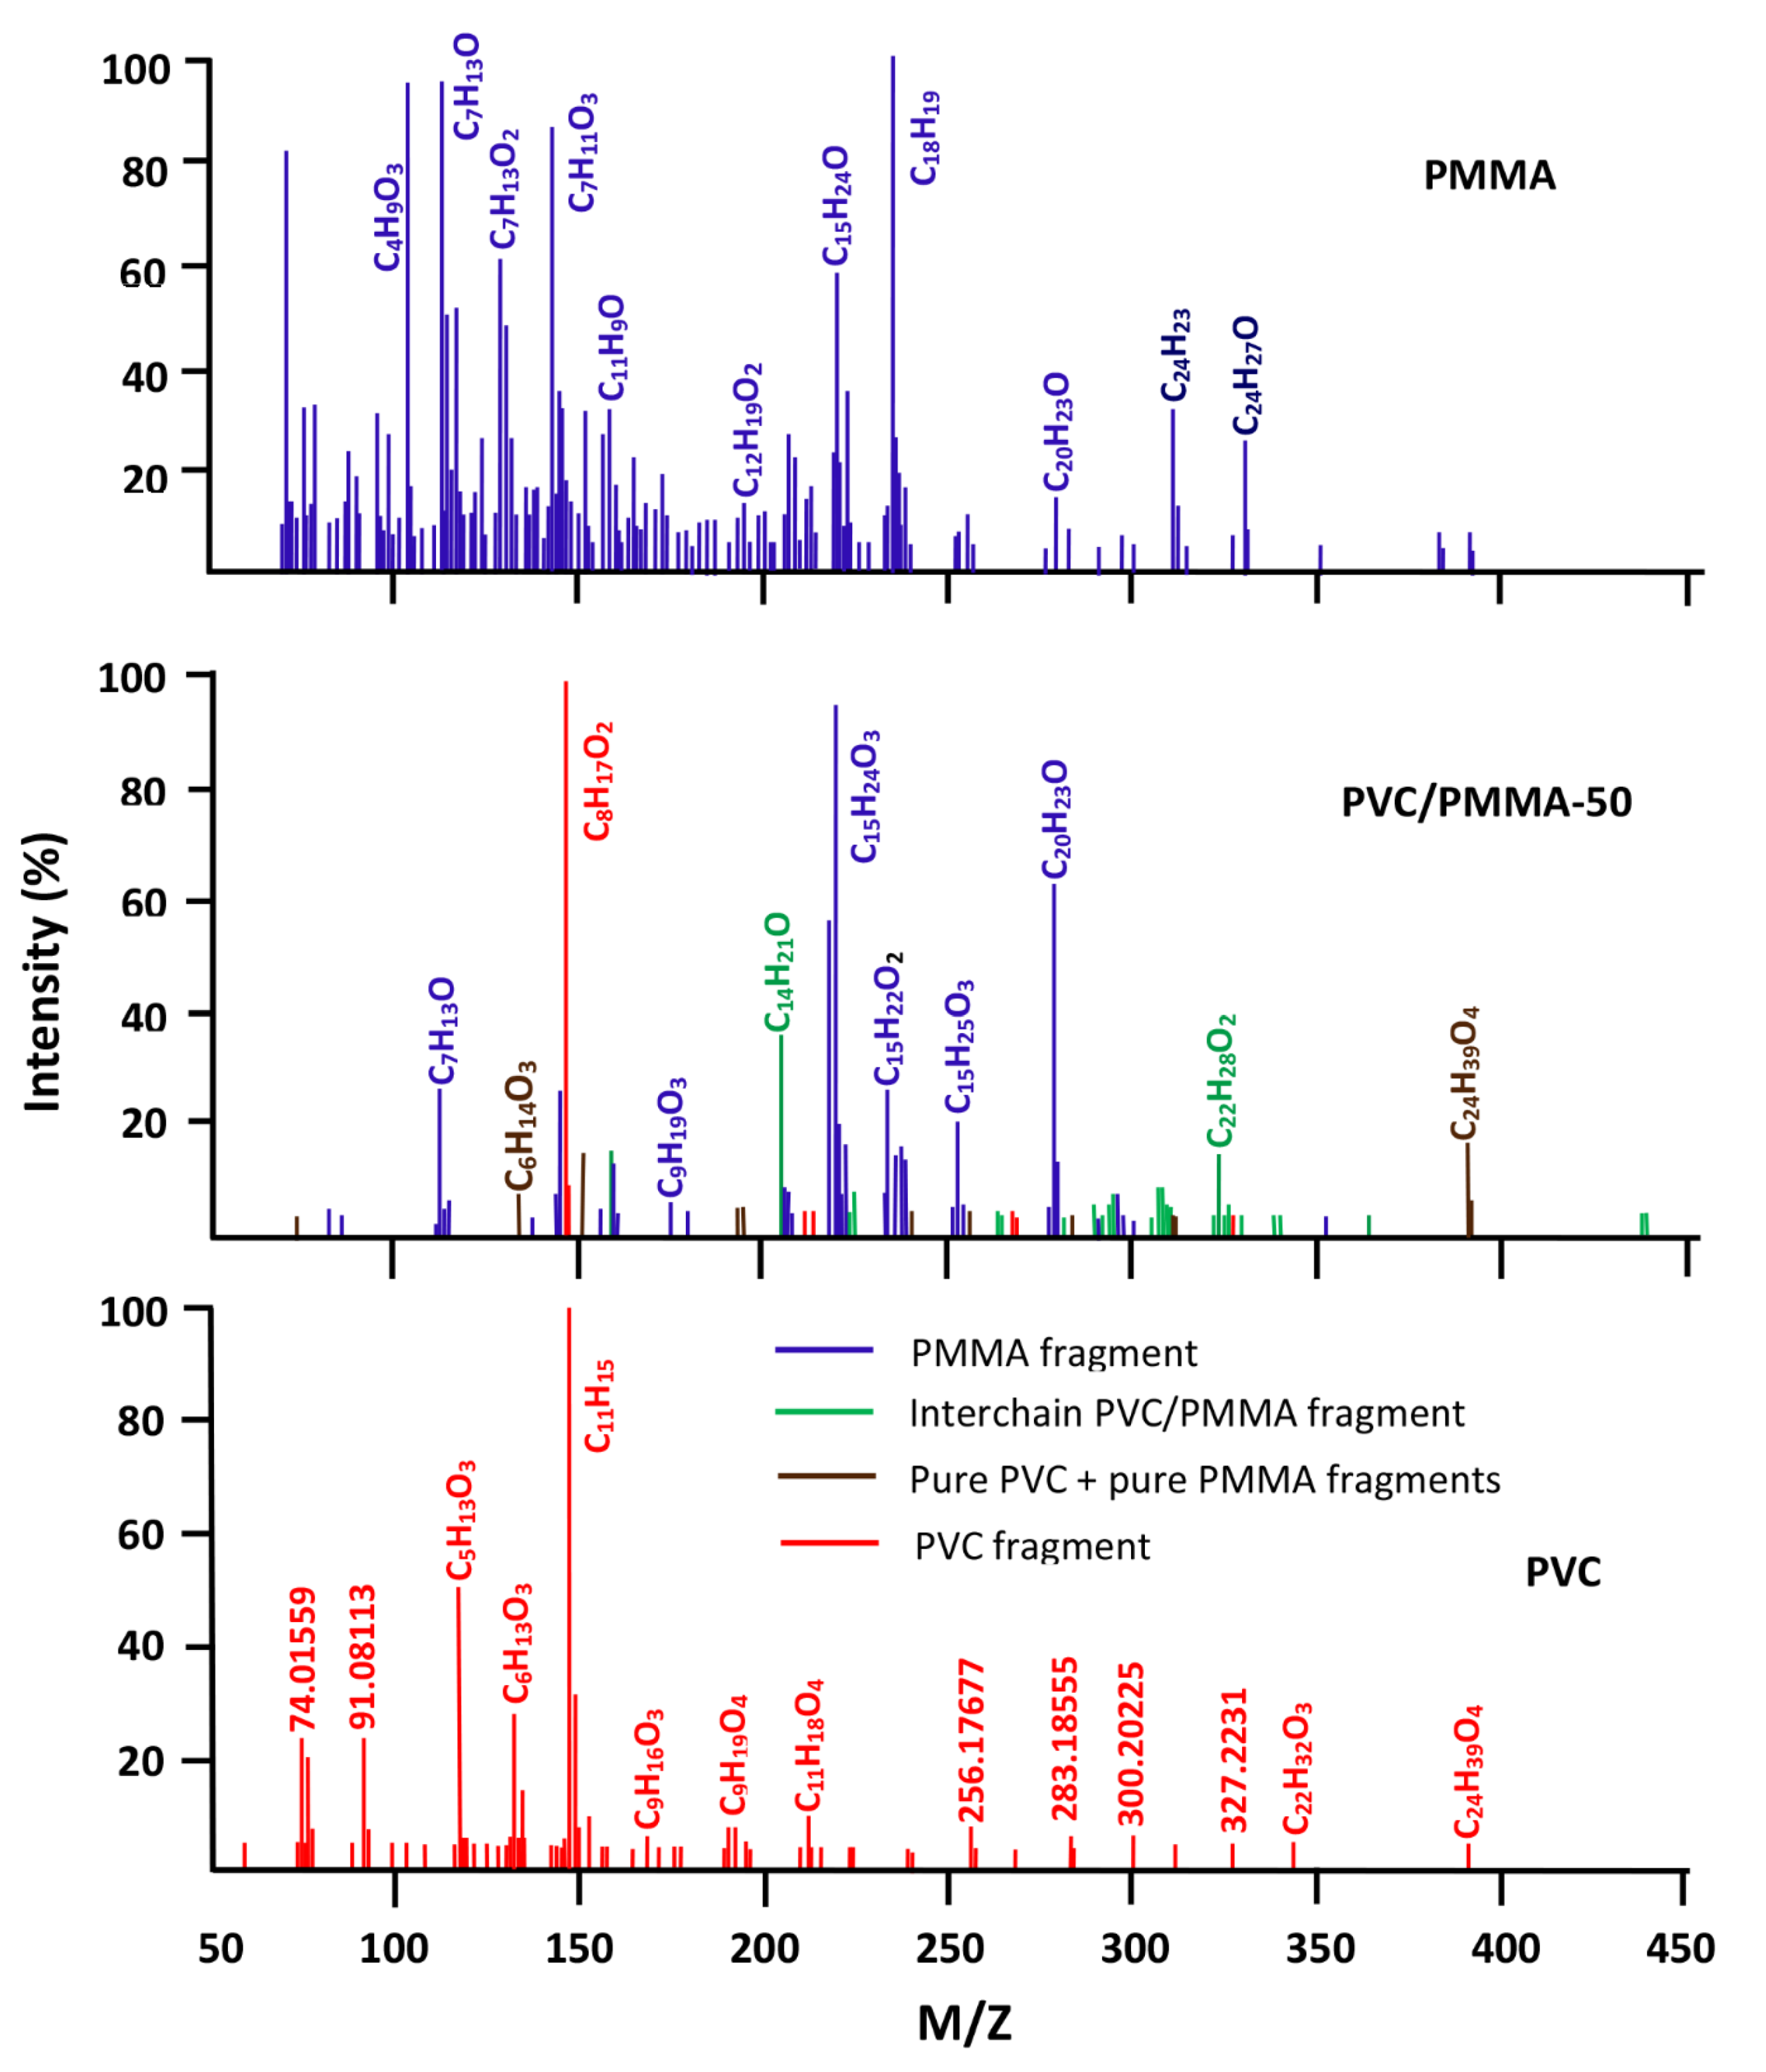
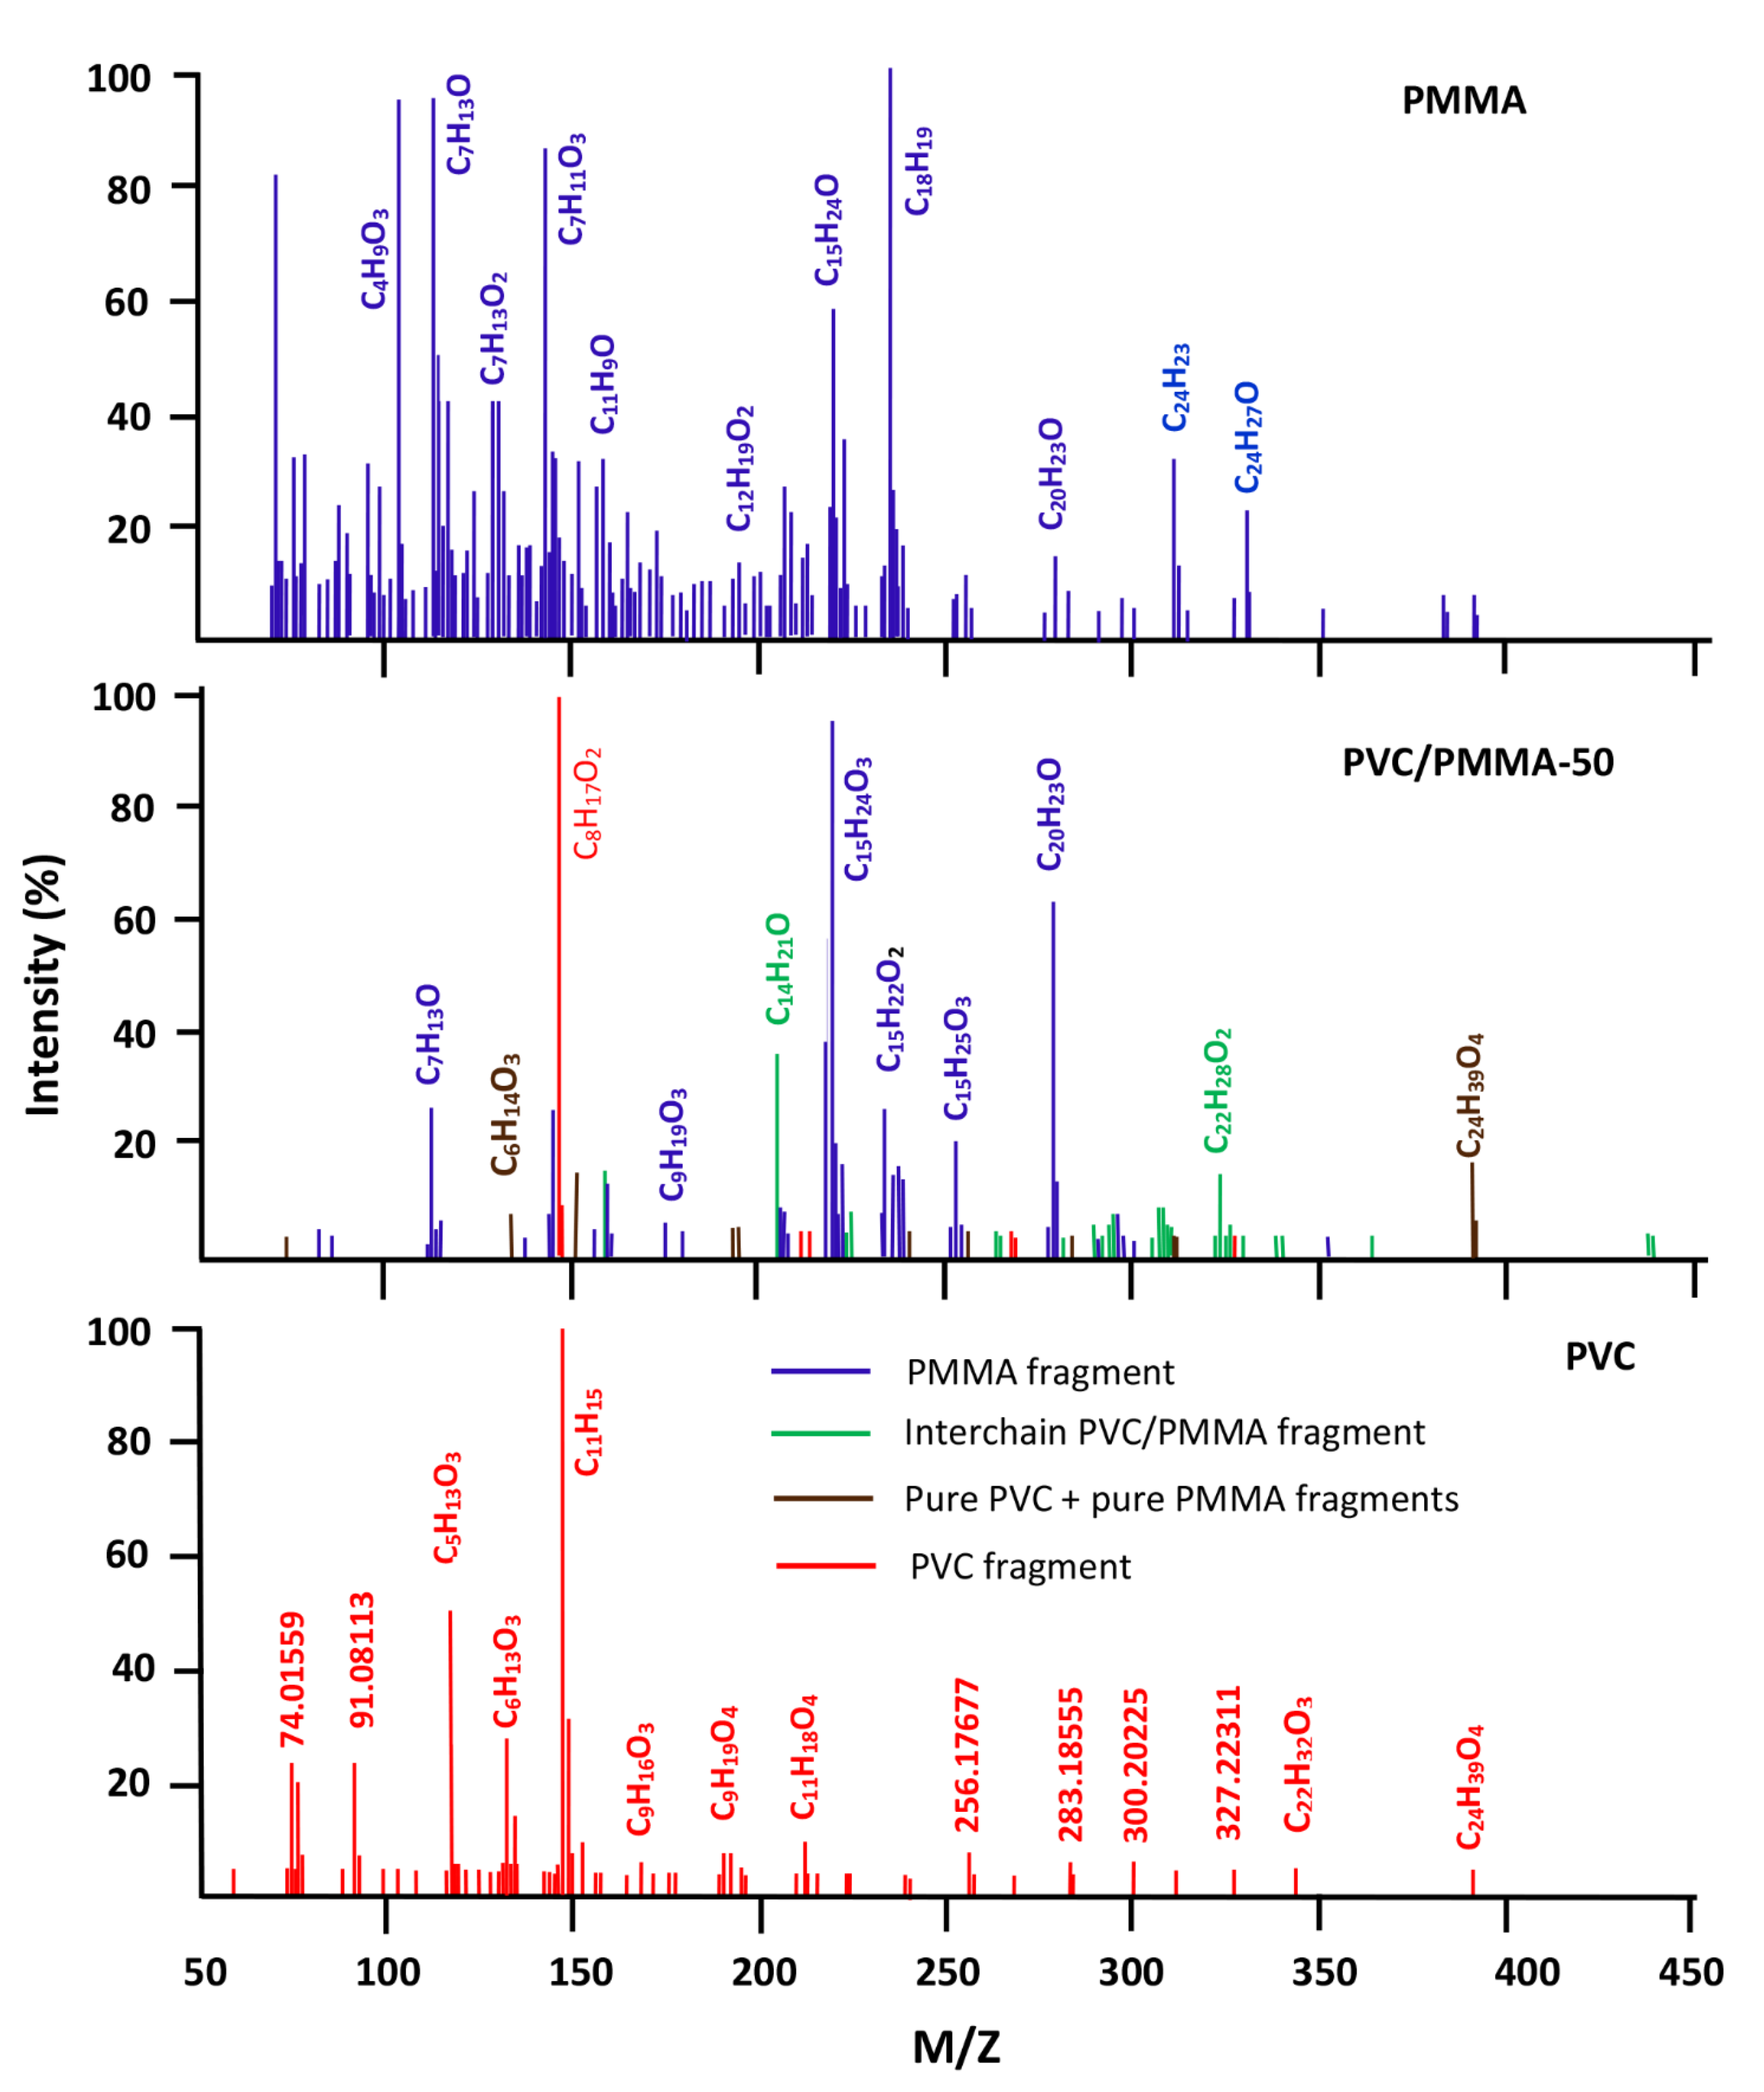
- Miscibility of PVC/PMMA-50
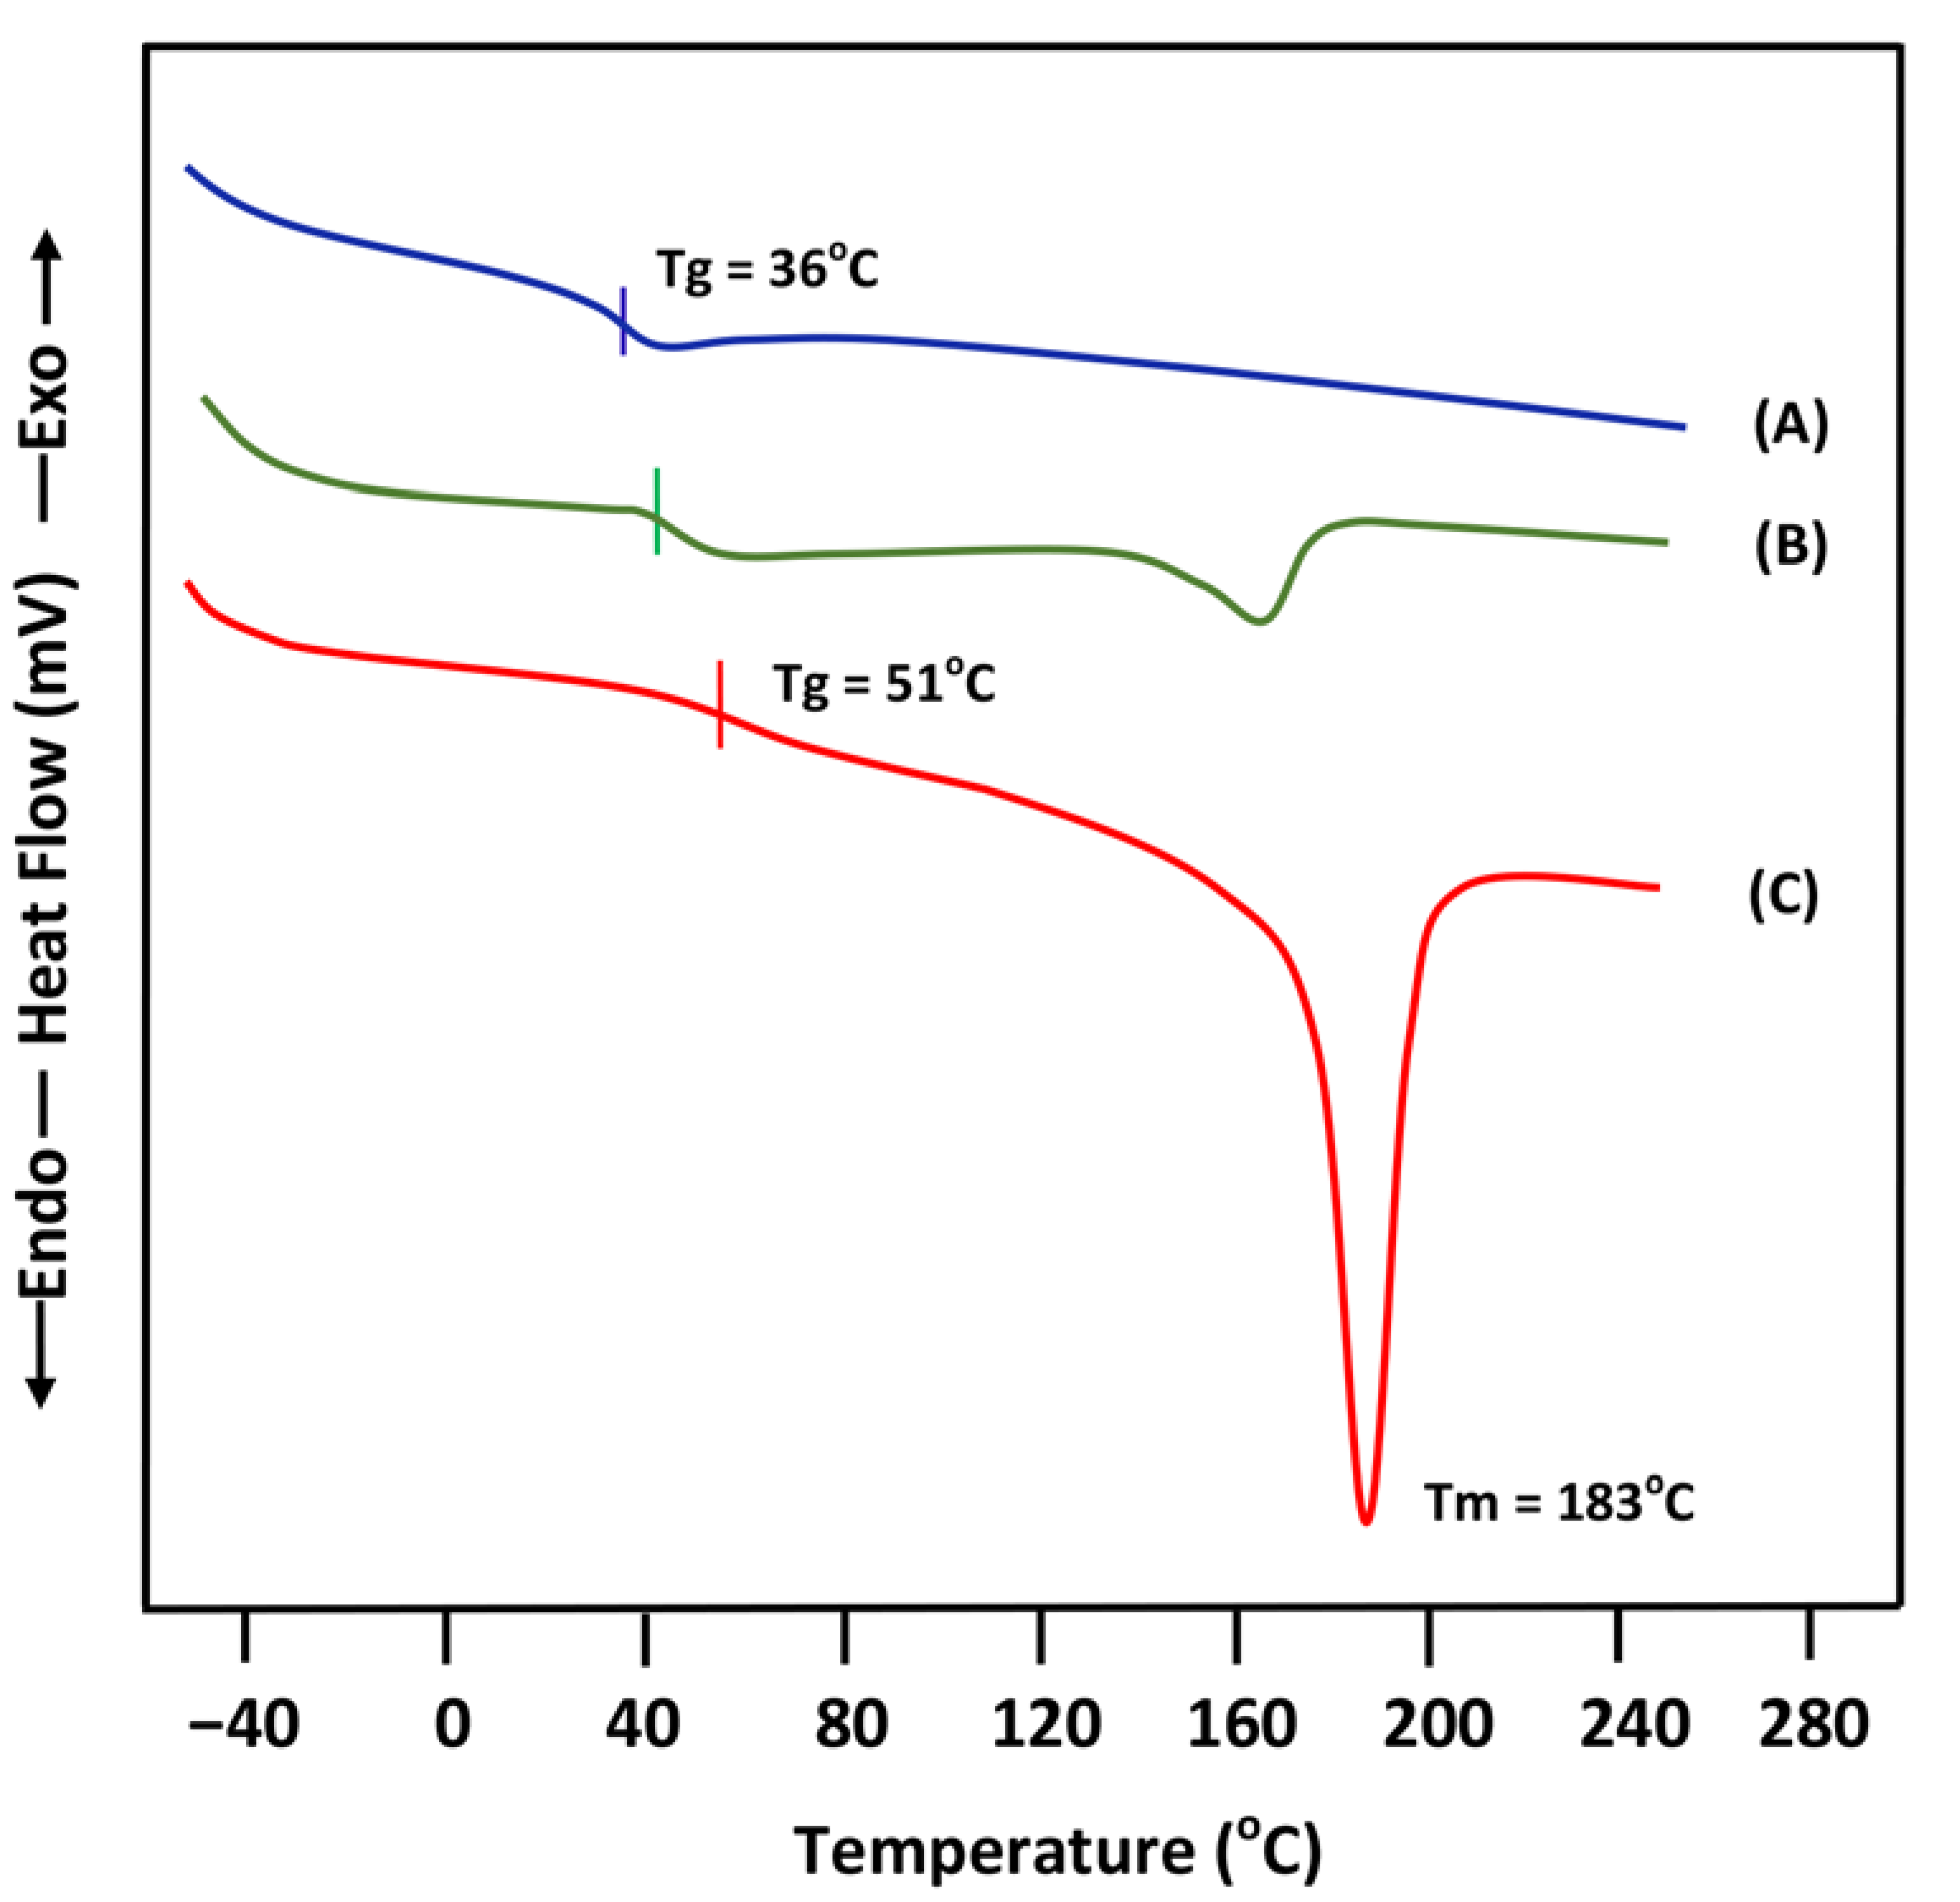
- (D)
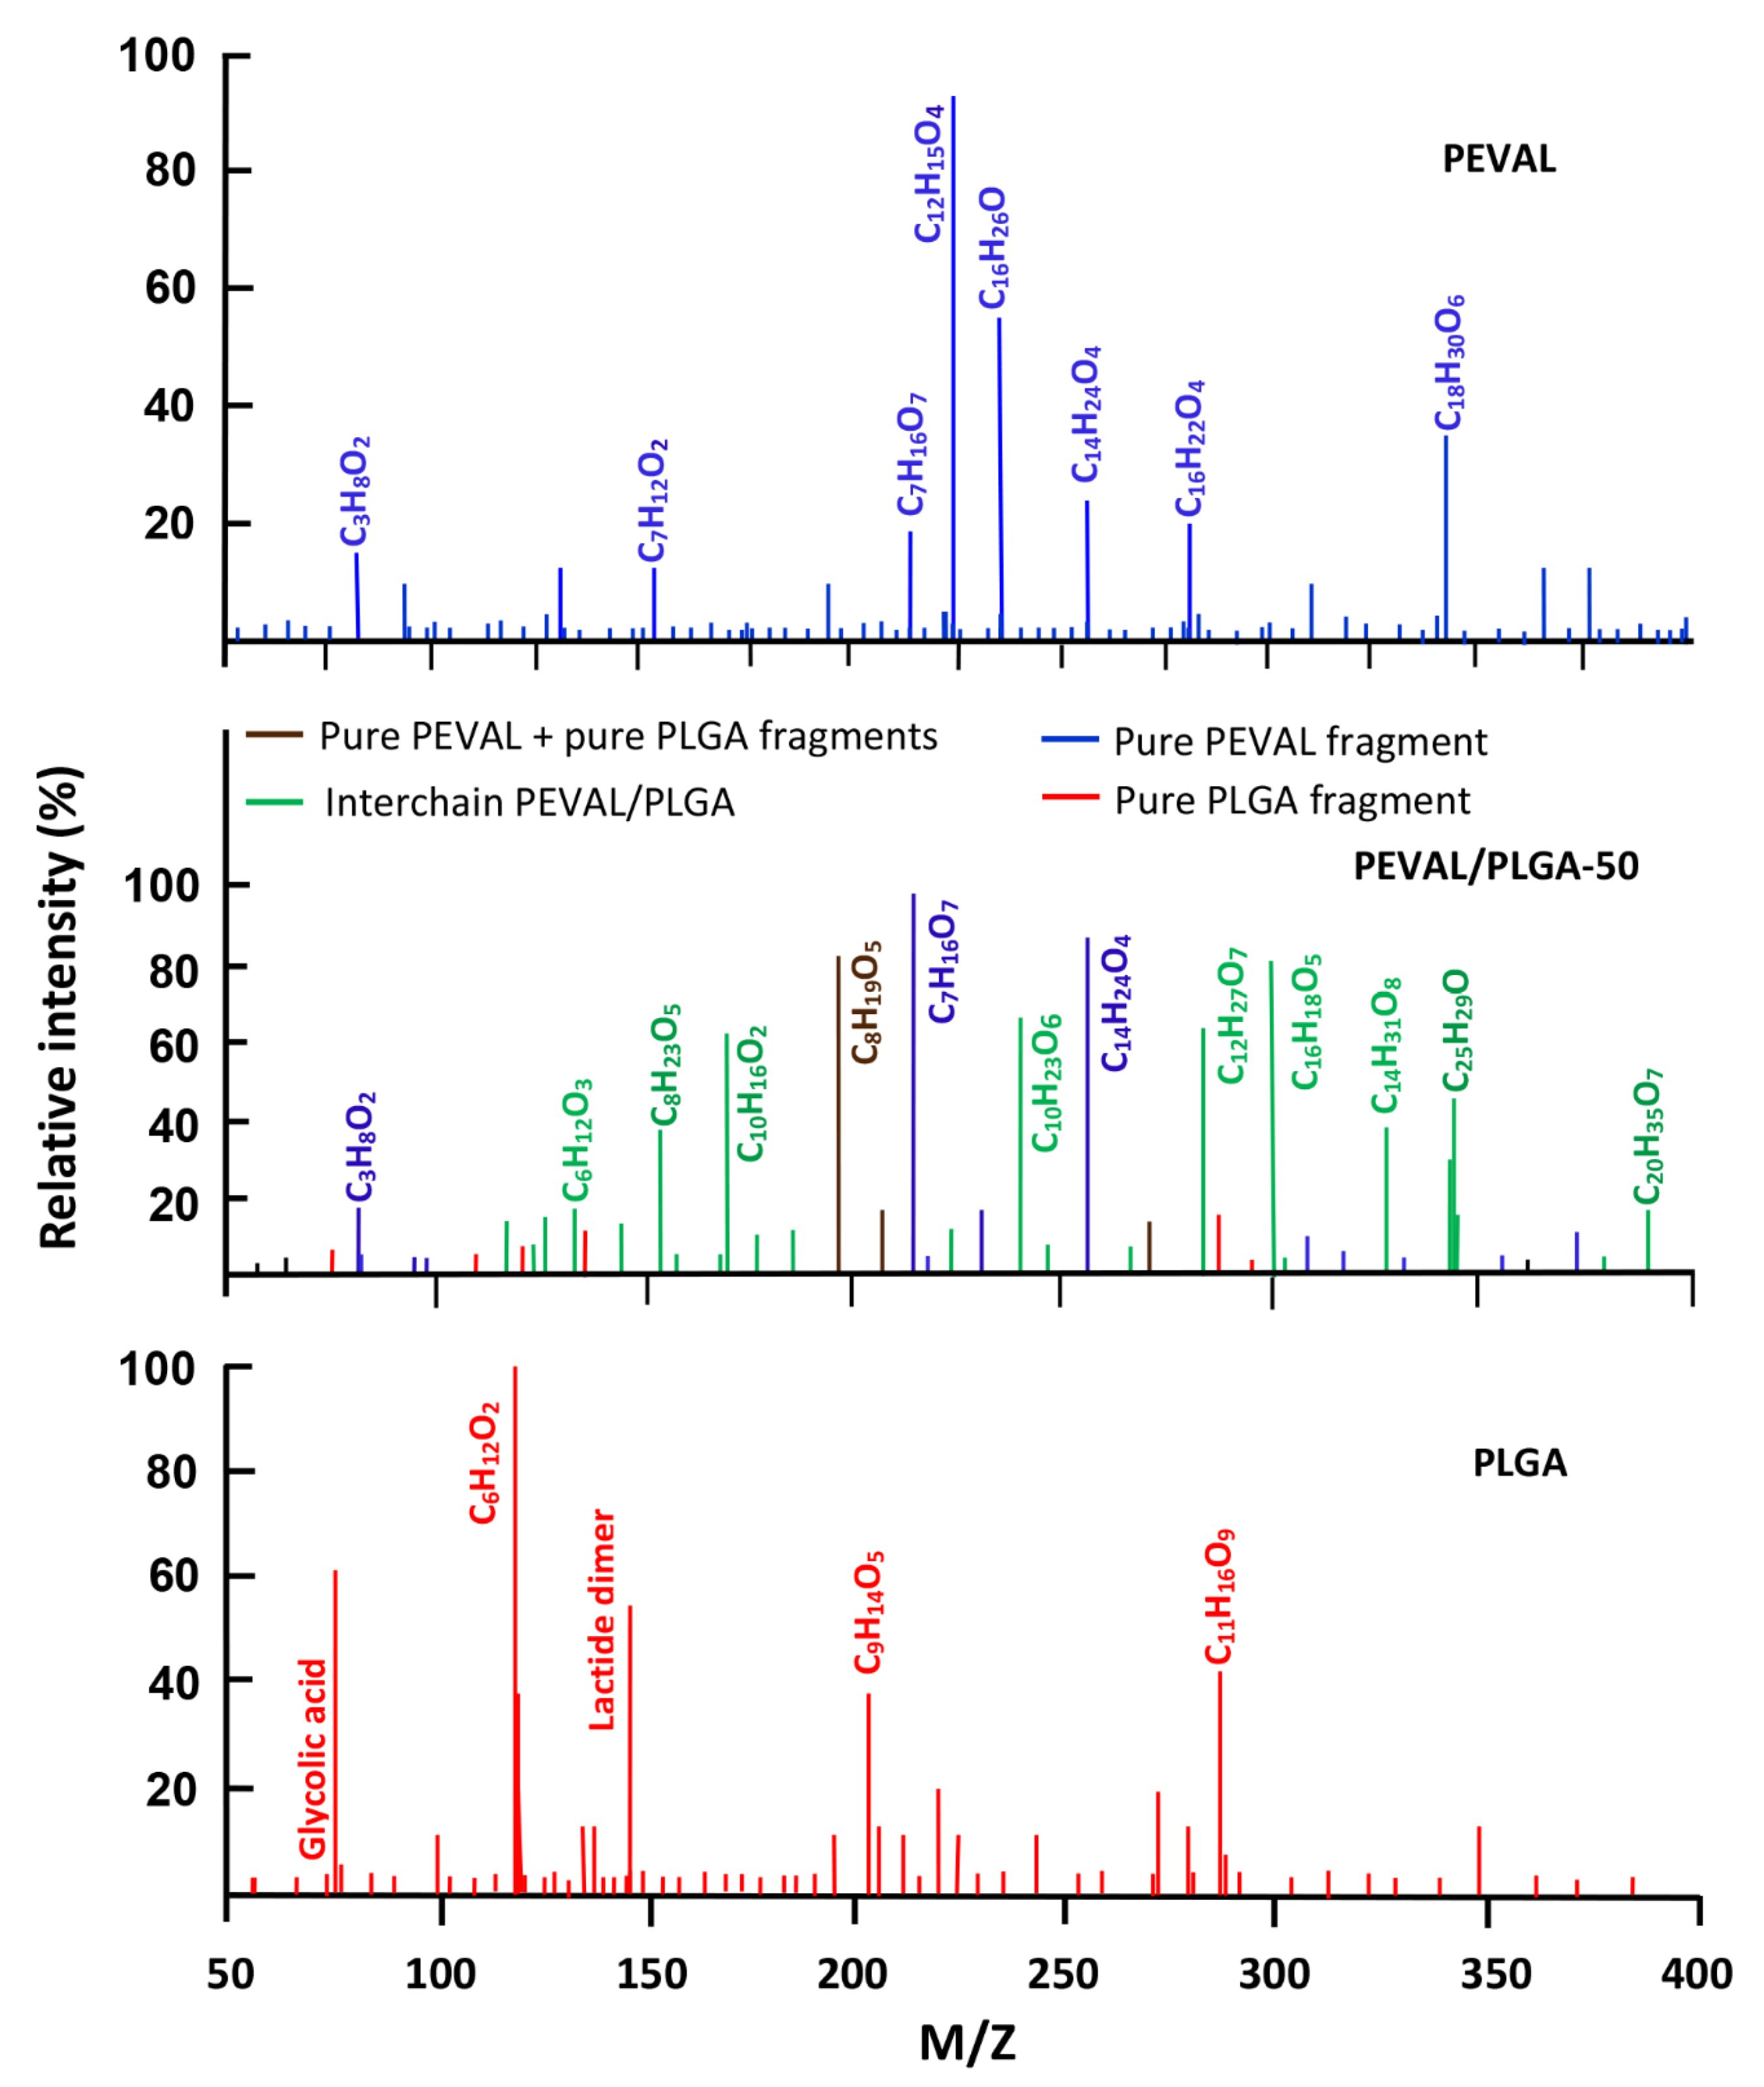
- Miscibility of PEVAL/PLGA-50
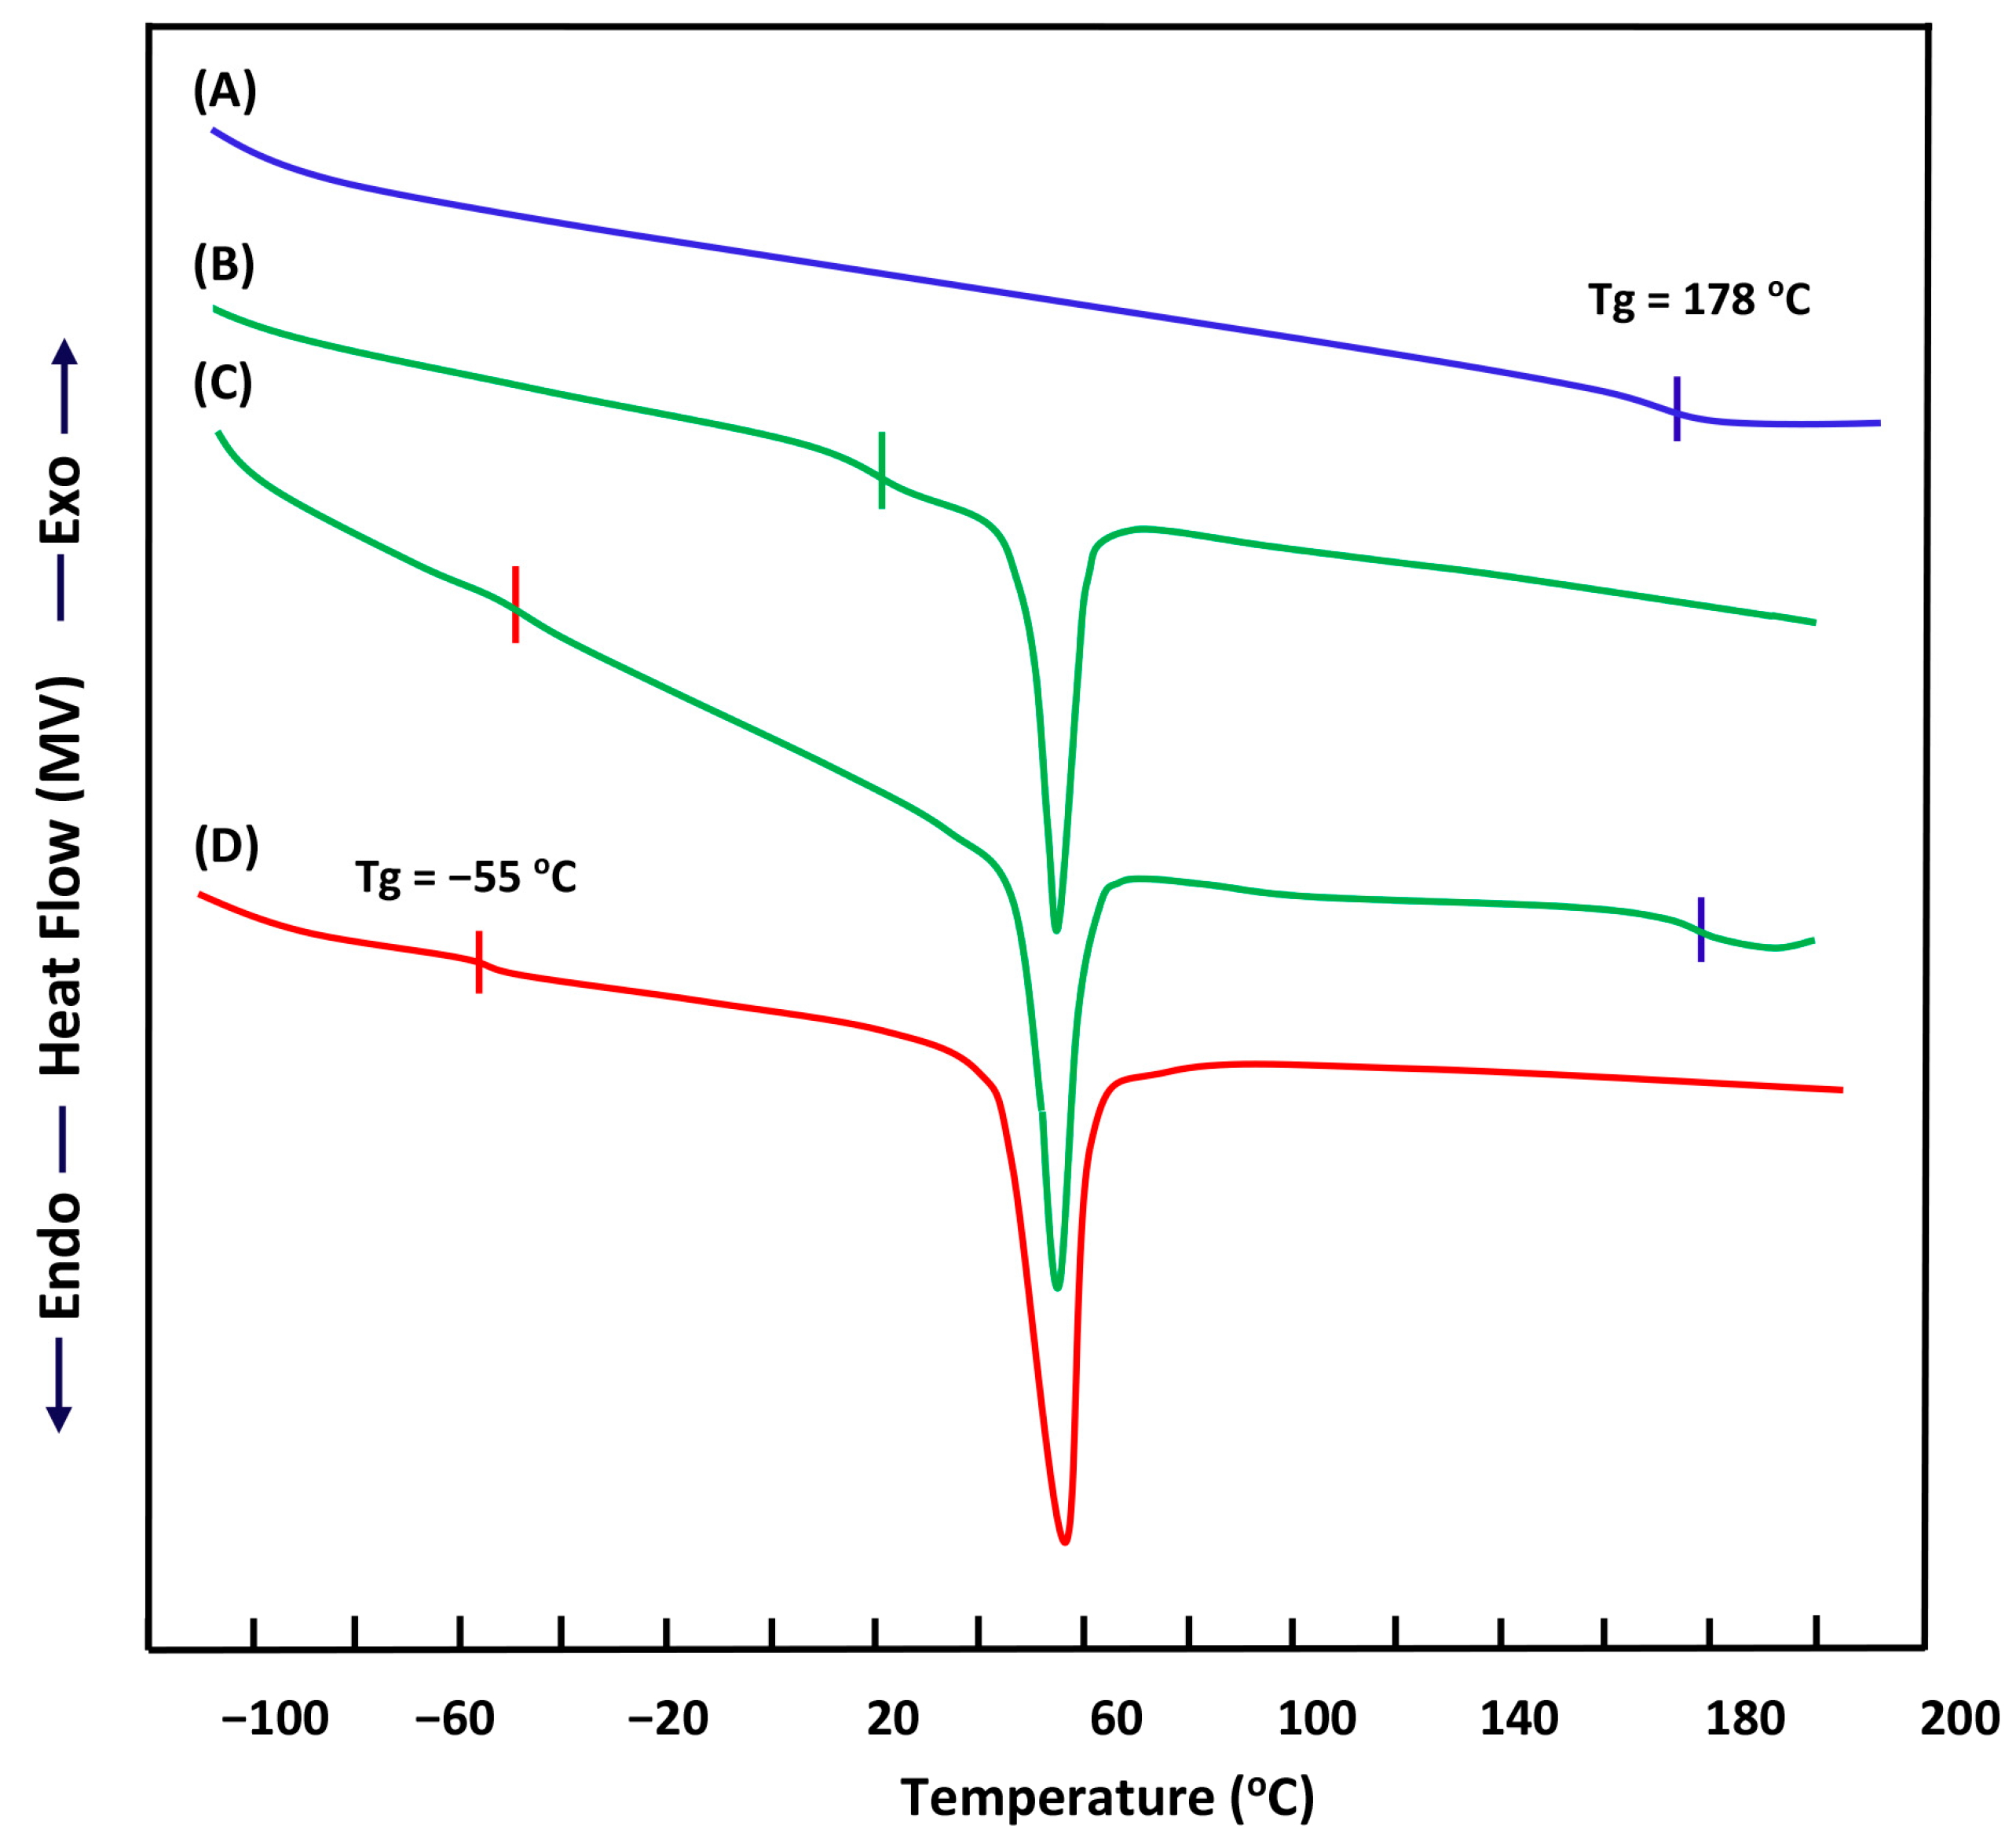
- (E)
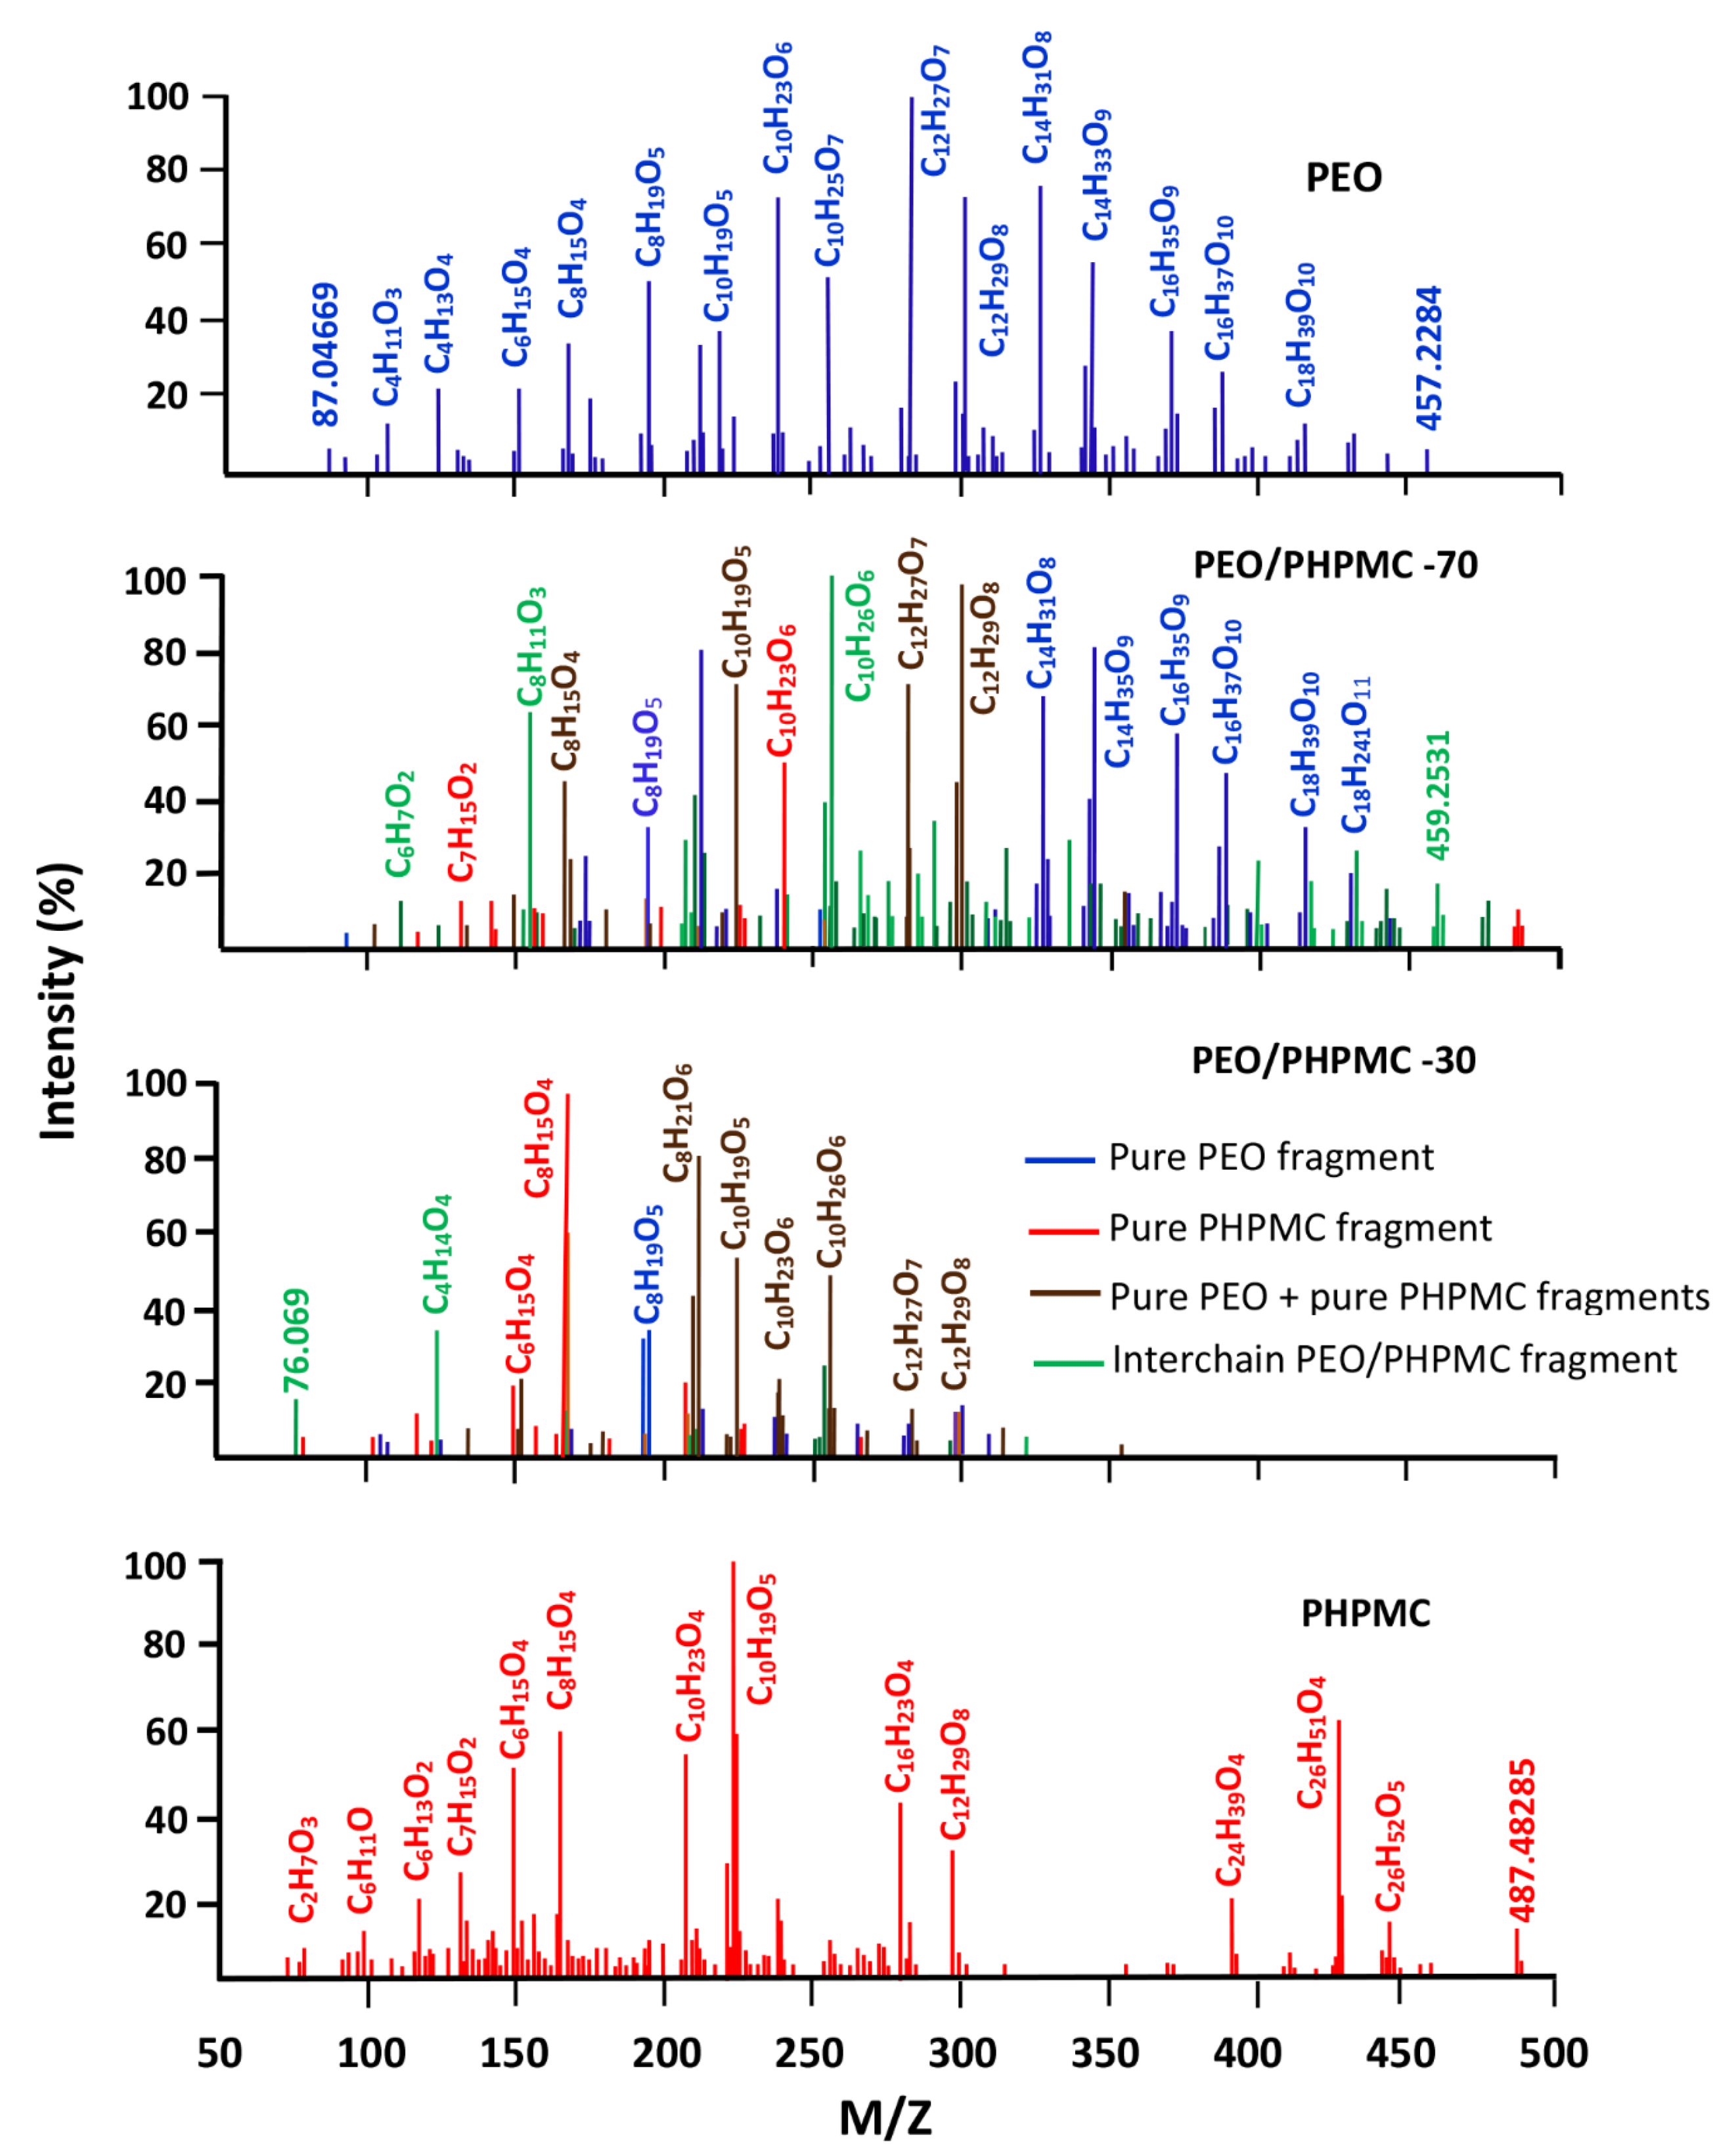
- Miscibility of PEO/PHPMC
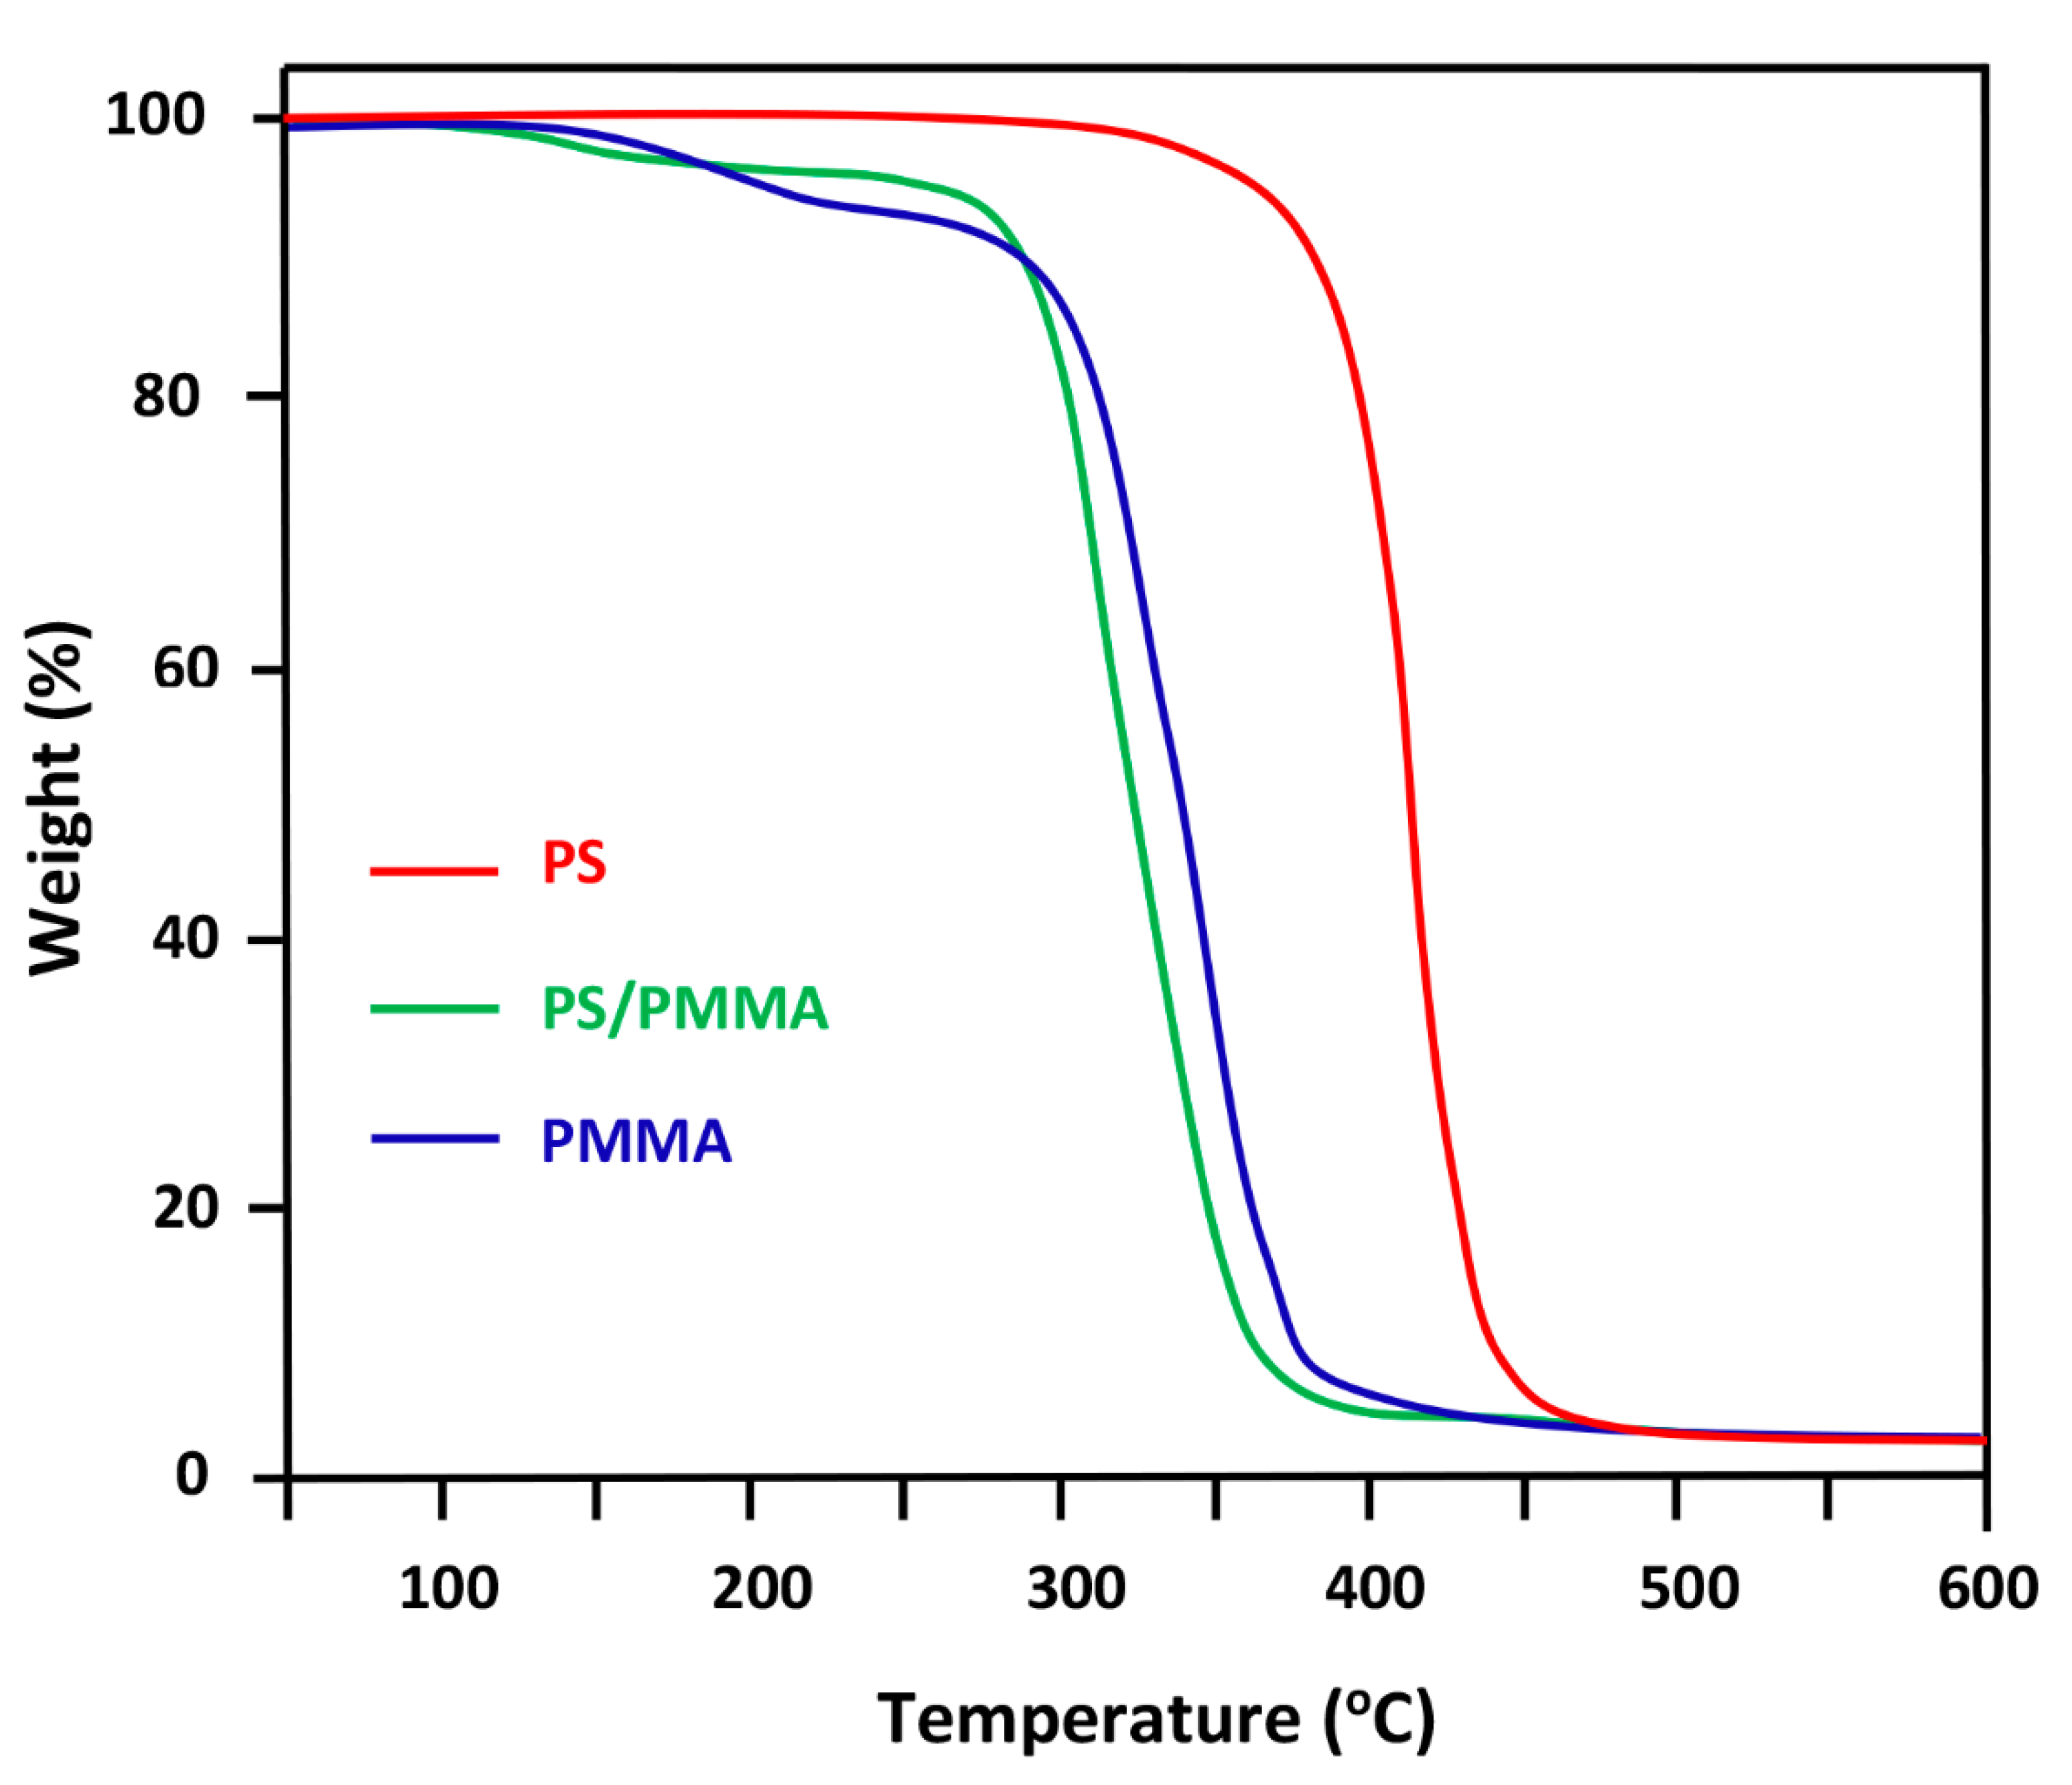
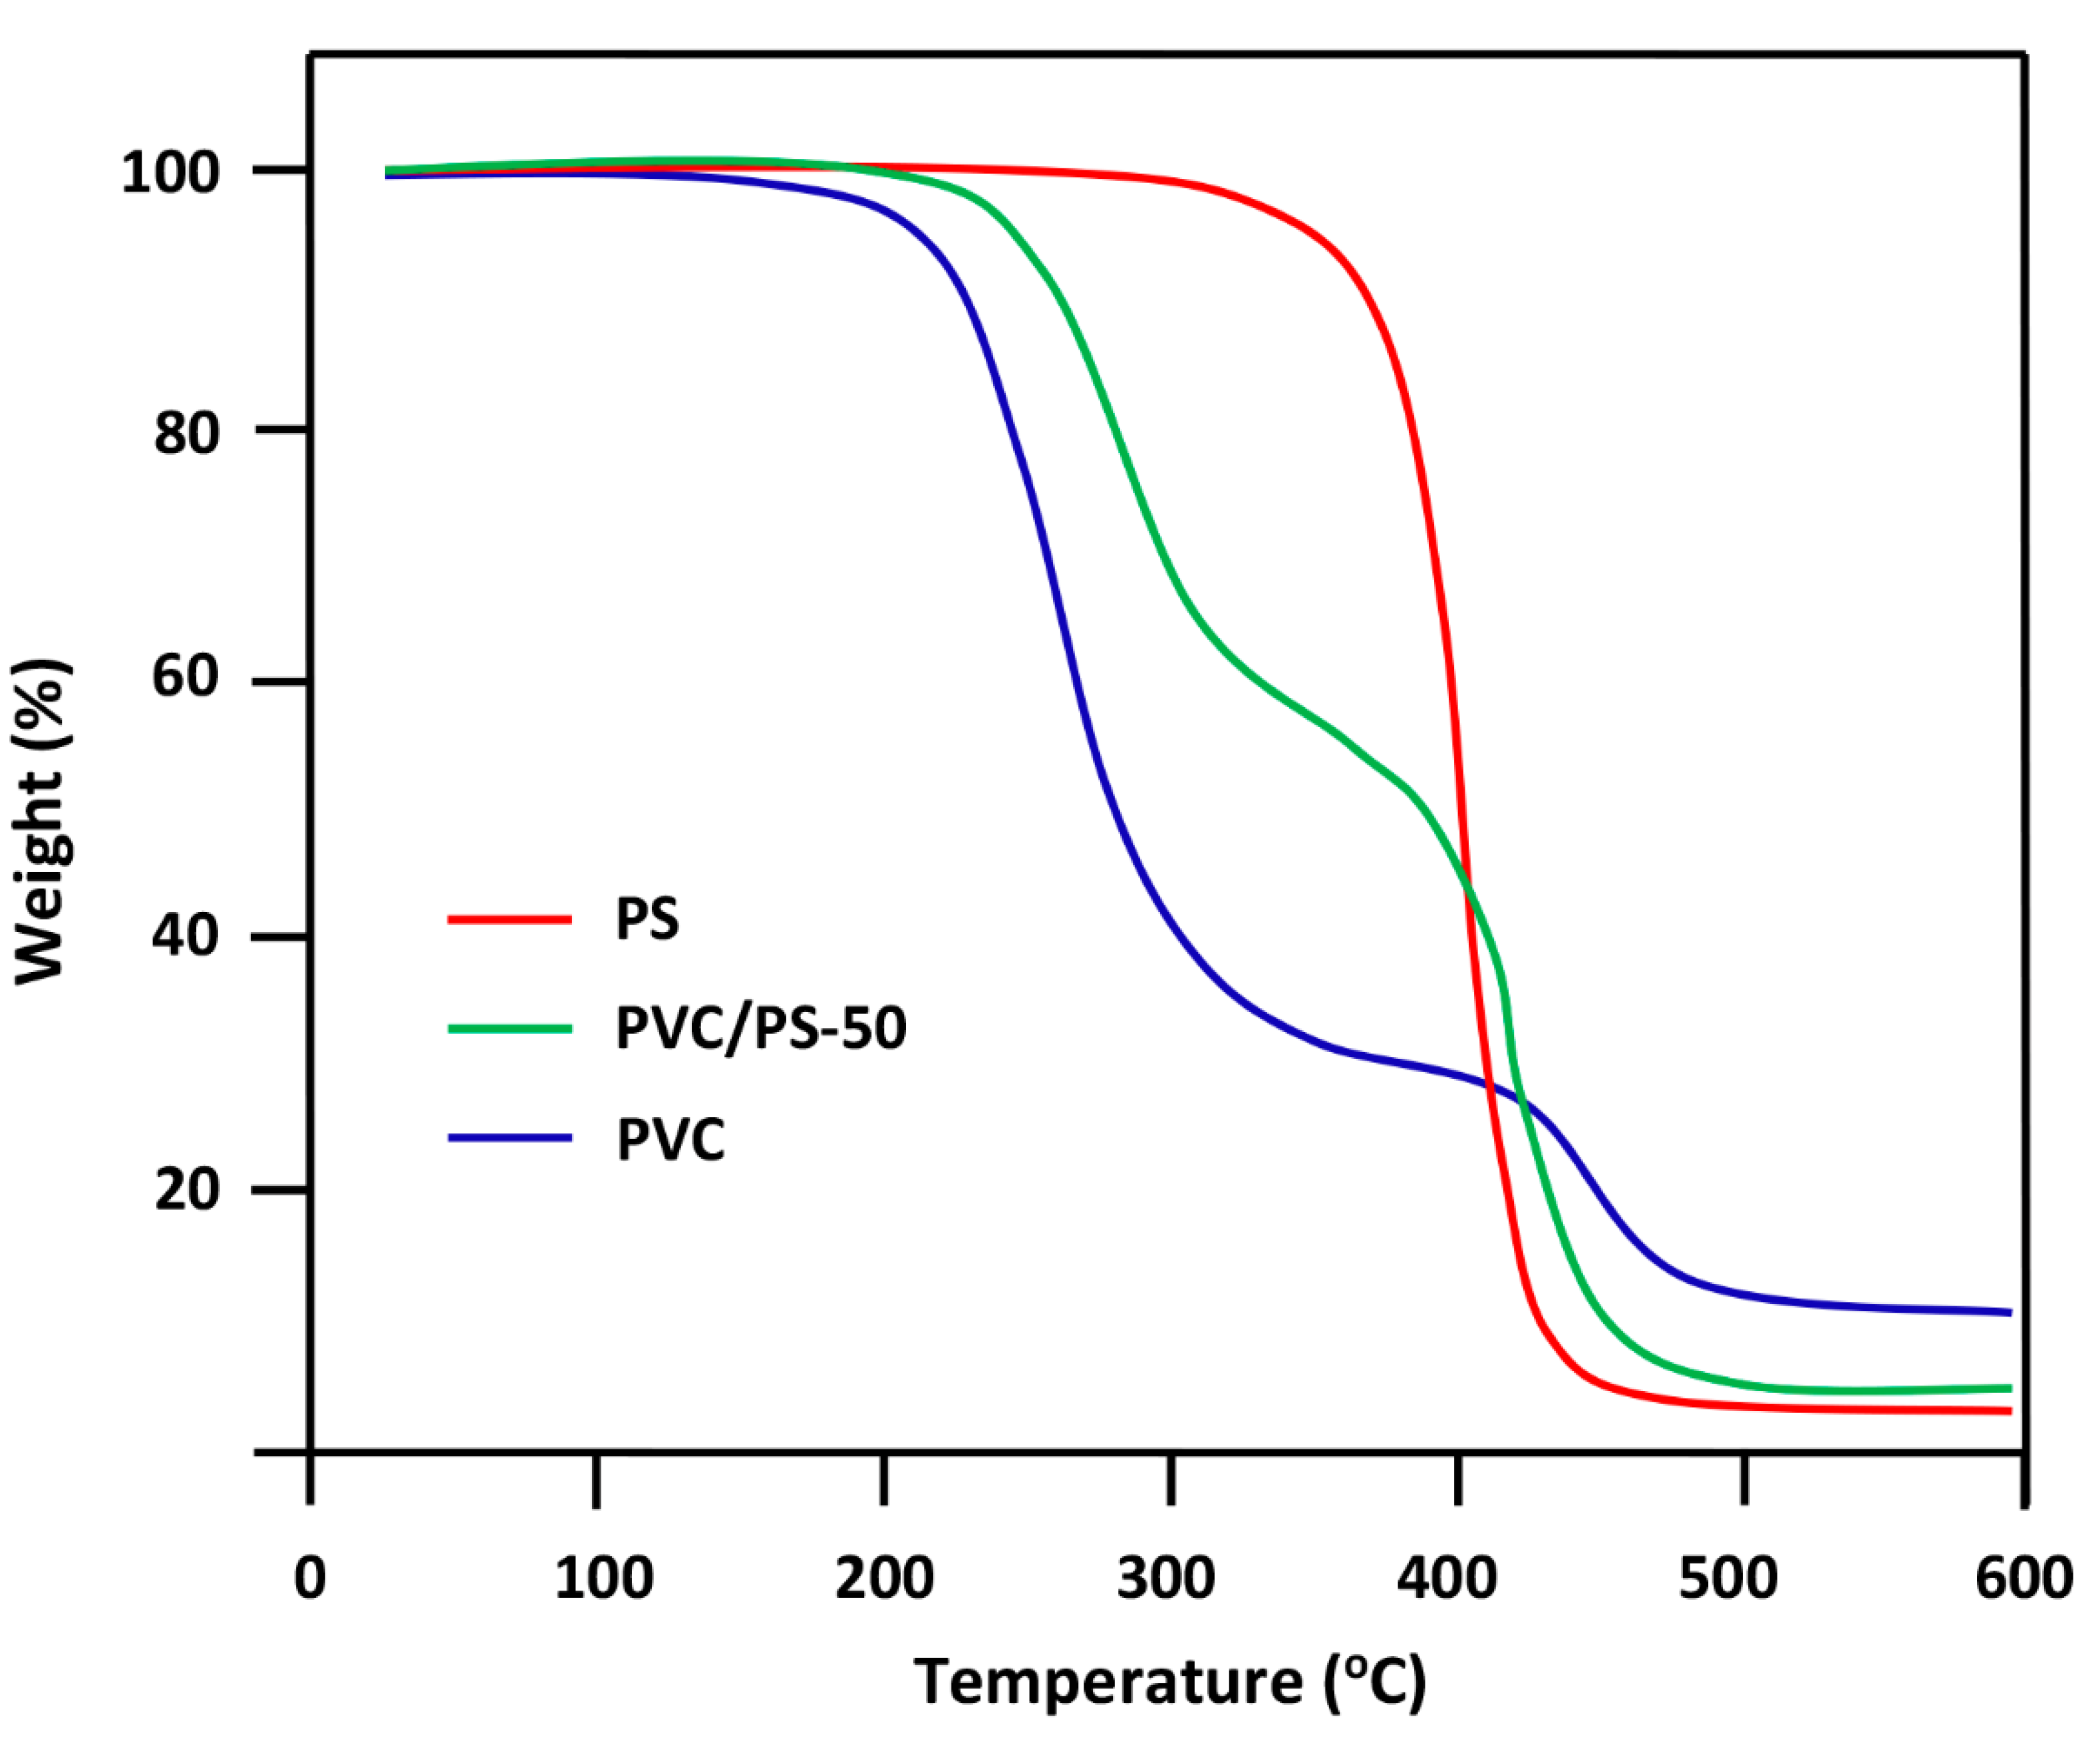
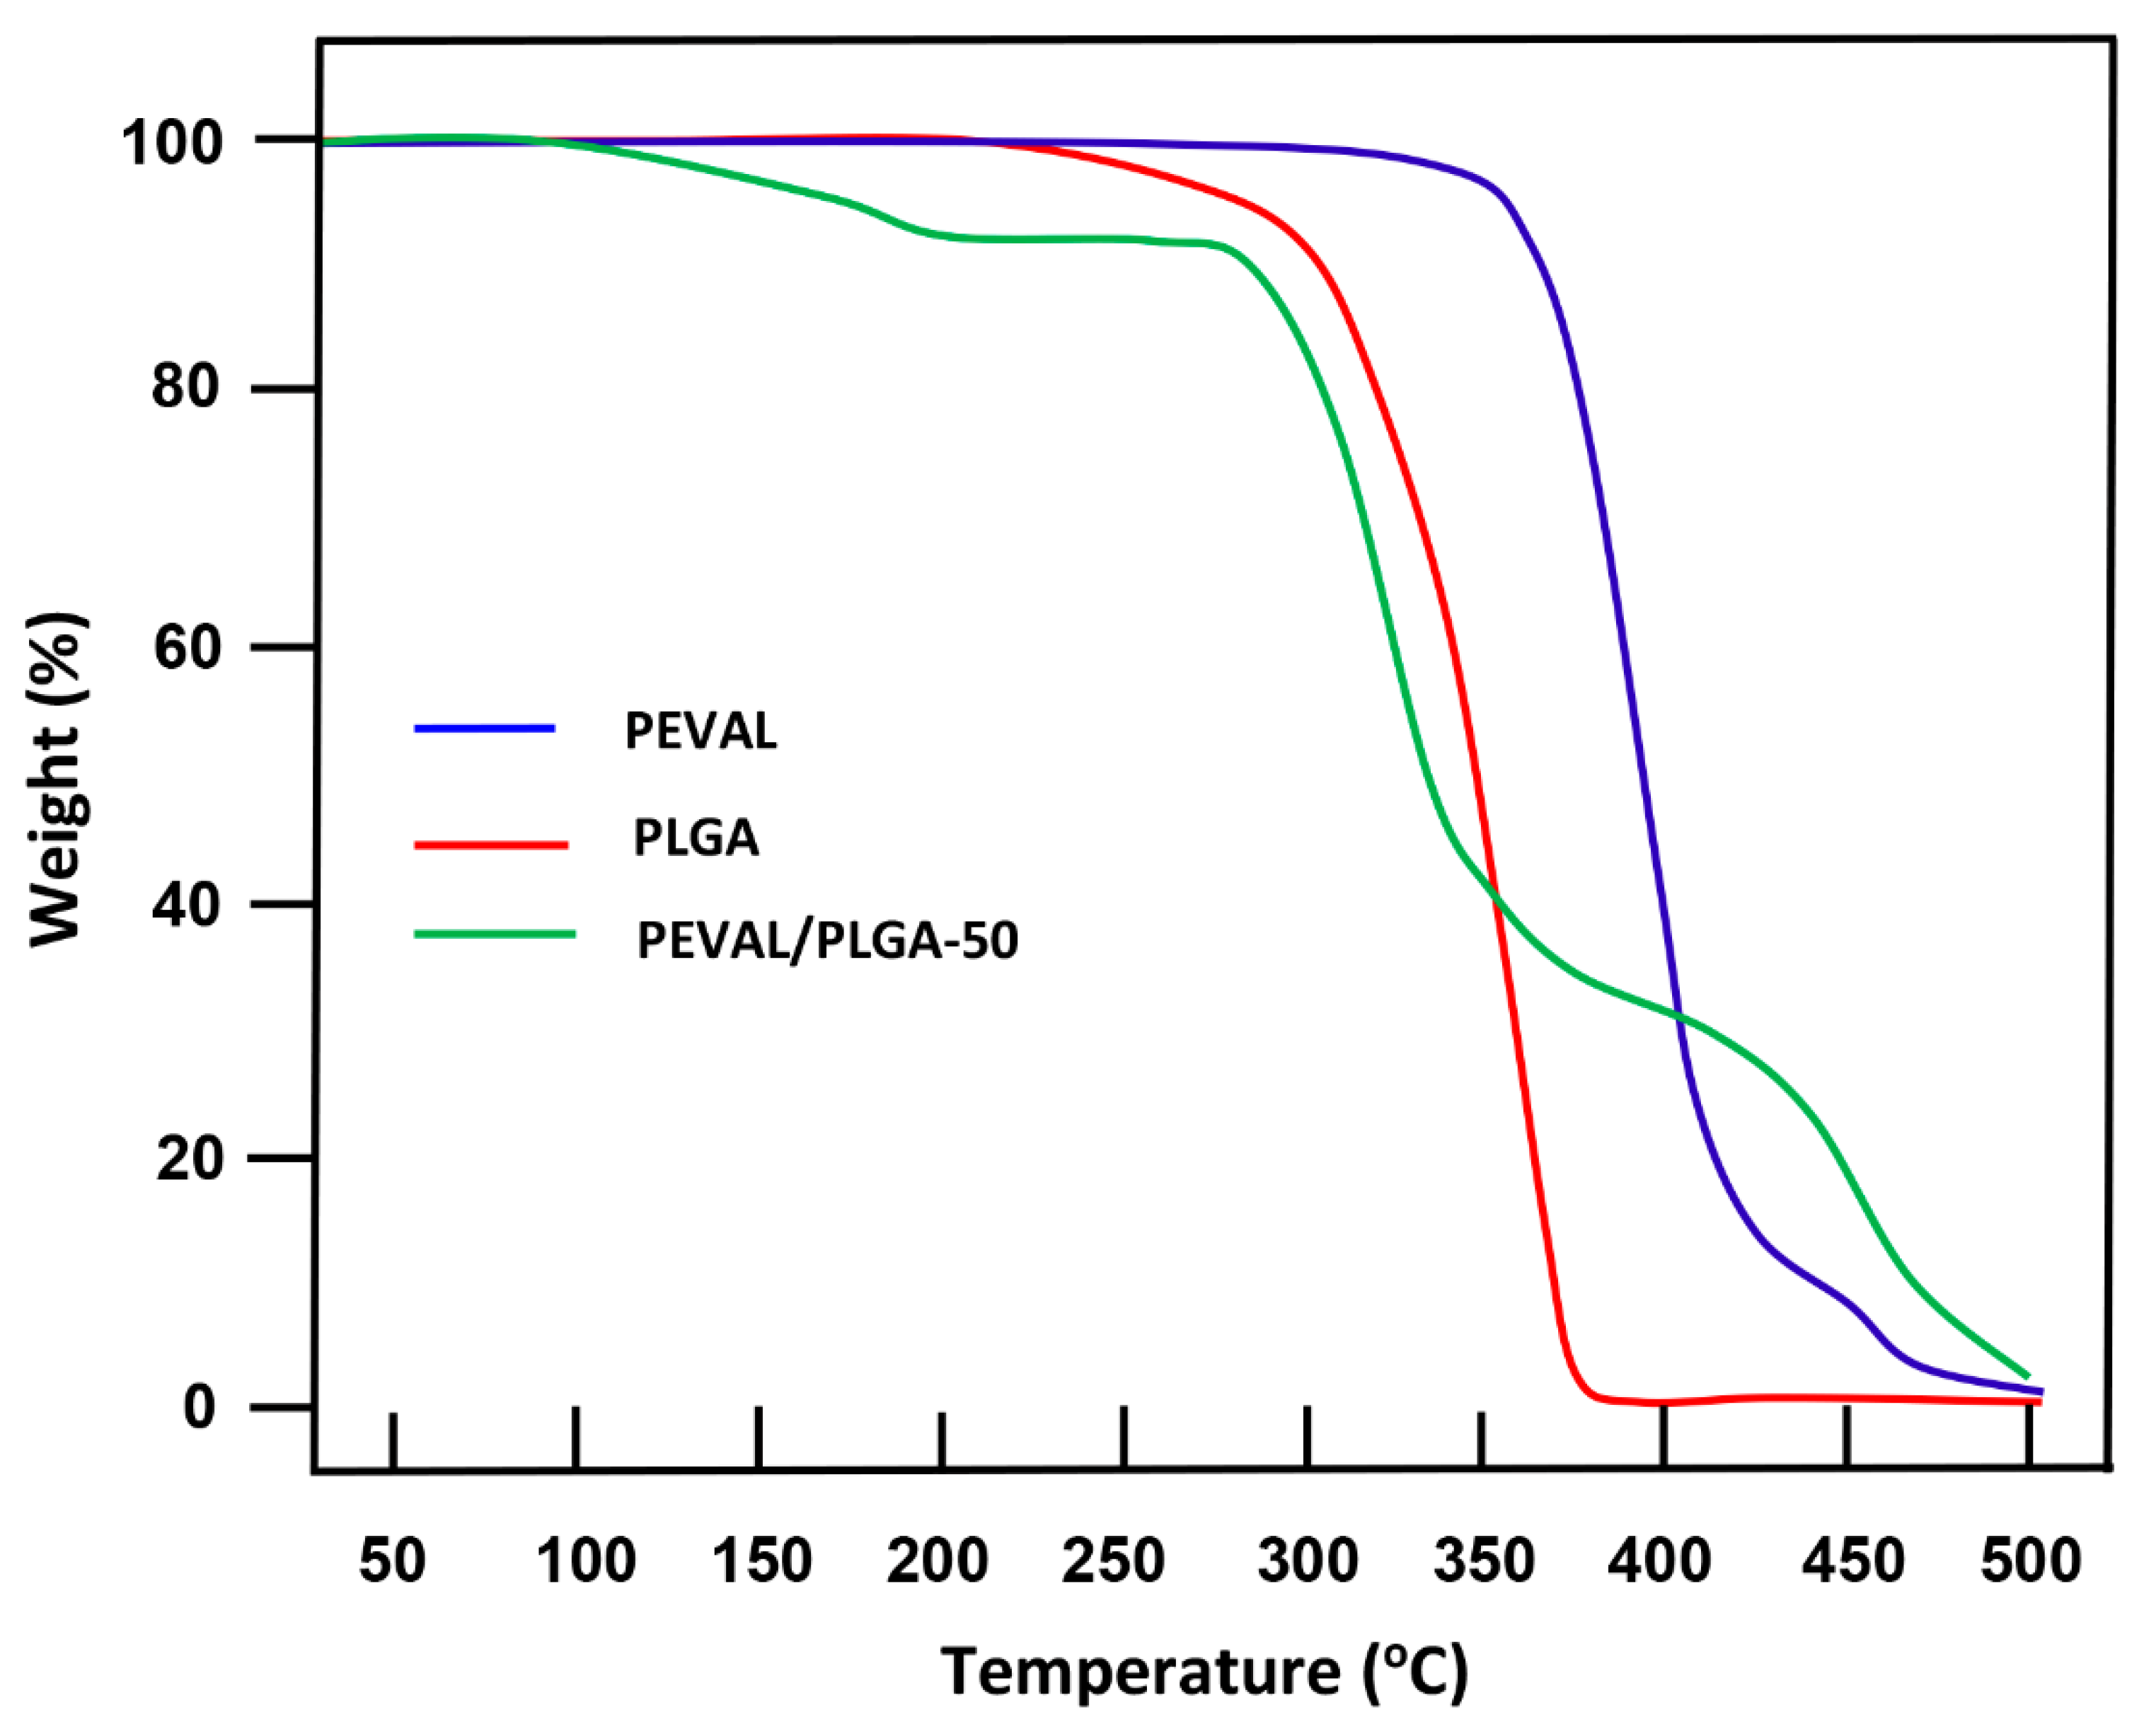
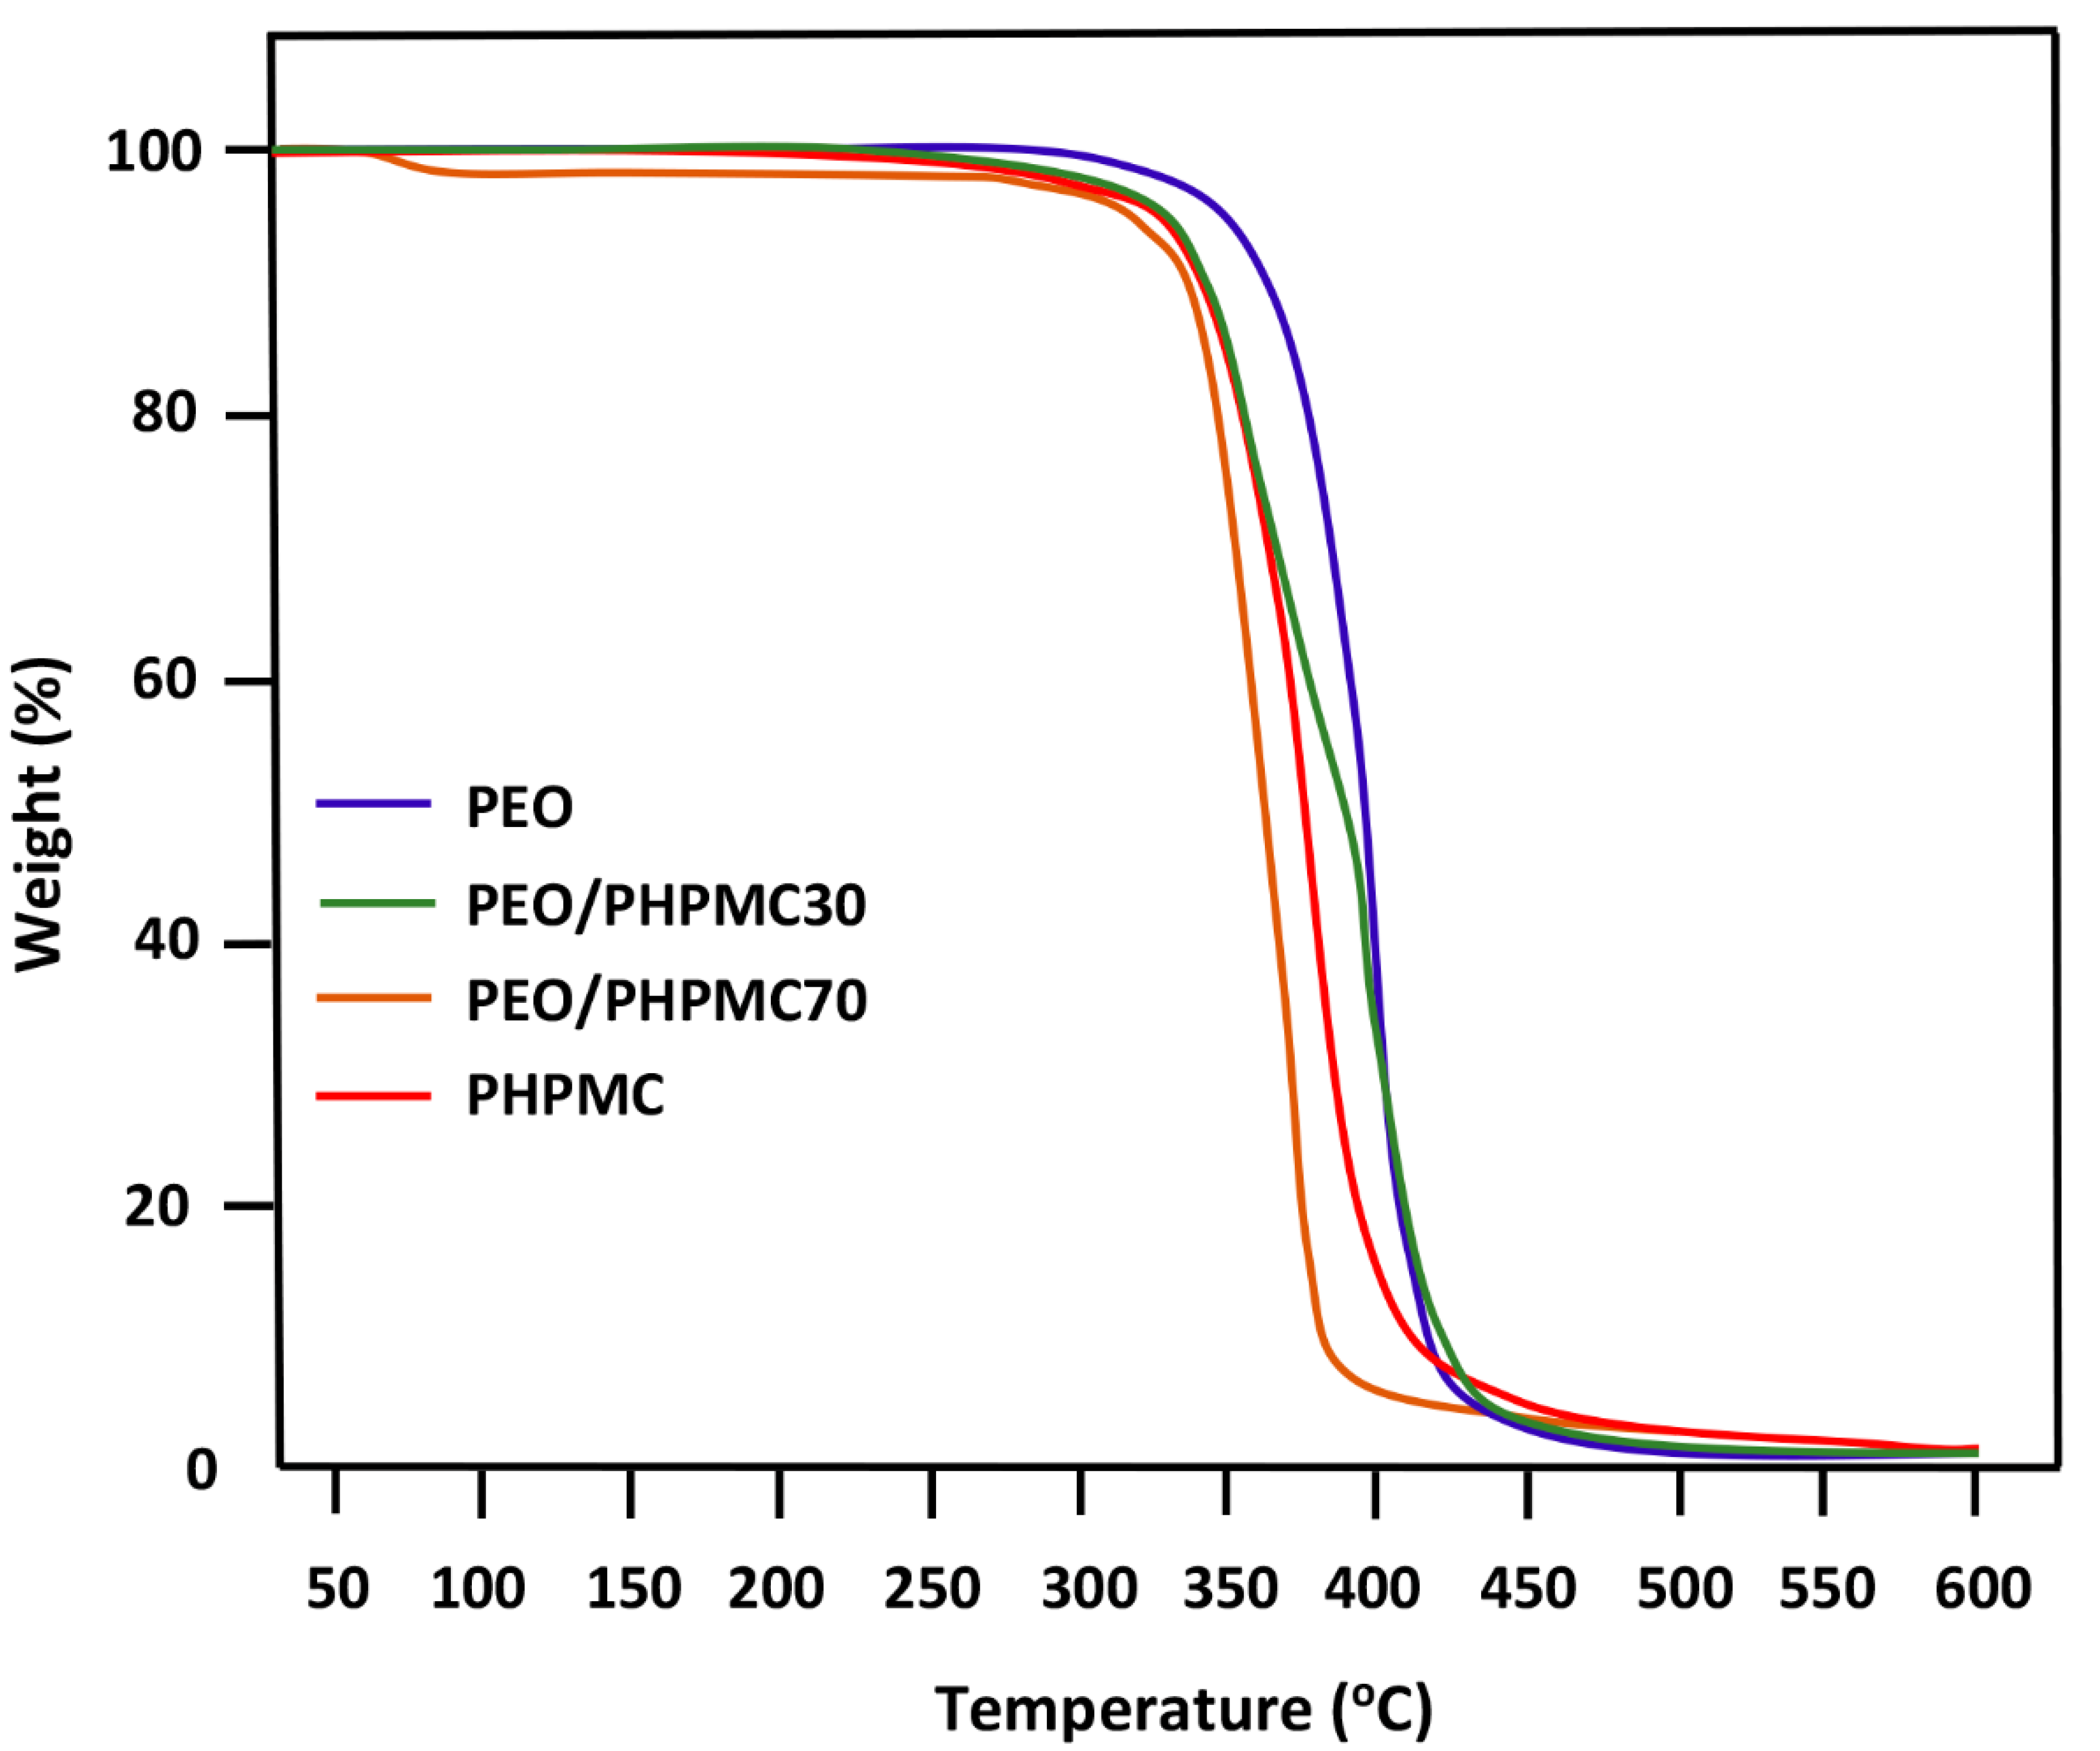
3.2. TGA
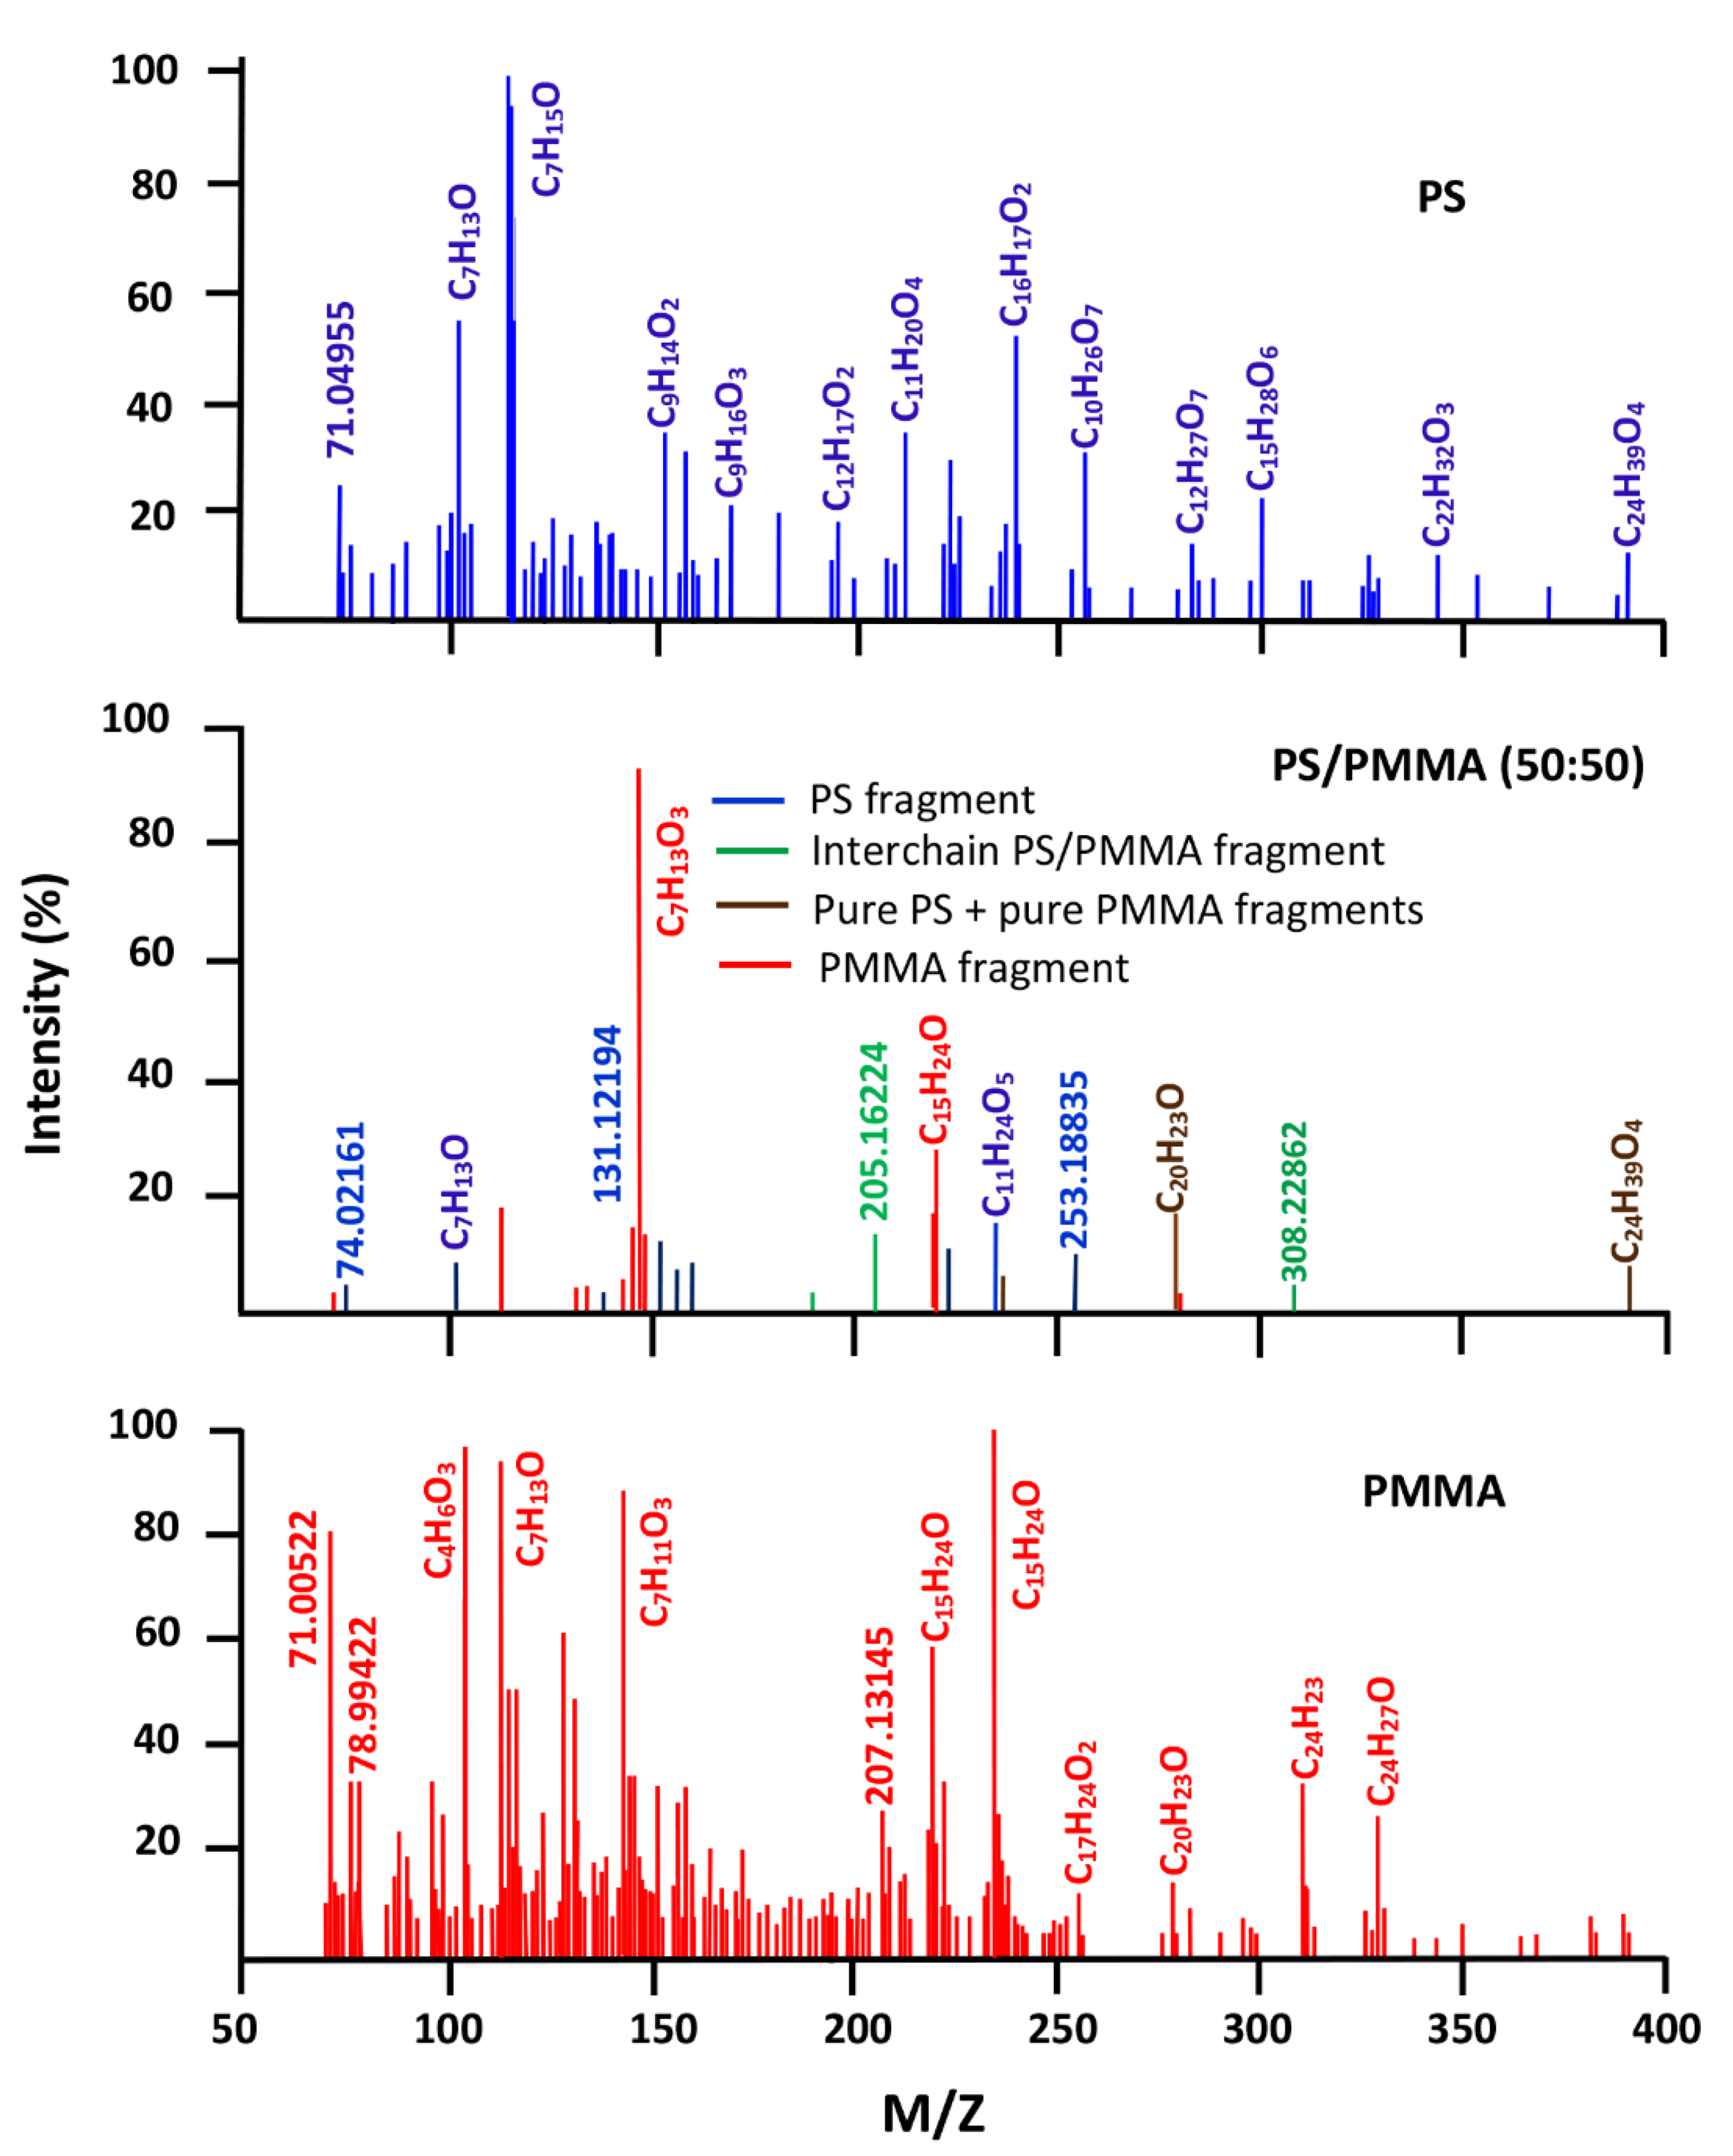
3.3. DART-ToF-MS
4. Conclusions
Author Contributions
Funding
Institutional Review Board Statement
Informed Consent Statement
Data Availability Statement
Acknowledgments
Conflicts of Interest
References
- Mehrabi Mazidi, M.; Edalat, A.; Berahman, R.; Hosseini, F.S. Highly-toughened polylactide-(PLA-) based ternary blends with significantly enhanced glass transition and melt strength: Tailoring the interfacial interactions, phase morphology, and performance. Macromolecules 2018, 51, 4298–4314. [Google Scholar] [CrossRef]
- Lai, W.C.; Liau, W.B. Study of the miscibility and crystallization behavior of poly (ethylene oxide)/poly (vinyl alcohol) blends. J. Appl. Polym. Sci. 2004, 92, 1562–1568. [Google Scholar] [CrossRef]
- Alghamdi, A.A.; Alattas, H.; Saeed, W.S.; Al-Odayni, A.-B.; Ahmed, A.Y.B.H.; Al-Owais, A.A.; Aouak, T. Thermal properties, isothermal decomposition by direct analysis in real-time-of-flight mass spectrometry and non isothermal crystallization kinetics of poly (ethylene-co-vinyl alcohol)/poly (ε-caprolactone) blend. Crystals 2021, 11, 292. [Google Scholar] [CrossRef]
- Nakamura, Y.; Kariya, E.; Fukuda, T.; Fujii, S.; Fujiwara, K.; Hikasa, S. Glass transition behaviour of PMMA/PVA incompatible blend. Polym. Polym. Compos. 2013, 21, 367–376. [Google Scholar] [CrossRef]
- Deshpande, V.; Singh, U. Correlating miscibility of PVC/PMMA blend with polymer chain orientation. J. Appl. Polym. Sci. 2006, 101, 624–630. [Google Scholar] [CrossRef]
- Gupta, A.K.; Sah, G.K. Miscibility studies of PC/PMMA blends in tetrahydrofuran by viscometry, FTIR and SEM analysis. Нанoсистемы физика Химия Математика 2013, 4, 670–679. [Google Scholar]
- Krishna Kishore, G.; Sandeep, N.C. Miscibility of polymethyl methacrylate / polyether sulfone blend by viscisoty, ultrasonic velocity and polarized optical microscopic methods. Int. J. Appl. Eng. Res. 2018, 13, 16085–16087. [Google Scholar]
- Rajulu, A.V.; Reddy, R.L. Miscibility studies of polycarbonate/poly (methyl methacrylate) and polycarbonate/polystyrene blends as measured by viscosity, ultrasonic, and refractive index methods. Int. J. Polym. Anal. Charact. 2000, 5, 467–473. [Google Scholar] [CrossRef]
- Schurer, J.; De Boer, A.; Challa, G. Influence of tacticity of poly (methyl methacrylate) on the compatibility with poly (vinyl chloride). Polymer 1975, 16, 201–204. [Google Scholar] [CrossRef]
- Belhaneche-Bensemra, N.; Bedda, A. Analyse de la relations structure-proprietes des melanges PVC-PMMA. Ann. Chim. Sci. Matériaux 2001, 26, 79–90. [Google Scholar] [CrossRef]
- Belhaneche-Bensemra, N.; Belaabed, B.; Bedda, A. Study of the miscibility and the thermal degradation of PVC/PMMA blends. In Macromolecular Symposia; WILEY-VCH Verlag GmbH: Weinheim, Germany, 2002; pp. 203–216. [Google Scholar]
- Belhaneche-Bensemra, N.; Bedda, A.; Belaabed, B. Study of the properties of rigid and plasticized PVC/PMMA blends. In Macromolecular Symposia; WILEY-VCH Verlag GmbH: Weinheim, Germany, 2003; Volume 202, pp. 151–166. [Google Scholar]
- Aouachria, K.; Belhaneche-Bensemra, N. Miscibility of PVC/PMMA blends by vicat softening temperature, viscometry, DSC and FTIR analysis. Polym. Test. 2006, 25, 1101–1108. [Google Scholar] [CrossRef]
- Khan, M.S.; Qazi, R.A.; Wahid, M.S. Miscibility studies of PVC/PMMA and PS/PMMA blends by dilute solution viscometry and FTIR. Afr. J. Pure Appl. Chem. 2008, 2, 041–045. [Google Scholar]
- Aseeri, J.; Alandis, N.M.; Mekhamer, W.; Alam, M. Miscibility studies of polystyrene/polyvinyl chloride blend in presence of organoclay. Open Chem. 2019, 17, 927–935. [Google Scholar] [CrossRef]
- Zhu, P.; Yang, H.; Zeng, Y. Viscosity behavior of incompatible poly (vinyl chloride)(PVC)/polystyrene (PS) blends in various solvents. Eur. Polym. J. 1999, 35, 915–921. [Google Scholar]
- İmren, D. Compatibilization of immiscible poly (vinyl chloride)(PVC)/polystyrene (PS) blends with maleic anhydride–styrene–vinyl acetate terpolymer (MAStVA). J. Mol. Struct. 2010, 963, 245–249. [Google Scholar] [CrossRef]
- Cakar, F.; Sakar, D.; Cankurtaran, O.; Karaman, F. The evaluation of miscibility of blends of poly (ether imide)(Ultem® 1000) and a copolyester of bisphenol-A with terephthalic and isophthalic acid (Ardel® D-100) by viscosimetry. Eur. Polym. J. 2007, 43, 507–513. [Google Scholar] [CrossRef]
- Aouak, T.; Alghamdi, A.A.; Alrashdi, A.A.; Ouladsmane, M.; Alam, M.M.; AlOthman, Z.; Naushad, M. Miscibility enhancement of poly (vinyl chloride)/polystyrene blend: Application to membrane separation of benzene from benzene/cyclohexane mixture by pervaporation. Sep. Sci. Technol. 2016, 51, 2440–2454. [Google Scholar] [CrossRef]
- Mathur, V.; Dixit, M.; Saxena, N.; Sharma, K. Morphological effects on mechanical properties of polystyrene-polyvinylchloride blends. Phase Transit. 2009, 82, 769–779. [Google Scholar] [CrossRef]
- Hellmann, G.; Dietz, M.; Fischer, M. The architecture of compatibilizing copolymers in blends. J. Macromol. Sci. Part B Phys. 1996, 35, 477–488. [Google Scholar] [CrossRef]
- Aquino, K.A.d.S.; da Silva, F.F.; Araujo, E.S. Investigation of poly (vinyl chloride)/polystyrene mixture miscibility: Comparison of viscometry criteria with fourier transform infrared spectroscopy and refractive index measurements. J. Appl. Polym. Sci. 2011, 119, 2770–2777. [Google Scholar] [CrossRef]
- Basavaraju, K.; Damappa, T.; Rai, S. Miscibility Studies of Hydroxy Propyl Methyl Cellulose and Poly (ethylene oxide) by Viscometry, Ultrasonic, and Refractometric Methods. J. Macromol. Sci. Part B Phys. 2008, 47, 417–425. [Google Scholar] [CrossRef]
- Sudharsan Reddy, K.; Prabhakar, M.; Kumara Babu, P.; Venkatesulu, G.; Rao, K.; Sajan, U.; Chowdoji Rao, K.; Subha, M. Miscibility studies of hydroxypropyl cellulose/poly (ethylene glycol) in dilute solutions and solid state. J. Macromol. Sci. Part B Phys. 2008, 47, 417–425. [Google Scholar] [CrossRef] [Green Version]
- dos Santos, W.N.; De Sousa, J.; Gregorio, R., Jr. Thermal conductivity behaviour of polymers around glass transition and crystalline melting temperatures. Polym. Test. 2013, 32, 987–994. [Google Scholar] [CrossRef] [Green Version]
- Worzakowska, M. Thermal and mechanical properties of polystyrene modified with esters derivatives of 3-phenylprop-2-en-1-ol. J. Therm. Anal. Calorim. 2015, 121, 235–243. [Google Scholar] [CrossRef] [Green Version]
- Chuai, C.; Almdal, K.; Lyngaae-Jørgensen, J. Thermal behavior and properties of polystyrene/poly (methyl methacrylate) blends. J. Appl. Polym. Sci. 2004, 91, 609–620. [Google Scholar] [CrossRef]
- Zhong, Z.; Zheng, S.; Yang, K.; Guo, Q. Miscibility, phase behavior, and mechanical properties of ternary blends of poly (vinyl chloride)/polystyrene/chlorinated polyethylene-graft-polystyrene. J. Appl. Polym. Sci. 1998, 69, 995–1003. [Google Scholar] [CrossRef]
- Krigbaum, W.R.; Wall, F.T. Viscosities of binary polymeric mixtures. J. Polym. Sci. 1950, 5, 505–514. [Google Scholar] [CrossRef]
- Chee, K. Determination of polymer-polymer miscibility by viscometry. Eur. Polym. J. 1990, 26, 423–426. [Google Scholar] [CrossRef]
- García, R.; Melad, O.; Gomez, C.; Figueruelo, J.; Campos, A. Viscometric study on the compatibility of polymer–polymer mixtures in solution. Eur. Polym. J. 1999, 35, 47–55. [Google Scholar] [CrossRef]
- Saeed, W.S.; Al-Odayni, A.-B.; Ali Alghamdi, A.; Abdulaziz Al-Owais, A.; Semlali, A.; Aouak, T. Miscibility of Poly (Ethylene-co-Vinylalcohol)/Poly (δ-Valerolactone) Blend and Tissue Engineering Scaffold Fabrication Using Naphthalene as Porogen. Polym.-Plast. Technol. Mater. 2019, 58, 1–23. [Google Scholar] [CrossRef]
- Polaskova, M.; Peer, P.; Cermak, R.; Ponizil, P. Effect of thermal treatment on crystallinity of poly (ethylene oxide) electrospun fibers. Polymers 2019, 11, 1384. [Google Scholar] [CrossRef] [PubMed] [Green Version]
- Ford, J.L. Thermal analysis of hydroxypropylmethylcellulose and methylcellulose: Powders, gels and matrix tablets. Int. J. Pharm. 1999, 179, 209–228. [Google Scholar] [CrossRef]
- Fuller, C.; MacRae, R.; Walther, M.; Cameron, R. Interactions in poly (ethylene oxide)–hydroxypropyl methylcellulose blends. Polymer 2001, 42, 9583–9592. [Google Scholar] [CrossRef]
- Nishi, T.; Wang, T. Melting point depression and kinetic effects of cooling on crystallization in poly (vinylidene fluoride)-poly (methyl methacrylate) mixtures. Macromolecules 1975, 8, 909–915. [Google Scholar] [CrossRef]
- Kaniappan, K.; Latha, S. Certain investigations on the formulation and characterization of polystyrene/poly (methyl methacrylate) blends. Int. J. Chem. Tech. Res. 2011, 3, 708–717. [Google Scholar]
- Senna, M.M.; Hussein, Y.A.; Abdel-Moneam, Y.K. Thermal and mechanical properties of electron beam irradiated poly (vinyl chloride)/polystyrene blends. Polym. Compos. 2008, 29, 1049–1056. [Google Scholar] [CrossRef]
- Yao, Q.; Wilkie, C.A. Thermal degradation of PVC in the presence of polystyrene. J. Vinyl Addit. Technol. 2001, 7, 26–36. [Google Scholar] [CrossRef]
- Lee, D.W. Thermal Degradation of Polymer Blends Containing Poly (Vinyl Chloride). Master’s Thesis, Rochester Institute of Technology, Rochester, NY, USA, 1987. [Google Scholar]
- Dodson, B.; McNeill, I. Degradation of polymer mixtures. VI. Blends of poly (vinyl chloride) with polystyrene. J. Polym. Sci. Polym. Chem. Ed. 1976, 14, 353–364. [Google Scholar] [CrossRef]
- McNeill, I.; Ackerman, L.; Gupta, S. Degradation of polymer mixtures. IX. Blends of polystyrene with polybutadiene. J. Polym. Sci. Polym. Chem. Ed. 1978, 16, 2169–2181. [Google Scholar] [CrossRef]
- Alvarez, V.; Ruseckaite, R.; Vázquez, A. Kinetic analysis of thermal degradation in poly (ethylene–vinyl alcohol) copolymers. J. Appl. Polym. Sci. 2003, 90, 3157–3163. [Google Scholar] [CrossRef]
- Holland, B.; Hay, J. The thermal degradation of poly (vinyl alcohol). Polymer 2001, 42, 6775–6783. [Google Scholar] [CrossRef]
- Sivalingam, G.; Madras, G. Thermal degradation of binary physical mixtures and copolymers of poly (ε-caprolactone), poly (d, l-lactide), poly (glycolide). Polym. Degrad. Stab. 2004, 84, 393–398. [Google Scholar] [CrossRef]
- Swamy, T.; Lee, J.H. Miscibility Behaviour of Polyethylene Oxide/Hydroxypropyl Methyl Cellulose Blends. Adv. Mater. Res. 2008, 47–50, 234–237. [Google Scholar] [CrossRef]
- Akpan, N. Compatibility Study of Polystyrene and Poly Methyl-methacrylate Blends using FTIR and Viscometry Methods. Commun. Phys. Sci. 2019, 4, 81–86. [Google Scholar]


| System | Tg (°C) | System | Tg (°C) |
|---|---|---|---|
| PS | 96 | PEVAL | 51 |
| PMMA | 112 | PLGA | 36 |
| PS/PMMA-50 | 86–103 | PEVAL/PLGA-50 | 41 |
| PVC | 85 | PEO | −55 |
| PS/PVC-50 | 86–103 | PHPMC | 178 |
| PVC/PMMA-50 | 84–118 | PEO/PHPMC-30 | - |
| - | - | PEO/PHPMC-70 | 24 |
Publisher’s Note: MDPI stays neutral with regard to jurisdictional claims in published maps and institutional affiliations. |
© 2022 by the authors. Licensee MDPI, Basel, Switzerland. This article is an open access article distributed under the terms and conditions of the Creative Commons Attribution (CC BY) license (https://creativecommons.org/licenses/by/4.0/).
Share and Cite
AlShehri, M.M.; ALOthman, Z.A.; Bedjah Hadj Ahmed, A.Y.; Aouak, T. New Method Based on Direct Analysis in Real-Time Coupled with Time-of-Flight Mass Spectrometry (DART-ToF-MS) for Investigation of the Miscibility of Polymer Blends. Polymers 2022, 14, 1644. https://doi.org/10.3390/polym14091644
AlShehri MM, ALOthman ZA, Bedjah Hadj Ahmed AY, Aouak T. New Method Based on Direct Analysis in Real-Time Coupled with Time-of-Flight Mass Spectrometry (DART-ToF-MS) for Investigation of the Miscibility of Polymer Blends. Polymers. 2022; 14(9):1644. https://doi.org/10.3390/polym14091644
Chicago/Turabian StyleAlShehri, Mohammed Mousa, Zeid A. ALOthman, Ahmed Yassine Bedjah Hadj Ahmed, and Taieb Aouak. 2022. "New Method Based on Direct Analysis in Real-Time Coupled with Time-of-Flight Mass Spectrometry (DART-ToF-MS) for Investigation of the Miscibility of Polymer Blends" Polymers 14, no. 9: 1644. https://doi.org/10.3390/polym14091644
APA StyleAlShehri, M. M., ALOthman, Z. A., Bedjah Hadj Ahmed, A. Y., & Aouak, T. (2022). New Method Based on Direct Analysis in Real-Time Coupled with Time-of-Flight Mass Spectrometry (DART-ToF-MS) for Investigation of the Miscibility of Polymer Blends. Polymers, 14(9), 1644. https://doi.org/10.3390/polym14091644